
94% of researchers rate our articles as excellent or good
Learn more about the work of our research integrity team to safeguard the quality of each article we publish.
Find out more
ORIGINAL RESEARCH article
Front. Cell Dev. Biol., 18 October 2022
Sec. Epigenomics and Epigenetics
Volume 10 - 2022 | https://doi.org/10.3389/fcell.2022.945202
This article is part of the Research TopicRNA Modifications and Epitranscriptomics - Volume IIView all 15 articles
N6-methyladenosine (m6A) is the most common reversible epigenetic RNA modification in the mRNA of all higher eukaryotic organisms and plays an important role in the regulation of gene expression and cell function. In this study, m6A-modified methylated RNA immunoprecipitation sequencing (MeRIP-seq) and transcriptome sequencing (RNA-seq) were used to identify the key genes with m6A modification during mammary gland development and lactation in dairy goats. The results showed that m6A methylation occurred at 3,927 loci, which were significantly enriched in the 3′ untranslated region (3′UTR) and the termination codon region. In the early stage and peak stage of lactation, m6A methylation occurred extensively in mammary tissues, and a total of 725 differentially expressed m6A-modified genes were obtained, all negatively correlated with mRNA expression. In addition, Gene Ontology (GO) enrichment and Kyoto Encyclopedia of Genes and Genomes (KEGG) pathway analysis showed that different methylated genes were mainly involved in the growth and apoptosis of mammary epithelial cells through signaling pathways, such as the mitogen-activated protein kinase (MAPK) and phospholipase D pathways, and then affected the development and lactation of mammary gland. All in all, we identified and analyzed the methylation events related to the development and lactation regulation of mammary gland at the early and peak lactation stages, and provided a theoretical basis to reveal the physiological regulatory system of mammary gland development and lactation in dairy goats.
In the 1970s, scientists discovered that m6A modification can occur on RNA adenine (A). Subsequent studies showed that m6A methylation is not the only modification that exists in the mRNA of prokaryotes, eukaryotes, and viruses; more than 150 posttranscriptional modifications have been revealed in the RNA of all organisms (Dubin and Stollar, 1975; Boccaletto et al., 2018). The molecular functions of m6A are diverse but ultimately affect mRNA transcription by regulating splicing, half-life, stability, and translation (Nachtergaele and He, 2018). m6A derivatives mediate the posttranscriptional regulation of gene expression to ensure the precise control of multiple biological processes. Currently, studies on m6A have been conducted in humans, plants, and yeast (Bodi et al., 2015; Wang M et al., 2020; Hu et al., 2021). In mammals, m6A has been investigated in swine, cattle, and cashmere goats (Cao et al., 2020; Wang T et al., 2020; Li et al., 2021). It is mainly involved in the regulation of spermatogenesis, oogenesis, embryonic development, and stem cell pluripotency (Lin et al., 2017; Fan et al., 2019; Ji and Zhang, 2021; Xu et al., 2021).
The mammary gland is one of the unique organs of mammals, which function is to produce and secrete milk to feed offspring (Macias and Hinck, 2012). Its development can be divided into five stages, i.e., embryonic stage, puberty, gestation, lactation, and degeneration, and the developmental process is mainly regulated by hormones, growth factors, and cytokines (Brisken and Ataca, 2015). There are many physiological differences in the mammary gland at different stages of development and lactation. From the early stage to the peak stage of lactation, mammary epithelial cells continue to differentiate, the number of lactating cells increases, lactation activity increases, and the lactation volume gradually increases, reaching a maximum at the peak stage of lactation (Stefanon et al., 2002). Studies on mammary gland development and lactation in dairy goats mostly focus on mRNA (Ji et al., 2019), long noncoding RNAs (lncRNAs) (Ji et al., 2020), and microRNA (Xuan et al., 2020), not on m6A. Therefore, in-depth studies of the key genes, signaling pathways, and their regulatory mechanisms in the development of mammary glands in dairy goats are of great value.
The aim of this study was to explore differentially expressed m6A-methylated genes in the mammary gland tissues of Laoshan dairy goats during the early and peak lactation stages through methylated RNA immunoprecipitation sequencing (MeRIP-Seq) and to analyze the mechanism of regulation of the development and lactation of mammary gland tissue in the early and peak lactation stages in dairy goats. This study is expected to provide a theoretical basis for the molecular breeding of Laoshan dairy goats.
The three Laoshan dairy goats used in this study were all from the Qingdao Laoshan dairy goat breeding farm. Mammary gland tissue was collected by surgical procedure after general anesthesia during the early lactation period (postpartum 20 days) and the peak lactation period (postpartum 90 days),respectively. The dairy goats used in the experiment were randomly selected from the group, all healthy, non-inbred individuals, 2 years old, first parity, and similar birth date, weight, and lambing, they were uniformly managed and fed. All experimental animal/procedures were treated/performed in accordance with the guidelines of the Experimental Animal Management Committee of Shandong Agricultural University. Every effort was made to reduce animal suffering during the experiments.
Total RNA was extracted using a Trizol kit (Invitrogen, United States). The integrity of the RNA samples was evaluated using an Agilent 2100 B bioanalyzer (Agilent Technologies, United States). A Nano Photometer spectrophotometer was used to analyze DNA contamination. A Qubit 2.0 fluorometer was used to accurately quantify the RNA concentration used to construct the sequencing library. RNase-free agarose gel electrophoresis was used for visualization.
Eukaryotic mRNA from the extracted total RNA was enriched using Oligo (dT) beads, and a Ribo-Zero™ Magnetic Kit (Epicentre, United States) was used to remove rRNA and enrich prokaryotic mRNA. Then, the enriched mRNA fragments were broken into short fragments using fragment buffer, and the RNA was broken into two samples, one of which was used as the input control. The transcriptome sequencing library was constructed to eliminate noise during the capture of methylated fragments. 10 ug total RNA from each sample was enriched respectively with an m6A-specific antibody for the library construction; after the m6A-modified RNA was captured, the antibody was eluted with magnetic beads to reduce the background noise from nonspecific binding, and the ligation product was subjected to agarose gel electrophoresis, PCR amplification and Illumina Novaseq6000 sequencing. All sequencing work was performed by Gene Denovo Biotechnology Co. Ltd. (Guangzhou, China).
The raw reads obtained from the sequencing included adaptors and low-quality reads. fastp (version 0.18.0) was used to obtain high-quality pure reads (Chen et al., 2018). The specific procedure was as follows: 1) reads containing adaptors were removed; 2) reads containing more than 10% unknown nucleotides (N) were removed; and 3) reads containing more than 50% of low-quality bases (q value ≤20) were removed. HISAT 2.2.4 (Kim et al., 2015) was used to compare the clean data with the reference genome. The matched reads were assembled into transcripts using StringTie v1.3.1 (Pertea et al., 2015; Pertea et al., 2016). For each transcript, RSEM (Li and Dewey, 2011) was used to calculate the FPKM value (fragments per kilobase of transcript per million mapped reads) to quantify expression abundance and change.
The raw image data obtained by sequencing were converted into sequence data via base calling, which is called raw data and stored in FASTQ file format. To ensure data quality, quality control was performed on the original data to reduce the noise through data filtering and obtain high-quality clean reads for subsequent analysis. HISAT was used to align the clean reads with the reference genome of Capra hircus (version: GCF_001704415.1_ARS1) with default parameters for subsequent analysis. ExomePeak2 (version: 1.0.0) (Meng et al., 2014) was used to perform peak calling in the whole genome, and the threshold was p < 0.05. The position information for peaks (RNA regions and sites where m6A modification occurs) in the genome, and sequence information for peak regions, were analyzed to screen out peak-related genes. RNA methylation rate = RPM (MeRIP)/RPM (input) was used to calculate the relative methylation rate of each peak, and then exomePeak2 (Meng et al., 2014) was used for differential analysis of the RNA methylation rate for all peaks in the IP group. FDR<0.05 and |log2FC|>1 (Wang Y et al., 2020) were used to screen differential peaks and perform Gene Ontology (GO) enrichment and Kyoto Encyclopedia of Genes and Genomes (KEGG) functional enrichment analysis of differentially expressed peak-related genes.
To comprehensively compare the relationship between m6A methylation level and gene expression abundance, correlation analysis was performed for m6A-seq and RNA-seq data. The peak-related genes were sorted on the basis of their expression levels and divided into 20 equal parts, and the proportion of peak in each part was analyzed. The correlation between expression level and peak enrichment fold change was analyzed using the basic functions of the R package to create a scatter plot of the gene expression-peak enrichment fold change, and the number of genes shared between differentially expressed genes (DEGs) in the transcriptome and differentially methylated genes (DMGs) identified via MeRIP-seq were analyzed to find potential inter-omics linked genes. The fold difference was used as the dividing standard to draw a nine-quadrant map to analyze the coregulatory relationship among common DEGs. The default threshold for screening DEGs was |log2FC|>1 (Wang Y et al., 2020). The coregulated genes obtained from the nine-quadrant map were used for subsequent GO and KEGG enrichment analysis to investigate the function of m6A-modified mRNA.
GO (Ashburner et al., 2000) is an internationally standardized gene function classification system that maps DEGs to various terms in the GO database (http://www.geneontology.org/). The number of genes for each term was calculated, and the number of genes with a certain GO function (molecular function, cellular composition, and biological process) were counted. The hypergeometric test was used to find the GO entries that were significantly enriched in the DEGs against the entire reference gene. The p value is calculated using the following formula:
Where N is the number of genes with a GO annotation; n is the number of DEGs in N; M is the number of genes annotated as a specific GO term; and m is the number of DEGs annotated to a specific GO term. After the calculated p value underwent Bonferroni correction, the corrected-p ≤ 0.05 was used as the threshold to obtain GO terms that were significantly enriched in the DEGs. The main biological functions of DEGs were determined by GO functional significance enrichment analysis.
KEGG (Kanehisa and Goto, 2000) is the main public database for pathways. Pathway significance enrichment analysis was performed using KEGG pathways as the unit, and a hypergeometric test was used to identify pathways that were significantly enriched in DEGs. The calculation formula for the p value is the same as that for the p value of the GO functional significance enrichment analysis, where N is the number of genes with a pathway annotation; n is the number of DEGs in N; M is the number of genes annotated as a specific pathway; and m is the number of DEGs annotated as a specific pathway. Pathways with a Q ≤ 0.05 were defined as pathways that were significantly enriched in differentially expressed proteins.
Genes related to mammary gland development and lactation were selected based on the GO and KEGG annotation results, and gene regulatory networks were constructed using Scytoscape v3.9.1 software (Shannon et al., 2003) and the STRING database (Version 11.5).
In this study, MeRIP-seq was used to identify the m6A data (IP) and corresponding mRNA data (input, IN) for m6A methylation in dairy goats at the early stage (E-stage, postpartum 20 days) and peak stage (P-stage, postpartum 90 days) of lactation. In the RNA-seq library, 166,972,650 and 160,794,082 raw reads were obtained from the three mammary gland samples in the early and peak stages, of which 165,695,678 and 159,511,700 were clean reads, accounting for 99.24% and 99.2% of the reads, respectively. The Q20% values for the early and peak stages were 97.32% and 97.40% respectively, and the Q30% values were 92.22% and 92.37%, respectively. In the MeRIP-seq library, 15,634,516 and 140,106,744 raw reads were obtained for mammary gland samples from the early and peak stages, of which 152,341,796 and 137,170,868 were clean reads, accounting for 97.44% and 97.9% of the reads, respectively. The Q20% values for the early and peak stages were 92.62% and 93.35%, respectively, and the Q30% values were 86.05% and 87.09%, respectively (Table 1).
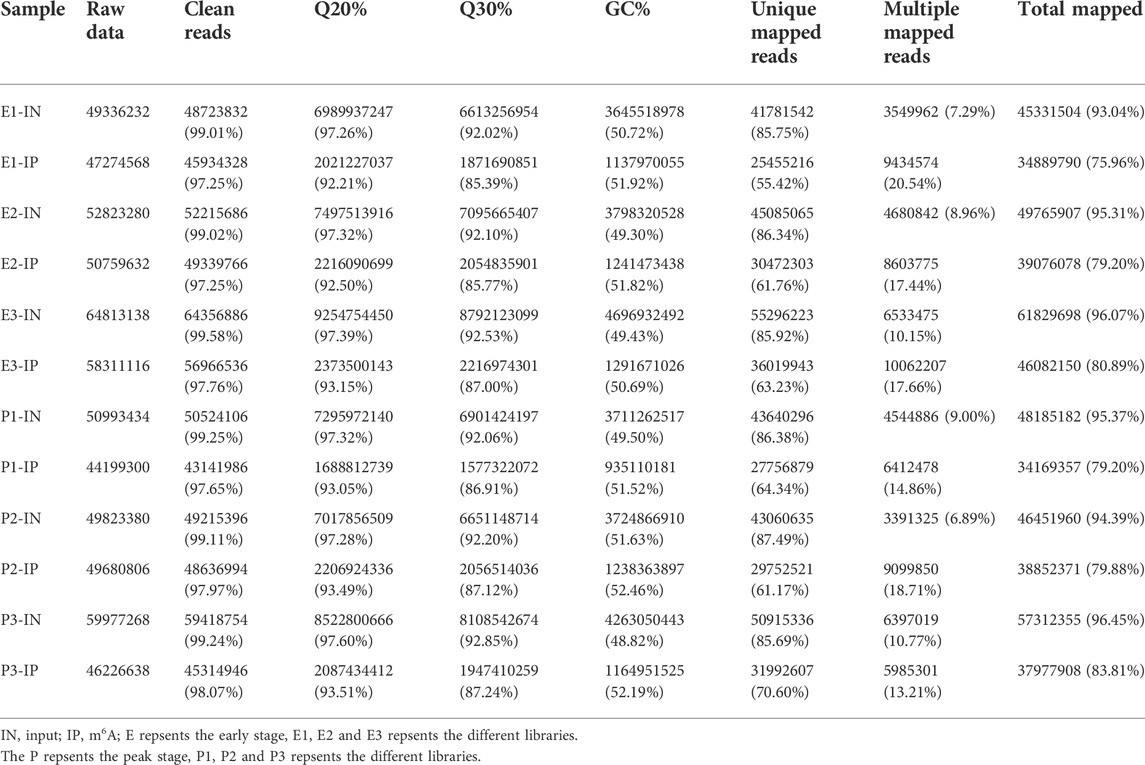
TABLE 1. Comparison of the quality of sequencing data and the reference genome between the two libraries.
After comparing the reads with the reference sequences, the alignment rate of valid reads for replicated samples of dairy goat mammary gland tissue in the early stage in the RNA-seq library was 93.04%–96.08%, of which the single alignment rate was 85.75%–86.34% and the multiple alignment rate was 7.29%–10.15%. The alignment rate of valid reads for the replicated samples of dairy goat mammary gland tissue in the peak stage was 94.39%–96.46%, of which the single alignment rate was 85.69%–87.49% and the multiple alignment rate was 6.89%–10.77%. In the MeRIP-seq library, the alignment rate of the valid reads for the replicated samples of dairy goat mammary gland tissue in the early stage was 75.96%–80.89%, of which the single alignment rate was 55.42%–63.23% and the multiple alignment rate was 17.44%–20.54%. The alignment rate of valid reads in the replicated samples of dairy goat mammary gland tissue in the peak stage was 79.2%–83.81%, of which the single alignment rate was 61.17%–70.60% and the multiple alignment rate was 13.21%–18.71% (Table 1). The most reads for different samples were distributed on the NC _030808.1 chromosome (Figure 1).
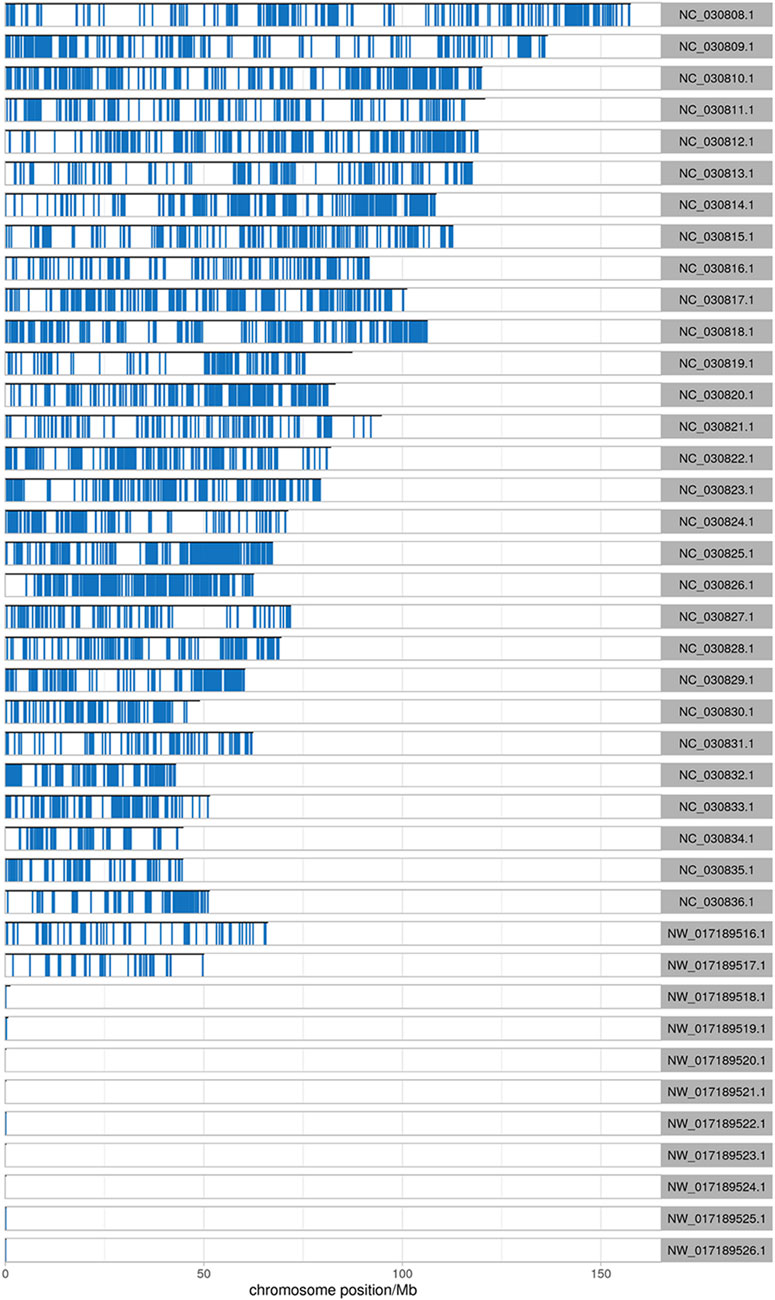
FIGURE 1. Distribution of reads on chromosomes. The abscissa is the chromosome locus (Mb), and the ordinate is the chromosome ID.
In the two lactation periods, 2,476 peaks were identified during the early stage of lactation, and 1,451 peaks were identified at the peak stage (Figure 2A). To understand the degree of m6A modification in genes and to compare the changes in m6A gene modification in the two periods, the priority regions of peak gene distribution were analyzed.
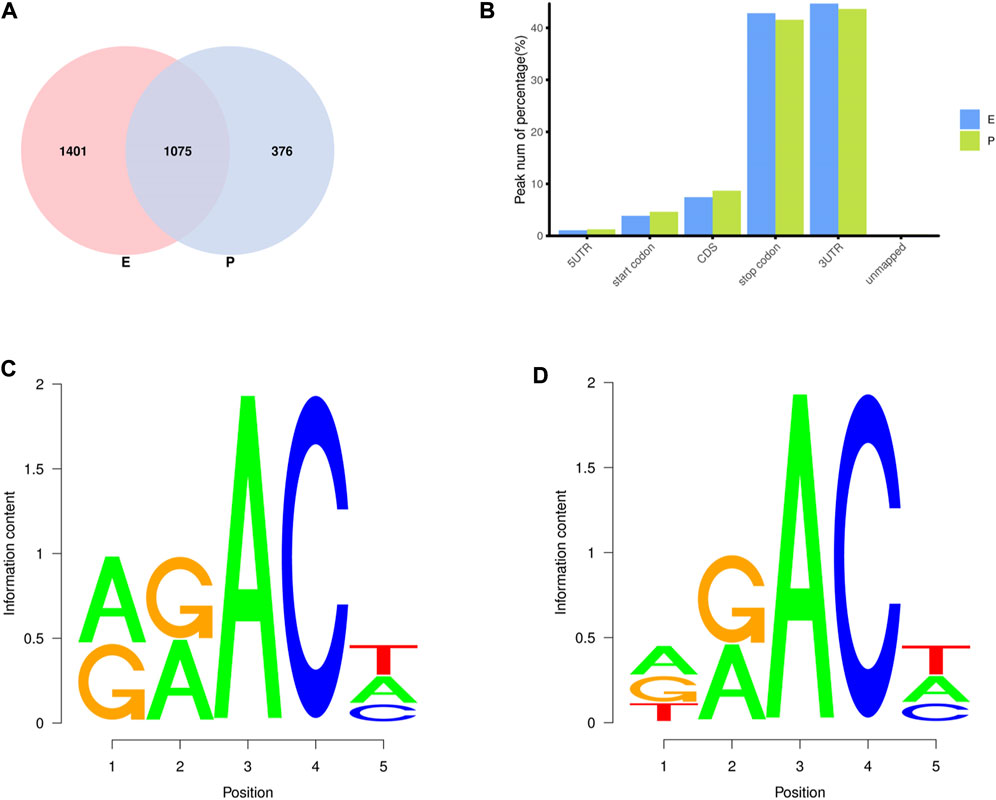
FIGURE 2. Regional distribution and motif sequence of m6A modifications on transcripts. (A) Peak distribution of m6A modifications in early and peak lactation. (B) The distribution of m6A in transcripts (C) and (D) Two common motifs with the highest m6A abundance. E represents the early lactation, P represents the peak lactation, the following are the same.
The results showed that peaks were significantly enriched in the 3′ untranslated region (3′UTR, 44.67%) and the termination codon region (42.81%), followed by the coding DNA sequence (CDS, 7.43%) and initiation codon region (3.84%) (Figure 2B), these findings are consistent with the results of previous studies on m6A modification such as pigs and goose (Cao et al., 2020; Xu et al., 2021). These results indicate that m6A modification presents different distribution patterns on different gene functional elements, which indicates that m6A is involved in the regulation of gene function, which may have unique functions related to mammary gland development and lactation. In previous studies, researchers found that the m6A modification site was often accompanied by motif sequences, e.g., 5′-DRACH-3′ and 5′-RRACH-3' (D = G/A/U, R = G/A, H = A/U/C) (Dominissini et al., 2012; Meyer et al., 2012). This study found that 96.36% sequences contained target motifs (Table 2). The motif sequences with the highest frequency were GGACT (10.55%) (Figure 2C) and AAACA (10.13%) (Figure 2D).
From the early to peak stages of lactation, a total of 21,518 genes were identified, including 20,606 known genes and 912 new genes. Among the 758 DEGs screened using FDR<0.05 and |log2FC|>1, 228 genes were upregulated, and 530 genes were downregulated during the peak stage of lactation (Figure 3A).
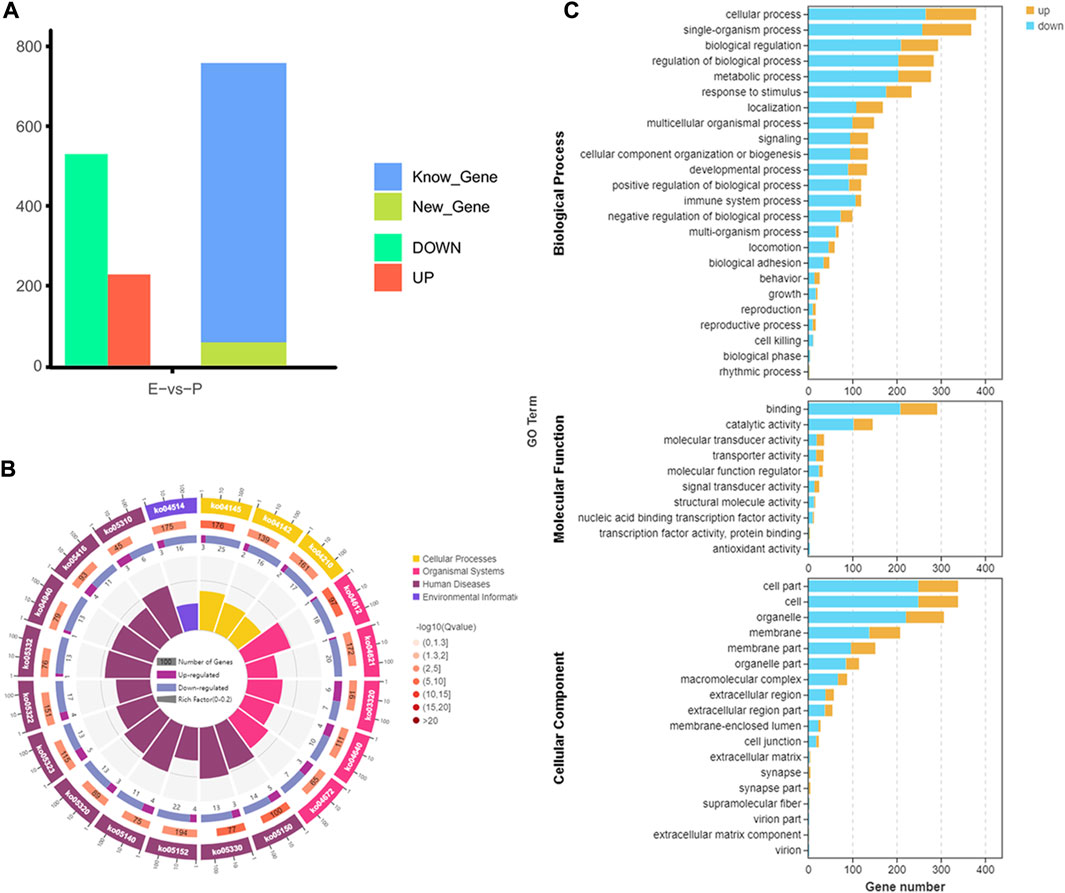
FIGURE 3. Analysis of gene expression and function in dairy goats during early and peak lactation. (A) Analysis results of gene identification at different lactation stages. (B) KEGG pathway analysis of DEGs. From inside to outside: the first circle—the top 20 KEGG terms enriched, the coordinates of gene number in the outside circle, and different colors represent different A class; the second circle—the number of genes, different colors represent different Q value, the smaller Q value, the more red color; the third circle—bar graph of gene numbers, dark purple represents the number of upregulated genes, and light purple represents thenumber of downregulated genes; the fourth circle—the rich factor value of each pathway. (C) GO annotation analysis results of DEGs.
GO enrichment analysis indicated that 553 DEGs were annotated into 54 GO terms, including 150 upregulated DEGs and 394 downregulated DEGs. Among them, 444 DEGs were annotated to 17 cell components, which were mainly distributed in cells, cell parts, organs, and organelles. 471 DEGs were annotated to 23 biological processes, mainly involved in biological regulation, cellular processes, metabolic processes, and single organs. A total of 385 DEGs were annotated to 10 molecular functions, mainly related to binding, catalytic activity, and transport activity (Figure 3C). In the KEGG enrichment analysis, 758 DEGs were involved in four major KEGG pathways, which mainly involved cellular processes (162 genes), environmental information processes (202 genes), genetic information processes (44 genes), and metabolism (180 genes), and were involved in 40 secondary KEGG pathways, including cell growth and apoptosis, cell viability, signal transduction, transport, and catalysis (Figure 3B).
To analyze m6A modification in different stages of lactation, MeRIP-seq was used to identify the m6A peaks during the early and peak stages of lactation. In the early stage, there were 1,401 unique peaks, and in the peak stage, there were 376 unique peaks; the common peaks in the two stages were 1,075 (Figure 2A). After screening, 725 differential peaks were obtained, of which 112 were upregulation events and 613 were downregulation events during the peak stage of lactation (Figure 4A), which distributed in 720 DMGs (Supplementary Table S1).
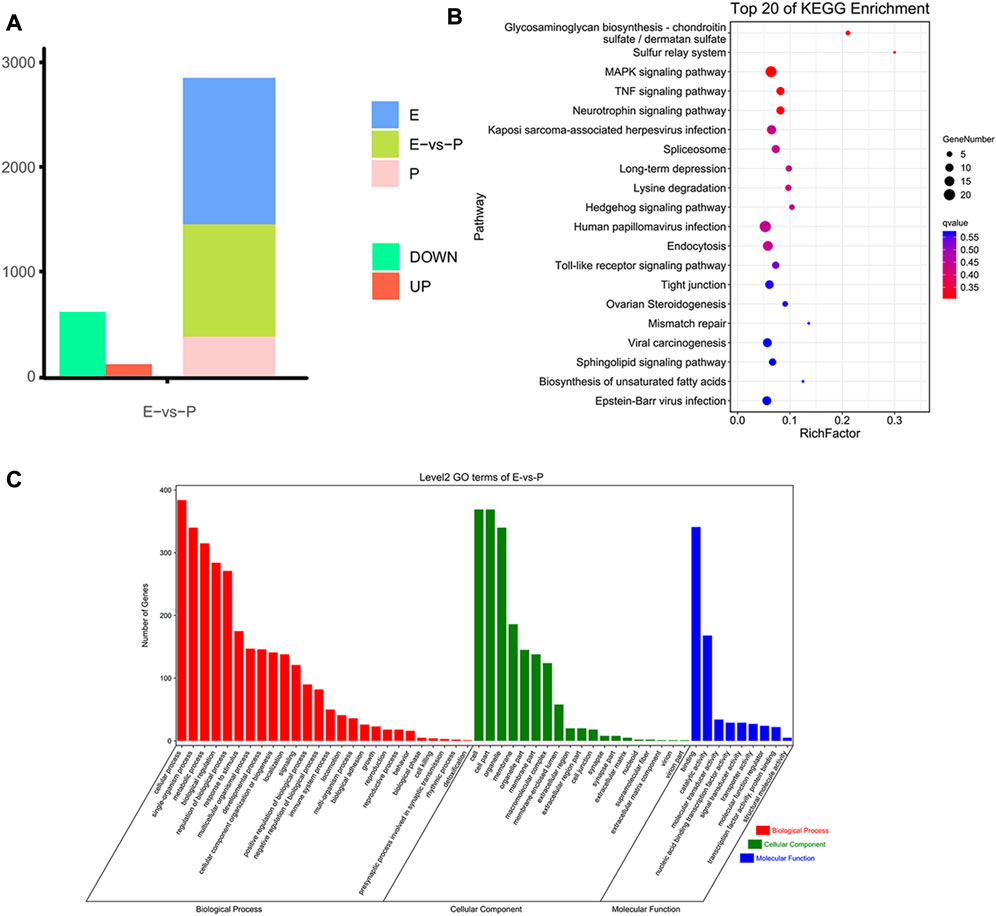
FIGURE 4. Identification and functional analysis of m6A peaks. (A) Peak identification during different lactation stages. (B) Enrichment results for the top 20 DMGs pathways. (C) GO annotation enrichment results for DMGs.
GO enrichment analysis of the DMGs indicated that in the three libraries, 553 DMGs were annotated into 54 GO terms: 455 DMGs were annotated to 19 cell components, distributed in cells, cell membranes, cell parts, organs, and organelles; 460 DMGs were annotated to 26 biological processes, involving biological regulation, cellular processes, single biological processes, multicellular biological processes, and reproductive processes; and 429 DMGs were annotated to nine molecular functions, involving binding, catalytic activity, transport activity, molecular function regulation, molecular structure activity, and molecular sensor activity (Figure 4C, Supplementary Table S2.
The functional classification of DMGs was obtained by KEGG pathway analysis. Among the DMGs, 349 were involved in six major KEGG pathways, involving cellular processes (94 genes), environmental information processes (96 genes), genetic information processes (73 genes), human diseases (121 genes), organic systems (105 genes), and metabolism (82 genes). Thirty-nine secondary KEGG pathways were involved, including cell growth and apoptosis, cell viability, membrane transport, signal transduction, signal molecule interaction, transport, and decomposition. Among the 284 pathways analyzed, 24 significantly enriched pathways were identified, including the MAPK signaling pathway, spliceosome signaling pathway, Hedgehog signaling pathway, tight junction signaling pathway, and NF-kappa B signaling pathway et al. The pathways were mainly involved in biological processes such as mammary epithelial cell proliferation and apoptosis (Figure 4B, Supplementary Table S3).
In the intragroup association analysis, 2,240 genes were modified by m6A methylation during the early stage, and 1,343 genes were modified by m6A methylation in the peak stage. According to the cumulative curve, the expression level of genes modified via methylation was low under the same cumulative frequency of m6A methylation (Figure 5A). Based on the scatter plot of gene expression-peak enrichment fold change, the m6A methylation level was negatively correlated with gene expression abundance, i.e., the peak enrichment of relatively highly expressed genes was relatively low (Figure 5B). Through the analysis of the proportion of peaks in different gene elements, it was found that each element exhibited a nonmonotonic functional relationship pattern. When gene expression abundance reached a certain level, the proportion of peaks showed a downward trend as gene expression continued to increase (Figure 5C). In the combined analysis of DEGs and DMGs, 720 DMGs were identified, of which 19 genes were present in the transcriptome (Figure 5D, Supplementary Table S4).
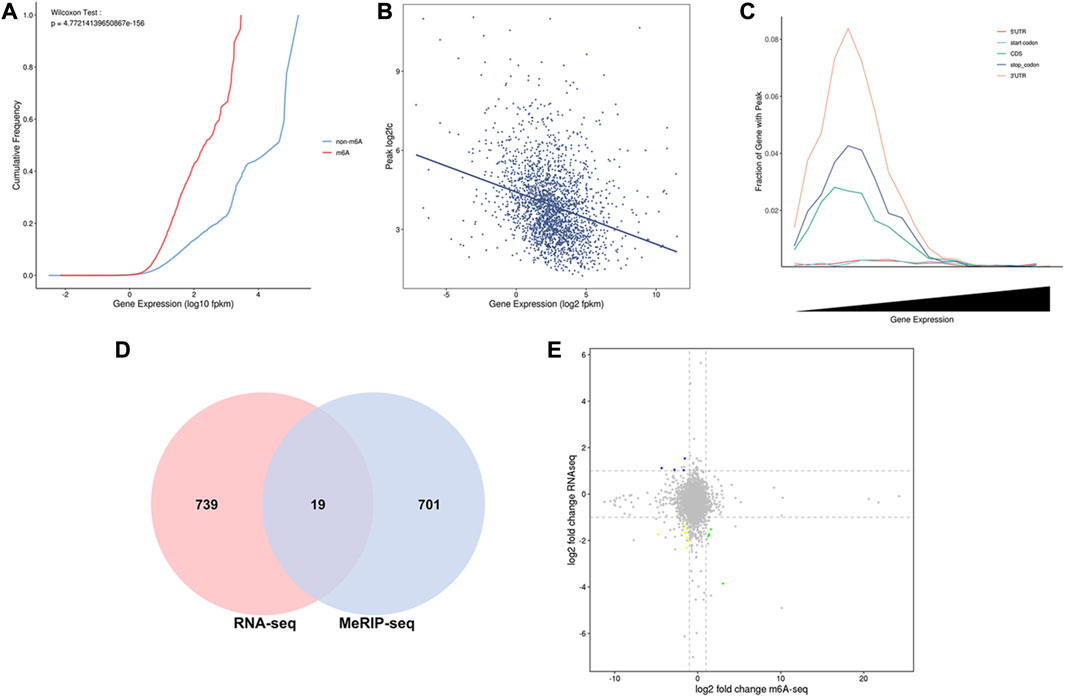
FIGURE 5. Combined MeRIP-seq and RNA-seq analysis. (A) Cumulative curve for gene expression with/without m6A modification. The red line represents the gene set with m6A peak signal, and the blue line represents the gene set without m6A peak signal. (B) Relation of gene expression and peak enrichment fold change (C) Peak distribution in different gene elements and expression abundance. (D) Venn diagram of differential gene distribution in methylomics and transcriptomics (E) Nine-quadrant plot of DEGs with differential peaks. The horizontal axis is the fold difference (log2) in m6A peak abundance, and the vertical axis is the fold difference (log2) of gene expression abundance in the transcriptome. Blue dots represent upregulated genes and downregulated m6A genes, yellow dots represent downregulated genes and downregulated m6A genes, and green dots represent downregulated genes and upregulated m6A genes.
To visually represent the coexpression of genes and m6A, we analyzed the nine-quadrant plots and found that 79% of the genes (15 of 19) were downregulated in the differentially expressed m6A-modifying genes (Figure 5E). Among them, seven genes are related to mammary gland development and lactation, including three hypomethylated and upregulated genes (COLGALT2, IL20RA, PRKG1), two hypermethylated and downregulated genes (LOC102185917, GPR132), two hypomethylated and down regulated genes (GADD45G, RGS10).
To more accurately analyze the relationship between the transcriptome and m6A methylation, this study combined analysis of DEMs enriched peaks and the DEGs in the early and peak stages (Figure 6A), found that the peaks in early stage was distributed among 70 DEGs, and in the peak stage the peaks was distributed in 46 DEGs, 36 DEGs were existed uniquely in the early stage, and 12 DEGs were for peak stage uniquely.
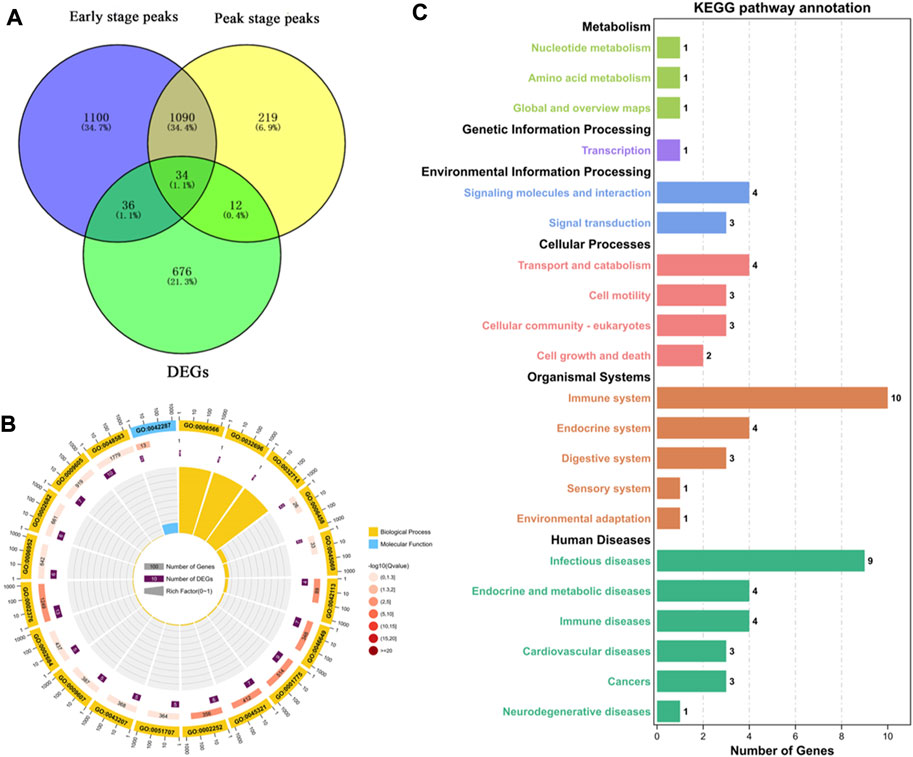
FIGURE 6. Functional analysis of peak enriched DEGs during early and peak lactation stages. (A) Venn diagram of peak distribution in differential expression genes between early and peak lactation stages. (B) GO enrichment analysis of the 34 common peak DEGs. (C) KEGG enrichment analysis of the 34 common peak DEGs.
In addition, through analysis, it was found that there were 34 genes in common between the differential peak-related genes and the differential transcriptome genes in the two periods, and GO and KEGG enrichment analyses were performed (Supplementary Table S5). The top 20 GO terms were enriched in biological processes and molecular functions, which were mainly concentrated in the regulation of biological processes, cell apoptosis, cell growth processes, cellular components or biogenesis, signal transduction, etc., involving 22 genes (ISG15, ISG20, TBX21, MALT1, SLC27A1, ACTB, TNFRSF21, TNFAIP8L2, VEGFC, PLTP, ANP32A, SLA2, TBC1D10C, CD8B, ITM2C, FGD3, TMSB4X, TUBB, RGS1, LOC102174841, PTMA, and PFDN4) (Figure 6B). In the KEGG enrichment analysis, the relevant pathways were mainly enriched in cellular processes, environmental information processes, gene information processes, and organ systems, including cell transport and catabolism, cell viability, and interactions of signaling molecules, involving phagosomes (TUBB, ACTB, LOC102180664, and LOC102185917), cell adhesion molecules (LOC102180664, CD8B, LOC102185917), the PPAR signaling pathway (SLC27A1 and PLTP), glycine, serine, and threonine metabolism (LOC102174841), insulin resistance (SLC27A1), apoptosis (ACTB and LOC102185917), the MAPK signaling pathway (VEGFC), and the PI3K-Akt signaling pathway (VEGFC) (Figure 6C).
Using the GO and KEGG annotation results, 150 genes that directly annotated mammary gland development and lactation were selected from the 2,468 common genes obtained from the two groups (Figure 7A). These genes are mainly involved in mammary gland formation (GO: 0060592), mammary epithelial cell proliferation (GO: 0033599), mammary gland epithelial cell differentiation (GO: 0060644), and biological processes involved in mammary gland development (GO: 0003006). They are involved in KEGG pathways, such as cancer (ko05200), the MAPK signaling pathway (ko04013), cell apoptosis (ko04210), and the PI3K-Akt signaling pathway (ko04151). Based on the interaction analysis of coexpressed genes in STRING database, consisting of 89 nodes and 378 edges, the core genes that showed the most interactions were HRAS, JUN, and EGFR (Figure 7B).
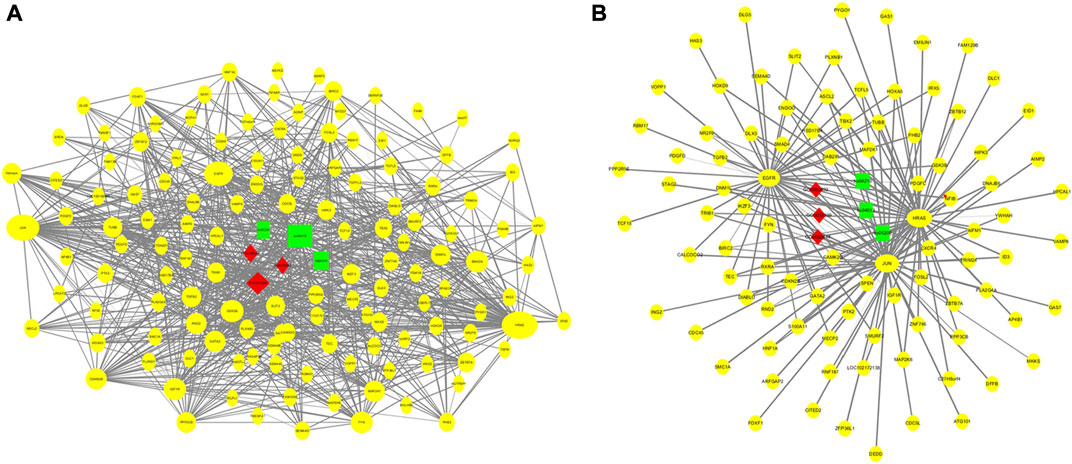
FIGURE 7. Regulation networks related to mammary gland development and lactation of dairy goats. (A) Interaction networks of 150 coexpressed genes. (B) Regulation networks of core gene module.
Methylation modification is an important means of regulating gene expression in epigenetics and also the earliest epigenetic modification discovered. m6A methylation is the most conserved and extensive RNA modification in living organisms (Rengaraj et al., 2021). Studies on m6A have been conducted in humans, viruses, fruit flies, plants, and yeast. (Bodi et al., 2015; Wang M et al., 2020; Hu et al., 2021). In mammals, only swine, cattle, and cashmere goats have been studied. (Cao et al., 2020; Wang T et al., 2020; Li et al., 2021). However, there have no studies on m6A methylation in dairy goats to date, therefore, m6A methylation and its mechanism during mammary gland development and lactation in dairy goats are still unknown. At present, numerous studies have shown that m6A widely involved in spermatogenesis, oogenesis, skin hair follicle morphogenesis, embryonic development, stem cell pluripotency, and myoepithelial cell differentiation, etc. (Luo et al., 2014; Dai et al., 2018; Hui et al., 2022). m6A may also play a crucial role in mammary gland development and lactation of dairy goats.
In this study, coimmunoprecipitation sequencing and general transcription sequencing data were combined to analyze the correlation between m6A modification and the expression of mammary gland development and lactation-related genes based on mRNA in the mammary gland tissue of dairy goats. Previous studies have found that m6A modification characteristics and patterns are highly consistent in the same species but different in various species (Dominissini et al., 2012; Meyer et al., 2012; Wang A et al., 2021). Based on this technology, we investigated the characteristics and patterns of m6A modification, including the degree of m6A modification, the distribution position of m6A in the transcript, and the m6A methylation sequence motif, in the mRNA transcriptome of dairy goats. During mammary gland development and lactation, there were a large number of m6A methylation modifications in mammary gland tissue, including 2,476 peaks identified during the early lactation stage and 1,451 peaks identified during the peak lactation stage. In addition, the abundance of m6A in the 3′UTR was higher, a finding that is consistent with the abundance pattern of m6A in the skin tissue of Liaoning cashmere goats (Wang Y et al., 2021). It was reported that m6A peaks are significantly enriched in the CDS and initiation codons (Xu et al., 2021); however, the distribution pattern of m6A in the goat methylation group was different from that in goose (Xu et al., 2021), Bombyx mori (Li et al., 2019), mice (Meyer et al., 2012), and Arabidopsis (Luo et al., 2014; Duan et al., 2017), indicating that the distribution pattern of m6A is species specific.
Based on the combined analysis of DEGs in transcriptomes and differential peaks, 24 DEGs with m6A methylation modifications were identified in this study, all of which were associated with mammary gland development and lactation in goats. These data indicate that there are dynamic changes in the regulation of important processes by m6A during mammary gland development and lactation. Similarly, dynamic changes in the m6A modification in the follicular selection process of chickens (Fan et al., 2019), different skin tissues of Liaoning cashmere goats (Wang T et al., 2020), and different stages of porcine follicular development in swine (Cao et al., 2020) have also been observed. Among the hypermethylated and downregulated genes in the differentially coexpressed DEGs and DMGs in the combined analysis, the proton-sensing G protein-coupled receptor GPR132 activate signals and transduce signals into cells by lowering pH (Weiß et al., 2017), and its homolog, GPR68, promotes apoptosis and inhibits the proliferation of goat mammary epithelial cells (Zhu et al., 2021). In addition, PRKG1, the hypomethylated and upregulated protein kinase, was negatively correlated with the expression of placental-associated miR-517a-3p before and after delivery (Kambe et al., 2014), indirectly regulating mammary gland development and lactation.
m6A is a chemical marker associated with transcript degradation (He et al., 2017). High levels of m6A modification may endow transcripts with higher stability at lower transcription levels or provide stronger signals for reader proteins, thereby more effectively exerting biological functions (Niu et al., 2013; Wang et al., 2014). In this study, approximately 15% of m6A-modified genes had 2 m6A modification sites, and approximately 3% of m6A-modified genes had 3 m6A modification sites, which may also increase RNA stability or the probability of being recognized by reader proteins. These results all indicate that m6A modification plays a posttranscriptional regulatory role in the mammary gland transcriptome of dairy goats. To elucidate the possible mechanisms underlying the involvement of differentially coexpressed genes in mammary gland development and lactation regulation, GO and KEGG enrichment analyses were performed. Cells, organelles, and cellular parts were annotated as cellular components; cellular processes, signal transduction, metabolic processes, and biological regulation were annotated as molecular functions; and binding and catalytic activation were annotated as biological processes. For the KEGG pathway analysis, the cancer pathway, the PI3K-Akt signaling pathway, and the MAPK signaling pathway were the main enriched metabolic pathways.
Based on the GO and KEGG pathway analysis results, 150 genes related to mammary gland development and lactation were subjected to an interaction analysis of coexpressed genes. The core genes that showed the most interactions in the network were HRAS, JUN, and EGFR. The p21 protein encoded by the HRAS proto-oncogene induces the invasive phenotype of human mammary epithelial cells and plays an important role in the development of breast cancer (Moon et al., 2000). Curcumin can inhibit the signal transduction of HRAS-transformed mammary epithelial cells (HRAS MCF10A) to reduce the incidence of breast cancer (Hahn et al., 2018), thereby promoting mammary gland development and lactation. JUN (AP-1 transcription factor subunit) proto-oncogenes include c-Jun, JunB, and JunD. AP-1 is involved in the proliferation and differentiation of lymphocytes, osteoblasts, and keratinocytes (Elkeles et al., 1999; Hess et al., 2004). JunB inhibits cell proliferation by activating the expression of p16 (INK4a). Furthermore, JunB is a negative regulator of cell proliferation (Passegue and Wagner, 2000). Therefore, the JUN gene may regulate mammary gland cell apoptosis. Studies have found that c-Jun N-terminal kinase (JNK) can regulate the proliferation of mammary gland cells and lactoprotein synthesis in dairy cows by activating Tudor-SN (Ao et al., 2021). EGFR is a member of the epidermal growth factor receptor (HER) family. Studies have found that EGFR promotes adhesion between mammary gland cells and regulates the growth and differentiation of human mammary epithelial cells (Mukhopadhyay et al., 2013). EGFR, at concentrations ranging from 12.5 to 50 ng/ml, facilitates the proliferation of mammary epithelial cells in dairy goats, and activation of the EGFR-mediated signaling pathway promotes the survival of mammary epithelial cells in dairy goats (Huang et al., 2020). Therefore, the data obtained in this study provide a basis for future studies on the role of m6A methylation in the development of mammary glands in dairy goats.
In summary, this study revealed the differences in the transcription and methylation levels of genes in mammary gland tissue between the early and peak stage of lactation and explored their regulation in mammary gland development and lactation function. The proportion, distribution and motif of m6A gene modification in the mRNA transcriptome of mammary gland tissue from dairy goats were consistent with the pattern of m6A modification in the same species; the level of m6A modification in mammary gland tissue was highly negatively correlated with the abundance of modified transcripts. The genes that were modified by m6A at both stages were mainly involved in the regulation of the proliferation and differentiation of mammary gland epithelial cells and the development of mammary gland tissue. Among 150 genes closely related to mammary gland development and lactation, HRAS, JUN, and EGFR were most likely to play a key role in regulating mammary gland development and lactation. This study can provide a theoretical basis for the molecular mechanism of mammary gland development and lactation regulation in dairy goats.
The datasets presented in this study can be found in online repositories. The names of the repository/repositories and accession number(s) can be found below: GEO database. The accession number is GSE210386.
The animal study was reviewed and approved by Experimental Animal Management Committee of Shandong Agricultural University. Written informed consent was obtained from the owners for the participation of their animals in this study.
ZJ designed the experiments and applied for the funds for this study, SW and ZJ wrote the manuscript, SW, LZ, RX, and QL analyzed the data of MeRIP-seq, SW, TC, and CZ analyzed the data of RNA-seq, JW performed a correction for this article.
This work was supported by the National Natural Science Foundation of China (31672401) and the Shandong Provincial Modern Agriculture Industry Technology System (SDAIT-10).
We will give thanks to the members of the Animal Conservation Biology Laboratory of Shandong Agricultural University for their help in collecting data. We are grateful to Guangzhou Genedenovo Biotechnology Co., Ltd. for assisting in sequencing and bioinformatics analysis. We also thank all editors and reviewers for their helps to our paper.
The authors declare that the research was conducted in the absence of any commercial or financial relationships that could be construed as a potential conflict of interest.
All claims expressed in this article are solely those of the authors and do not necessarily represent those of their affiliated organizations, or those of the publisher, the editors and the reviewers. Any product that may be evaluated in this article, or claim that may be made by its manufacturer, is not guaranteed or endorsed by the publisher.
The Supplementary Material for this article can be found online at: https://www.frontiersin.org/articles/10.3389/fcell.2022.945202/full#supplementary-material
Ao, J., Ma, Z., Li, R., Zhang, S., Gao, X., and Zhang, M. (2021). Phospho-Tudor-SN coordinates with STAT5 to regulate prolactin-stimulated milk protein synthesis and proliferation of bovine mammary epithelial cells. Anim. Biotechnol. 13, 1–11. doi:10.1080/10495398.2021.1879824
Ashburner, M., Ball, C. A., Blake, J. A., Botstein, D., Butler, H., Cherry, J. M., et al. (2000). Gene ontology: tool for the unification of biology. The gene Ontology consortium. Nat. Genet. 25 (1), 25–29. doi:10.1038/75556
Boccaletto, P., Machnicka, M. A., Purta, E., Piatkowski, P., Baginski, B., Wirecki, T. K., et al. (2018). MODOMICS: a database of RNA modification pathways. 2017 update. Nucleic Acids Res. 46, D303–D307. doi:10.1093/nar/gkx1030
Bodi, Z., Bottley, A., Archer, N., May, S., and Fray, R. (2015). Yeast m6A methylated mRNAs are enriched on translating ribosomes during meiosis, and under rapamycin treatment. PLOS One 10 (7), e0132090. doi:10.1371/journal.pone.0132090
Brisken, C., and Ataca, D. (2015). Endocrine hormones and local signals during the development of the mouse mammary gland. Wiley Interdiscip. Rev. Dev. Biol. 4 (3), 181–195. doi:10.1002/wdev.172
Cao, Z., Zhang, D., Wang, Y., Tong, X., Avalos, L. F. C., Khan, L. M., et al. (2020). Identification and functional annotation of m6A methylation modification in granulosa cells during antral follicle development in pigs. Anim. Reprod. Sci. 219, 106510. doi:10.1016/j.anireprosci.2020.106510
Chen, S., Zhou, Y., Chen, Y., and Gu, J. (2018). Fastp: an ultra-fast all-in-one FASTQ preprocessor. Bioinformatics 34 (17), i884–i890. doi:10.1093/bioinformatics/bty560
Dai, W., Zou, Y., White, R., Liu, J., and Liu, H. (2018). Transcriptomic profiles of the bovine mammary gland during lactation and the dry period. Funct. Integr. Genomics 18 (2), 125–140. doi:10.1007/s10142-017-0580-x
Dominissini, D., Moshitch-Moshkovitz, S., Schwartz, S., Salmon-Divon, M., Ungar, L., Cesarkas, S. O. K., et al. (2012). Topology of the human and mouse m6A RNA methylomes revealed by m6A-seq. Nature 485 (7397), 201–206. doi:10.1038/nature11112
Duan, H.-C., Wei, L.-H., Zhang, C., Wang, Y., Chen, L., Lu, Z., et al. (2017). ALKBH10B is an RNA N6-methyladenosine demethylase affecting Arabidopsis floral transition. Plant Cell 29 (12), 2995–3011. doi:10.1105/tpc.16.00912
Dubin, D. T., and Stollar, V. (1975). Methylation of Sindbis virus "26S" messenger RNA. Biochem. Biophys. Res. Commun. 66 (4), 1373–1379. doi:10.1016/0006-291x(75)90511-2
Elkeles, A., Juven-Gershon, T., Israeli, D., Wilder, S., Zalcenstein, A., and Oren, M. (1999). The c-fos proto-oncogene is a target for transactivation by the p53 tumor suppressor. Mol. Cell. Biol. 19 (4), 2594–2600. doi:10.1128/MCB.19.4.2594
Fan, Y., Zhang, C., and Zhu, G. (2019). Profiling of RNA N6-methyladenosine methylation during follicle selection in chicken ovary. Poult. Sci. 98 (11), 6117–6124. doi:10.3382/ps/pez277
Hahn, Y., Kim, S., Chio, B., Cho, K., Bandu, R., Kim, K., et al. (2018). Curcumin interacts directly with the Cysteine 259 residue of STAT3 and induces apoptosis in H-Ras transformed human mammary epithelial cells. Sci. Rep. 8 (1), 6409. doi:10.1038/s41598-018-23840-2
He, S., Wang, H., Liu, R., He, M., Che, T., Jin, L., et al. (2017). mRNA N6-methyladenosine methylation of postnatal liver development in pig. PLoS one 12 (3), e0173421. doi:10.1371/journal.pone.0173421
Hess, J., Angel, P., and Schorpp-Kistner, M. (2004). AP-1 subunits: quarrel and harmony among siblings. J. Cell Sci. 117 (25), 5965–5973. doi:10.1242/jcs.01589
Hu, J., Cai, J., Park, S., Lee, K., Li, Y., Chen, Y., et al. (2021). N6 -Methyladenosine mRNA methylation is important for salt stress tolerance in Arabidopsis. Plant J. 106 (6), 1759–1775. doi:10.1111/tpj.15270
Huang, J., Dai, B., Qu, H., Zhong, Y., Ma, Y., Luo, J., et al. (2020). Epidermal growth factor stimulates fatty acid synthesis mainly via PLC-γ1/akt signaling pathway in dairy goat mammary epithelial cells. Animals. 10 (6), 930. doi:10.3390/ani10060930
Hui, T., Zhu, Y., Shen, J., Bai, M., Fan, Y., Feng, S., et al. (2022). Identification and molecular analysis of m6A-circRNAs from cashmere goat reveal their integrated regulatory network and putative functions in secondary hair follicle during anagen stage. Animals. 12 (6), 694. doi:10.3390/ani12060694
Ji, R., and Zhang, X. (2021). The roles of RNA N6-methyladenosine in regulating stem cell fate. Front. Cell Dev. Biol. 9, 765635. doi:10.3389/fcell.2021.765635
Ji, Z., Chao, T., Zhang, C., Liu, Z., Hou, L., Wang, J., et al. (2019). Transcriptome analysis of dairy goat mammary gland tissues from different lactation stages. DNA Cell Biol. 38 (2), 129–143. doi:10.1089/dna.2018.4349
Ji, Z., Chao, T., Liu, Z., Hou, L., Wang, J., Wang, A., et al. (2020). Genome-wide integrated analysis demonstrates widespread functions of lncRNAs in mammary gland development and lactation in dairy goats. BMC Genomics 21 (1), 254. doi:10.1186/s12864-020-6656-3
Kambe, S., Yoshitake, H., Yuge, K., Ishida, Y., Ali, M. M., Takizawa, T., et al. (2014). Human exosomal placenta-associated miR-517a-3p modulates the expression of PRKG1 mRNA in Jurkat cells. Biol. Reprod. 91 (5), 129. doi:10.1095/biolreprod.114.121616
Kanehisa, M., and Goto, S. (2000). KEGG: kyoto encyclopedia of genes and genomes. Nucleic Acids Res. 28 (1), 27–30. doi:10.1093/nar/28.1.27
Kim, D., Langmead, B., and Salzberg, S. L. (2015). HISAT: a fast spliced aligner with low memory requirements. Nat. Methods 12 (4), 357–360. doi:10.1038/nmeth.3317
Li, B., and Dewey, C. N. (2011). RSEM: accurate transcript quantification from RNA-seq data with or without a reference genome. BMC Bioinforma. 12, 323. doi:10.1186/1471-2105-12-323
Li, B., Wang, X., Li, Z., Lu, C., Zhang, Q., Chang, L., et al. (2019). Transcriptome-wide analysis of N6-methyladenosine uncovers its regulatory role in gene expression in the lepidopteran Bombyx mori. Insect Mol. Biol. 28 (5), 703–715. doi:10.1111/imb.12584
Li, T., Lin, C., Zhu, Y., Xu, H., Yin, Y., Wang, C., et al. (2021). Transcriptome profiling of m6A mRNA modification in bovine mammary epithelial cells treated with Escherichia coli. Int. J. Mol. Sci. 22 (12), 6254. doi:10.3390/ijms22126254
Lin, Z., Hsu, P., Xing, X., Fang, J., Lu, Z., Zou, Q., et al. (2017). Mettl3-/Mettl14-mediated mRNA N 6-methyladenosine modulates murine spermatogenesis. Cell Res. 27 (10), 1216–1230. doi:10.1038/cr.2017.117
Luo, G.-Z., MacQueen, A., Zheng, G., Duan, H., Dore, L. C., Lu, Z., et al. (2014). Unique features of the m6A methylome in Arabidopsis thaliana. Nat. Commun. 5, 5630. doi:10.1038/ncomms6630
Macias, H., and Hinck, L. (2012). Mammary gland development. Wiley Interdiscip. Rev. Dev. Biol. 1 (4), 533–557. doi:10.1002/wdev.35
Meng, J., Lu, Z., Liu, H., Zhang, L., Zhang, S., Chen, Y., et al. (2014). A protocol for RNA methylation differential analysis with MeRIP-Seq data and exomePeak R/Bioconductor package. Methods 69 (3), 274–281. doi:10.1016/j.ymeth.2014.06.008
Meyer, K., Saletore, Y., Zumbo, P., Elemento, O., Mason, C., and Jaffrey, S. (2012). Comprehensive analysis of mRNA methylation reveals enrichment in 3' UTRs and near stop codons. Cell 149 (7), 1635–1646. doi:10.1016/j.cell.2012.05.003
Moon, A., Kim, M., Kim, T., Kim, S., Kim, H., Chen, Y., et al. (2000). H-ras, but not N-ras, induces an invasive phenotype in human breast epithelial cells: a role for MMP-2 in the H-ras-induced invasive phenotype. Int. J. Cancer 85 (2), 176–181. doi:10.1002/(sici)1097-0215(20000115)85:2<176:aid-ijc5>3.0.co;2-e
Mukhopadhyay, C., Zhao, X., Maroni, D., Band, V., and Naramura, M. (2013). Distinct effects of EGFR ligands on human mammary epithelial cell differentiation. PLoS one 8 (10), e75907. doi:10.1371/journal.pone.0075907
Nachtergaele, S., and He, C. (2018). Chemical modifications in the life of an mRNA transcript. Annu. Rev. Genet. 52, 349–372. doi:10.1146/annurev-genet-120417-031522
Niu, Y., Zhao, X., Wu, Y.-S., Li, M.-M., Wang, X.-J., and Yang, Y.-G. (2013). N6-methyl-adenosine (m6A) in RNA: an old modification with a novel epigenetic function. Genomics Proteomics Bioinforma. 11 (1), 8–17. doi:10.1016/j.gpb.2012.12.002
Passegue, E., and Wagner, E. F. (2000). JunB suppresses cell proliferation by transcriptional activation of p16(INK-4a) expression. EMBO J. 19 (12), 2969–2979. doi:10.1093/emboj/19.12.2969
Pertea, M., Pertea, G. M., Antonescu, C. M., Chang, T. C., Mendell, J. T., and Salzberg, S. L. (2015). StringTie enables improved reconstruction of a transcriptome from RNA-seq reads. Nat. Biotechnol. 33 (3), 290–295. doi:10.1038/nbt.3122
Pertea, M., Kim, D., Pertea, G. M., Leek, J. T., and Salzberg, S. L. (2016). Transcript-level expression analysis of RNA-seq experiments with HISAT, StringTie and Ballgown. Nat. Protoc. 11 (9), 1650–1667. doi:10.1038/nprot.2016.095
Rengaraj, P., Obrdlík, A., Vukić, D., Varadarajan, N. M., Keegan, L. P., Vaňáčová, S., et al. (2021). Interplays of different types of epitranscriptomic mRNA modifications. RNA Biol. 18, 19–30. doi:10.1080/15476286.2021.1969113
Shannon, P., Markiel, A., Ozier, O., Baliga, N. S., Wang, J. T., Ramage, D., et al. (2003). Cytoscape: a software environment for integrated models of biomolecular interaction networks. Genome Res. 13 (11), 2498–2504. doi:10.1101/gr.1239303
Stefanon, B., Colitti, M., Gabai, G., Knight, C. H., and Wilde, C. J. (2002). Mammary apoptosis and lactation persistency in dairy animals. J. Dairy Res. 69 (1), 37–52. doi:10.1017/s0022029901005246
Wang, A., Ji, Z., Xuan, R., Zhao, X., Hou, L., Li, Q., et al. (2021). Differentially expressed MiRNAs of goat submandibular glands among three developmental stages are involved in immune functions. Front. Genet. 12, 678194. doi:10.3389/fgene.2021.678194
Wang, X., Lu, Z., Gomez, A., Hon, G. C., Yue, Y., Han, D., et al. (2014). N6-methyladenosine-dependent regulation of messenger RNA stability. Nature 505 (7481), 117–120. doi:10.1038/nature12730
Wang, M., Liang, Y., Ibeagha-Awemu, E., Li, M., Zhang, H., Chen, Z., et al. (2020). Genome-wide DNA methylation analysis of mammary gland tissues from chinese holstein cows with staphylococcus aureus induced mastitis. Front. Genet. 11, 550515. doi:10.3389/fgene.2020.550515
Wang, T., Kong, S., Tao, M., and Ju, S. (2020). The potential role of RNA N6-methyladenosine in Cancer progression. Mol. Cancer 19 (1), 88. doi:10.1186/s12943-020-01204-7
Wang, Y., Zheng, Y., Guo, D., Zhang, X., Guo, S., Hui, T., et al. (2020). m6A methylation analysis of differentially expressed genes in skin tissues of coarse and fine type liaoning cashmere goats. Front. Genet. 10, 1318. doi:10.3389/fgene.2019.01318
Wang, Y., Li, G., Zhang, X., Guo, S., Guo, D., Zhang, X., et al. (2021). Analysis of m6A methylation in skin tissues of different sex Liaoning cashmere goats. Anim. Biotechnol. 25, 1–11. doi:10.1080/10495398.2021.1962897
Weiß, K. T., Fante, M., Köhl, G., Schreml, J., Haubner, F., Kreutz, M., et al. (2017). Proton-sensing G protein-coupled receptors as regulators of cell proliferation and migration during tumor growth and wound healing. Exp. Dermatol. 26 (2), 127–132. doi:10.1111/exd.13209
Xu, T., Xu, Z., Liu, L., Zeng, T., Gu, L., Huang, Y., et al. (2021). Transcriptome-wide study revealed m6A regulation of embryonic muscle development in Dingan goose (Anser cygnoides orientalis). BMC Genomics 22 (1), 270. doi:10.1186/s12864-021-07556-8
Xuan, R., Chao, T., Wang, A., Zhang, F., Sun, P., Liu, S., et al. (2020). Characterization of microRNA profiles in the mammary gland tissue of dairy goats at the late lactation, dry period and late gestation stages. PLOS One 15 (6), e0234427. doi:10.1371/journal.pone.0234427
Keywords: dairy goats, mammary gland, lactation, MeRIP-seq, m6A
Citation: Wang S, Zhang L, Xuan R, Li Q, Ji Z, Chao T, Wang J and Zhang C (2022) Identification and functional analysis of m6A in the mammary gland tissues of dairy goats at the early and peak lactation stages. Front. Cell Dev. Biol. 10:945202. doi: 10.3389/fcell.2022.945202
Received: 16 May 2022; Accepted: 04 October 2022;
Published: 18 October 2022.
Edited by:
Xiao Han, Fuzhou University, ChinaReviewed by:
Xiaolong Wang, Northwest A&F University, ChinaCopyright © 2022 Wang, Zhang, Xuan, Li, Ji, Chao, Wang and Zhang. This is an open-access article distributed under the terms of the Creative Commons Attribution License (CC BY). The use, distribution or reproduction in other forums is permitted, provided the original author(s) and the copyright owner(s) are credited and that the original publication in this journal is cited, in accordance with accepted academic practice. No use, distribution or reproduction is permitted which does not comply with these terms.
*Correspondence: Zhibin Ji, emJqaTkxNkBzZGF1LmVkdS5jbg==
Disclaimer: All claims expressed in this article are solely those of the authors and do not necessarily represent those of their affiliated organizations, or those of the publisher, the editors and the reviewers. Any product that may be evaluated in this article or claim that may be made by its manufacturer is not guaranteed or endorsed by the publisher.
Research integrity at Frontiers

Learn more about the work of our research integrity team to safeguard the quality of each article we publish.