 Charlotte Mallart1
 Fabienne Chalvet1‡
 Sophie Netter2‡
 Alba Yurani Torres1†Mickael Poidevin1
 Jacques Montagne1
 Anne-Marie Pret2§
 Marianne Malartre1*§
- 1Institute for Integrative Biology of the Cell (I2BC), CEA, CNRS, Université Paris-Saclay, Gif-sur-Yvette, France
- 2Institute for Integrative Biology of the Cell (I2BC), UVSQ, CEA, CNRS, Université Paris-Saclay, Gif- sur-Yvette, France
The JAK-STAT pathway is evolutionary conserved. The simplicity of this signaling in Drosophila, due to the limited redundancy between pathway components, makes it an ideal model for investigation. In the Drosophila follicular epithelium, highly stereotyped functions of JAK-STAT signaling have been well characterized, but how signaling activity is regulated precisely to allow the different outcomes is not well understood. In this tissue, the ligand is secreted by the polar cells positioned at each follicle extremity, thus generating a gradient of JAK-STAT activity in adjacent cells. One way to control the delivered quantity of ligand is by regulating the number of polar cells, which is reduced by apoptosis to exactly two at each pole by mid-oogenesis. Hence, JAK-STAT activity is described as symmetrical between follicle anterior and posterior regions. Here, we show that JAK-STAT signaling activity is actually highly dynamic, resulting in asymmetry between poles by mid-oogenesis. Interestingly, we found similar temporal dynamics at follicle poles in the accumulation of the adherens junction E-cadherin protein. Remarkably, E-cadherin and JAK-STAT signaling not only display patterning overlaps but also share functions during oogenesis. In particular, we show that E-cadherin, like JAK-STAT signaling, regulates polar cell apoptosis non-cell-autonomously from follicle cells. Finally, our work reveals that E-cadherin is required for optimal JAK-STAT activity throughout oogenesis and that E-cadherin and Stat92E, the transcription factor of the pathway, form part of a physical complex in follicle cells. Taken together, our study establishes E-cadherin as a new positive regulator of JAK-STAT signaling during oogenesis.
Introduction
JAK/STAT signaling has been highly conserved throughout evolution both structurally and functionally (Arbouzova and Zeidler, 2006). In Drosophila, the JAK-STAT pathway is activated upon binding of one of the three Unpaired ligands (Upd1, 2, or 3) to the unique Domeless (Dome) receptor. Following activation of the dimerized receptor, its associated kinase JAK (encoded by hopscotch, hop) phosphorylates the only STAT member (encoded by Stat92E), which is translocated to the nucleus to regulate target gene expression (Chen et al., 2014). Throughout oogenesis, JAK-STAT signaling plays multiple roles, requiring strict spatial and temporal regulation of its activity (Baksa et al., 2002; Beccari et al., 2002; Xi et al., 2003; Borensztejn et al., 2013). Ovarian follicles consist of a germline cyst made up of one oocyte and 15 nurse cells surrounded by a follicular monolayered epithelium. They are organized into ovarioles, which are strings of follicles progressively maturing from anterior to posterior, each connected by interfollicular stalks (Figure 1A). upd1 (or upd) expression is restricted to a select group of somatic cells, polar cells (PCs), present within the follicular epithelium at anterior–posterior follicle poles (McGregor et al., 2002). Strict control of PC number, and, thus, the amount of Upd ligand, is important for JAK-STAT signaling regulation. Poles of young follicles contain groups of 3–6 PCs, and apoptosis of the supernumerary cells reduces this number to exactly 2 by stage 5 of oogenesis (Besse and Pret, 2003; Khammari et al., 2011). In this way, there is sufficient Upd early on to fulfill the JAK-STAT signaling role in interfollicular stalk formation, while by stage 7, the amount of Upd is calibrated to generate a morphogen gradient at both poles (Besse and Pret, 2003; Borensztejn et al., 2013). Consequently, three adjacent somatic cell types, border cells (BCs), stretch cells, and centripetal cells, are specified at the anterior pole, while posterior cells adopt a different fate due to the combined outputs of JAK-STAT and EGFR signaling (Xi et al., 2003; Fregoso Lomas et al., 2016; Stevens et al., 2020).
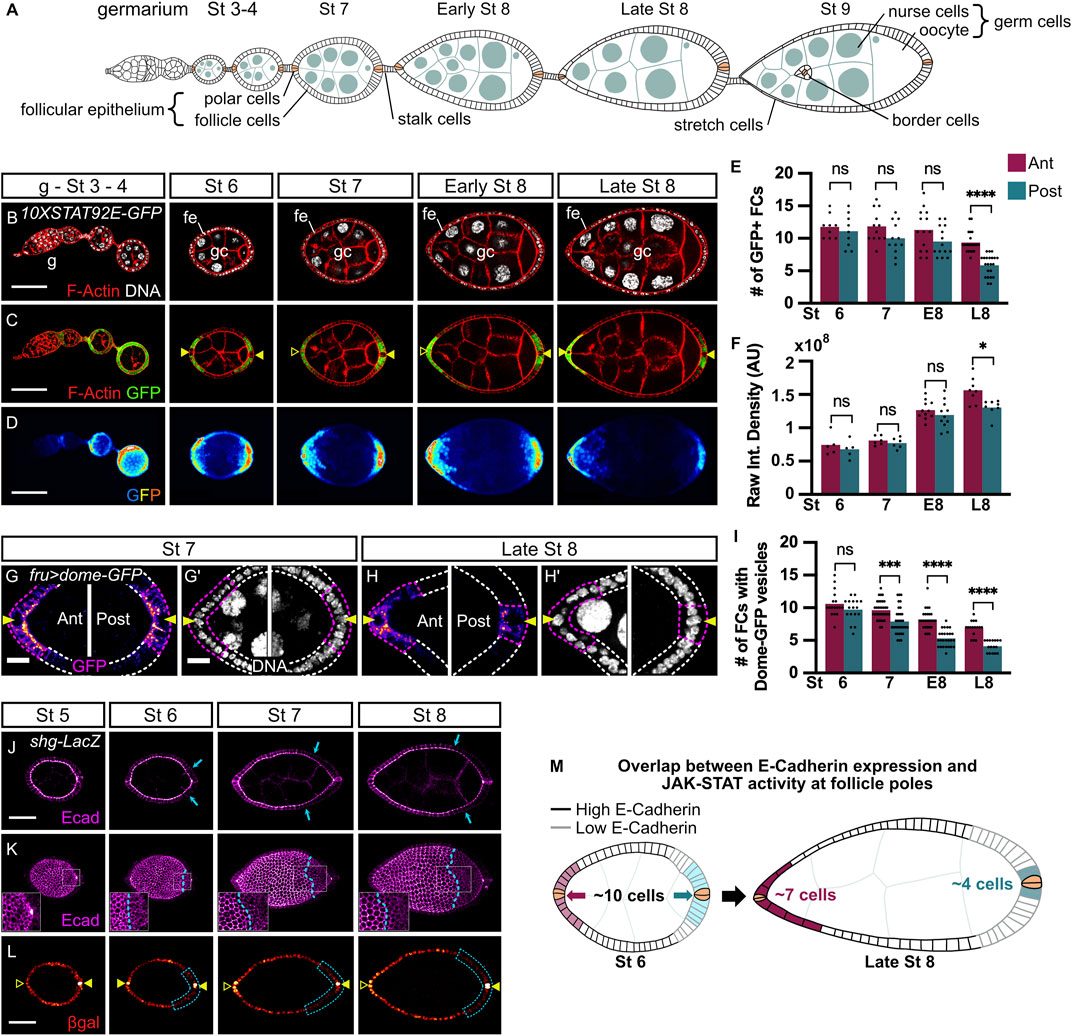
FIGURE 1. JAK-STAT signaling activity and E-cadherin expression are dynamic and asymmetric between anterior and posterior poles starting at stages 7 and 6 of oogenesis respectively. In all images and drawings, the anterior is to the left. Filled arrowheads indicate PCs. Empty arrowheads indicate the position of PCs along the z-axis when not visible on the displayed z section. In graphs, purple and blue bars represent mean measurements at anterior (ant) and posterior (post) poles respectively and each dot corresponds to one measurement. (A) Schematic drawing illustrating the organization of an ovariole with the germarium (G) located at the anterior-most tip and older stages towards the posterior end linked by the stalk cells. The somatic follicle monolayered epithelium (fe), composed of follicle cells (FC), including polar cells (PC, in beige), border cells, and stretch cells surrounds the cyst of 16 germ cells (gc) comprising 15 nurse cells and 1 oocyte that is anchored at the posterior pole. (B–D) Follicles from 10XSTAT92E-GFP hemizygous females carrying a STAT92E transcriptional reporter at the indicated stages of oogenesis (B) F-Actin (red, phalloidin) and DNA (grey, DAPI) staining. (C,D) Native GFP (C: green, one confocal section; (D) “royal” filter, sum projection of total GFP signal) reflects JAK-STAT activity at each pole forming a gradient in FCs adjacent to PCs. (E) The mean number of GFP + FCs at each pole counted on one confocal section that includes PCs. From stage 7, GFP + FC number decreases at the posterior pole and is significantly lower than at the anterior pole when follicles attain late stage 8 (L8). (F) Raw Integrated Density quantification of 25% of follicle length starting at each pole on the sum projection of total GFP signal. At L8, GFP intensity is significantly lower at the posterior pole than at the anterior pole (G,H) Stage 7 and L8 follicles from females expressing UAS-dome-GFP in FCs with the fru-Gal4 driver (max projection of 3–6 confocal sections of anterior and posterior follicle poles). The number of FCs active for JAK-STAT signaling (purple dotted lines) adjacent to PCs (arrowheads) was determined by counting FCs containing Dome-positive vesicles (“fire” filter, from purple, low intensity, to orange, high intensity). (I) Mean number of FCs containing Dome-GFP vesicles at each pole shows a progressive decrease at both anterior and posterior poles from stage 7 to L8, but more drastically at the posterior pole with significant differences with the anterior pole at all stages. (J–L) Follicles at the indicated stages of oogenesis from shotgun-LacZ (shg-LacZ) homozygous females carrying a shg transcriptional reporter. (J) E-cadherin immunostaining (“magenta hot” filter, from magenta, low intensity, to white, high intensity) on a max projection of 3 confocal sections shows E-cadherin apico-lateral localization within the follicular epithelium, with a weaker intensity at the posterior pole from stage 6 (blue arrows show the border between high and low E-cadherin intensity). (K) 3D projections of E-cadherin immunostaining (“magenta hot” filter) of the same follicles as in (J) highlight the alveolus-like organization of E-cadherin in the follicular epithelium. E-cadherin protein is homogenously distributed along the anterior-posterior axis up to stage 5 of oogenesis and then decreases at the posterior pole compared to the anterior pole from stage 6 (blue dotted lines indicate the border between high and low E-cadherin intensity). Insets on the posterior follicle poles are magnifications of the white dotted area. (L) Beta-galactosidase (βgal) immunostaining (“red hot” filter, from red, low intensity, to yellow, high intensity) on the same projection as in (J) shows FCs that express the shg-LacZ reporter reflecting the shg expression pattern at the transcriptional level. Like the E-cadherin protein, shg transcriptional activity between poles changes from homogeneous at stage 5 to lower at the posterior pole than at the anterior pole from stages 6–8 (blue dotted lines) in 100% of observed cases (n = 70). (M) Schematic drawing of stage 6 and late stage 8 follicles representing JAK-STAT signaling dynamics together with E-cadherin expression pattern in the follicular epithelium. Simplified JAK-STAT signaling dynamics at anterior (pink) and posterior (blue) poles (paler colors for lower signaling and darker colors to reflect high signaling) based on the observations shown in graph F for JAK-STAT signaling intensity, and in the graph I for the number of JAK-STAT active FCs. pCs are indicated in beige. St: stage. E8: Early stage 8. L8: Late stage 8. ns: non-significative. Int.: Integrated. AU: Arbitrary Units. #: Number. Statistical tests: ordinary one-way ANOVAs. Stars indicate statistically significant differences. *p < 0.05, ***p < 0.001, and ****p < 0.0001. Scale: (B–D) 50 µm (G–H) 10 µm. (J–L) 30 µm n: number of stage 6, 7, and 8 follicles analyzed.
Several other processes participate in the regulation of JAK-STAT signaling in follicle cells (FCs), including Upd exocytosis and glypican-mediated diffusion between follicle and germ cells (Hayashi et al., 2012; Saadin and Starz-Gaiano, 2016), and receptor endocytosis (Devergne et al., 2007). However, only few JAK-STAT signaling regulators have been identified so far. For instance, the known repressor Socs36E, together with two transcriptional regulators (apontic and slow border cells) and mir279 participate in the precise specification of the anterior FC fates by setting up a complex genetic circuitry acting on Stat92E and Dome (Starz-Gaiano et al., 2008; Yoon et al., 2011; Monahan and Starz-Gaiano, 2013).
As there are exactly two PCs at each follicle pole from stage 5 (Besse and Pret, 2003), these being the only source of the Upd ligand, it is understandable that JAK-STAT activity has been considered to be symmetric between anterior and posterior poles (Denef and Schüpbach, 2003; Xi et al., 2003; Hayashi et al., 2012). Some asymmetry in JAK-STAT activity has been observed between FCs located around anterior PC groups at the cell level (Manning et al., 2015), but no asymmetry has been reported at the tissue level. Here, we revisited JAK-STAT signaling pathway activity and regulation during oogenesis by using a Stat92E transcriptional reporter, and we observed that signaling was more dynamic than previously described. In particular, we report that JAK-STAT signaling becomes asymmetric by mid-oogenesis, with a higher activity being detected at the anterior compared to posterior poles. Interestingly, we show that the adherens junction (AJ) component Epithelial Cadherin (E-cadherin), which is involved in the formation and maintenance of epithelial structures, is also found with higher levels at the anterior follicles, leading to an asymmetry between anterior and posterior poles becoming visible at mid-oogenesis. This, together with the fact that both E-cadherin and JAK-STAT signaling are required for several morphogenesis events, including PC apoptosis as we show here, prompted us to investigate whether E-cadherin could be a regulator of JAK-STAT signaling. A key feature of AJs is their plasticity, which enables tissue remodeling. Hence, the role of E-cadherin in morphogenesis has been extensively studied in numerous tissues and models (Pannekoek et al., 2019). However, much less is known about E-cadherin acting as a regulator of cell signaling. Our novel findings demonstrate that E-cadherin is a positive regulator of JAK-STAT signaling throughout oogenesis. Finally, we found that E-cadherin and Stat92E form part of the same complex in FCs, which suggests that the regulation exerted by E-cadherin on JAK-STAT signaling could be achieved by localizing Stat92E in a permissive sub-membrane domain for efficient signaling.
Materials and methods
Fly stocks and genetics
The following stocks were used: 10XSTAT92E-GFP (gift from E. Bach, Bach et al., 2007), UAS-dome-GFP (gift from C. Ghiglione), shg-lacZ (gift from JP. Vincent), UAS-Stat92E-GFP (gift from C. Janke); fru-Gal4 (Borensztejn et al., 2013), tj-Gal4 (gift from V. Mirouse), nos-Gal4 (gift from A. Boivin), upd-Gal4 (Khammari et al., 2011), shg::GFP (gift from Yang Hong); RNAi strains are from BDSC: UAS-shgRNAi (#38207, #32904, named #2 and #3, respectively, in the text), and VDRC: UAS-shgRNAi (#27082, named #1 in the text), UAS-updRNAi (#3282), UAS-hopRNAi (#102830); and w1118 (#3605), Canton S (#1), UAS-shgS (#65589) and tub-Gal80TS (#7016) are from BDSC. 10XSTAT92E-GFP and shg-lacZ were maintained at 25°C. All crosses using the Gal4-UAS system were performed at 25°C, or at 18°C when tub-Gal80ts was used (with fru-Gal4 and tj-Gal4 lines), until transfer of pharate pupae to 29°C. Females were dissected at 3–4 days of age.
Immunostaining and native fluorescence
Ovary dissection and immunostaining were performed according to the work of Torres et al. (2017). For native GFP observation of 10XSTAT92E-GFP females, ovaries were fixed in 4% formaldehyde, washed briefly 3x in PBS, 15 min in PBS-Triton 0.3%, incubated with DAPI and phalloidin for 30 min with agitation and rinsed 3x in PBS. Mounting was performed in Dabco (Sigma), and observations were carried out straightaway.
The following primary antibodies were used: rabbit anti-GFP (1:200, Interchim), rabbit anti-Stat92E (1:1000, D. Montell, used for PLA), rabbit anti-Stat92E (1:1000 S. Hou, used for immunostaining), and from DSHB: rat anti-E-cadherin (1:200), mouse anti-β-galactosidase (1:200), mouse anti-GFP (1:50), mouse anti-N-cadherin (1:200), and mouse anti-Fasciclin 3 (1:20). Secondary antibodies were all used at 1:200: anti-mouse Cy3 and anti-rat Alexa 647 (Jackson Laboratories), anti-rabbit Alexa 488, and anti-rat Alexa 647 (Thermo Fisher Scientific). Phalloidin (Sigma) and DAPI were used at 1:200 to label F-Actin and DNA, respectively.
Image processing and analysis
PC counting and BC migration were assessed using a Leica DMRB epifluorescence microscope. Confocal images were acquired with a Leica SP8 inverted microscope driven by Las-X software, using 63x or 40x oil immersion lenses. Quantifications on confocal stacks were performed using FIJI and annotated with Affinity Designer. For GFP + FC number, we used only one confocal section passing through the middle of each follicle (visible PCs) to have consistent data regarding cell positions. For GFP quantification, total GFP signal sum projections were done. In Figure 1, measures correspond to “Raw Integrated Density” quantification of 25% follicle length at poles, whereas in Figure 3 and Supplementary Figure S4, they correspond to “Mean Grey Value” quantification of the entire follicle. All statistical analyses were performed using GraphPad PRISM.
RT-qPCR
RT-qPCR was performed on 20 pairs of ovaries, as previously described (Parvy et al., 2012), using the following primers:
Mirror—5′-GAACACCGAGGATAACGATCTG-3’/5′-CGGTCATCATGTCGCCAA-3′
H15–5′-GGTGAAGTTGACAAACAACGAG-3’/5′-TTGGGACTGCCGGGTAT-3′
mRNA amounts were normalized with RPL49 mRNA values, used as a reference.
Proximity ligation assay (PLA)
The Duolink PLA was performed according to the manufacturer’s instructions (Sigma-Aldrich), using mouse anti-GFP and rabbit anti-Stat92E (D. Montell) antibodies. During dissection, the muscular sheath was removed manually to allow penetration of the components in FCs, and Tween 0.1% was used instead of Triton 0.3% that we normally use for regular immunostaining.
Co-immunoprecipitation assays
Proteins were chemically cross-linked with DSP (Thermo Fisher Scientific) prior to cell lysis. Co-immunoprecipitation assays were performed on ovary extracts from 50 females according to the manufacturer’s procedure, using GFP magnetic agarose beads (Chromotek) or Dynabeads™ protein G (Invitrogen) coated with an anti-E-cadherin antibody with 10 mM Tris-HCl pH7.5, 300 mM NaCl, 0.05% NP40 and 0.5 mM EDTA or PBS-Triton 0.02% wash buffer respectively. Proteins were resolved on NuPAGE™ 4–12% Bis-Tris gels (Invitrogen) and visualized by immunoblotting using mouse anti-GFP (1:1000; Roche) or rat anti-E-cadherin (1:250, DSHB) primary antibodies, and HRP anti-mouse (1:1000; Invitrogen) or anti-rat (1:5000; Sigma) secondary antibodies.
All experiments have been conducted between two and three times independently, and similar results were obtained in all cases.
Results
JAK-STAT signaling activity pattern is dynamic through oogenesis and becomes asymmetric between anterior and posterior follicle poles from stage 7 onward
In order to study JAK-STAT signaling regulation during oogenesis, we made use of a 10XSTAT92E-GFP reporter, which drives the expression of GFP-encoding sequences in cells where the pathway is physiologically active (Bach et al., 2007). We observed that JAK-STAT activity presents a gradient in FCs with the highest activity at each follicle pole as expected, but activity did not seem identical at all stages, with a striking difference between anterior and posterior poles from mid-oogenesis, suggesting that signaling activity is finely regulated (Figures 1B–D). It is of note that we only analyzed follicles up to stage 8 since, after this stage, the anterior JAK-STAT active BCs delaminate from the follicular epithelium and migrate through nurse cells towards the oocyte, rendering analyses more difficult. We quantified the reporter activity at each pole between stages 4 and 8 using two complementary approaches: the first by determining the mean numbers of GFP-positive (GFP+) cells (Figure 1E), and the second by quantifying GFP intensities (Figure 1F). During follicle maturation, the mean GFP + FC number indicates a small reduction of the JAK-STAT gradient size at the anterior pole over time. The same tendency of fewer GFP + FCs is observed at the posterior pole from stage 7, which becomes statistically significant and more important than at the anterior pole at late stage 8, thus establishing an asymmetry in JAK-STAT signaling between poles (Figure 1E). In addition, while the gradient size decreases, there is an increase in signaling intensity at both poles between stages 7 and 8, but signaling intensity was significantly lower at the posterior pole (Figure 1F). Both techniques thus confirmed that JAK-STAT signaling activity is symmetrical at both poles up to stage 7 but becomes asymmetrical at stage 8. Our results, therefore, uncover an asymmetry of JAK-STAT signaling in the number and intensity of active cells between anterior and posterior poles.
To verify this result, we tested another readout for JAK-STAT signaling. While in some cases the JAK-STAT receptor is active when it is localized at the plasma membrane (Blouin et al., 2016), receptor endocytosis can sometimes be a requirement for signaling activity (Marchetti et al., 2006). In all cases, receptor endocytosis reflects active transduction. In the follicular epithelium, the accumulation of Dome-GFP vesicles has been described as an indicator of efficient endocytosis, thus being an indicator of JAK-STAT activity (Silver et al., 2005; Devergne et al., 2007; Sahu et al., 2017). We expressed a GFP-fused form of Dome in all FCs with the fruitless-Gal4 (fru-Gal4) driver (Supplementary Figure S1A for driver pattern) and assessed JAK-STAT signaling by counting the number of cells containing Dome-positive vesicles (Figures 1G–I). A progressive decrease in mean numbers of FCs containing Dome vesicles is observed at both poles, confirming that JAK-STAT gradient size decreases with time. Consistently with our previous results, the decrease is smaller at the anterior pole than at the posterior pole, creating an asymmetry in JAK-STAT signaling between poles. There is a slight lag between the translation of the signaling asymmetry into a visible output between the two reporters, the asymmetry being visible with Dome endocytosis from stage 7 and with 10XSTAT92E-GFP from stage 8, reflecting an expected difference in the kinetics between these two types of reporters.
Taken together, and as schematized in Figure 1M, our findings demonstrate that, although anterior and posterior follicle poles display similar levels of JAK-STAT signaling activity up to stage 6, fewer posterior than anterior FCs are active as of stage 7. This creates an asymmetry between poles in the JAK-STAT signaling gradient size and intensity that must be precisely regulated.
E-cadherin expression pattern is dynamic through oogenesis and becomes asymmetric between anterior and posterior follicle poles from stage 6 onward
Upd, secreted from PCs at each follicle pole, activates the JAK-STAT pathway in surrounding FCs. At stage 7, when we showed signaling becomes asymmetric, PCs have reached their final number of two at each pole. Hence, the asymmetry in JAK-STAT signaling activity cannot be explained by a difference in the number of ligand secreting cells. Rather, we hypothesized that a regulator could be acting within the follicular epithelium to control JAK-STAT signaling activity. In that case, the regulator should display similar dynamics in its expression, with an asymmetry between poles from stage 7 or slightly earlier to allow time for the JAK-STAT pathway to become asymmetric in response to its regulation. We tested several proteins that might respond to such criteria and found E-cadherin as a good candidate. During oogenesis, as reported previously (Godt and Tepass, 1998), E-cadherin is present in all follicle and germline cells, which can be observed with an E-cadherin immunostaining (Figures 1J,K). At the subcellular level, E-cadherin is detected differentially along the apico-basal axis: strong levels are observed at the apical membrane, where FCs not only interact together but also with germ cells (GCs), which represents an unusual E-Cadherin-mediated kind of adhesion as it occurs between different cell types (Godt and Tepass, 1998; González-Reyes and St Johnston, 1998), whereas lower levels are detected at the lateral AJs where FCs only interact with other FCs (Figure 1J). At the tissue level, although E-cadherin is distributed homogenously along the anterior-posterior axis until stage 5, stronger accumulation is observed in anterior compared to posterior FCs, the difference being accentuated at stages 7 and 8, while follicle size is increasing (Figures 1J,K). This result shows that E-cadherin distribution in FCs becomes asymmetric between anterior and posterior follicle regions from stage 6.
To determine whether the asymmetric distribution of E-cadherin in FCs along the anterior-posterior axis is due to post-translational modifications, affecting for instance protein stability or recycling, or if asymmetry is rather regulated at the transcriptional level, we used a transcriptional reporter (shotgun-lacZ). In this line, β-galactosidase detection reflects the activity of regulatory sequences of shotgun (shg), the gene encoding the E-cadherin protein in Drosophila. We found homogenous expression of the shg-lacZ reporter in FCs until stage 5, which becomes differential between anterior and posterior regions at stage 6, except for expression in PCs that are maintained high at all stages (Figure 1L). This demonstrates that the E-cadherin asymmetry in FCs between anterior and posterior follicle regions being set at stage 6 is regulated at the transcriptional level.
Altogether our findings show that JAK-STAT activity and shg expression display similarities in their spatial and temporal dynamics in the follicular epithelium during oogenesis. Notably, by mid-oogenesis, both E-cadherin levels and JAK-STAT activity are high in the anterior follicles, while they are significantly lower in the posterior (Figure 1M), raising the hypothesis that they could be involved in similar processes.
E-cadherin, like JAK-STAT signaling, is necessary for PC apoptosis
We, thus, wondered if E-cadherin and JAK-STAT signaling correlate in function during oogenesis. We investigated this hypothesis by using RNAi lines targeting shg and upd. To assess whether our tools were efficient, we first tested if we could observe known phenotypes associated with shg and upd knock-downs with these RNAi lines. It has been independently shown that E-cadherin (Niewiadomska et al., 1999; Pacquelet and Rørth, 2005) and JAK-STAT signaling (Beccari et al., 2002; Silver et al., 2005) are involved in BC migration, a cellular process occurring between stage 9 and 10. In addition, a genetic interaction between stat92E and shg was reported in BC migration (Silver and Montell, 2001). We used the upd-Gal4 driver to target RNAi against upd specifically in PCs (Supplementary Figure S1B for driver pattern), thus decreasing JAK-STAT signaling in FCs from stage 2 onward. We assessed BC migration in the resulting follicles at stage 10, when the migration process is complete in controls. 97% of follicles exhibit BC migration delay in an upd knock-down context (Supplementary Figure S2B,E). We next used two RNAi lines against shg, which we showed were efficient at decreasing E-cadherin levels in FCs (#1) or in GCs (#2) when driven with the fru-Gal4 or the nos-Gal4 lines respectively (Supplementary Figure S1A,B for driver patterns), as revealed by the absence of E-cadherin signal detection in the corresponding tissue (Supplementary Figure S2C,D). In both cases, we observed BC migration defects in more than 90% of stage 10 follicles (Supplementary Figure S2C–E). The RNAi tools with the Gal4 lines used are therefore efficient to affect JAK-STAT signaling and E-cadherin functions, leading to the expected BC migration delay phenotypes.
We, thus, used the same tools to investigate whether E-cadherin expression and JAK-STAT signaling are also involved in another common process during oogenesis. PC apoptosis takes place between stages 2 and 5 of oogenesis, resulting in only two PCs at each pole (Besse and Pret, 2003, Figure 2A). JAK-STAT signaling has been shown to regulate morphogenesis leading to PC apoptosis by monosis in a non-cell-autonomous manner (Borensztejn et al., 2013; Torres et al., 2017, Figures 2B,E). We knocked down shg using the fru-Gal4 driver, which results in the absence of E-cadherin staining in FCs, without disturbing epithelial integrity as N-cadherin is also expressed in FCs thereby ensuring the maintenance of the follicular epithelium even in the absence of E-cadherin (Supplementary Figure S3A,B). We then assessed whether completion of PC apoptosis occurred by counting the number of PCs at each pole from stages 4–8. An excess of PCs (>2 per group at stage 7) was observed in the shg knock-down, with a significant difference from the control at all stages, reflecting a defect in the apoptotic process (Figures 2C,F). Similar results were obtained using yet another RNAi line against shg (#3) with a second FC driver (traffic jam-Gal4, tj-Gal4) (Supplementary Figure S1D for driver pattern and Supplementary Figure S4A). E-Cadherin, like the JAK-STAT pathway, is therefore required non-cell-autonomously in FCs for correct PC apoptosis.
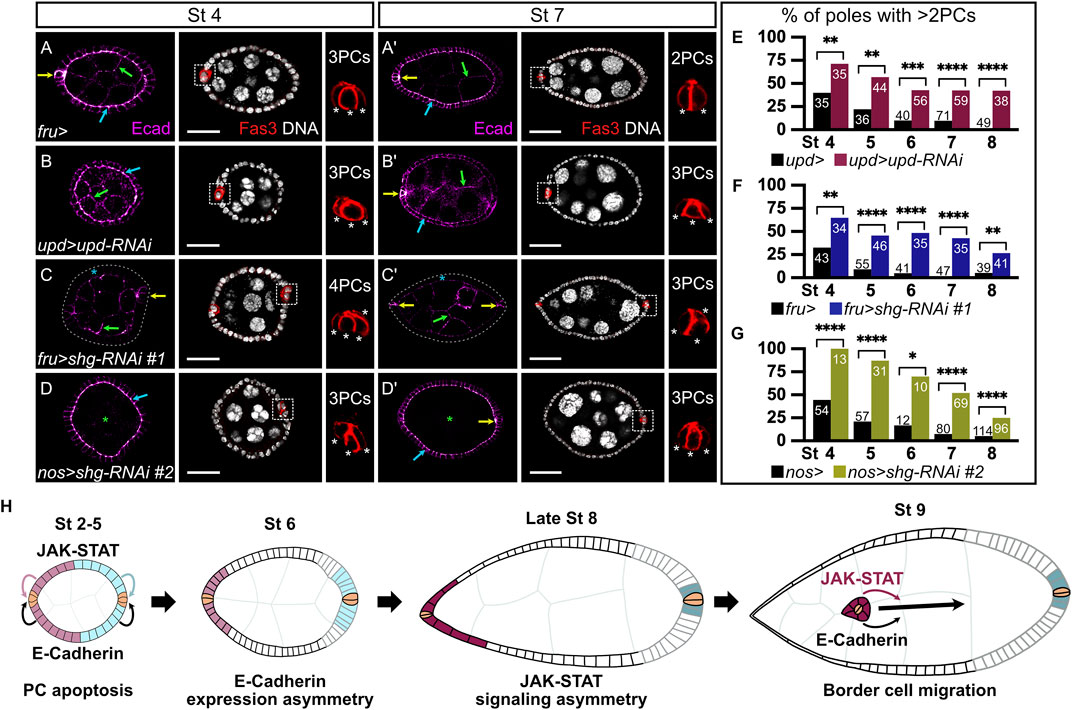
FIGURE 2. Somatic and germinal E-cadherin is necessary for JAK-STAT-mediated polar cell apoptosis. In all images and drawings, the anterior is to the left, except for polar cell (PC) magnifications for which apical side is up. Follicles at stages 4 (A–D) and 7 (A′–D′) of oogenesis are shown. E-cadherin (Ecad, “magenta hot” filter, from magenta, low intensity, to white, high intensity) and the PC marker Fasciclin3 (Fas3, red) are detected by immunostainings and DNA by DAPI (grey). E-cadherin detection is indicated in follicle cells (FCs) by blue arrows, in pCs by yellow arrows, and in germline cells by green arrows. To assess the efficiency of PC apoptosis after stage 5 of oogenesis, we used Fas3 staining to count PC numbers at various stages. In the images with Fas3 and DAPI stainings, each white dotted box highlights one PC group, which is magnified to the right to depict how pCs are counted (each white asterisk indicates one PC). PCs at the opposite follicle pole are not always visible on the displayed z sections. (A,A′) Follicles from females carrying the fru-Gal4 driver, as a control for PC apoptosis. Although supernumerary pCs can still be detected at stage 4 (A), only 2 are normally found at stage 7 (A′). E-cadherin is detected in PCs, in germline cells and apico-laterally in FCs. (B,B′) Follicles from females expressing RNAi targeting upd in pCs driven by upd-Gal4. These follicles present a defect in PC apoptosis, as illustrated by the presence of supernumerary pCs at stage 7 (B′). (C,C′) Follicles from females expressing the RNAi line #1 targeting shg driven by fru-Gal4 to knock-down shg in FCs, except pCs where fru-Gal4 is not expressed. E-cadherin is not detected in FCs (blue asterisk), but is still detected in the germline and in PCs. Gray dotted line delimits the basal side of the follicular epithelium. The presence of supernumerary pCs at stage 7 (C′) indicates a defect in the PC apoptosis process. (D,D′) Follicles from females expressing the RNAi line #2 targeting shg with the germline specific nos-Gal4 driver, showing that E-cadherin is not detected in germ cells (green asterisk), but is maintained in the follicular epithelium and PCs. The presence of supernumerary pCs at stage 7 (D′) indicates a defect in the PC apoptosis process. (E–G) Apoptosis defect quantification illustrated by the percentage of poles with more than 2 PCs at various stages of oogenesis when upd is knocked down in PCs (E, pink bars), and when shg is knocked down in FCs (F, blue bars) or in germ cells (G, green bars) compared to control conditions (females carrying only the corresponding Gal4 drivers, black bars). Numbers in bars correspond to the number of counted poles. As in the JAK-STAT knock-down condition, a significant perturbation in PC apoptosis is observed upon somatic and germinal shg knock-down at all stages of oogenesis analyzed. (H) Schematic drawing representing the E-cadherin expression pattern (black and gray lines for high and low E-cadherin, respectively), together with JAK-STAT signaling dynamics (pink and blue-filled FCs, same color code as presented in Figure 1) in the follicular epithelium and recapitulating JAK-STAT and E-cadherin shared roles at different stages of oogenesis: for PC apoptosis between stages 2 and 5 and for border cell migration at stage 9. pCs are indicated in beige. St: stage. Statistical tests: Chi2. Stars indicate statistically significant differences. *p < 0.05, **p < 0.01, ***p < 0.001, and ****p < 0.0001. Scale: (St 4) 20 µm, (St 7) 30 µm.
E-cadherin can be found apically in FCs, at the interface with GCs (FC-GC contact) and laterally, at the interface between FCs (at FC-FC AJs only). To gain more insight as to which FC interface is involved in PC apoptotic extrusion, we decreased E-cadherin levels in GCs by knocking down shg from the germline with the RNAi line #2 driven by the nos-Gal4 driver, which is expected to disturb junctions at the FC-GC interface. As with the somatic shg knock-down, epithelial integrity is maintained in the germline knock-down (Supplementary Figure S3C), and extra PCs, indicative of apoptosis defects, are observed with significant differences at all stages compared to controls (Figures 2D,G). Our data thus show that decreasing E-cadherin in FCs or in GCs disturbs PC apoptosis in a non-cell-autonomous manner, similarly to decreasing JAK-STAT pathway activity in the follicular epithelium. Hence, E-cadherin and JAK-STAT signaling are both involved in two distinct morphogenesis processes that occur at different stages of oogenesis, namely PC apoptotic extrusion and BC migration, as schematized in Figure 2H. Altogether, our data demonstrate that E-cadherin accumulation and JAK-STAT signaling partially overlap in dynamics and share functions during oogenesis.
E-cadherin regulates JAK-STAT activity positively in the follicular epithelium during oogenesis
As E-cadherin is distributed in a larger domain than the one covered by JAK-STAT activity, and given that E-cadherin asymmetry between poles starts at stage 6, just before the asymmetry in JAK-STAT activity is visible, at stage 7, we wondered whether E-cadherin could be a general regulator of JAK-STAT signaling in the follicular epithelium. To test this hypothesis, we decreased E-cadherin levels by knocking down shg in FCs, in flies carrying the 10XSTAT92E-GFP transcriptional reporter, which allows for the assessment of JAK-STAT activity levels. As a control, we first decreased JAK-STAT activity by targeting RNAi against hop, encoding the kinase of the pathway, in FCs. As expected, when hop was knocked down, the JAK-STAT pathway activity reporter was strongly reduced at all stages, compared to controls (Figures 3A,B). Mean GFP intensity was quantified on sum projections of total GFP in the whole follicular epithelium, and, accordingly, a significant decrease was found at all stages considered (Figure 3E). When E-cadherin levels were decreased in FCs by knocking down shg (RNAi line #1), similar results were obtained, with the 10XSTAT92E-GFP reporter activity being reduced in the whole epithelium and mean GFP intensity being significantly decreased at all stages analyzed as compared to controls (Figures 3C,F). We confirmed that knocking down shg in FCs results in reduced JAK-STAT activity by expressing the shg RNA line #3 with tj-Gal4 (Supplementary Figure S1D for driver pattern and Supplementary Figures S4B–D).
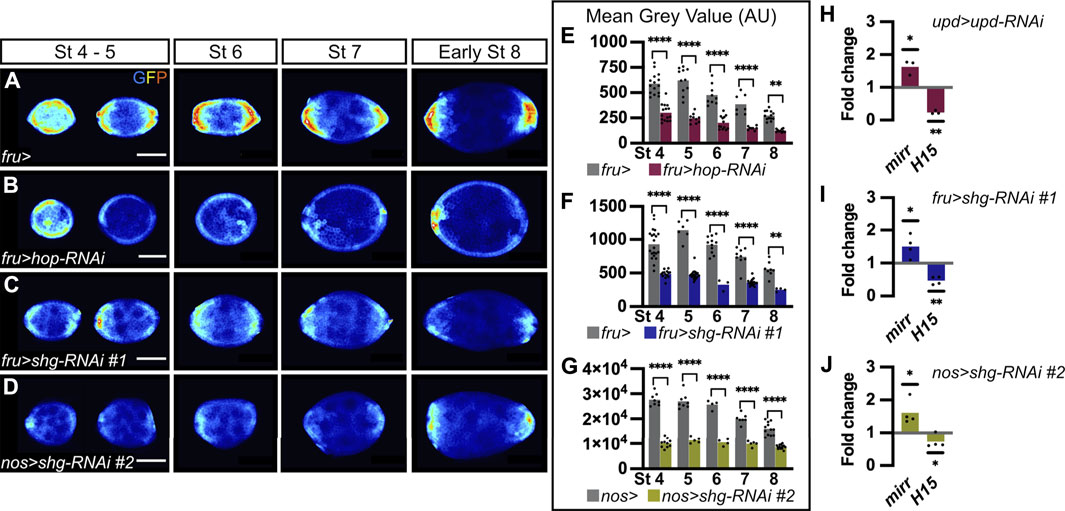
FIGURE 3. E-cadherin is a positive regulator of JAK-STAT signaling. In all images, the anterior is to the left. (A–D) Follicles at various stages of oogenesis from 10XSTAT92E-GFP hemizygous females in four different genetic backgrounds. GFP immunostaining (“royal” filter, sum projection of total GFP signal) reflects JAK-STAT activity at each pole. (A) Follicles from females carrying the fru-Gal4 driver are used as a control to assess JAK-STAT activity, which forms a gradient in follicle cells (FCs) at each pole throughout oogenesis. (B) Follicles from females expressing a RNAi targeting hop in FCs driven by fru-Gal4 to decrease JAK-STAT signaling, as illustrated by weak GFP signal at each pole from stage 4 onward. Follicles from females expressing the RNAi line #1 targeting shg driven by fru-Gal4 in FCs (C) or the RNAi line #2 also targeting shg but driven in germ cells (GCs) by nos-Gal4 (D). In both knock-down conditions, GFP signal is low in the entire follicular epithelium from stage 4 onward. (E–G) Mean Grey Value quantifications of entire follicles at various stages of oogenesis. In graphs, bars represent mean measurements and each dot corresponds to one measurement. Quantifications were made on sum projections of total GFP signal upon knock-down of hop (E, pink bars) and shg in FCs (F, blue bars), and shg in GCs (G, green bars), compared to control conditions (females carrying the corresponding Gal4 drivers, grey bars). As for JAK-STAT pathway inhibition, GFP intensity is significantly lower than in controls upon somatic and germinal shg knock-down at all stages analyzed. In graph G, the mean gray value scale is higher because images were taken with higher bit depth and pixel size than for graphs E-F. (H–J) RT-qPCR analysis of mirror (mirr) and H15 transcript abundance, negative and positive targets, respectively, of the JAK-STAT pathway. In graphs, bars represent mean measurements from independent experiments and each dot corresponds to one independent experiment. Processed RNAs were extracted from entire ovaries of females expressing RNAi targeting upd in polar cells (H, upd-Gal4), shg in FCs (I, fru-Gal4) and shg in GCs (J, nos-Gal4). Expression of both transcripts are normalized with RPL49 expression and compared to relative expression in control conditions (females carrying the corresponding Gal4 drivers). As upon JAK-STAT signaling inhibition (H, upd > upd-RNAi), mirr and H15 relative expressions increase and decrease, respectively, upon somatic and germinal shg knock-down (I, fru > shg-RNAi and J, nos > shg-RNAi, respectively), indicating a decrease in JAK-STAT signaling under both conditions. St: stage. Statistical tests: (E–G) Ordinary one-way ANOVAs (H–J) One-tailed ratio paired t-test. Stars indicate statistically significant differences. *p < 0.05, **p < 0.01 and ****p < 0.0001. Scale: 30 µm.
As we found that E-cadherin is required in FCs and GCs to regulate PC apoptosis, we wondered if both FC and GC E-cadherin were also involved in the regulation of JAK-STAT signaling. We thus knocked down shg in the germline with the nos-Gal4 driver. Again, we found the JAK-STAT transcriptional reporter activity reduced in the whole follicular epithelium, with mean GFP intensity being significantly decreased at all stages compared to control (Figures 3D,G). This suggests that E-cadherin is required at FC-FC and FC-GC interfaces to regulate JAK-STAT activity in the follicular epithelium. In summary, our findings, which were confirmed with three different RNAi lines and three different Gal4 drivers, demonstrate that shg expression is required in FCs and in GCs for proper JAK-STAT activity in the follicular epithelium, suggesting that E-cadherin is a positive regulator of JAK-STAT signaling during oogenesis.
To confirm these findings by monitoring JAK-STAT pathway activity in a different way, we quantified the expression of JAK-STAT known target genes by RT-qPCR. mirror (mirr) is negatively regulated in response to JAK-STAT signaling (Xi et al., 2003), whereas H15 is positively activated by the pathway (Fregoso Lomas et al., 2016). Accordingly, we found that mirr was upregulated and H15 downregulated in ovarioles in which RNAi was used to knock-down upd in PCs, thus decreasing JAK-STAT signaling in the follicular epithelium (Figure 3H). When E-cadherin levels were decreased by knocking down shg in FCs or in GCs, similar mirr upregulation and H15 downregulation were obtained (Figures 3I,J). Given that similar changes in the expression of JAK-STAT target genes are detected upon decreasing JAK-STAT signaling and E-cadherin levels, this further confirm that E-cadherin is a positive regulator of JAK-STAT signaling during oogenesis.
E-cadherin and Stat92E are part of a physical complex in the follicular epithelium during oogenesis
The importance of Stat92E localization for efficient signaling activity has been shown in the embryo ectoderm epithelium, where its apical localization is ensured by interaction with the polarity protein Bazooka (Baz), a Drosophila Par3 homolog (Sotillos et al., 2008). To find out if the apical localization of Stat92E is conserved in ovaries, we looked at control follicles stained with an anti-Stat92E antibody. Besides the expected nuclear staining at follicle poles and in border cells at stage 9, where JAK-STAT activity is the highest, we also detected endogenous Stat92E apically in FCs (Figure 4A). Similarly, when we overexpressed a GFP-tagged version of Stat92E, besides the enrichment in nuclei at follicle poles, Stat92E was also localized apically and laterally in FCs from stage 3 to stage 9, partially overlapping with E-cadherin (Figure 4B). To gain more insight into the molecular mechanism by which E-cadherin could regulate JAK-STAT activity in follicles, we tested whether E-cadherin and Stat92E were in close proximity in FCs by performing a proximity ligation assay (PLA). For this, we used anti-Stat92E and anti-GFP antibodies on ovaries from shg::GFP Knock-In flies to test for E-cadherin-GFP/Stat92E proximity. Although it is not easy to detect PLA signals in ovaries due to penetration issues (Mannix et al., 2019), we found a significantly higher number of follicles with PLA foci in shg::GFP ovaries, as compared to the negative control that was nearly devoid of PLA signal (Figures 4C–E), suggesting that E-cadherin and Stat92E can be found in close proximity in FCs.
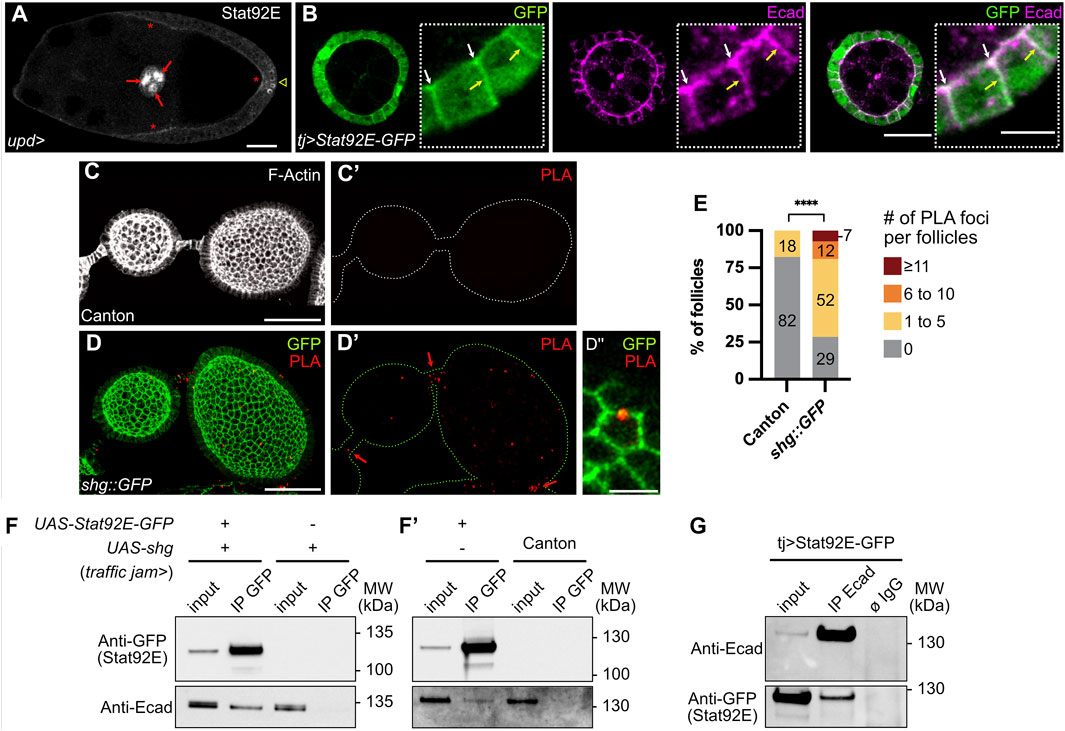
FIGURE 4. E-cadherin and Stat92E are part of a physical complex in the follicular epithelium. In all images, the anterior is to the left. (A) Stage 9 follicle of a control female (upd-Gal4/+) in which the transcription factor Stat92E is immunodetected (grey) on the apical side of follicle cells (FCs, red stars). Nuclear Stat92E is also detected at high levels in border cells (red arrows) and at the posterior pole, where the JAK-STAT pathway is highly active. Sum z projection of 5 confocal sections. (B) Stage 4 follicle from a female overexpressing UAS-Stat92E-GFP in FCs driven by traffic jam-Gal4 (tj). Immunostainings of GFP (green) and E-cadherin (Ecad, magenta) on one confocal section show that both Stat92E-GFP and E-cadherin have localized apically (white arrows) and laterally (yellow arrows) and that both signals coincide partially at apical and lateral junctions. (C,D) Proximity Ligation Assay (PLA) performed with an anti-Stat92E antibody and an anti-GFP antibody on ovaries from Canton females, used as negative controls (C) and females bearing a shg::GFP construct (Knock-In, (D). Images are max projections of all confocal sections except for the magnification (D″), presenting one confocal section. (C,C′) One representative control follicle in which no PLA foci are detected. F-actin staining (phalloidin, grey) allows to visualize FCs. (D,D′) PLA foci (red) are detected in shg::GFP follicles and stalk cells (red arrows). Native GFP signal (green) shows that PLA foci are in close proximity with E-cadherin:GFP rich junctions in FCs (see magnification in D″). (E) Quantification of PLA foci in Canton and shg::GFP follicles. PLA foci were counted on each z section, and total foci numbers per follicle were classified into four categories: 0 focus; 1 to 5 foci; 6 to 10 foci; 11 and more foci. In the graph, the size and the numbers within the bars indicate the percentage of follicles in each category showing that the number of follicles with PLA foci is significantly higher in shg::GFP flies than in Canton flies. PLA foci in stalk cells were not quantified (F,F′,G) Western blots showing results of immunoprecipitations (IP) on total ovary protein extracts (input) from females expressing or not UAS-Stat92E-GFP and/or UAS-shg in FCs driven by tj-Gal4. Blots were probed with anti-GFP or anti-Ecad antibodies. (F,F′) IP using GFP-trap beads. The extracts from shg overexpression condition and the canton extract are negative controls showing that E-cadherin does not, in the absence of Stat92E-GFP, bind to GFP-trap beads (lanes 4). Overexpressed (F, lane 2) and endogenous (F′, lane2) E-cadherin proteins are co-immunoprecipitated with Stat92E-GFP, showing E-cadherin and Stat92E-GFP are part of a physical complex. (G) Reverse IP using anti-Ecad coated beads. The non-coated beads condition (ø IgG) is a negative control showing that neither E-cadherin nor Stat92E-GFP binds specifically to the beads. Stat92E-GFP is co-immunoprecipitated with endogenous E-cadherin (lane 2), confirming that E-cadherin and Stat92E-GFP are part of a physical complex. #: Number. MW: Molecular Weight. Statistical tests: (E) Fisher test comparing the number of follicles with 0 and with at least 1 PLA foci. Number of stage 2–8 follicles analyzed: Canton n = 45, shg::GFP n = 42. Stars indicate statistically significant differences. ****p < 0.0001. Scale: (A,C,D) 30 µm (B) 20 µm. All magnifications: 5 µm.
Finally, we tested whether E-cadherin and Stat92E could interact together in ovaries by performing co-immunoprecipitation assays. For this, Stat92E-GFP and shg were overexpressed in FCs with the tj-Gal4 driver, and co-immunoprecipitation was tested by using beads bound with anti-GFP antibodies (Figure 4F,F′). When only shg is overexpressed, E-cadherin is not immunoprecipitated from ovary extracts incubated with anti-GFP beads (Figure 4F, lane 4). However, when both Stat92E-GFP and shg are co-overexpressed, E-cadherin is co-immunoprecipitated with Stat92E-GFP from ovary extracts incubated with anti-GFP beads (Figure 4F, lane 2). Endogenous E-cadherin was also co-immunoprecipitated from flies expressing only Stat92E-GFP in FCs (Figure 4F’, lane 2). To confirm these results, we also performed the reverse immunoprecipitation on flies expressing only Stat92E-GFP in FCs and succeeded in co-immunoprecipitating Stat92E-GFP from E-Cadherin-coated beads, whereas no Stat92E was immunoprecipitated with the beads alone (Figure 4G). Our results indicate that Stat92E-GFP and endogenous E-cadherin are part of the same physical complex in FCs.
Altogether, our study unravels that E-cadherin is a new positive regulator of the JAK-STAT pathway during oogenesis and that E-cadherin and Stat92E are part of a complex in FCs, suggesting that E-cadherin could modulate JAK-STAT signaling in these cells through physical binding to Stat92E.
Discussion
The results presented here reveal that E-cadherin is necessary for optimal JAK-STAT signaling in the Drosophila follicular epithelium during oogenesis. They also show that shg is expressed differentially at follicle poles, leading to lower E-cadherin accumulation in the posterior region from mid-oogenesis, compared to the anterior region, and that JAK-STAT signaling displays a similar asymmetry. The decrease in E-cadherin levels at the posterior pole is therefore likely responsible for the concurrent decrease in JAK-STAT signaling. It will be interesting in the future to elucidate whether the asymmetry in anterior-posterior JAK-STAT signaling in follicles has a functional significance in their development.
Our study also shows that E-cadherin is necessary for both FCs and adjacent GCs for full JAK-STAT activation in the follicular epithelium in proximity to ligand-producing PCs at follicle extremities. This implies that it is the role of E-cadherin in cell–cell contact, including at the FC-GC interface, that is important for high levels of JAK-STAT signaling. In addition, our work demonstrates that Stat92E is in a complex with E-cadherin in FCs. These results provide potential mechanistic models for the role of E-cadherin in activating JAK-STAT signaling. Indeed, the importance of JAK-STAT components subcellular localization has been demonstrated in FCs, as localization of upd mRNA, Upd secretion (Van de Bor et al., 2011) and Dome endocytosis (Devergne et al., 2007) all occur apically. Since we found some Stat92E localized apically in FCs and since the majority of E-cadherin is also detected apically in these cells, it is possible that the E-cadherin-Stat92E interaction allows Stat92E accumulation in proximity to the apically-localized Dome receptor. This polarization of Stat92E in a permissive subdomain of the plasma membrane may mediate Dome conformational change or stabilize the Dome-Stat92E complex at the membrane, leading to more efficient signaling. Similar mechanisms have been demonstrated in mammals, such as in human fibroblasts, where IFN-γR localization in either membrane lipid or actin nanodomains can have, respectively, an inhibiting or a permissive action on JAK activation, by regulating a conformational change in the receptor (Blouin et al., 2016).
Precedent for polarized JAK-STAT signaling also exists in Drosophila since, in the embryonic ectoderm epithelium, apical receptor localization dictates signal transduction (Hombría and Sotillos, 2008). In these cells, subapical accumulation of cytoplasmic inactive Stat92E depends on Par-3 (Sotillos et al., 2008), their physical interaction being mediated by Src kinases (Sotillos et al., 2013). Therefore, polarized apical JAK-STAT signaling not only in the embryonic ectoderm but also in the follicular epithelium (our present findings) may involve interactions with the transmembrane proteins Par-3 and E-cadherin, respectively. Our findings, thus, extend the phenomenon of polarized apical JAK-STAT signaling to a second epithelial tissue in Drosophila, the follicular epithelium.
It is possible that Par-3 also associates with the E-cadherin-Stat92E complex, which could contribute to apically polarized JAK-STAT signaling in ovaries. Indeed, Par-3 is physically associated with AJs in different species (Coopman and Djiane, 2016; Thompson, 2022), and Stat92E interacts with Par-3 in the Drosophila embryo (Sotillos et al., 2008). Consequently, it has been proposed, although it was not demonstrated, that, generally, Par-3 may form a bridge between E-cadherin and Stat92E, which retains Stat92E at the plasma membrane (Ramirez Moreno et al., 2021).
Finally, E-cadherin could also regulate JAK-STAT signaling outside of the ovary as both E-cadherin and JAK-STAT are involved in other common processes, such as germline stem cell maintenance in Drosophila testis (Wang et al., 2006). Although JAK-STAT signaling regulation by E-cadherin has not been described in Drosophila before the present study, in mammals, cadherin activation of JAK-STAT signaling has been reported in several systems. In rat testis, the short-type PB-cadherin, a classical cadherin that co-immunoprecipitates with JAK2, is necessary for JAK-STAT activation and GC survival (Wu et al., 2005). In mouse embryonic stem cells, E-cadherin association with the LIFR-GP130 receptor complex and its consequent stabilization are important to maintain JAK-STAT signaling and pluripotency (del Valle et al., 2013). In cultures of a squamous carcinoma cell line, E-cadherin and STAT3 colocalize and E-cadherin-based cell–cell contacts are necessary for STAT3 activity (Onishi et al., 2008; Geletu et al., 2013). Our findings are, thus, particularly exciting since they suggest conservation of JAK-STAT regulation by E-cadherin between mammals and Drosophila and, therefore, strengthen the use of the Drosophila follicular epithelium as an excellent model to study JAK-STAT pathway regulation.
Data availability statement
The original contributions presented in the study are included in the article/Supplementary Material; further inquiries can be directed to the corresponding author.
Author contributions
CM performed the vast majority of experiments and data analyses and participated in experimental design. AT performed some experiments and contributed to initiating the project. SN and FC performed co-immunoprecipitation and proximity ligation assays and analyses. MP and JM participated in setting up and improving protocols and data interpretations of molecular biology and biochemistry experiments. A-MP and JM provided material and infrastructure and helped with discussions on the project. A-MP, JM, and MM obtained financial support. MM conceptualized and designed the research study, supervised the project, and performed some experiments. CM, A-MP, and MM wrote the manuscript. All authors critically read and approved the manuscript.
Funding
This work was supported by a 3-year-PhD fellowship obtained from the “Ministère de l’Enseignement Supérieur et de la Recherche” for CM, by the Centre National de Recherche Scientifique (CNRS), Paris-Saclay, and Versailles St-Quentin-en-Yvelines Universities, by a grant from the “Ligue contre le cancer” for laboratory expenses, and by a grant from the “Fondation ARC pour la recherche sur le cancer” for a year of salary expenses for CM.
Acknowledgments
The authors wish to thank Erika Bach, Christian Ghiglione, Jean-Paul Vincent, Carsten Janke, Jean-René Huynh, Vincent Mirouse, Yang Hong, and Antoine Boivin for sharing fly stocks and Denise Montell and Steve Hou for sharing antibodies. They are also grateful to Fred Bernard for helpful discussions, and they thank Flybase, BDSC (Bloomington Drosophila Stock Center), and DSHB (Developmental Studies Hybridoma Bank) for resources.
Conflict of interest
The authors declare that the research was conducted in the absence of any commercial or financial relationships that could be construed as a potential conflict of interest.
Publisher’s note
All claims expressed in this article are solely those of the authors and do not necessarily represent those of their affiliated organizations, or those of the publisher, the editors, and the reviewers. Any product that may be evaluated in this article, or claim that may be made by its manufacturer, is not guaranteed or endorsed by the publisher.
Supplementary material
The Supplementary Material for this article can be found online at: https://www.frontiersin.org/articles/10.3389/fcell.2022.886312/full#supplementary-material
Abbreviations
AJ, adherens junction; BC, border cell; GC, germ cell; FC, follicle cell; PC, polar cell; shg, shotgun; upd, unpaired; hop, hopscotch; fru, fruitless; nos, nanos; tj, traffic jam; mirr, mirror; baz, bazooka.
References
Arbouzova, N. I., and Zeidler, M. P. (2006). JAK/STAT signalling in Drosophila: Insights into conserved regulatory and cellular functions. Development 133, 2605–2616. doi:10.1242/dev.02411
Bach, E. A., Ekas, L. A., Ayala-Camargo, A., Flaherty, M. S., Lee, H., Perrimon, N., et al. (2007). GFP reporters detect the activation of the Drosophila JAK/STAT pathway in vivo. Gene Expr. Patterns 7, 323–331. doi:10.1016/j.modgep.2006.08.003
Baksa, K., Parke, T., Dobens, L. L., and Dearolf, C. R. (2002). The Drosophila STAT protein, stat92E, regulates follicle cell differentiation during oogenesis. Dev. Biol. 243, 166–175. doi:10.1006/dbio.2001.0539
Beccari, S., Teixeira, L., and Rørth, P. (2002). The JAK/STAT pathway is required for border cell migration during Drosophila oogenesis. Mech. Dev. 111, 115–123. doi:10.1016/s0925-4773(01)00615-3
Besse, F., and Pret, A.-M. (2003). Apoptosis-mediated cell death within the ovarian polar cell lineage of Drosophila melanogaster. Development 130, 1017–1027. doi:10.1242/dev.00313
Blouin, C. M., Hamon, Y., Gonnord, P., Boularan, C., Kagan, J., Viaris de Lesegno, C., et al. (2016). Glycosylation-Dependent IFN-γR partitioning in lipid and actin nanodomains is critical for JAK activation. Cell 166, 920–934. doi:10.1016/j.cell.2016.07.003
Borensztejn, A., Boissoneau, E., Fernandez, G., Agnès, F., and Pret, A.-M. (2013). JAK/STAT autocontrol of ligand-producing cell number through apoptosis. Development 140, 195–204. doi:10.1242/dev.079046
Chen, Q., Giedt, M., Tang, L., and Harrison, D. A. (2014). Tools and methods for studying the Drosophila JAK/STAT pathway. Methods 68, 160–172. doi:10.1016/j.ymeth.2014.03.023
Coopman, P., and Djiane, A. (2016). Adherens Junction and E-Cadherin complex regulation by epithelial polarity. Cell. Mol. Life Sci. 73, 3535–3553. doi:10.1007/s00018-016-2260-8
del Valle, I., Rudloff, S., Carles, A., Li, Y., Liszewska, E., Vogt, R., et al. (2013). E-cadherin is required for the proper activation of the Lifr/Gp130 signaling pathway in mouse embryonic stem cells. Development 140, 1684–1692. doi:10.1242/dev.088690
Denef, N., and Schüpbach, T. (2003). Patterning: JAK-STAT signalling in the Drosophila follicular epithelium. Curr. Biol. 13, R388–R390. doi:10.1016/s0960-9822(03)00317-8
Devergne, O., Ghiglione, C., and Noselli, S. (2007). The endocytic control of JAK/STAT signalling in Drosophila. J. Cell Sci. 120, 3457–3464. doi:10.1242/jcs.005926
Fregoso Lomas, M., De Vito, S., Boisclair Lachance, J.-F., Houde, J., and Nilson, L. A. (2016). Determination of EGFR signaling output by opposing gradients of BMP and JAK/STAT activity. Curr. Biol. 26, 2572–2582. doi:10.1016/j.cub.2016.07.073
Geletu, M., Guy, S., Arulanandam, R., Feracci, H., and Raptis, L. (2013). Engaged for survival: From cadherin ligation to STAT3 activation. JAKSTAT 2, e27363. doi:10.4161/jkst.27363
Godt, D., and Tepass, U. (1998). Drosophila oocyte localization is mediated by differential cadherin-based adhesion. Nature 395, 387–391. doi:10.1038/26493
González-Reyes, A., St Johnston, D., and Gonzalez-Reyes, A. (1998). The Drosophila AP axis is polarised by the cadherin-mediated positioning of the oocyte. Development 125, 3635–3644. doi:10.1242/dev.125.18.3635
Hayashi, Y., Sexton, T. R., Dejima, K., Perry, D. W., Takemura, M., Kobayashi, S., et al. (2012). Glypicans regulate JAK/STAT signaling and distribution of the Unpaired morphogen. Development 139, 4162–4171. doi:10.1242/dev.078055
Hombría, J. C.-G., and Sotillos, S. (2008). Disclosing JAK/STAT links to cell adhesion and cell polarity. Semin. Cell Dev. Biol. 19, 370–378. doi:10.1016/j.semcdb.2008.06.002
Khammari, A., Agnès, F., Gandille, P., and Pret, A.-M. (2011). Physiological apoptosis of polar cells during Drosophila oogenesis is mediated by Hid-dependent regulation of Diap1. Cell Death Differ. 18, 793–805. doi:10.1038/cdd.2010.141
Manning, L. A., Weideman, A. M., Peercy, B. E., and Starz-Gaiano, M. (2015). Tissue landscape alters adjacent cell fates during Drosophila egg development. Nat. Commun. 6, 7356. doi:10.1038/ncomms8356
Mannix, K. M., Starble, R. M., Kaufman, R. S., and Cooley, L. (2019). Proximity labeling reveals novel interactomes in live Drosophila tissue. Development 146, dev176644. doi:10.1242/dev.176644
Marchetti, M., Monier, M.-N., Fradagrada, A., Mitchell, K., Baychelier, F., Eid, P., et al. (2006). Stat-mediated signaling induced by type I and type II interferons (IFNs) is differentially controlled through lipid microdomain association and clathrin-dependent endocytosis of IFN receptors. Mol. Biol. Cell 17, 2896–2909. doi:10.1091/mbc.E06-01-0076
McGregor, J. R., Xi, R., and Harrison, D. A. (2002). JAK signaling is somatically required for follicle cell differentiation in Drosophila. Development 129, 705–717. doi:10.1242/dev.129.3.705
Monahan, A. J., and Starz-Gaiano, M. (2013). Socs36E attenuates STAT signaling to optimize motile cell specification in the Drosophila ovary. Dev. Biol. 379, 152–166. doi:10.1016/j.ydbio.2013.03.022
Niewiadomska, P., Godt, D., and Tepass, U. (1999). DE-Cadherin is required for intercellular motility during Drosophila oogenesis. J. Cell Biol. 144, 533–547. doi:10.1083/jcb.144.3.533
Onishi, A., Chen, Q., Humtsoe, J. O., and Kramer, R. H. (2008). STAT3 signaling is induced by intercellular adhesion in squamous cell carcinoma cells. Exp. Cell Res. 314, 377–386. doi:10.1016/j.yexcr.2007.09.018
Pacquelet, A., and Rørth, P. (2005). Regulatory mechanisms required for DE-cadherin function in cell migration and other types of adhesion. J. Cell Biol. 170, 803–812. doi:10.1083/jcb.200506131
Pannekoek, W.-J., de Rooij, J., and Gloerich, M. (2019). Force transduction by cadherin adhesions in morphogenesis. F1000Res. 8, F1000 Faculty Rev-1044. doi:10.12688/f1000research.18779.1
Parvy, J.-P., Napal, L., Rubin, T., Poidevin, M., Perrin, L., Wicker-Thomas, C., et al. (2012). Drosophila melanogaster acetyl-CoA-carboxylase sustains a fatty acid–dependent remote signal to waterproof the respiratory system. PLoS Genet. 8, e1002925. doi:10.1371/journal.pgen.1002925
Ramirez Moreno, M., Stempor, P. A., and Bulgakova, N. A. (2021). Interactions and feedbacks in E-cadherin transcriptional regulation. Front. Cell Dev. Biol. 9, 701175. doi:10.3389/fcell.2021.701175
Saadin, A., and Starz-Gaiano, M. (2016). Identification of novel regulators of the JAK/STAT signaling pathway that control border cell migration in the Drosophila ovary. G3 (Bethesda) 6, 1991–2002. doi:10.1534/g3.116.028100
Sahu, A., Ghosh, R., Deshpande, G., and Prasad, M. (2017). A gap junction protein, Inx2, modulates calcium flux to specify border cell fate during Drosophila oogenesis. PLoS Genet. 13, e1006542. doi:10.1371/journal.pgen.1006542
Silver, D. L., Geisbrecht, E. R., and Montell, D. J. (2005). Requirement for JAK/STAT signaling throughout border cell migration in Drosophila. Development 132, 3483–3492. doi:10.1242/dev.01910
Silver, D. L., and Montell, D. J. (2001). Paracrine signaling through the JAK/STAT pathway activates invasive behavior of ovarian epithelial cells in Drosophila. Cell 107, 831–841. doi:10.1016/s0092-8674(01)00607-9
Sotillos, S., Díaz-Meco, M. T., Moscat, J., and Castelli-Gair Hombría, J. (2008). Polarized subcellular localization of Jak/STAT components is required for efficient signaling. Curr. Biol. 18, 624–629. doi:10.1016/j.cub.2008.03.055
Sotillos, S., Krahn, M., Espinosa-Vázquez, J. M., and Hombría, J. C.-G. (2013). Src kinases mediate the interaction of the apical determinant Bazooka/PAR3 with STAT92E and increase signalling efficiency in Drosophila ectodermal cells. Development 140, 1507–1516. doi:10.1242/dev.092320
Starz-Gaiano, M., Melani, M., Wang, X., Meinhardt, H., and Montell, D. J. (2008). Feedback inhibition of Jak/STAT signaling by apontic is required to limit an invasive cell population. Dev. Cell 14, 726–738. doi:10.1016/j.devcel.2008.03.005
Stevens, C. A., Revaitis, N. T., Caur, R., and Yakoby, N. (2020). The ETS-transcription factor Pointed is sufficient to regulate the posterior fate of the follicular epithelium. Development 147, dev189787. doi:10.1242/dev.189787
Thompson, B. J. (2022). Par-3 family proteins in cell polarity & adhesion. FEBS J. 289, 596–613. doi:10.1111/febs.15754
Torres, A. Y., Malartre, M., Pret, A.-M., and Agnès, F. (2017). JAK/STAT signaling is necessary for cell monosis prior to epithelial cell apoptotic extrusion. Cell Death Dis. 8, e2814. doi:10.1038/cddis.2017.166
Van de Bor, V., Zimniak, G., Cérézo, D., Schaub, S., and Noselli, S. (2011). Asymmetric localisation of cytokine mRNA is essential for JAK/STAT activation during cell invasiveness. Development 138, 1383–1393. doi:10.1242/dev.056184
Wang, H., Singh, S. R., Zheng, Z., Oh, S.-W., Chen, X., Edwards, K., et al. (2006). Rap-GEF signaling controls stem cell anchoring to their niche through regulating DE-cadherin-mediated cell adhesion in the Drosophila testis. Dev. Cell 10, 117–126. doi:10.1016/j.devcel.2005.11.004
Wu, J., Jester, W. F., and Orth, J. M. (2005). Short-type PB-cadherin promotes survival of gonocytes and activates JAK-STAT signalling. Dev. Biol. 284, 437–450. doi:10.1016/j.ydbio.2005.05.042
Xi, R., McGregor, J. R., and Harrison, D. A. (2003). A gradient of JAK pathway activity patterns the anterior-posterior axis of the follicular epithelium. Dev. Cell 4, 167–177. doi:10.1016/s1534-5807(02)00412-4
Keywords: JAK-STAT, signaling, oogenesis, E-cadherin, morphogenesis, apoptosis
Citation: Mallart C, Chalvet F, Netter S, Torres AY, Poidevin M, Montagne J, Pret A-M and Malartre M (2022) E-cadherin acts as a positive regulator of the JAK-STAT signaling pathway during Drosophila oogenesis. Front. Cell Dev. Biol. 10:886312. doi: 10.3389/fcell.2022.886312
Received: 28 February 2022; Accepted: 14 July 2022;
Published: 23 August 2022.
Edited by:
Jose Maria Carvajal-Gonzalez, University of Extremadura, SpainReviewed by:
Michelle Starz-Gaiano, University of Maryland, United StatesEyal Schejter, Weizmann Institute of Science, Israel
Copyright © 2022 Mallart, Chalvet, Netter, Torres, Poidevin, Montagne, Pret and Malartre. This is an open-access article distributed under the terms of the Creative Commons Attribution License (CC BY). The use, distribution or reproduction in other forums is permitted, provided the original author(s) and the copyright owner(s) are credited and that the original publication in this journal is cited, in accordance with accepted academic practice. No use, distribution or reproduction is permitted which does not comply with these terms.
*Correspondence: Marianne Malartre, bWFyaWFubmUubWFsYXJ0cmVAdW5pdmVyc2l0ZS1wYXJpcy1zYWNsYXkuZnI=
†Present Address: Alba Yurani Torres, Molecular, Cellular, and Developmental Biology Department, University of California, Santa Barbara, CA, United States
‡These authors have contributed equally to this work
§These authors share the last authorship