
94% of researchers rate our articles as excellent or good
Learn more about the work of our research integrity team to safeguard the quality of each article we publish.
Find out more
BRIEF RESEARCH REPORT article
Front. Cell Dev. Biol., 20 October 2022
Sec. Morphogenesis and Patterning
Volume 10 - 2022 | https://doi.org/10.3389/fcell.2022.1047363
This article is part of the Research TopicEditors' Showcase 2022: Insights in Morphogenesis and PatterningView all 8 articles
 Cencan Xing1,2†
 Zehua Zeng1†Yaqi Li2†Bo Gong2Weimin Shen2
 Roshan Shah1Lu Yan2Hongwu Du1*
 Anming Meng2,3*
Activation of nodal genes is critical for mesoderm and endoderm induction. Our previous study reported that zebrafish nodal genes ndr1/squint and ndr2/cyclops are coordinately regulated by maternal Eomesa, Hwa-activated β-catenin (Hwa/β-catenin) signaling, and Nodal autoregulation (Nodal/Smad2) signaling. However, the exact contribution and underlying mechanisms are still elusive. Here, we applied “causal inference” to evaluate the causal between the independent and dependent variables, and we found that Hwa/β-catenin and Smad2 are the cause of ndr1 activation, while Eomesa is the cause of ndr2 activation. Mechanistically, the different cis-regulatory regions of ndr1 and ndr2 bound by Eomesa, β-catenin, and Smad2 were screened out via ChIP-qPCR and verified by the transgene constructs. The marginal GFP expression driven by ndr1 transgenesis could be diminished without both maternal Eomesa and Hwa/β-catenin, while Eomesa, not β-catenin, could bind and activate ndr2 demonstrated by ndr2 transgenesis. Thus, the distinct regulation of ndr1/ndr2 relies on different cis-regulatory regions.
The Nodal proteins, which belong to a member of the transforming growth factor β (TGFβ) family, play an essential and conserved role in mesoderm and endoderm induction and specification (Schier and Talbot, 2005; Tian and Meng, 2006; Schier, 2009; Zinski et al., 2018). In the mouse, the zygotic homozygous mutants of the only Nodal gene failed to form most mesendodermal tissues (Zhou et al., 1993; Conlon et al., 1994). The disruption of Nodal-related genes in Xenopus led to severe defects in mesendoderm induction (Jones et al., 1995; Joseph and Melton, 1997; Osada and Wright, 1999; Agius et al., 2000; Takahashi et al., 2000; Luxardi et al., 2010). In the zebrafish, the removal of two nodal-related ligands, namely, ndr1/squint (sqt) and ndr2/cyclops(cyc), leads to the loss of endodermal tissues and most mesodermal tissues (Feldman et al., 1998).
As diffusible proteins, Nodal could propagate its expression in the adjacent marginal cells by Nodal autoregulation (Jones et al., 1996; Chen and Schier, 2002; Schier, 2009; Muller et al., 2012; Muller et al., 2013). Once Nodal signaling is activated, the intracellular effectors Smad2 and Smad3 could form a complex with Smad4 and translocate into the nucleus with the help of FoxH1 or/and other transcription factors and activate the target genes, including nodal genes themselves, which harbor the Nodal-responsive elements (NRE) within the first intron (Adachi et al., 1999; Norris and Robertson, 1999; Osada et al., 2000; Fan et al., 2007; Liu et al., 2011). However, the initiation of zygotic nodal genes is elaborately regulated in vertebrate embryos.
In both zebrafish and Xenopus, zygotic nodal transcripts are triggered by maternally controlled dorsally localized nuclear β-catenin (Feldman et al., 1998; Kofron et al., 1999; Kelly et al., 2000; Tao et al., 2005; Bellipanni et al., 2006). In maternal huluwa (hwa), mutant embryos, which lose the nuclear β-catenin in the dorsal blastomere (Yan et al., 2018), are also unable to initiate ndr1 in the dorsal blastodermal margin (Xing et al., 2022), providing an essential role of maternal Hwa-activated β-catenin signaling in activating zygotic nodal in dorsal blastomere. In Xenopus, the maternal expressed T-box transcription factor VegT collaboratively functions with β-catenin to trigger zygotic nodal genes in the vegetal cell mass (Zhang et al., 1998; Kofron et al., 1999; Agius et al., 2000; Takahashi et al., 2000; Rex et al., 2002; Xanthos et al., 2002). In the zebrafish, the maternal T-box transcription factor Eomesodermin (Eomesa) was assumed to be a zebrafish functional counterpart of frog VegT, as Eomesa could directly activate ndr1 and ndr2 in ventral and lateral blastodermal margins (Xu et al., 2014), which was further verified as sole maternal factors as well as maternal Hwa/β-catenin signaling for zygotic nodal genes expression in zebrafish embryos (Xing et al., 2022), in which the maternal Eomesa, maternal Hwa-activated β-catenin signaling, and Nodal autoregulation are required to weave the spatiotemporal and dynamical expression of ndr1 and ndr2 in zebrafish. However, it is unclear how these factors differentially contribute to activating the nodal genes with preference.
In this study, we constructed causal graphical models to uncover the cause of ndr1 and ndr2 activation and screened out the genomic sequences of ndr1 and ndr2 bound by maternal Eomesa, maternal Hwa-mediated β-catenin, and Nodal autoregulation-mediated Smad2, and further verified the cis-regulatory regions by transgenic constructs, providing pieces of evidence to precisely understand the dynamical activation of ndr1 and ndr2 during the mesendoderm induction in early zebrafish embryos.
The zebrafish Tuebingen strain was used as WT fish and for generating mutants. Meomesa, Mhwa, and Meomesa;Mhwa mutant embryos were genotyped and obtained as previously described (Xing et al., 2022). Embryos were maintained in Holtfreter’s water at 28.5°C. Developmental stages of the maternal mutant embryos were indirectly determined by observation of WT embryos (Kimmel et al., 1995), which were born at the same time and incubated under identical conditions. For the Nodal signaling inhibitor SB431542 (SB) treatment, one-cell stage embryos (10 min postfertilization) were incubated in Holfreter’s water with 1% DMSO (control) or 50 μM SB and harvested or observed at desired stages. All experiments were approved by Tsinghua University Animal Care and Use Committee.
Whole-mount high-resolution double fluorescence in situ hybridization (DFISH) was carried out using the protocol provided by J. Gage Crump lab, as described by Welten et al. (2006) and Zuniga et al. (2010), with two modifications: antibody concentrations were 1:500 anti-fluorescein-POD and 1:1000 anti-digoxigenin-POD (without preadsorbing the antibody with prehybridized zebrafish embryos), and incubation time with fluorescein tyramide was 3 h in the dark. The DIG-labeled ndr1 probe and fluorescein-labeled ndr2 were used for DFISH.
Embryos were embedded in 1% low-melting-point agarose and imaged via Zeiss light-sheet Z.1 microscopy using a W Plan-Apochromat 20× objective at 0.5× zoom. Embryos were positioned with lateral views, and two lateral images were acquired for each embryo: one at the brightest view, and the other, rotated 180°. Each lateral view image generated by online dual side fusion included ∼250 z-slices with 1 μm interval. Then, two lateral views were fused by Multiview Process using ZEN (2014 SP1, black edition). The final image file (a size of ∼3 GB) per embryo was manually rotated in Imaris X64 9.0 to acquire the maximum intensity projections of animal views with dorsal to the right (indicated by the enhanced signal in the dorsal margin of WT and Meomesa embryos), which were captured after reset of all channels for further measurements.
For quantification of FISH, the maximum intensity projections were opened in Fiji to manually draw a circular polygonal region of interest (ROI) covering the entire embryo margin to measure the raw intensity profile (in uncalibrated optical density values, OD) per embryo. The staining dots in the marginal region were dispersedly distributed with blank, which could be a favorable control for the background subtraction. So, the minimal intensity (the intensity of the blank) in the marginal region (in a smaller and rigorous ROI) of the embryo was removed from the total intensity. The number of embryos assessed in FISH with final total intensity of ndr1 or ndr2 is presented in Supplementary Table S7.
We assume the expression levels of ndr1 and ndr2 follow the linear regression model with maternal Eomesa, Hwa/β-catenin, Nodal/Smad2, and time:
To estimate the value of the coefficients
For the analysis of the regression coefficients of Hwa/β-catenin and Nodal/Smad2 in ndr1, we assumed that the following regression relationship was satisfied:
where
Similarly, we assumed that the following regression relationship of maternal Eomesa and Nodal/Smad2 in ndr2 was satisfied:
where
It is assumed that we want to find the causal effect of the existence of maternal Eomesa, Hwa/β-catenin, Nodal/Smad2, and the value of time on the outcome of ndr1 and ndr2. For ndr1, to define the causal effect, we consider two situations: Situation 1 (real situation): Where the existence of Hwa/β-catenin, Nodal/Smad2, and the value of time are changed, and the expression of ndr1 is observed. Situation 2 (counterfactual situation): Where the existence of Hwa/β-catenin, Nodal/Smad2, and the value of time are unchanged (but the expression of ndr2 and the existence of Eomesa are consistent with real situation). The causal effect is the difference between the expression of ndr1 attained in the real situation and the counterfactual situation:
In other words, X causes Y if changing X leads to a change in Y, keeping everything else constant. Changing X while keeping everything else constant is called an intervention, and it is represented by a special notation,
Formally, causal effect is the magnitude by which Y is changed by a unit interventional change in X:
To estimate the target quantity of the given observed variable, a backdoor criterion was introduced. If all common causes of the existing X and the outcome Y are observed, then the backdoor criterion implies that the causal effect can be identified by conditioning on all the common causes:
where W refers to the set of common causes (the expression of ndr2 and the existence of Eomesa). After the identification of the correct estimand for the target quantity based on the causal model and estimation of the target estimand, we performed a refutation test by adding a random common cause variable (the estimation method does not change its estimate after we add an independent random variable as a common cause to the dataset), replacing treatment with a random (placebo) variable (the estimated causal effect should go to zero when we replace the true treatment variable with an independent random variable), and removing a random subset of the data (the estimation method does not change its estimate after we add an independent random variable as a common cause to the dataset) using the DoWhy library in Python (Sharma and Kiciman, 2020).
ChIP assay was performed as previously described (Listerman et al., 2006) with minor modifications: 1) the embryos (1,000 embryos per sample) were cross-linked with 1.85% formaldehyde (Amresco, 0493) for 15 min; 2) Sepharose beads were replaced by magnetic beads (Sigma, 16–663X) for convenience. The antibodies were mouse anti-Myc (Santa Cruz, sc-40, 10 μg), mouse IgG (Biyuntian, A7028, 10 μg, as control), rabbit anti-β-catenin (Cell Signaling Technology, #8408, 20 μl), rabbit anti-Smad2/3 (Cell Signaling Technology, #3102, 30 μl) (Liu et al., 2011), and rabbit IgG (Biyuntian, A7016, 0.125 μg, as control). Following ChIP, the purified DNA was used for qRT-PCR using specific primers (Supplementary Table S4, S5) with some changes according to Hong et al, (2011). Percentage inputs (% input) was calculated by “% Input = 2^(-ΔCt [normalized ChIP]),” where ΔCt [normalized ChIP] was acquired from “(Ct [ChIP] - (Ct [Input] -Log2 (input dilution factor))” with the input dilution factor of 10 in the ChIP. Standard deviation (S.D.) and multiple t-tests were analyzed using GraphPad Prism 7 from two independent experiments.
For making transgene constructs, the putative regulatory regions of ndr1 and ndr2 were amplified using specific primers (Supplementary Table S6), and the resulting fragments were ligated to drive GFP expression (Figures 3, 4). The transgene constructs were purified and injected into embryos at the one-cell stage. GFP expressions in embryos at 4.3–5 hpf were observed and photographed under Olympus MVX10 fluorescence microscopy.
The graphs and t-tests were finished with GraphPad Prism 7. Error bars were represented as mean ± S.D. p values are two-sided. Significance levels were indicated by non-significant (ns), p > 0.05; *, p < 0.05; **, p < 0.01; and ***, p < 0.001.
Based on our previous study, the expressions of ndr1 and ndr2 are hypothesized to be mainly regulated by three factors, that is, maternal eomesa, maternal hwa-activated β-catenin signaling, and Nodal autoregulation (Xing et al., 2022). To quantitatively explore the dynamic contribution of these three factors to the expression of ndr1 and ndr2 during several time points, we first performed intensity compute of ndr1 and ndr2 in the maternal eomesa (Meomesa), maternal hwa (Mhwa), and wildtype (WT) embryos, as well as in the control group with the inhibition of Nodal autoregulation (SB431542 treatment). The expression levels of ndr1 and ndr2 were detected by the DFISH, imaged using light-sheet fluorescence microscopy (LSFM), and measured by the software Fuji (Figures 1A and B and Supplementary Table S7), which show a similar expression pattern to the previous reports (Meno et al., 1999; Xing et al., 2022) and simultaneously provide the quantified data for further modeling.
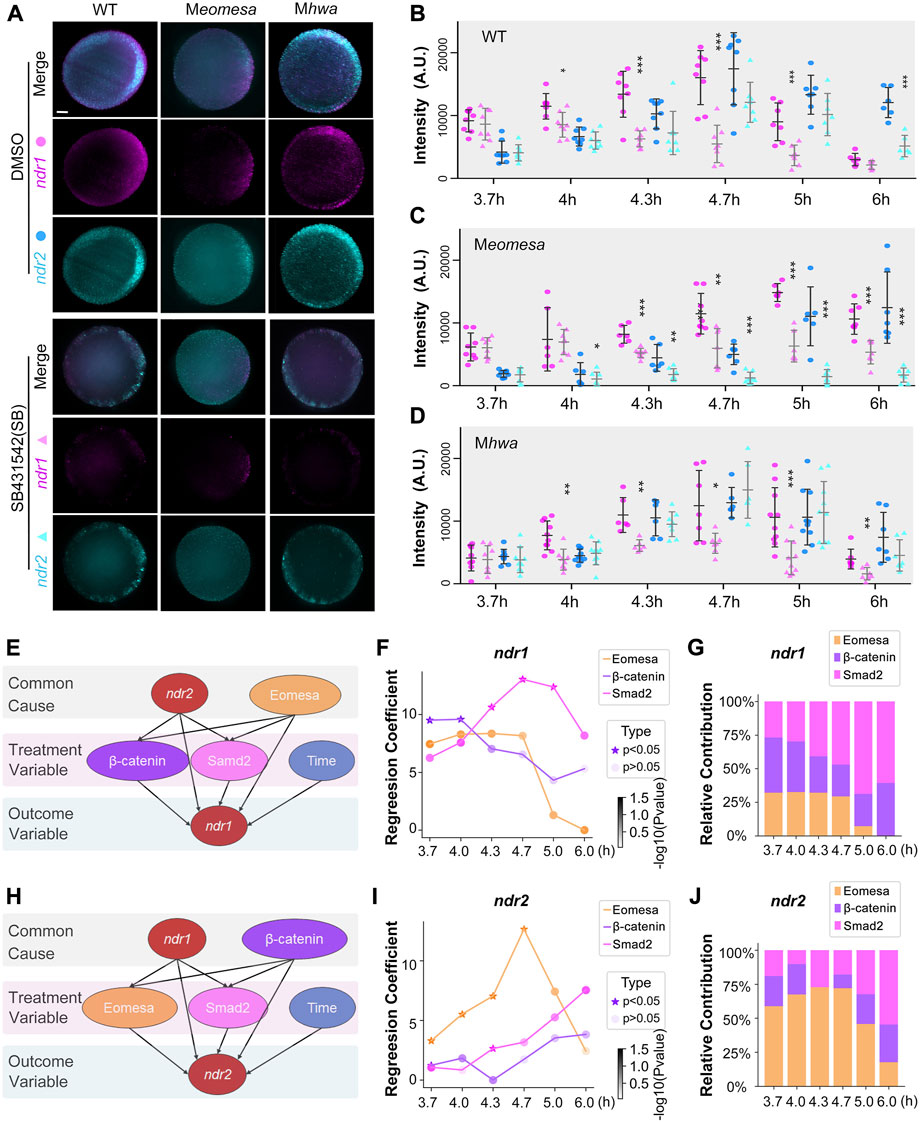
FIGURE 1. Regulatory factors of ndr1 and ndr2 analyzed by a causal graphical model. (A–D) Dynamic fluorescence intensities of ndr1 and ndr2 quantified for model analysis. (A) Representative expression pattern of ndr1 and ndr2 at 4.7 hpf detected by double fluorescence in situ hybridization (FISH). Embryos were treated with 1% DMSO or 50 μM SB431542 (SB) and fixed at indicated stages. All embryos are shown in animal-pole view with dorsal to the right; the dorsal is indicated by the expression pattern of ndr1/ndr2. It is of note that under SB treatment, the ndr1, not ndr2, could be detected in Meomesa embryos, while both ndr1 and ndr2 were present in Mhwa embryos. Scale bars, 100 μm. (B–D) Quantification of fluorescence intensities of ndr1 and ndr2 at indicated stages. In total, 7–10 embryos for each group were measured by Fiji for the total intensities. Pink dots, ndr1 intensities; blue dots, ndr2 intensities (circles for the DMSO group, and triangles for the SB group). It is of note that in Meomesa treated with DMSO, ndr2 intensities rise following the intensity increase of ndr1. Error bars represent s.d. for all embryos in each group. The asterisks show a significant difference between the SB group and the DMSO group. *p < 0.05; **p < 0.01; ***p < 0.001; not shown, not significant. (E–G) Hwa/β-catenin and Nodal/Smad2 could be the treatment variable factors for ndr1 expression during the time series. (E) Causal graphical model for ndr1 expression level. The causal inference was used to evaluate the causal between independent and dependent variables based on the linear regression model. The p-value of the regression coefficient of the independent variable (Eomesa) > 0.2 has no significant effect on the dependent variable ndr1, while the p-value of the regression coefficient of the independent variable (Hwa/β-catenin, Nodal/Smad2) < 0.2, indicating that these factors have a high contribution in the expression of ndr1. (F) The regression coefficient of Eomesa, β-catenin, and Smad2 on ndr1 at different time points. The p-value<0.5 was marked as a star. All coefficients were scaled down by a factor of 1000 for visualization. (G) The relative contribution of factors to ndr1 at different time points. (H–J) Eomesa and Smad2 could be the treatment variable factors for ndr2 expression during the time series. The data presentation was similar to those described in (E–G).
We applied “linear regression” and “causal inference” to evaluate the causal between the independent and dependent variables (Pearl, 2010). To reveal the relationship between variables, we constructed a multiple linear regression model with ndr1 and ndr2 intensities as dependent variables, respectively, and Eomesa, Hwa/β-catenin, Smad2, and time as independent variables. For the linear regression model of ndr1 (Supplementary Table S1), the p-value of the regression coefficient of the independent variable Eomesa >0.2 has no significant effect on the dependent variable ndr1, indicating that Eomesa may be the common cause for the outcome variable ndr1. For ndr2 (Supplementary Table S2), the p-value of the regression coefficient of the independent variable Hwa/β-catenin > 0.2 has no significant effect on the dependent variable ndr2, indicating that Hwa/β-catenin may be the common cause for the outcome variable ndr2.
Then, a causal graphical model was constructed for ndr1 with Hwa/β-catenin, Smad2, and time as treatment variables and ndr2 and Eomesa as the common causes (Figure 1C). The causal inference was performed using the backdoor criterion, and estimators were constructed using the linear model. Refutation tests by adding a random common cause variable, replacing treatment with a random (placebo) variable, and removing a random subset of the data were used to check its robustness to assumptions (Supplementary Table S3). It is of note that the “placebo_treatment_refuter = 0” indicates the model passes the refutation test and works. Similarly, the ndr2 causal graphical model was constructed with Eomesa, Smad2, and time as treatment variables and ndr1 and Hwa/β-catenin as the common causes (Figure 1H). Both causal graphical models pass the refutation test (Supplementary Table S3), which not only proves the correlation between ndr1, Hwa/β-catenin, and Nodal/Smad2 and the correlation between ndr2, Eomesa, and Nodal/Smad2, but also suggests that Hwa/β-catenin and Nodal/Smad2 can be the cause of ndr1 expression levels, while Eomesa and Nodal/Smad2 can be the cause of ndr2 expression levels.
We further calculated the variation of regression coefficients of Hwa/β-catenin and Nodal/Smad2 on ndr1 at different time points, and we found that the regression coefficients and the percentage contribution of Hwa/β-catenin gradually decreased during development (Figures 1F and G); meanwhile, those of Nodal/Smad2 gradually increased, indicating that the control of ndr1 expression was alternately transitional from Hwa/β-catenin to Nodal/Smad2. For ndr2, the coefficient variations of Eomesa continuously and steadily increased from 3.7 hpf to 4.7 hpf (Figures 1I and J), but the regression coefficients and the percentage contribution of Eomesa gradually decreased at later stages and were accompanied by the gentle rise of Nodal/Smad2.
To better understand how ndr1 and ndr2 are mechanistically regulated by Eomesa, β-catenin/Lef, and Smad2, the binding activity and regions were screened out by chromatin immunoprecipitation–quantitative PCR (ChIP-qPCR) analysis in zebrafish embryos at 4.3–5 hpf. Using immunoprecipitated DNA with a size range of 0.3–1 kb as the template, 14 ndr1 regions (ndr1R1–14) and 15 ndr2 regions (ndr2R1–15) (Figure 2), ranging from 60 to 250 bp, were amplified with specific primer pairs (Supplementary Table S4, S5). Results revealed that the promoter region (ndr1R11) of ndr1 was significantly bound by Eomesa (tagged with Myc), β-catenin, and Smad2, while Eomesa also occupied the upstream region ndr1R10 and Smad2 occupied the upstream regions ndr1R4, ndr1R5, ndr1R10 and the gene body regions ndr1R12 and ndr1R13 at the ndr1 locus. Concerning the ndr2 locus, the promoter region ndr2R10 was significantly bound only by Eomesa, and several upstream regions and gene body regions appear occupied by Eomesa and Smad2. However, β-catenin lacked binding peaks in the tested regions of ndr2, which is consistent with the observation that the ndr2 expression level was not significantly affected in Mhwa mutants (Figures 1A and B). It is of note that the ndr1 and ndr2 genomic DNA reported to be bound by Eomesa (Xu et al., 2014) are included in ndr1R11 and ndr2R13 (Figures 2A and B), and the ndr1R12 region covers the first intron of ndr1 predicted to be bound by Smad2 (Fan et al., 2007).
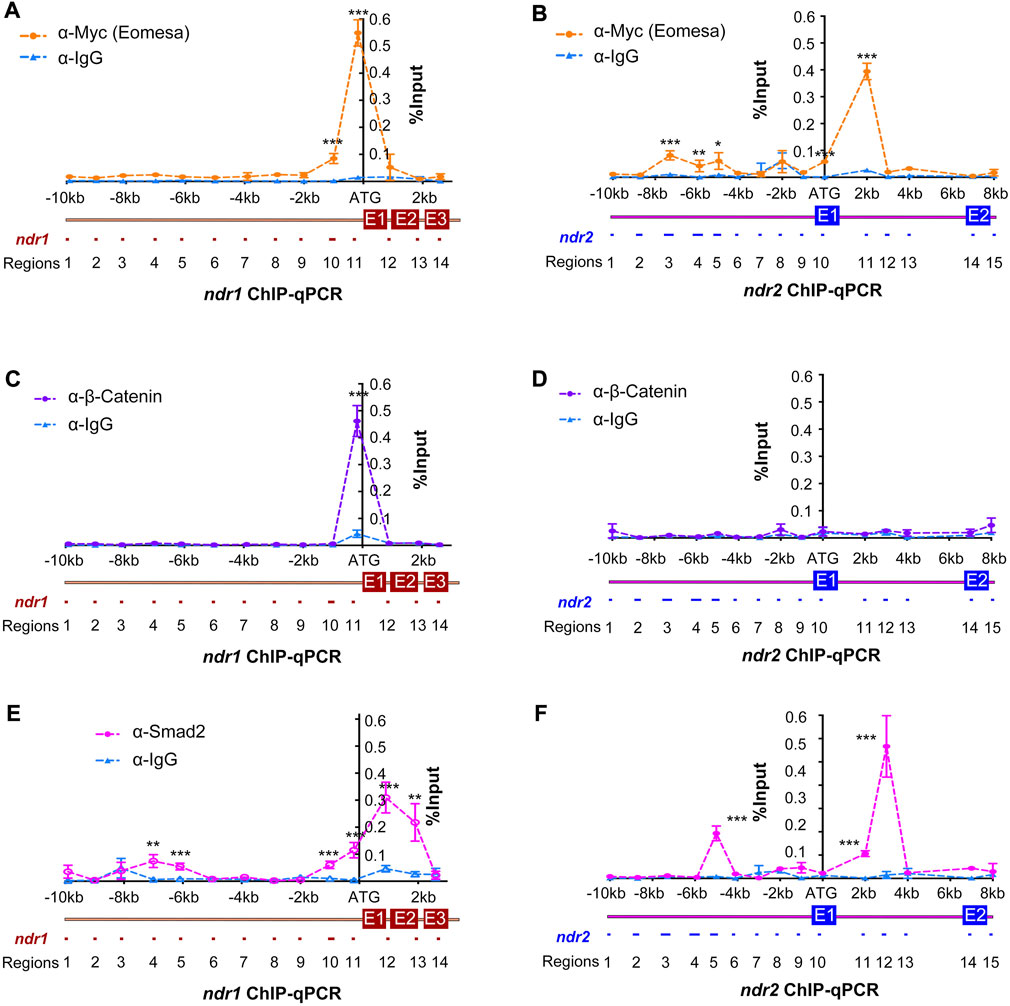
FIGURE 2. Identification of binding regions in ndr1 and ndr2 loci for Eomesa, β-catenin, and Smad2. Uninjected WT embryos or those injected with 50 pg Myc-eomesa mRNA were harvested at 4.3–5 hpf for chromatin immunoprecipitation using anti-Myc (A and B), anti-β-catenin (C and D), anti-Smad2 (E and F), or IgG antibody (Ab). The immunoprecipitated chromatin was used for quantitative PCR analysis using specific primers targeting different regions, as illustrated. The PCR results were normalized with the input genomic DNA with dilution factor (e.g., 1:10). The x-axis showed the genomic organization of ndr1 or ndr2 with amplified regions numbered. The translation start site was designated as position +1. The y-axis indicated the average percentage (±SEM) of amplified product relative to input DNA (% input) based on two independent experiments. Statistical significance levels: *, p < 0.05; **, p < 0.01; ***, p < 0.001; ns, nonsignificant.
To test the sufficiency of the identified major regions screened out by ChIP-qPCR (Figure 3) for initiating and maintaining ndr1 expression, several genomic fragments amplified from each gene with specific primers (Supplementary Table S6) were used to construct GFP reporter transgenes (Figures 3A and B). The transgene constructs were individually injected into one-cell stage WT embryos, and GFP expression was observed at 4.3–5 hpf. For the ndr1 locus, the distal enhancer “a element” reported before (Fan et al., 2007), the 1,022-bp proximal promoter with 5′UTR (p), which embodies ndr1R11 with two putative Eomes-binding sites (EBS) and two putative Lef-binding sites (LBS), plus the 604-bp ndr1 intron 1 fragment (In1), which contains ndr1R12 with a putative Smad-binding site (SBS), were selected and fused to the gfp coding sequence to make the Tg(ndr1-aIn1p:gfp), Tg(ndr1-ap:gfp), and Tg(ndr1-In1p:gfp) construct (Figure 3B). Although Tg(ndr1-In1p:gfp) did not include the previously identified distal enhancer “a element” of ndr1 (Fan et al., 2007), it allowed GFP to express in the blastodermal margin with an expanded domain in the dorsal margin in over 70% of WT embryos (Figures 3B and C), the pattern of which mimicked endogenous ndr1 expression. The ratio of embryos with strong GFP expression in correct domains was reduced in Meomesa or Mhwa mutant embryos, while no embryos showed strong GFP expression in Meomesa;Mhwa double mutants (Figures 3C and D). The ratio of WT and single mutant embryos with strong GFP was decreased in the presence of SB. These results suggest that the ndr1 regulatory regions used here harbor the necessary cis-elements required for responses to Eomesa, β-catenin, and Nodal autoregulation.
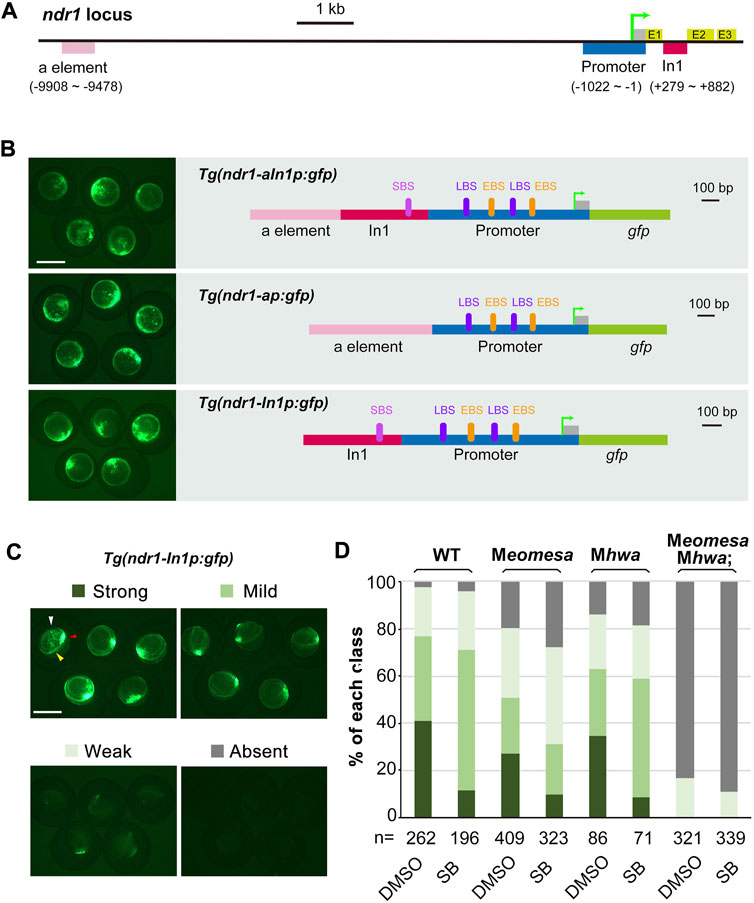
FIGURE 3. Regulation of ndr1 expression through transient transgenic assay. (A and B) Genomic organization of ndr1 locus (A) and composition of transgenes (B). The translation start site was designated as position +1. E, exons; In1, intron 1. EBS, Eomes-binding site; LBS, Lef/β-catenin binding site; SBS, Smad2-binding site. (C and D) Categorization of ndr1 transgenes in zebrafish embryos. Tg(ndr1-In1p:gfp) DNA was injected into one-cell stage WT or mutant embryos (50 pg/embryo), and GFP was observed at 4.3–5 hpf. For SB treatment, injected embryos were incubated in 50 μM SB or 1% DMSO (control) until observation. Based on GFP intensity in the blastodermal margin, embryos were categorized into four classes, as shown for WT embryos (top panel). The expression domain in the blastodermal margin is indicated by yellow heads, and the domain in the dorsal margin is indicated by red arrowheads in typical embryos. The presumably nonspecific signals are indicated by white arrowheads. Scale bars: 500 μm. The bar graphs (bottom) show the ratios of embryos in each class in WT or different mutants. n, the number of observed embryos.
For the ndr2 locus, we selected four regions (a–d), which contain Eomes-binding peaks (ndr2R3 in the “a” region, ndr2R4 and ndr2R5 in the “b” region, ndr2R10 in the “c” region, and ndr211 in the “d” region) or Smad2-binding peaks (ndr2R11 and ndr2R12 in the “d” region), for making constructs (Figures 4A and B). The basal construct Tg(ndr2-c:gfp) consisting of the “c” region (proximal promoter with 5′UTR) and the gfp coding region and exhibiting universal GFP expression in the ectoderm (data not shown) was used to construct Tg(ndr2-dc:gfp), Tg(ndr2-adc:gfp), Tg(ndr2-bdc:gfp), and Tg(ndr2-abdc:gfp). Initial test results identified that only Tg(ndr2-abdc:gfp) gave rise to GFP expression recapitulating endogenous ndr2 expression in the blastodermal margin but with nonspecific GFP in the ectoderm (Figure 4C). Then, we compared Tg(ndr2-abdc:gfp) expression in different genetic backgrounds and in the presence of SB (Figures 4D and E). The ratio of embryos with strong or mild GFP expression in the blastodermal margin in Mhwa was comparable to that in the WT background, which was unaffected by SB treatment. However, only a small fraction (32%) of Tg(ndr2-abdc:gfp)-injected Meomesa embryos had weak GFP expression in the blastodermal margin, and this ratio was slightly reduced (to 17%) in the presence of SB. When injected into Meomesa;Mhwa double mutants, GFP was hardly detectable. These changes were very similar to those seen for endogenous ndr2 expression. Therefore, the a–d regions of ndr2 harbor necessary cis-regulatory elements driving ndr2 expression in the blastodermal margin. It is worth noting that ndr2 regulatory elements for silencing ndr2 expression in the ectoderm appear missing in the tested regions.
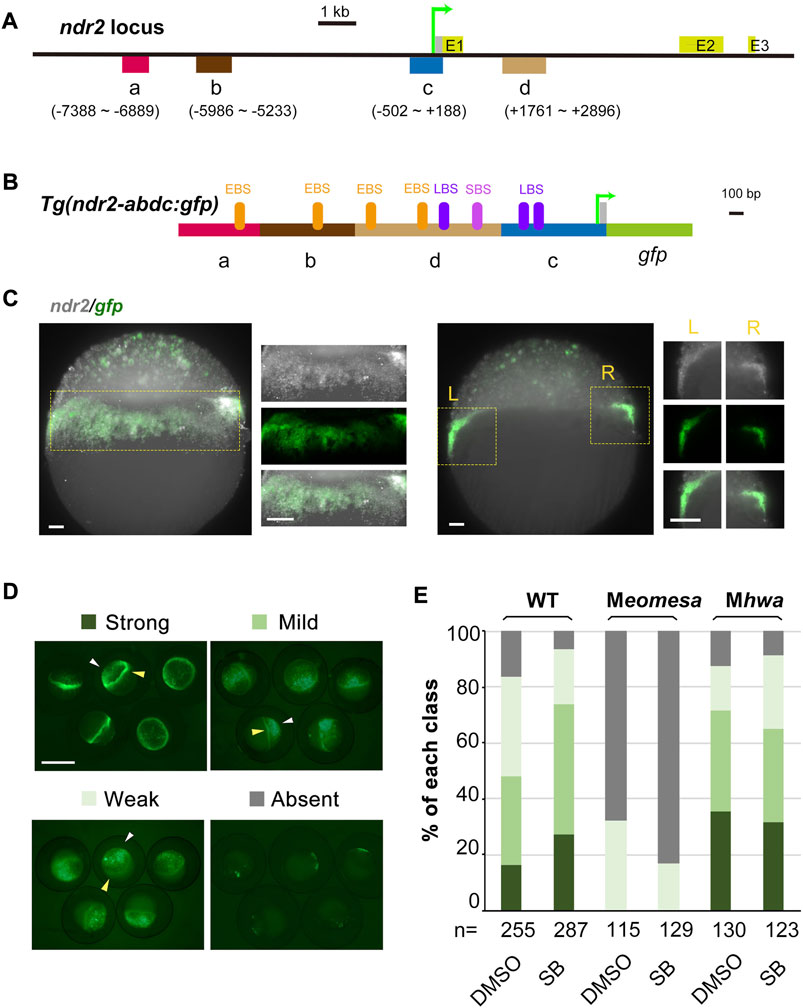
FIGURE 4. Verification of ndr2 cis-regulatory regions through transient transgenic assay. (A–C) Genomic organization of ndr2 locus (A) and composition of transgenes (B) with specific gfp expression mimicking endogenous ndr2 (C). The translation start site was designated as position +1. Exons (E) of ndr2 were indicated. EBS, Eomes-binding site; LBS, Lef/β-catenin binding site; SBS, Smad2-binding site. Wild-type embryos were injected with 50 pg Tg(ndr2-abdc:gfp) and harvested at about 30% epiboly stage for detection of ndr2 and gfp expression pattern by FISH. Lateral views (the left panel) and vertical sections (the right panel) with magnification (indicated in the yellow rectangle) were shown. Scale bars: 50 μm. (D–E) Categorization of ndr2 transgenes in zebrafish embryos. Tg(ndr2-abdc:gfp) DNA was injected into one-cell stage WT or mutant embryos (50 pg/embryo), and GFP was observed at 4.3–5 hpf. The embryo treatment and data presentation were similar to those described in Figure 3C and 3D.
In this study, we applied causal graphical models to quantitatively explore the contribution of maternal Eomesa, maternal Hwa-activated β-catenin signaling, and Nodal autoregulation (Nodal/Smad2) to the dynamic expression levels of ndr1 and ndr2, which revealed that Hwa/β-catenin and Nodal/Smad2 are the cause of ndr1 expression, while maternal Eomesa and Nodal/Smad2 are the cause of ndr2 expression. These causal graphical models were further explained by the cis-regulatory elements screening and verification in different genetic background mutants.
Gene transcription in eukaryotes requires the recruitment of RNA polymerase to promoter DNA through general transcription factors that assemble into a preinitiation complex (Zarrabi et al., 2018). Transcription factors are essential for promoter recognition and preinitiation complex formation and progression through the transcription cycle (initiation, elongation, and termination). For ndr1 promoter recognition, two LBS and two EBS are predicted and located close together (Figure 3B), suggesting a potential interaction between β-catenin and Eomesa for reinforcing ndr1 transcription. However, in case of a lack of either maternal Eomesa or Hwa/β-catenin, the ndr1 transcripts could still be detected in the dorsal margin or whole margin (Figures 1A and B), suggesting the multiple toughening and protective mechanisms for ndr1 transcription.
Although the nodal gene is believed to be activated by β-catenin in mice (Granier et al., 2011), Xenopus (Rex et al., 2002; Xanthos et al., 2002), and zebrafish (Kelly et al., 2000; Bellipanni et al., 2006), no direct evidence was presented. In zebrafish early embryos, β-catenin could directly bind to the promoter sequences of ndr1, not ndr2 (Figures 2C and D), insinuating that the regulation of ndr2 by β-catenin reported before may be mediated by Nodal autoregulation. There is a predicted LBS within the distal enhancer “a element” of ndr1 identified before (Fan et al., 2007), but no binding activity of β-catenin in the range of “a element” (Figure 2C), and the deletion of “a element” of Tg(ndr1-aIn1p:gfp) did not change the expression pattern and levels of gfp (Figure 3B). Thus, the activation of ndr1 by β-catenin may mainly depend on the LBS motifs located on the ndr1 promoter (Figure 2C and Figures 3A and B).
The study of the ndr2-gfp transgenes provides new insights into the activation of ndr2. Previous studies found that the zygotic gene mxtx2 could directly activate ndr2 by binding to the first intron (Hong et al., 2011), which was further proved to be a potential enhancer element also bound by maternal Eomesa (Xu et al., 2014), but no ndr2 promoter or transgenes was reported before. Here, four ndr2 elements bound by Eomesa were screened out via ChIP-qPCR (Figure 3B) and further verified by transgenic constructs driving gfp expression, which could partially mimic endogenous ndr2 expression, especially in the margin region (Figures 4A–C). The ndr2-gfp transgenes are hardly expressed under the loss of maternal Eomesa (Figures 4D–E), showing the indispensable role of maternal Eomesa for ndr2 initiation.
In summary, our study explored the key cause of ndr1 and ndr2 activation among maternal Hwa/β-catenin signaling, maternal Eomesa, and Nodal autoregulation, and uncovered the underlying molecular mechanisms, which may help to understand the complicated and precise regulation of the nodal genes.
The original contributions presented in the study are included in the article/Supplementary Material. All data and code about linear regression and causal inference are available for download at https://github.com/Starlitnightly/Analysis_Nodal. Further inquiries can be directed to the corresponding author.
The animal study was reviewed and approved by Tsinghua University Animal Care and Use Committee.
AM conceptualized the research study. CX performed the vast majority of experiments and data analyses, and participated in experimental design. ZZ performed the causal inference model analysis. YL performed some experiments and contributed to the transgenic project. BG, WS, and LY provided material and helped with discussions on the project. AM, HD, and CX obtained financial support. CX, ZZ, and RS wrote the manuscript. All authors critically read and approved the manuscript.
This work was financially supported by the National Key Research and Development Program of China (#2019YFA0801400), the National Natural Science Foundation of China (31988101 to A.M.), and the Hebei Provincial Department of Science and Technology (No.19942410G).
The authors thank Alex Schier (University of Basel, Basel, Switzerland) for insightful discussions and suggestions. The authors are also grateful to the members of Meng laboratory for their help and discussion and to the staff at the Cell Facility in Tsinghua Center of Biomedical Analysis for technical assistance.
The authors declare that the research was conducted in the absence of any commercial or financial relationships that could be construed as a potential conflict of interest.
All claims expressed in this article are solely those of the authors and do not necessarily represent those of their affiliated organizations, or those of the publisher, the editors, and the reviewers. Any product that may be evaluated in this article, or claim that may be made by its manufacturer, is not guaranteed or endorsed by the publisher.
The Supplementary Material for this article can be found online at: https://www.frontiersin.org/articles/10.3389/fcell.2022.1047363/full#supplementary-material
Adachi, H., Saijoh, Y., Mochida, K., Ohishi, S., Hashiguchi, H., Hirao, A., et al. (1999). Determination of left/right asymmetric expression of nodal by a left side-specific enhancer with sequence similarity to a lefty-2 enhancer. Genes Dev. 13, 1589–1600. doi:10.1101/gad.13.12.1589
Agius, E., Oelgeschlager, M., Wessely, O., Kemp, C., and De Robertis, E. M. (2000). Endodermal Nodal-related signals and mesoderm induction in Xenopus. Development 127, 1173–1183. doi:10.1242/dev.127.6.1173
Bellipanni, G., Varga, M., Maegawa, S., Imai, Y., Kelly, C., Myers, A. P., et al. (2006). Essential and opposing roles of zebrafish beta-catenins in the formation of dorsal axial structures and neurectoderm. Development 133, 1299–1309. doi:10.1242/dev.02295
Chen, Y., and Schier, A. F. (2002). Lefty proteins are long-range inhibitors of squint-mediated nodal signaling. Curr. Biol. 12, 2124–2128. doi:10.1016/s0960-9822(02)01362-3
Conlon, F. L., Lyons, K. M., Takaesu, N., Barth, K. S., Kispert, A., Herrmann, B., et al. (1994). A primary requirement for nodal in the formation and maintenance of the primitive streak in the mouse. Development 120, 1919–1928. doi:10.1242/dev.120.7.1919
Fan, X., Hagos, E. G., Xu, B., Sias, C., Kawakami, K., Burdine, R. D., et al. (2007). Nodal signals mediate interactions between the extra-embryonic and embryonic tissues in zebrafish. Dev. Biol. 310, 363–378. doi:10.1016/j.ydbio.2007.08.008
Feldman, B., Gates, M. A., Egan, E. S., Dougan, S. T., Rennebeck, G., Sirotkin, H. I., et al. (1998). Zebrafish organizer development and germ-layer formation require nodal-related signals. Nature 395, 181–185. doi:10.1038/26013
Granier, C., Gurchenkov, V., Perea-Gomez, A., Camus, A., Ott, S., Papanayotou, C., et al. (2011). Nodal cis-regulatory elements reveal epiblast and primitive endoderm heterogeneity in the peri-implantation mouse embryo. Dev. Biol. 349, 350–362. doi:10.1016/j.ydbio.2010.10.036
Hong, S. K., Jang, M. K., Brown, J. L., McBride, A. A., and Feldman, B. (2011). Embryonic mesoderm and endoderm induction requires the actions of non-embryonic Nodal-related ligands and Mxtx2. Development 138, 787–795. doi:10.1242/dev.058974
Jones, C. M., Armes, N., and Smith, J. C. (1996). Signalling by TGF-beta family members: Short-range effects of xnr-2 and BMP-4 contrast with the long-range effects of activin. Curr. Biol. 6, 1468–1475. doi:10.1016/s0960-9822(96)00751-8
Jones, C. M., Kuehn, M. R., Hogan, B. L., Smith, J. C., and Wright, C. V. (1995). Nodal-related signals induce axial mesoderm and dorsalize mesoderm during gastrulation. Development 121, 3651–3662. doi:10.1242/dev.121.11.3651
Joseph, E. M., and Melton, D. A. (1997). Xnr4: A Xenopus nodal-related gene expressed in the spemann organizer. Dev. Biol. 184, 367–372. doi:10.1006/dbio.1997.8510
Kelly, C., Chin, A. J., Leatherman, J. L., Kozlowski, D. J., and Weinberg, E. S. (2000). Maternally controlled (beta)-catenin-mediated signaling is required for organizer formation in the zebrafish. Development 127, 3899–3911. doi:10.1242/dev.127.18.3899
Kimmel, C. B., Ballard, W. W., Kimmel, S. R., Ullmann, B., and Schilling, T. F. (1995). Stages of embryonic development of the zebrafish. Dev. Dyn. 203, 253–310. doi:10.1002/aja.1002030302
Kofron, M., Demel, T., Xanthos, J., Lohr, J., Sun, B., Sive, H., et al. (1999). Mesoderm induction in Xenopus is a zygotic event regulated by maternal VegT via TGFbeta growth factors. Development 126, 5759–5770. doi:10.1242/dev.126.24.5759
Listerman, I., Sapra, A. K., and Neugebauer, K. M. (2006). Cotranscriptional coupling of splicing factor recruitment and precursor messenger RNA splicing in mammalian cells. Nat. Struct. Mol. Biol. 13, 815–822. doi:10.1038/nsmb1135
Liu, Z., Lin, X., Cai, Z., Zhang, Z., Han, C., Jia, S., et al. (2011). Global identification of SMAD2 target genes reveals a role for multiple co-regulatory factors in zebrafish early gastrulas. J. Biol. Chem. 286, 28520–28532. doi:10.1074/jbc.M111.236307
Luxardi, G., Marchal, L., Thome, V., and Kodjabachian, L. (2010). Distinct Xenopus Nodal ligands sequentially induce mesendoderm and control gastrulation movements in parallel to the Wnt/PCP pathway. Development 137, 417–426. doi:10.1242/dev.039735
Meno, C., Gritsman, K., Ohishi, S., Ohfuji, Y., Heckscher, E., Mochida, K., et al. (1999). Mouse Lefty2 and zebrafish antivin are feedback inhibitors of nodal signaling during vertebrate gastrulation. Mol. Cell 4, 287–298. doi:10.1016/s1097-2765(00)80331-7
Muller, P., Rogers, K. W., Jordan, B. M., Lee, J. S., Robson, D., Ramanathan, S., et al. (2012). Differential diffusivity of Nodal and Lefty underlies a reaction-diffusion patterning system. Science 336, 721–724. doi:10.1126/science.1221920
Muller, P., Rogers, K. W., Yu, S. R., Brand, M., and Schier, A. F. (2013). Morphogen transport. Development 140, 1621–1638. doi:10.1242/dev.083519
Norris, D. P., and Robertson, E. J. (1999). Asymmetric and node-specific nodal expression patterns are controlled by two distinct cis-acting regulatory elements. Genes Dev. 13, 1575–1588. doi:10.1101/gad.13.12.1575
Osada, S. I., Saijoh, Y., Frisch, A., Yeo, C. Y., Adachi, H., Watanabe, M., et al. (2000). Activin/nodal responsiveness and asymmetric expression of a Xenopus nodal-related gene converge on a FAST-regulated module in intron 1. Development 127, 2503–2514. doi:10.1242/dev.127.11.2503
Osada, S. I., and Wright, C. V. (1999). Xenopus nodal-related signaling is essential for mesendodermal patterning during early embryogenesis. Development 126, 3229–3240. doi:10.1242/dev.126.14.3229
Rex, M., Hilton, E., and Old, R. (2002). Multiple interactions between maternally-activated signalling pathways control Xenopus nodal-related genes. Int. J. Dev. Biol. 46, 217–226.
Schier, A. F. (2009). Nodal morphogens. Cold Spring Harb. Perspect. Biol. 1, a003459. doi:10.1101/cshperspect.a003459
Schier, A. F., and Talbot, W. S. (2005). Molecular genetics of Axis formation in zebrafish. Annu. Rev. Genet. 39, 561–613. doi:10.1146/annurev.genet.37.110801.143752
Seabold, S., and Perktold, J. (2010). Statsmodels: Econometric and statistical modeling with python. Proceedings of the 9th Python in science conference. Austin, TX). Paper presented at:.
Sharma, A., and Kiciman, E. (2020). DoWhy: An end-to-end library for causal inference. arXiv preprint arXiv:201104216.
Takahashi, S., Yokota, C., Takano, K., Tanegashima, K., Onuma, Y., Goto, J., et al. (2000). Two novel nodal-related genes initiate early inductive events in Xenopus Nieuwkoop center. Development 127, 5319–5329. doi:10.1242/dev.127.24.5319
Tao, Q., Yokota, C., Puck, H., Kofron, M., Birsoy, B., Yan, D., et al. (2005). Maternal wnt11 activates the canonical wnt signaling pathway required for axis formation in Xenopus embryos. Cell 120, 857–871. doi:10.1016/j.cell.2005.01.013
Tian, T., and Meng, A. M. (2006). Nodal signals pattern vertebrate embryos. Cell. Mol. Life Sci. 63, 672–685. doi:10.1007/s00018-005-5503-7
Welten, M. C., de Haan, S. B., van den Boogert, N., Noordermeer, J. N., Lamers, G. E., Spaink, H. P., et al. (2006). ZebraFISH: Fluorescent in situ hybridization protocol and three-dimensional imaging of gene expression patterns. Zebrafish 3, 465–476. doi:10.1089/zeb.2006.3.465
Xanthos, J. B., Kofron, M., Tao, Q., Schaible, K., Wylie, C., and Heasman, J. (2002). The roles of three signaling pathways in the formation and function of the Spemann Organizer. Development 129, 4027–4043. doi:10.1242/dev.129.17.4027
Xing, C., Shen, W., Gong, B., Li, Y., Yan, L., and Meng, A. (2022). Maternal factors and nodal autoregulation orchestrate nodal gene expression for embryonic mesendoderm induction in the zebrafish. Front. Cell Dev. Biol. 10, 887987. doi:10.3389/fcell.2022.887987
Xu, P., Zhu, G., Wang, Y., Sun, J., Liu, X., Chen, Y. G., et al. (2014). Maternal Eomesodermin regulates zygotic nodal gene expression for mesendoderm induction in zebrafish embryos. J. Mol. Cell Biol. 6, 272–285. doi:10.1093/jmcb/mju028
Yan, L., Chen, J., Zhu, X., Sun, J., Wu, X., Shen, W., et al. (2018). Maternal Huluwa dictates the embryonic body axis through beta-catenin in vertebrates. Science 362, eaat1045. doi:10.1126/science.aat1045
Zarrabi, N., Schluesche, P., Meisterernst, M., Börsch, M., and Lamb, D. C. (2018). Analyzing the dynamics of single TBP-DNA-NC2 complexes using hidden markov models. Biophys. J. 115, 2310–2326. doi:10.1016/j.bpj.2018.11.015
Zhang, J., Houston, D. W., King, M. L., Payne, C., Wylie, C., and Heasman, J. (1998). The role of maternal VegT in establishing the primary germ layers in Xenopus embryos. Cell 94, 515–524. doi:10.1016/s0092-8674(00)81592-5
Zhou, X., Sasaki, H., Lowe, L., Hogan, B. L., and Kuehn, M. R. (1993). Nodal is a novel TGF-beta-like gene expressed in the mouse node during gastrulation. Nature 361, 543–547. doi:10.1038/361543a0
Zinski, J., Tajer, B., and Mullins, M. C. (2018). TGF-Β family signaling in early vertebrate development. Family signaling in early vertebrate development. Cold Spring Harb. Perspect. Biol. 10, a033274. doi:10.1101/cshperspect.a033274
Keywords: nodal, Eomes, β-catenin, Smad2, zebrafish
Citation: Xing C, Zeng Z, Li Y, Gong B, Shen W, Shah R, Yan L, Du H and Meng A (2022) Regulatory factor identification for nodal genes in zebrafish by causal inference. Front. Cell Dev. Biol. 10:1047363. doi: 10.3389/fcell.2022.1047363
Received: 18 September 2022; Accepted: 04 October 2022;
Published: 20 October 2022.
Edited by:
De-Li Shi, Sorbonne University, FranceCopyright © 2022 Xing, Zeng, Li, Gong, Shen, Shah, Yan, Du and Meng. This is an open-access article distributed under the terms of the Creative Commons Attribution License (CC BY). The use, distribution or reproduction in other forums is permitted, provided the original author(s) and the copyright owner(s) are credited and that the original publication in this journal is cited, in accordance with accepted academic practice. No use, distribution or reproduction is permitted which does not comply with these terms.
*Correspondence: Hongwu Du, aG9uZ3d1ZHVAdXN0Yi5lZHUuY24=; Anming Meng, bWVuZ2FtQG1haWwudHNpbmdodWEuZWR1LmNu
†These authors have contributed equally to this work
Disclaimer: All claims expressed in this article are solely those of the authors and do not necessarily represent those of their affiliated organizations, or those of the publisher, the editors and the reviewers. Any product that may be evaluated in this article or claim that may be made by its manufacturer is not guaranteed or endorsed by the publisher.
Research integrity at Frontiers
Learn more about the work of our research integrity team to safeguard the quality of each article we publish.