 Yingjie Guo
 Chenxi Wu
 Zhian Yuan
 Yansu Wang
 Zhen Liang
 Yang Wang2
 Lei Xu
- 1Institute of Fundamental and Frontier Sciences, University of Electronic Science and Technology of China, Chengdu, China
- 2School of Electronic and Communication Engineering, Shenzhen Polytechnic, Shenzhen, China
- 3Department of Mathematics, University of Wisconsin-Madison, Madison, WI, United States
- 4Research Institute of Big Data Science and Industry, Shanxi University, Taiyuan, China
- 5School of Life Science, Shanxi University, Taiyuan, China
- 6Beidahuang Industry Group General Hospital, Harbin, China
Among the myriad of statistical methods that identify gene–gene interactions in the realm of qualitative genome-wide association studies, gene-based interactions are not only powerful statistically, but also they are interpretable biologically. However, they have limited statistical detection by making assumptions on the association between traits and single nucleotide polymorphisms. Thus, a gene-based method (GGInt-XGBoost) originated from XGBoost is proposed in this article. Assuming that log odds ratio of disease traits satisfies the additive relationship if the pair of genes had no interactions, the difference in error between the XGBoost model with and without additive constraint could indicate gene–gene interaction; we then used a permutation-based statistical test to assess this difference and to provide a statistical p-value to represent the significance of the interaction. Experimental results on both simulation and real data showed that our approach had superior performance than previous experiments to detect gene–gene interactions.
1 Introduction
Genome-wide association study (GWAS) is a collection of successful methods for identifying genetic loci associated with complex traits. More than 71,000 specific single nucleotide polymorphisms (SNPs) associated with diseases or traits have been identified (Hindorff et al., 2009; Yang et al., 2015; Liu et al., 2018a; Guo et al., 2018; Buniello et al., 2019; Loos, 2020; Lyu et al., 2020; Hu et al., 2021). Previous GWAS schemes relied mainly on a single locus model that verified the independent association of individual markers to particular phenotypes. Despite the successful recognition of many regions of disease susceptibility, most SNPs captured by this kind of method may have a small effect size that does not explain the heritability of complex traits fully. It is believed that genetic interactions that are engaged significantly in the genetic basis of complex traits and diseases (Cordell, 2009; Moore et al., 2010; Liu et al., 2018b; He et al., 2020; Luo et al., 2020; Shao and Liu, 2021) may be a potential solution to the problem of “missing heritability” (Manolio et al., 2009; Fang et al., 2019; Young, 2019). The solution may be partial, but it could enlighten the construction of new topologies for gene pathways.
Genetic interaction was first studied at the SNP level, and SNP–SNP interactions (i.e., epistasis) were detected by applying several methods (Li et al., 2015a; Ritchie and Van Steen, 2018), such as statistics based on entropy (Dong et al., 2008), logistic regression (Lin et al., 2016), and odds ratio (Emily, 2012); other techniques include multifactor dimensionality reduction (MDR) (Ritchie et al., 2003), BOOST (Wan et al., 2010), RRIntCC (Zhang et al., 2019), GenEpi (Chang et al., 2020), and some accelerate method (Nobre et al., 2021). One of the general challenges encountered by these SNP-based approaches is the statistical weakness of the higher-order or pairwise tests that result from massive multiple testing corrections over all the groups or pairs of SNPs. Instead, we investigated every possible SNP from two genes in single, gene-based interaction detection.
The success of gene-based approaches in marginal association studies of GWAS could extend to the analysis of gene–gene interactions (GGIs) (Emily, 2018; Emily et al., 2020). This approach has several potential advantages. First, it typically has far fewer genes than SNPs, reducing the number of pairwise tests drastically. For example,
Peng et al. (Peng et al., 2010) discovered a canonical correlation of a pair of genes in a case group and in a control group by applying a canonical correlation analysis–based U statistic (CCU), which measured the difference in the correlation of the gene pair. The difference then indicated the incidence of a GGI. In the analysis, however, only linear relationships were taken into consideration. Afterward, CCU was extended to kernelized CCU (KCCU) (Yuan et al., 2012; Larson et al., 2013), where a non-linear relationship was detected under the kernel. Recently, Emily (Emily, 2016) presented a method called AGGrGATOr that combined p-values interaction tests at the marker level to gauge how a pair of genes interacted, which was a strategy used by Ma et al. (Ma et al., 2013) earlier to detect interactions under quantitative phenotypes. Li et al. (Li et al., 2015b) proposed an entropy-based and nonparametric method called GBIGM.
At present, the new approach GGInt-XGBoost is proposed for identifying gene–gene interactions of complex phenotypes at the gene level in case-control studies by leveraging the eXtreme Gradient Boosting (XGBoost) (Chen and Guestrin, 2016), which is applied in co-expressed gene detection and to explore genetic associations in the field of bioinformatics (Jiang et al., 2013; Babajide Mustapha and Saeed, 2016; Liu et al., 2016; Liu and Jiang, 2016; Mrozek et al., 2016; Wei et al., 2017a; Wei et al., 2017b; Liu et al., 2017; Chen et al., 2018; Wei et al., 2018; Jiang et al., 2019; Liu et al., 2019; Yu et al., 2020a; Yu et al., 2020b; Lv et al., 2020; Li et al., 2021; Liu et al., 2021). A built-in mechanism of XGBoost is that one can impose constraints on the trained model to make it additive, which we assume characterizes the lack of interaction between two genes. Our method exhibited an outstanding performance for detecting the underlying gene–gene interactions at the gene level under various settings based on the experiments using a semi-empirical dataset. Its application using real datasets showed accurate identification of gene–gene interactions.
2 Materials and Methods
In this section, we detailed the statistical workflow for GGInt-XGBoost. To evaluate the power to detect GGIs and type-I error, we present the different parameter settings for simulation studies based on empirical data. Then, we adopted a real-world rheumatoid arthritis dataset from the WTCCC (Wellcome Trust Case–Control Consortium) database to assess the performance of our method under a real situation.
2.1 GGInt-XGBoost
2.1.1 Preliminaries and Notation
Here, we take genes, a couple of SNPs, as the basic unit. Suppose that we have
where
and
In this work, we created a statistic based on the XGBoost to quantify GGI intensity in order to see if there is a statistical interaction between two genes in a qualitative phenotype. To estimate the distribution of the statistic, we used a permutation resampling strategy. Our method was based on the assumption that if there was no interaction between two genes, adding a constraint to limit interactions between SNPs to only occurring in the same gene would not have a significant negative impact on XGBoost performance. The XGBoost’s build-in mechanism for adding interaction constraints enables us to generate an additive model and use prior knowledge about the gene structure during model construction.
2.1.2 Definition of Total Additivity for Gene–Gene Interaction
We defined GGIs using the concept of additive models. Additive models were proposed by Friedman and Stuetzle (Friedman and Stuetzle, 1981) and further developed and popularized by Stone (Stone, 1985), Hastie, and Tibshirani (Hastie and Tibshirani, 1990). Consider the regression problem where the feature lies in
In our setting, the samples are elements in
2.1.3 eXtreme Gradient Boosting (XGBoost)
eXtreme Gradient Boosting (XGBoost) (Chen and Guestrin, 2016) is a scalable machine-learning system for tree boosting, which researchers apply to bioactive molecular prediction (Babajide Mustapha and Saeed, 2016), protein submitochondrial localization prediction (Yu et al., 2020a), miRNA-disease association prediction (Chen et al., 2018), and in the bioinformatics field (Shao et al., 2021).
For a given dataset with
where
In our setting,
When running XGBoost, an essential step is to optimize its general parameters, booster parameters, and learning parameters.
2.1.4 XGBoost With the Additive Constraint
The base learner
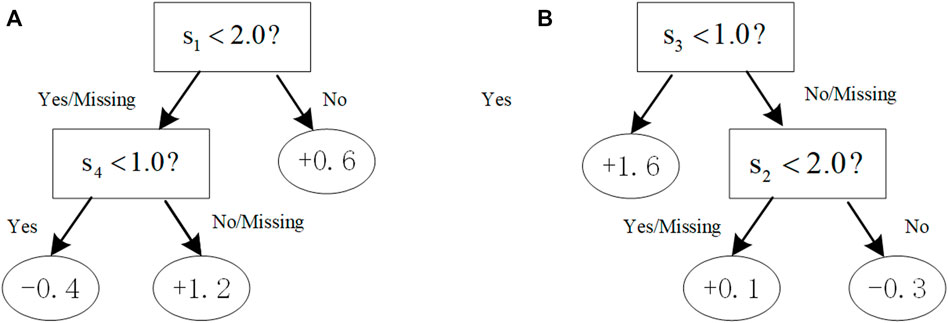
FIGURE 1. Illustration of trees with the additive constraint. With the constraint [[0,1] (Hindorff et al., 2009; Liu et al., 2018a; Loos, 2020),], (A) a tree violates the first constraint (0,1) that would not be in the boosting tree system; (B) a tree complies with both the first and second constraints.
2.1.5 Illustration of the GGInt-XGBoost Workflow
Assume there are
To get a p-value, we needed to estimate the distribution of
For XGBoost, if we have
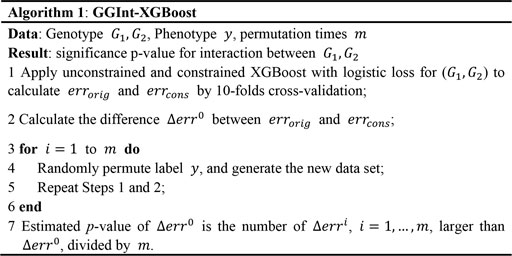
We summarized the process of GGInt-XGBoost in the algorithm below (Algorithm 1) and presented the overall workflow (Figure 2).
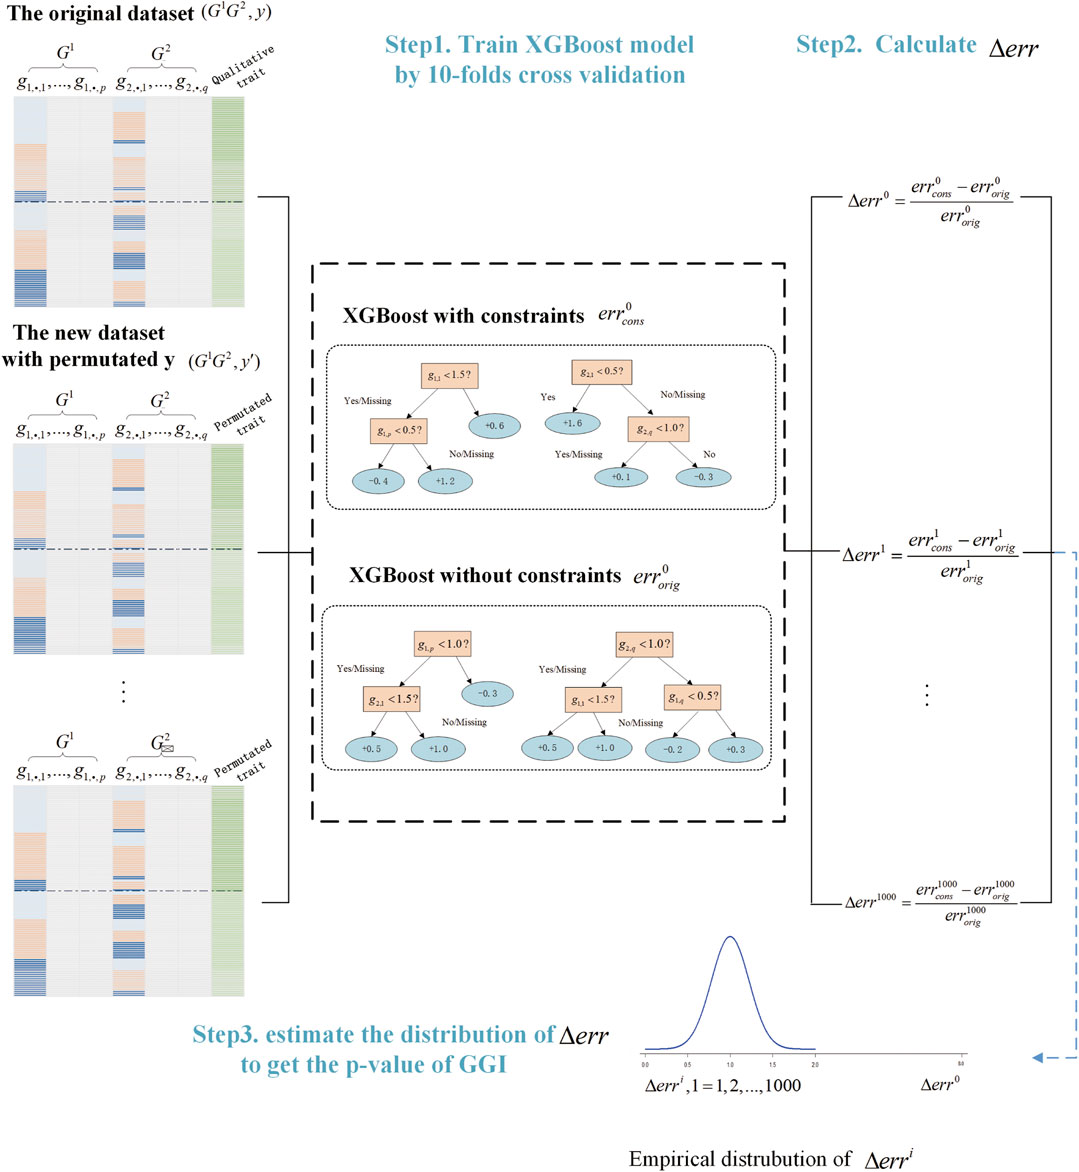
FIGURE 2. Illustration of the GGInt-XGBoost workflow for gene-based gene–gene interaction detection.
2.2 Simulation Study
To assess the performance of GGInt-XGBoost to control type I error and to detect GGIs, we compared GGInt-XGBoost with KCCA (Larson et al., 2013), GBIGM (Li et al., 2015b), and AGGrEGATOr (Emily, 2016).
2.2.1 Simulation With Haplotype Data
gs2.0 (Li and Chen, 2008) is a semi-empirical simulation data generator that employs haplotype data as input and produces high-density SNP genotype data for qualitative samples. The generated dataset shares the same local linkage disequilibrium (LD) structure as that of human populations. We selected HapMap3 (a resident of Utah, the United States with Northern and Western European ancestry from https://www.sanger.ac.uk/resources/downloads/human/hapmap3.html) to mimic the actual LD structure of the human population. The Central European (CEU) dataset with 90 haplotypes was used as the template haplotype data. In this research, we randomly picked one pair of gene loci (i.e., GNPDA2 from chromosome 4 and FAIM2 from chromosome 12). GNPDA2 had a much stronger LD pattern than FAIM2 did, and they were not correlated (Figure 3). By employing the genipe module (Lemieux Perreault et al., 2016), an imputation pipeline on the genome-scale with PLINK, IMPUTE 2, and SHAPEIT, chromosomes 4 and 12 were imputed. After imputing, six SNPs were obtained from GNPDA2, and seven SNPs were obtained from FAIM2 (Supplementary Table S1).
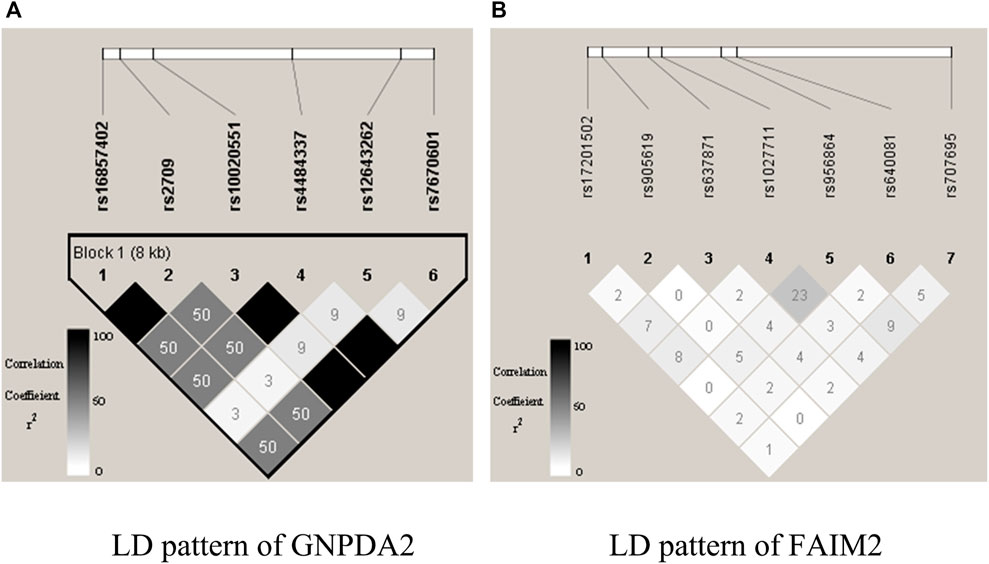
FIGURE 3. Illustration of LD structures within genes GNPDA2 and FAIM2. The plots are generated by Haploview.
2.2.2 Disease Model
Here, we generated a disease model with two loci. A disease model represents the relationship between two loci that correspond to the disease. With various combinations of odds ratios (OR), sample sizes, and population prevalence, we generated different disease models. Using the jointly recessive–dominant model (RD model) as an example, for each locus let the genotype OR be
The penetrance of genotype
The corresponding penetrance table is shown in Supplementary Table S3.
With a specific genotype OR
We used six integrated disease models in gs2.0, which included a recessive–dominant model, a dominant–dominant model, an XOR model, a threshold model, a multiplicative model, and a recessive–recessive model. We generated different datasets by various parameter settings, and we compared the performances of KCCU, GBIGM, and AGGrEGATOr with our method.
Evaluation of Type-I Error: The type-I error indicates the ability of a method to reject the null hypothesis when it is true. In this study, the significance level
Evaluation of Power of the Test: The power of a test indicates the probability that the method can reject the null hypothesis correctly when the alternative hypothesis is true. In this study, we generated 100 datasets for each parameter set under six disease models (Supplementary Table S5). The power under each parameter setting was expressed by the frequency with which the null hypothesis of the dataset was rejected correctly at the significance level of
For GGInt-XGBoost, KCCU, AGGrEGATOr, and GBIGM, if the number of datasets with a significance level less than
GBIGM and AGGrEGATOr methods are nonparametric methods so no parameters need to be specific. We only set the ratio of the trimmed jackknife to 0.05 (
2.3 Experiments Using Rheumatoid Arthritis Data
To evaluate GGInt-XGBoost’s ability to process real GGIs in a qualitative dataset, we analyzed the susceptibility of a series of pairs of genes in rheumatoid arthritis (RA), a chronic systemic disease with inflammatory synovitis with unknown etiology. It causes progressive bone destruction and affects bone remodeling. In this article, we chose the WTCCC (2007) dataset, which contained British population genotype data generated by the Affymetrix GeneChip 500 k. We preprocessed our dataset in the following ways:
i. To verify the GGIs in the RA, we selected the pathway hsa05323 from the KEGG pathway database. The genotyping coordinates of the WTCCC dataset can be found in UCSC hg18/NCBI Build36. There were 90 genes in this pathway. Among them, many genes belonged to MHCII and V-ATPase, which are two protein combinations. Because many GGIs occurred by themselves, we only selected representative genes from each protein combination, and then we excluded other genes. Finally, 48 genes remained, which resulted in
ii. The detailed gene information was obtained from the annotation file of NCBI Build36. For each gene, we added a 10 kb buffer region both downstream and upstream of the originally defined gene position. All SNPs within the region were selected for each gene.
iii. According to the quality control of GWAS, samples that included gender that did not match the chromosome X heterozygote rates were removed. SNPs were also excluded when they met any of the following conditions: the missing rate in the sample was
3 Results and Discussion
The experimental environment of the following results was a workstation with an Intel Xeon CPU E5-2,620 v2 at 2.10GHz, 96 GB of DDR3, Python3.6, and RStudio programming implementation.
3.1 Simulation Study
3.1.1 Evaluation of Type-I Error
For type-I error, by setting the significance level at
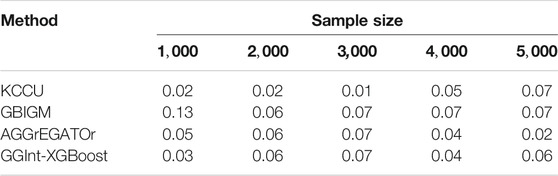
TABLE 1. Type-I error for KCCU, GBIGM, AGGrEGATOr, and GGInt-XGBoost when varying the sample size.
3.1.2 Evaluation of the Power of the Test
Impact of Odds Ratio
We investigated the performance of the various methods in detecting GGIs under the six disease models, with a population prevalence of
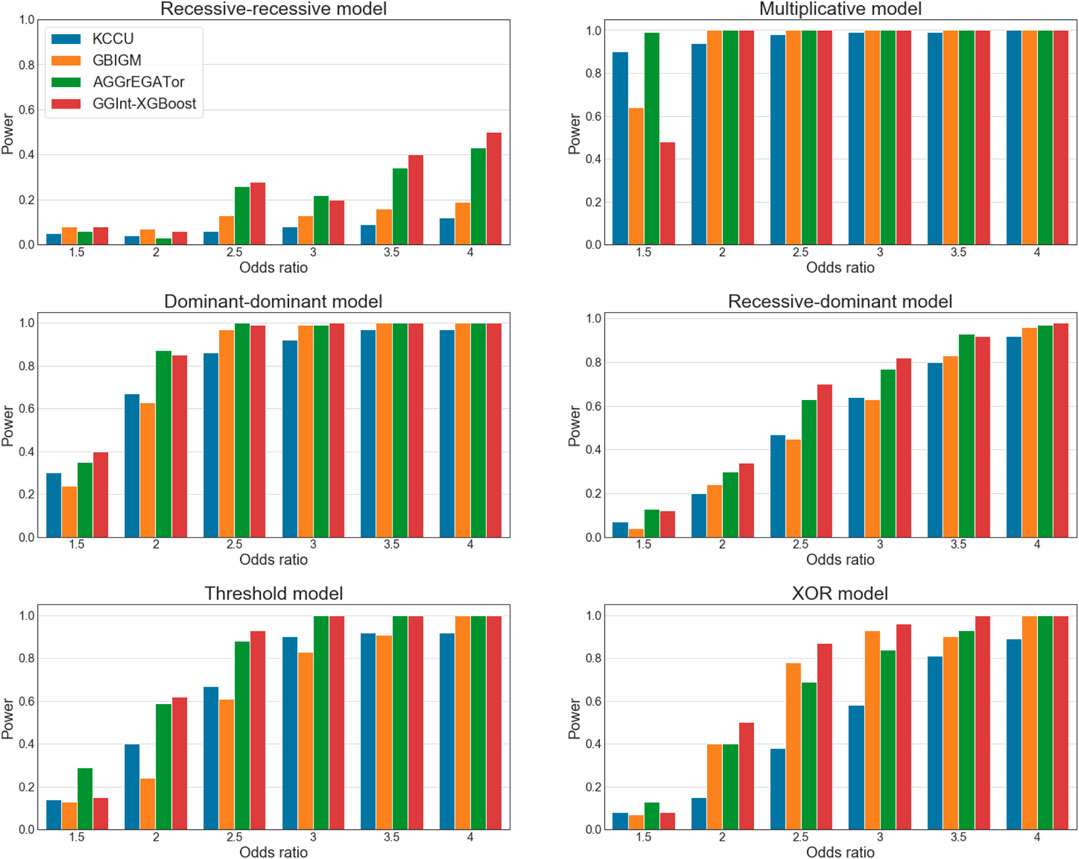
FIGURE 4. Statistical power of simulation studies for KCCU (blue), GBIGM (yellow), AGGrEGATOr (green), and GGInt-XGBoost (red) under six disease models with
It is worth noting that in the recessive–recessive model (RR model) (Supplementary Table S5A), the detection power was consistently
Impact of Sample Size
We also investigated the influence of the sample size. Let the sample size be
In conclusion, GGInt-XGBoost performed better in simulation studies than the other methods tested in almost every setting. The reason was probably that our method, by making use of constrained and unconstrained XGBoost models, made weak assumptions on the kind of interaction because any deviation from the additivity in the prediction of log odds ratios indicated an underlying GGI, which resulted in better statistical power. Furthermore, our method was more robust with respect to the LD pattern among the SNPs within each gene because the additivity constraint did not destroy the LD structure within each gene.
3.2 Experiments Using Rheumatoid Arthritis Data
Rheumatoid arthritis (RA) is an autoimmune disease with symptoms that typically include pannus formation in the synovial joints and destruction of cartilage and bones. The genes IL-17, IL-6,
Because there were too many detected interacting gene pairs in KCCU and GBIGM with a p-value = 0, we could not analyze all of them in detail, so we focused on the 10 most significant gene pairs detected by AGGrEGATOr and, by our method, GGInt-XGBoost (Table 2). After a literature search, we found 7 of the 10 most significant gene pairs under GGInt-XGBoost and 3 of the 10 most significant gene pairs under AGGrEGATOr were supported by prior research. There was also a greater correlation between the results of GGInt-XGBoost and KCCU or GBIGM than the correlation between AGGrEGATOr and GBIGM or KCCU.
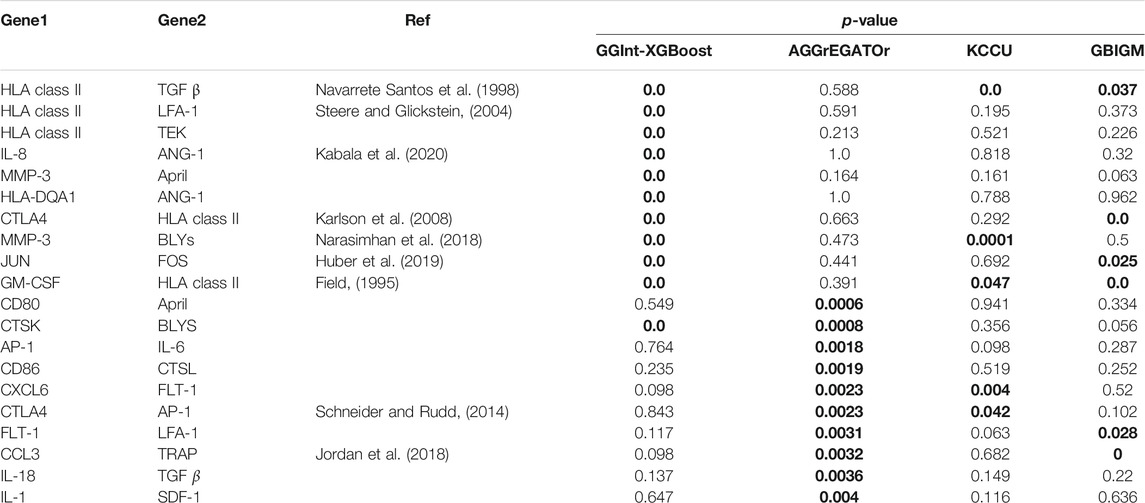
TABLE 2. Calculated p-value for the 20 gene pairs using all four different methods. p-values in bold font indicate that they are significant. The ``Ref'' column indicates that the pair can be found as direct interaction in our literature search.
Furthermore, when using GGInt-XGBoost, after the detection of interacting gene pairs, one can also use the ensemble tree mechanism of XGBoost to investigate marker-based interactions further; this is because the regression tree, which is the base learner used in XGBoost, is a powerful tool for the discovery of interactions among features. For a regression tree model, one considers features that appear in the same traversal path from the root to leaf to be interacting. As an example, the gene pairs IL-8 and Ang-1 were found to interact using our method. Pawel et al.(Kabala et al., 2020) reported that Ang-1 induced the production of IL-8 in synovial tissue explants of RA patients. In the first tree in the unconstrained XGBoost model, it was clear that one SNP from the gene IL-8 on chromosome 4 interacted with rs121937926 in the gene Ang-1 (Supplementary Figure S2). The interaction form was flexible because our method imposed no functional form.
We explored the structure of the unconstrained XGBoost model further with R package EIX (Karbowiak and Biecek, 2021), which produced an interaction plot (Figure 5). For the convenience of display, all the SNPs in IL-8 were named “G1_X”, and all SNPs in ANG-1 were named “G2_X”, where “X” was the index. We chose the sumGain as a measure for the interaction strength. The sumGain was the sum of the gain value in all nodes in which the given SNP occurred. The intensity of the sumGain was divided into four equal parts and represented by different colored squares in the legend. The interacting SNP pairs in Supplementary Figure S2 from IL-8 and Ang-1 exhibited median strength in Figure 5 (with red star), which demonstrated that it was possible to use the results of GGInt-XGBoost for a more fine-grained analysis of GGIs at the marker level. Also, our method was robust with respect to LD because the LD structure within each gene was still expressed in the tree model and did not directly impact the performance of our method (Figure 5). Table 3 gives the information of the top 10 interacted SNP pairs by sumGain and occurrence frequency in the ensemble boosting trees.
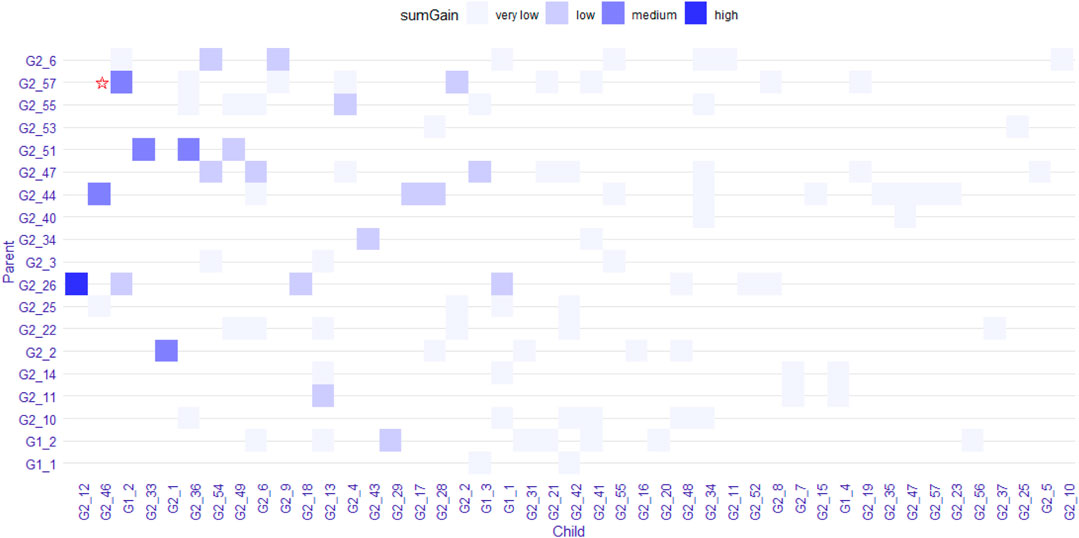
FIGURE 5. Plot that shows pairs of SNPs that lie in two nodes of a regression tree connected by an edge. The color indicates the sumGain measure for the SNP pairs. The pair with the red star indicates the interacting SNP pair from IL-8 and Ang-I.
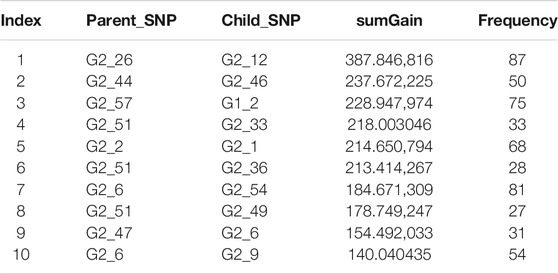
TABLE 3. sumGain measure of the 10 most significant interacting SNP pairs from IL-8 and Ang-I. “Frequency” is the number of occurrences of the SNP pair in the trained model.
4 Conclusion
Gene–gene interactions (GGIs) are important in the study of complex diseases and traits. In this article, we developed a gene-based GGI detection algorithm called GGInt-XGBoost. We treated the GGI detection problem as a measure of how much the log odds ratio of qualitative traits deviated from the additive structure. GGInt-XGBoost benefits from the attractive built-in mechanism of XGBoost that allows for an elegant expression of the additive structure by adding feature interaction constraints. Because of the weak assumptions of the interaction form and powerful and practical ability of XGBoost to fit nonlinear relationships, our method detected more types of interpretable GGIs accurately and effectively than other methods.
Combined with logistic regression, GGInt-XGBoost can be used for the GWAS of complex qualitative traits. To test its performance, we conducted a semi-empirical simulation study and a retrospective analysis of rheumatoid arthritis. For most of the settings tested, GGInt-XGBoost outperformed prior methods in statistical power for detecting GGIs. Also, because the base learner we used in XGBoost was the regression tree, GGIng-XGBoost can detect GGIs under quantitative traits. Furthermore, the base learner of XGBoost is a tree model that has a natural way of expressing marker-based interactions, which allows further investigations of interactions at the marker level after two genes are known to interact. For example, we looked for interactions between the genes IL-8 and Ang-1 and found that it was largely accounted for by the interaction between a single pair of SNPs from these two genes. Also, through the analysis of IL-8 and Ang-1, we found that GGInt-XGBoost was robust with respect to the LD structure within genes. The workflow designed for detection of GGIs did not damage the LD structure, and the assumption of the additive structure allowed marker-based interaction within genes. Last, GGInt-XGBoost might be improved further or generalized by incorporating ideas from causal inferences that would be applied more effectively to multi-gene settings and the study of gene pathways. In conclusion, GGInt-XGBoost is a helpful addition to the existing toolbox of statistical methods for studying gene–gene interaction in genome-wide association studies.
Data Availability Statement
Publicly available datasets were analyzed in this study. These data can be found here: https://www.wtccc.org.uk/info/access_to_data_samples.html
Author Contributions
YZ and LX contributed to conceptualization and project administration. YG contributed to conceptualization, methodology, investigation, funding acquisition, and writing-original draft. CW contributed to methodology, formal analysis, and writing-original draft. ZY contributed to software and formal analysis. YW (4th author) contributed to data curation and visualization. ZL contributed to resources and data curation. YW (6th author) contributed to formal analysis, writing-review, and editing. All authors contributed to the article and approved the submitted version.
Funding
The work was supported by the National Natural Science Foundation of China (No. 62002243, No. 31900306), and the Research Foundation of ShenZhen Polytechnic (6021310019K).
Conflict of Interest
The authors declare that the research was conducted in the absence of any commercial or financial relationships that could be construed as a potential conflict of interest.
Publisher’s Note
All claims expressed in this article are solely those of the authors and do not necessarily represent those of their affiliated organizations, or those of the publisher, the editors, and the reviewers. Any product that may be evaluated in this article, or claim that may be made by its manufacturer, is not guaranteed or endorsed by the publisher.
Supplementary Material
The Supplementary Material for this article can be found online at: https://www.frontiersin.org/articles/10.3389/fcell.2021.801113/full#supplementary-material
References
Babajide Mustapha, I., and Saeed, F. (2016). Bioactive Molecule Prediction Using Extreme Gradient Boosting. Molecules 21 (8). doi:10.3390/molecules21080983
Buniello, A., MacArthur, J. A. L., Cerezo, M., Harris, L. W., Hayhurst, J., Malangone, C., et al. (2019). The NHGRI-EBI GWAS Catalog of Published Genome-wide Association Studies, Targeted Arrays and Summary Statistics 2019. Nucleic Acids Res. 47 (D1), D1005–D1012. doi:10.1093/nar/gky1120
Chang, Y.-C., Wu, J. T., Wu, J.-T., Hong, M.-Y., Tung, Y.-A., Hsieh, P.-H., et al. (2020). GenEpi: Gene-Based Epistasis Discovery Using Machine Learning. BMC Bioinformatics 21 (1), 68. doi:10.1186/s12859-020-3368-2
Chen, T., and Guestrin, C. (2016). “XGBoost : A Scalable Tree Boosting System,” in Proceedings of the 22nd ACM SIGKDD International Conference on Knowledge Discovery and Data Mining (San Francisco, CA; New York, NY: Association for Computing Machinery), 785–794.
Chen, X., Huang, L., Xie, D., and Zhao, Q. (2018). EGBMMDA: Extreme Gradient Boosting Machine for MiRNA-Disease Association Prediction. Cell Death Dis 9 (1), 3. doi:10.1038/s41419-017-0003-x
Cordell, H. J. (2009). Detecting Gene-Gene Interactions that Underlie Human Diseases. Nat. Rev. Genet. 10 (6), 392–404. doi:10.1038/nrg2579
Dong, C., Chu, X., Wang, Y., Wang, Y., Jin, L., Shi, T., et al. (2008). Exploration of Gene-Gene Interaction Effects Using Entropy-Based Methods. Eur. J. Hum. Genet. 16 (2), 229–235. doi:10.1038/sj.ejhg.5201921
Emily, M.: A Survey of Statistical Methods for Gene-Gene Interaction in Case-Control Genome-wide Association Studies. 2018.
Emily, M. (2016). AGGrEGATOr: A Gene-Based GEne-Gene interActTiOn Test for Case-Control Association Studies. Stat. Appl. Genet. Mol. Biol. 15 (2), 151–171. doi:10.1515/sagmb-2015-0074
Emily, M., Sounac, N., Kroell, F., and Houée-Bigot, M. (2020). Gene-Based Methods to Detect Gene-Gene Interaction in R: The GeneGeneInteR Package. J. Stat. Softw. 95 (12). doi:10.18637/jss.v095.i12
Emily, M. (2012). IndOR: a New Statistical Procedure to Test for SNP-SNP Epistasis in Genome-wide Association Studies. Statist. Med. 31 (21), 2359–2373. doi:10.1002/sim.5364
Fang, G., Wang, W., Paunic, V., Heydari, H., Costanzo, M., Liu, X., et al. (2019). Discovering Genetic Interactions Bridging Pathways in Genome-wide Association Studies. Nat. Commun. 10 (1), 4274. doi:10.1038/s41467-019-12131-7
Field, M. (1995). Colony-stimulating Factors. Clin. Immunother. 3 (4), 255–261. doi:10.1007/bf03259277
Friedman, J. H., and Stuetzle, W. (1981). Projection Pursuit Regression. J. Am. Stat. Assoc. 76 (376), 817–823. doi:10.1080/01621459.1981.10477729
Guo, F., Wang, D., and Wang, L. (2018). Progressive Approach for SNP Calling and Haplotype Assembly Using Single Molecular Sequencing Data. Bioinformatics 34 (12), 2012–2018. doi:10.1093/bioinformatics/bty059
Hastie, T., and Tibshirani, R. (1990). Generalized Additive Models. London, United Kingdom: Chapman & Hall.
He, B., Lang, J., Wang, B., Liu, X., Lu, Q., He, J., et al. (2020). TOOme: A Novel Computational Framework to Infer Cancer Tissue-Of-Origin by Integrating Both Gene Mutation and Expression. Front. Bioeng. Biotechnol. 8, 394. doi:10.3389/fbioe.2020.00394
Hindorff, L. A., Sethupathy, P., Junkins, H. A., Ramos, E. M., Mehta, J. P., Collins, F. S., et al. (2009). Potential Etiologic and Functional Implications of Genome-wide Association Loci for Human Diseases and Traits. Proc. Natl. Acad. Sci. 106 (23), 9362–9367. doi:10.1073/pnas.0903103106
Hu, Y., Sun, J. Y., Zhang, Y., Zhang, H., Gao, S., Wang, T., et al. (2021). rs1990622 Variant Associates with Alzheimer's Disease and Regulates TMEM106B Expression in Human Brain Tissues. BMC Med. 19 (1), 11. doi:10.1186/s12916-020-01883-5
Huber, R., Kirsten, H., Näkki, A., Pohlers, D., Thude, H., Eidner, T., et al. (2019). Association of Human FOS Promoter Variants with the Occurrence of Knee-Osteoarthritis in a Case Control Association Study. Int. J. Mol. Sci. 20 (6). doi:10.3390/ijms20061382
Jiang, L., Wang, C., Tang, J., and Guo, F. (2019). LightCpG: a Multi-View CpG Sites Detection on Single-Cell Whole Genome Sequence Data. Bmc Genomics 20, 306. doi:10.1186/s12864-019-5654-9
Jiang, Q., Jin, S., Jiang, Y., Liao, M., Feng, R., Zhang, L., et al. (2017). Alzheimer's Disease Variants with the Genome-wide Significance Are Significantly Enriched in Immune Pathways and Active in Immune Cells. Mol. Neurobiol. 54 (1), 594–600. doi:10.1007/s12035-015-9670-8
Jiang, Q., Wang, G., Jin, S., Li, Y., and Wang, Y. (2013). Predicting Human microRNA-Disease Associations Based on Support Vector Machine. Ijdmb 8 (3), 282–293. doi:10.1504/ijdmb.2013.056078
Jordan, L. A., Erlandsson, M. C., Fenner, B. F., Davies, R., Harvey, A. K., Choy, E. H., et al. (2018). Inhibition of CCL3 Abrogated Precursor Cell Fusion and Bone Erosions in Human Osteoclast Cultures and Murine Collagen-Induced Arthritis. Rheumatology (Oxford) 57 (11), 2042–2052. doi:10.1093/rheumatology/key196
Kabala, P. A., Malvar-Fernández, B., Lopes, A. P., Carvalheiro, T., Hartgring, S. A. Y., Tang, M. W., et al. (2020). Promotion of Macrophage Activation by Tie2 in the Context of the Inflamed Synovia of Rheumatoid Arthritis and Psoriatic Arthritis Patients. Rheumatology (Oxford) 59 (2), 426–438. doi:10.1093/rheumatology/kez315
Karbowiak, E., and Biecek, P. (2021). “EIX: Explain Interactions in 'XGBoost',” in R Package Version 1.1. Available at: https://github.com/ModelOriented/EIX.
Karlson, E. W., Chibnik, L. B., Cui, J., Plenge, R. M., Glass, R. J., Maher, N. E., et al. (2008). Associations between Human Leukocyte Antigen, PTPN22, CTLA4 Genotypes and Rheumatoid Arthritis Phenotypes of Autoantibody Status, Age at Diagnosis and Erosions in a Large Cohort Study. Ann. Rheum. Dis. 67 (3), 358–363. doi:10.1136/ard.2007.071662
Larson, N. B., Jenkins, G. D., Larson, M. C., Vierkant, R. A., Sellers, T. A., Phelan, C. M., et al. (2013). Kernel Canonical Correlation Analysis for Assessing Gene-Gene Interactions and Application to Ovarian Cancer. Eur. J. Hum. Genet. 22 (1), 126–131. doi:10.1038/ejhg.2013.69
Lemieux Perreault, L. P., Legault, M. A., Asselin, G., and Dubé, M. P. (2016). Genipe: an Automated Genome-wide Imputation Pipeline with Automatic Reporting and Statistical Tools. Bioinformatics 32 (23), 3661–3663. doi:10.1093/bioinformatics/btw487
Li, H.-L., Pang, Y.-H., and Liu, B. (2021). BioSeq-BLM: a Platform for Analyzing DNA, RNA and Protein Sequences Based on Biological Language Models. Nucleic Acids Res., gkab829. doi:10.1093/nar/gkab829
Li, J., and Chen, Y. (2008). Generating Samples for Association Studies Based on HapMap Data. BMC bioinformatics 9 (1), 44–13. doi:10.1186/1471-2105-9-44
Li, J., Huang, D., Guo, M., Liu, X., Wang, C., Teng, Z., et al. (2015). A Gene-Based Information Gain Method for Detecting Gene-Gene Interactions in Case-Control Studies. Eur. J. Hum. Genet. 23 (11), 1566–1572. doi:10.1038/ejhg.2015.16
Li, M.-X., Gui, H.-S., Kwan, J. S. H., and Sham, P. C. (2011). GATES: A Rapid and Powerful Gene-Based Association Test Using Extended Simes Procedure. Am. J. Hum. Genet. 88 (3), 283–293. doi:10.1016/j.ajhg.2011.01.019
Li, P., Guo, M., Wang, C., Liu, X., and Zou, Q. (2015). An Overview of SNP Interactions in Genome-wide Association Studies. Brief. Funct. Genomics 14 (2), 143–155. doi:10.1093/bfgp/elu036
Lin, H., Mueller-Nurasyid, M., Smith, A. V., Arking, D. E., Barnard, J., Bartz, T. M., et al. (2016). Gene-gene Interaction Analyses for Atrial Fibrillation. Sci. Rep. 6 (1), 35371–35379. doi:10.1038/srep35371
Liu, G., Hu, Y., Han, Z., Jin, S., and Jiang, Q. (2019). Genetic Variant Rs17185536 Regulates SIM1 Gene Expression in Human Brain Hypothalamus. Proc. Natl. Acad. Sci. USA 116 (9), 3347–3348. doi:10.1073/pnas.1821550116
Liu, G., Hu, Y., Jin, S., and Jiang, Q. (2017). Genetic Variant Rs763361 Regulates Multiple Sclerosis CD226 Gene Expression. Proc. Natl. Acad. Sci. USA 114 (6), E906–E907. doi:10.1073/pnas.1618520114
Liu, G., Hu, Y., Jin, S., Zhang, F., Jiang, Q., and Hao, J. (2016). Cis-eQTLs Regulate Reduced LST1 Gene and NCR3 Gene Expression and Contribute to Increased Autoimmune Disease Risk. Proc. Natl. Acad. Sci. USA 113 (42), E6321–E6322. doi:10.1073/pnas.1614369113
Liu, G., and Jiang, Q. (2016). Alzheimer's Disease CD33 Rs3865444 Variant Does Not Contribute to Cognitive Performance. Proc. Natl. Acad. Sci. USA 113 (12), E1589–E1590. doi:10.1073/pnas.1600852113
Liu, G., Jin, S., Hu, Y., and Jiang, Q. (2018). Disease Status Affects the Association between Rs4813620 and the Expression of Alzheimer's Disease Susceptibility geneTRIB3. Proc. Natl. Acad. Sci. USA 115 (45), E10519–E10520. doi:10.1073/pnas.1812975115
Liu, G., Zhang, Y., Wang, L., Xu, J., Chen, X., Bao, Y., et al. (2018). Alzheimer's Disease Rs11767557 Variant Regulates EPHA1 Gene Expression Specifically in Human Whole Blood. Jad 61 (3), 1077–1088. doi:10.3233/jad-170468
Liu, H., Qiu, C., Wang, B., Bing, P., Tian, G., Zhang, X., et al. (2021). Evaluating DNA Methylation, Gene Expression, Somatic Mutation, and Their Combinations in Inferring Tumor Tissue-Of-Origin. Front. Cell Dev. Biol. 9, 619330. doi:10.3389/fcell.2021.619330
Liu, J. Z., McRae, A. F., Nyholt, D. R., Medland, S. E., Wray, N. R., Brown, K. M., et al. (2010). A Versatile Gene-Based Test for Genome-wide Association Studies. Am. J. Hum. Genet. 87 (1), 139–145. doi:10.1016/j.ajhg.2010.06.009
Loos, R. J. F. (2020). 15 Years of Genome-wide Association Studies and No Signs of Slowing Down. Nat. Commun. 11 (1), 5900. doi:10.1038/s41467-020-19653-5
Luo, J., Meng, Y., Zhai, J., Zhu, Y., Li, Y., and Wu, Y. (2020). Screening of SLE-Susceptible SNPs in One Chinese Family with Systemic Lupus Erythematosus. Cbio 15 (7), 778–787. doi:10.2174/1574893615666200120105153
Lv, Z., Wang, D., Ding, H., Zhong, B., and Xu, L. (2020). Escherichia Coli DNA N-4-Methycytosine Site Prediction Accuracy Improved by Light Gradient Boosting Machine Feature Selection Technology. IEEE Access 8, 14851–14859. doi:10.1109/access.2020.2966576
Lyu, P., Hou, J., Yu, H., and Shi, H. (2020). High-density Genetic Linkage Map Construction in Sunflower (Helianthus Annuus L.) Using SNP and SSR Markers. Curr. Bioinformatics 15 (8), 889–897. doi:10.2174/1574893615666200324134725
Ma, L., Clark, A. G., and Keinan, A. (2013). Gene-based Testing of Interactions in Association Studies of Quantitative Traits. Plos Genet. 9 (2), e1003321. doi:10.1371/journal.pgen.1003321
Majithia, V., and Geraci, S. A. (2007). Rheumatoid Arthritis: Diagnosis and Management. Am. J. Med. 120 (11), 936–939. doi:10.1016/j.amjmed.2007.04.005
Manolio, T. A., Collins, F. S., Cox, N. J., Goldstein, D. B., Hindorff, L. A., Hunter, D. J., et al. (2009). Finding the Missing Heritability of Complex Diseases. Nature 461 (7265), 747–753. doi:10.1038/nature08494
Moore, J. H., Asselbergs, F. W., and Williams, S. M. (2010). Bioinformatics Challenges for Genome-wide Association Studies. Bioinformatics 26 (4), 445–455. doi:10.1093/bioinformatics/btp713
Mrozek, D., Daniłowicz, P., and Małysiak-Mrozek, B. (2016). HDInsight4PSi: Boosting Performance of 3D Protein Structure Similarity Searching with HDInsight Clusters in Microsoft Azure Cloud. Inf. Sci. 349-350, 77–101. doi:10.1016/j.ins.2016.02.029
Narasimhan, R., Coras, R., Rosenthal, S. B., Sweeney, S. R., Lodi, A., Tiziani, S., et al. (2018). Serum Metabolomic Profiling Predicts Synovial Gene Expression in Rheumatoid Arthritis. Arthritis Res. Ther. 20 (1), 164. doi:10.1186/s13075-018-1655-3
Navarrete Santos, A., Kehlen, A., Schütte, W., Langner, J., and Riemann, D. (1998). Regulation by Transforming Growth Factor-Beta1 of Class II mRNA and Protein Expression in Fibroblast-like Synoviocytes from Patients with Rheumatoid Arthritis. Int. Immunol. 10 (5), 601–607. doi:10.1093/intimm/10.5.601
Nobre, R., Ilic, A., Santander-Jimenez, S., and Sousa, L. (2021). Retargeting Tensor Accelerators for Epistasis Detection. IEEE Trans. Parallel Distrib. Syst. 32 (9), 2160–2174. doi:10.1109/tpds.2021.3060322
Peng, Q., Zhao, J., and Xue, F. (2010). A Gene-Based Method for Detecting Gene-Gene Co-association in a Case-Control Association Study. Eur. J. Hum. Genet. 18 (5), 582–587. doi:10.1038/ejhg.2009.223
Ritchie, M. D., Hahn, L. W., and Moore, J. H. (2003). Power of Multifactor Dimensionality Reduction for Detecting Gene-Gene Interactions in the Presence of Genotyping Error, Missing Data, Phenocopy, and Genetic Heterogeneity. Genet. Epidemiol. 24 (2), 150–157. doi:10.1002/gepi.10218
Ritchie, M. D., and Van Steen, K. (2018). The Search for Gene-Gene Interactions in Genome-wide Association Studies: Challenges in Abundance of Methods, Practical Considerations, and Biological Interpretation. Ann. Transl. Med. 6 (8), 157. doi:10.21037/atm.2018.04.05
Schneider, H., and Rudd, C. E. (2014). Diverse Mechanisms Regulate the Surface Expression of Immunotherapeutic Target Ctla-4. Front. Immunol. 5, 619. doi:10.3389/fimmu.2014.00619
Shao, J., and Liu, B. (2021). ProtFold-DFG: Protein Fold Recognition by Combining Directed Fusion Graph and PageRank Algorithm. Brief Bioinform 22 (3), bbaa192. doi:10.1093/bib/bbaa192
Shao, J., Yan, K., and Liu, B. (2021). FoldRec-C2C: Protein Fold Recognition by Combining Cluster-To-Cluster Model and Protein Similarity Network. Brief Bioinform 22 (3), bbaa144. doi:10.1093/bib/bbaa144
Steere, A. C., and Glickstein, L. (2004). Elucidation of Lyme Arthritis. Nat. Rev. Immunol. 4 (2), 143–152. doi:10.1038/nri1267
Stone, C. J. (1985). Additive Regression and Other Nonparametric Models. Ann. Stat. 13, 689–705. doi:10.1214/aos/1176349548
Wan, X., Yang, C., Yang, Q., Xue, H., Fan, X., Tang, N. L. S., et al. (2010). BOOST: A Fast Approach to Detecting Gene-Gene Interactions in Genome-wide Case-Control Studies. Am. J. Hum. Genet. 87 (3), 325–340. doi:10.1016/j.ajhg.2010.07.021
Wang, H., Jijun, T., Ding, Y., and Guo, F. (2021). Exploring Associations of Non-coding RNAs in Human Diseases via Three-Matrix Factorization with Hypergraph-Regular Terms on center Kernel Alignment. Brief. Bioinform. 22, bbaa409. doi:10.1093/bib/bbaa409
Wang, Z., He, W., Tang, J., and Guo, F. (2020). Identification of Highest-Affinity Binding Sites of Yeast Transcription Factor Families. J. Chem. Inf. Model. 60 (3), 1876–1883. doi:10.1021/acs.jcim.9b01012
Wei, L., Chen, H., and Su, R. (2018). M6APred-EL: A Sequence-Based Predictor for Identifying N6-Methyladenosine Sites Using Ensemble Learning. Mol. Ther. - Nucleic Acids 12, 635–644. doi:10.1016/j.omtn.2018.07.004
Wei, L., Wan, S., Guo, J., and Wong, K. K. (2017). A Novel Hierarchical Selective Ensemble Classifier with Bioinformatics Application. Artif. Intelligence Med. 83, 82–90. doi:10.1016/j.artmed.2017.02.005
Wei, L., Xing, P., Zeng, J., Chen, J., Su, R., and Guo, F. (2017). Improved Prediction of Protein-Protein Interactions Using Novel Negative Samples, Features, and an Ensemble Classifier. Artif. Intelligence Med. 83, 67–74. doi:10.1016/j.artmed.2017.03.001
Yang, J., Huang, T., Huang, T., Petralia, F., Long, Q., Zhang, B., et al. (2015). Synchronized Age-Related Gene Expression Changes across Multiple Tissues in Human and the Link to Complex Diseases. Sci. Rep. 5, 15145. doi:10.1038/srep15145
Young, A. I. (2019). Solving the Missing Heritability Problem. Plos Genet. 15 (6), e1008222. doi:10.1371/journal.pgen.1008222
Yu, B., Qiu, W., Chen, C., Ma, A., Jiang, J., Zhou, H., et al. (2020). SubMito-XGBoost: Predicting Protein Submitochondrial Localization by Fusing Multiple Feature Information and eXtreme Gradient Boosting. Bioinformatics 36 (4), 1074–1081. doi:10.1093/bioinformatics/btz734
Yu, X., Zhou, J., Zhao, M., Yi, C., Duan, Q., Zhou, W., et al. (2020). Exploiting XG Boost for Predicting Enhancer-Promoter Interactions. Curr. Bioinformatics 15 (9), 1036–1045.
Yuan, Z., Gao, Q., He, Y., Zhang, X., Li, F., Zhao, J., et al. (2012). Detection for Gene-Gene Co-association via Kernel Canonical Correlation Analysis. BMC Genet. 13, 83. doi:10.1186/1471-2156-13-83
Keywords: genome-wide association studies, gene–gene interactions, XGBoost, additive model, gene-based testing
Citation: Guo Y, Wu C, Yuan Z, Wang Y, Liang Z, Wang Y, Zhang Y and Xu L (2021) Gene-Based Testing of Interactions Using XGBoost in Genome-Wide Association Studies. Front. Cell Dev. Biol. 9:801113. doi: 10.3389/fcell.2021.801113
Received: 24 October 2021; Accepted: 23 November 2021;
Published: 16 December 2021.
Edited by:
Liang Cheng, Harbin Medical University, ChinaReviewed by:
Yi Xiong, Shanghai Jiao Tong University, ChinaQuan Zou, University of Electronic Science and Technology of China, China
Copyright © 2021 Guo, Wu, Yuan, Wang, Liang, Wang, Zhang and Xu. This is an open-access article distributed under the terms of the Creative Commons Attribution License (CC BY). The use, distribution or reproduction in other forums is permitted, provided the original author(s) and the copyright owner(s) are credited and that the original publication in this journal is cited, in accordance with accepted academic practice. No use, distribution or reproduction is permitted which does not comply with these terms.
*Correspondence: Yi Zhang, y_zhang1024@126.com; Lei Xu, csleixu@szpt.edu.cn