
94% of researchers rate our articles as excellent or good
Learn more about the work of our research integrity team to safeguard the quality of each article we publish.
Find out more
ORIGINAL RESEARCH article
Front. Cell Dev. Biol., 04 November 2021
Sec. Molecular and Cellular Oncology
Volume 9 - 2021 | https://doi.org/10.3389/fcell.2021.744992
This article is part of the Research TopicMetabolism and Chromatin Modification in CancerView all 14 articles
 Xiulin Jiang1,2†
 Yaomei He1,2†
 Qiushuo Shen1
 Lincan Duan3
 Yixiao Yuan3
 Lin Tang3
 Yulin Shi1,2
 Baiyang Liu1,2
 Haoqing Zhai1,2
 Peng Shi4,5*
 Cuiping Yang1,2*
 Yongbin Chen1,2,5*
Hypoxia occurs not only in natural environments including high altitude, underground burrows and deep sea, but also in human pathological conditions, such as hypoxic solid tumors. It has been well documented that hypoxia related signaling pathway is associated with a poor clinical outcome. Our group has recently identified multiple novel genes critical for solid tumor growth comparing the genome-wide convergent/parallel sequence evolution of highland mammals. Among them, a single mutation on the retinol saturase gene (RETSAT) containing amino acid switch from glutamine (Q) to arginine (R) at the position 247 was identified. Here, we demonstrate that RETSAT is mostly downregulated in multiple types of human cancers, whose lower expression correlates with worse clinical outcome. We show that higher expression of RETSAT is positively associated with immune infiltration in different human cancers. Furthermore, we identify that the promoter region of RETSAT is highly methylated, which leads to its decreased expressions in tumor tissues comparing to normal tissues. Furthermore, we show that RETSAT knockdown promotes, while its overexpression inhibits, the cell proliferation ability of mouse embryonic fibroblasts (MEFs) and B16 in vitro. In addition, the mice carrying homozygous Q247R mutation (RETSATR/R) is more resistant to xenograft tumor formation, as well as DMBA/TPA induced cutaneous keratinocyte carcinoma formation, compared to littermate wild-type (RETSATQ/Q) mice. Mechanistic study uncovers that the oncogenic factor, the prolyl isomerase (PPIase) Pin1 and its related downstream signaling pathway, were both markedly repressed in the mutant mice compared to the wild-type mice. In summary, these results suggest that interdisciplinary study between evolution and tumor biology can facilitate identification of novel molecular events essential for hypoxic solid tumor growth in the future.
High altitude is one of the most extreme environments worldwide, and mammals living in high altitude evolve adaptation traits including respiratory, cardiovascular, and metabolic systems compared to reciprocal lowlanders (Brutsaert, 2008; Scheinfeldt et al., 2012; Rademaker et al., 2014; Storz and Scott, 2021). The genetic signals after hypoxia positive selection are the major factors contributing to the hypoxia tolerant physiological traits, some of which have been indicated to be critical for transcriptional regulation under hypoxic conditions (Beall et al., 2010; Yi et al., 2010). Hemoglobin levels and oxygen saturation in the blood are two physiological characteristics important for oxygen sense, which are thoroughly studied in highlanders. Hemoglobin concentration is elevated, but oxygen saturation is reduced in high-altitude Andean populations, compared to African population as well as other low-altitude populations (Beall et al., 2002).
Hypoxia occurs not only in natural environments including high altitude, underground burrows and deep sea, but also in human pathological conditions, such as diabetes and hypoxic solid tumors (De Bels et al., 2011; Cheviron and Brumfield, 2012; Yang et al., 2020; Storz and Scott, 2021). However, hypoxia cannot be simply defined by a fixed oxygen concentration, since some tissues function normally at 5% oxygen equivalent to normoxia, and others as low as 1% oxygen (Schödel and Ratcliffe, 2019). Hypoxia related signaling molecules have been documented to function as a major regulator during tumorigenesis (Kang et al., 2018; Xiong et al., 2020). These factors include hypoxia-inducible factors (HIFs), the von Hippel–Lindau (VHL) and prolyl hydroxylases (PHD1/2/3 or so-called EglN1/2/3, respectively) of the 2-oxoglutarate (or α-ketoglutarate) dioxygenase super-family (Schödel and Ratcliffe, 2019), which provide valuable therapeutic targets for various types of human cancers (Lee et al., 2020). Increasing evidence has revealed that hypoxic solid tumors are not sensitive to clinical treatment due to reduced reactive oxygen species (ROS) and DNA damage in the case of ionizing radiation and certain chemotherapies (Brustugun, 2015). However, it is important to note that hypoxia in solid tumors is not completely the same as that in high altitude. For example, some hypoxic tumor regions have near 0% oxygen, while the oxygen level will only drop to ∼60% of sea level at ∼4,000 m highland.
Based on the similarities between high altitude hypoxia adaptation and hypoxic solid tumors, we have developed an interdisciplinary study to identify novel biomarkers involved in tumorigenesis. For examples, we did parallel large-scale genomic data generated from Tibetan domestic mammals and corresponding lowland species, and identified multiple hypoxia adaptation selected genes including YTHDF1 and C10orf67 (Shi et al., 2019; Wu et al., 2020). Furthermore, we found that YTHDF1 expression is decreased in highland mammals compared to lowlanders, which promotes non-small cell lung cancer (NSCLC) progression by activating the translational efficiency of m6A modified CDK2 and CDK4 mRNAs (Shi et al., 2019). Recently, we uncovered that the retinol saturase gene (RETSAT) contains a single parallel amino acid change from glutamine (Q) to arginine (R) at position 247 in QTP (Qinghai-Tibet Plateau) mammals (Xu et al., 2021). RETSAT has been identified to be an NADH/NADPH- dependent oxidoreductase, which is highly expressed in liver, adipose tissue and kidney (Moise et al., 2004). Previous studies have shown that RETSAT saturates the 13-14 double bond of all-trans-retinol to produce all-trans-13-14-dihydroretinol, a product important for vitamin A metabolism, which then regulates lipid metabolism, and production of reactive oxygen species (Moise et al., 2005). Furthermore, RETSAT was uncovered to modulate lipid metabolism and the production of reactive oxygen species (ROS) (Pang et al., 2017). RETSAT promotes adipogenesis and is downregulated in obesity by suppressing PPARγ and retinoid X receptor α (RXRα) responses (Ziouzenkova et al., 2007; Schupp et al., 2009).
Previous studies demonstrated that all-trans retinoic acid (ATRA), the active metabolite of vitamin A, could be used for the treatment of acute promyelocytic leukemia (APL) (Gottardi et al., 2020). Another study showed that all-trans retinoic acid stealth liposomes prevent the metastasis of breast cancer and glioblastoma tumor growth (Li et al., 2011; Mirani et al., 2019). However, whether or not RETSAT play any role in human cancers is still unknown. In this study, we decided to verify the expression and mutation patterns of RETSAT in various human cancers, and compared the xneograft or chemical induced-tumor formation in RETSAT mutant and wild-type mice.
We firstly examined the mRNA expression patterns of RETSAT in different types of human cancers using the Tumor Immune Estimation Resource (TIMER) online database (Li et al., 2017). The consistent lower expression of RETSAT was observed in BRCA (Breast invasive carcinoma), CHOL (Cholangiocarcinoma), COAD (Colon adenocarcinoma), HNSC (Head and Neck squamous cell carcinoma), KICH (Kidney Chromophobe), KIRC (Kidney renal clear cell carcinoma), LUAD (Lung adenocarcinoma), LUSC (Lung squamous cell carcinoma), PCPG (Pheochromocytoma and Paraganglioma), PRAD (Prostate adenocarcinoma), READ (Rectum adenocarcinoma) and THCA (Thyroid carcinoma) compared with the corresponding normal tissues (Figure 1A). The above results showed that RETSAT expression is commonly decreased in most human cancers, indicating that RETSAT may function as a tumor suppressor.
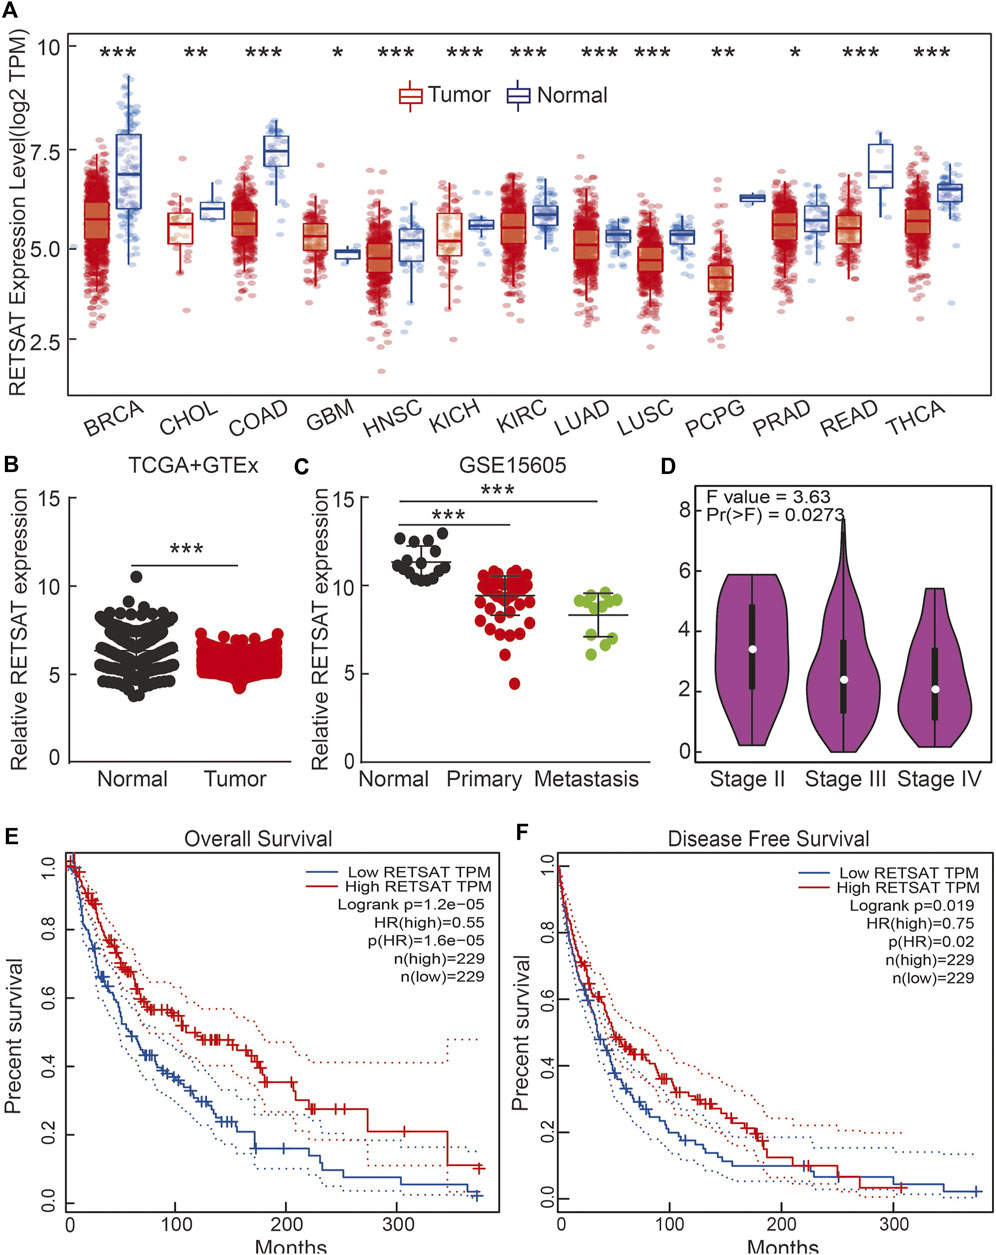
FIGURE 1. RETSAT expression patterns in human cancers. (A) RETSAT expression of different types of human cancers using the TIMER database. Red: tumors; blue: normal tissues. (B) The expression pattern of RETSAT, comparing the profiles from SKCM in (TCGA) and GTEx (Genotype-Tissue Expression, mostly for normal tissues). (C,D) The expression patterns of RETSAT in SKCM using the GEO databases and the GEPIA database (D). (E) The overall survival (OS: E) and the disease-free survival (DFS: F) tests for RETSAT in SKCM in GEPIA database. *p < 0.05, **p < 0.01, ***p < 0.001.
Based on the fact that mammals living in high altitude are exposed to both hypoxic and intensive ultra violet conditions, we decided to validate the expression pattern of RETSAT in skin cutaneous melanoma (SKCM), and identified lower RETSAT transcripts in cancerous tissues than that in normal skin tissues, by using the gene expression profile from TCGA and GETx dataset (Figure 1B). Consistently, we also verified the downregulation of RETSAT in tumor tissues in the GEO database (Figure 1C). The correlation between RETSAT and SKCM tumor stage was further tested using the GEPIA online tool (Tang et al., 2017). We found that lower expressions of RETSAT transcripts correlate with higher tumor stages (Figure 1D). In line with this finding, we revealed that patients with SKCM containing higher RETSAT expression exhibited longer overall survival (OS) and disease-free survival (DFS) time, compared to SKCM patients with lower RETSAT expression levels (Figures 1E,F). In addition, we identified many RETSAT mutations in SKCM by applying the cBioPortal web resource (Table 1) (Gao et al., 2013). The above results suggest that RETSAT is decreased in SKCM, indicating its inhibitory role during SKCM tumor progression.
To further elucidate the mechanism by which RETSAT is commonly downregulated in tumors, we firstly examined the methylation status of RETSAT promoter region, which is major cause for repressing gene expression in tumors. By using the methSurv analysis (Modhukur et al., 2018), we found that there are many methylation sites in the promoter region of RETSAT, and the differential methylation regions were indicated in the heatmaps (Figure 2A). Importantly, by using the shiny methylation analysis resource tool (SMART) analysis (Li et al., 2019) we uncovered that the methylation of RETSAT was significantly higher in SKCM cancerous tissues compared to that in normal tissues (Figure 2B). Consistently, we found that the methylation levels on the specific methylation site (cg05514932) within RETSAT promoter region negatively correlated with its expression in SKCM (Figures 2C,D). Furthermore, we showed that the elevated methylation levels on cg05514932 site correlates with worse OS in the TCGA-SKCM cohorts, using the methSurv dataset (Figure 2E). Therefore, we hypothesized that the highly methylation in RETSAT promoter DNA fragment might cause its decreased expressions in multiple types of human cancers, including SKCM (Figure 2F). In addition, we treated B16 cells with 5-Azacytidine, the specific inhibitor for DNA methylases (Christman, 2002), and revealed that RETSAT mRNA expression level was dramatically increased (Figure 2G).
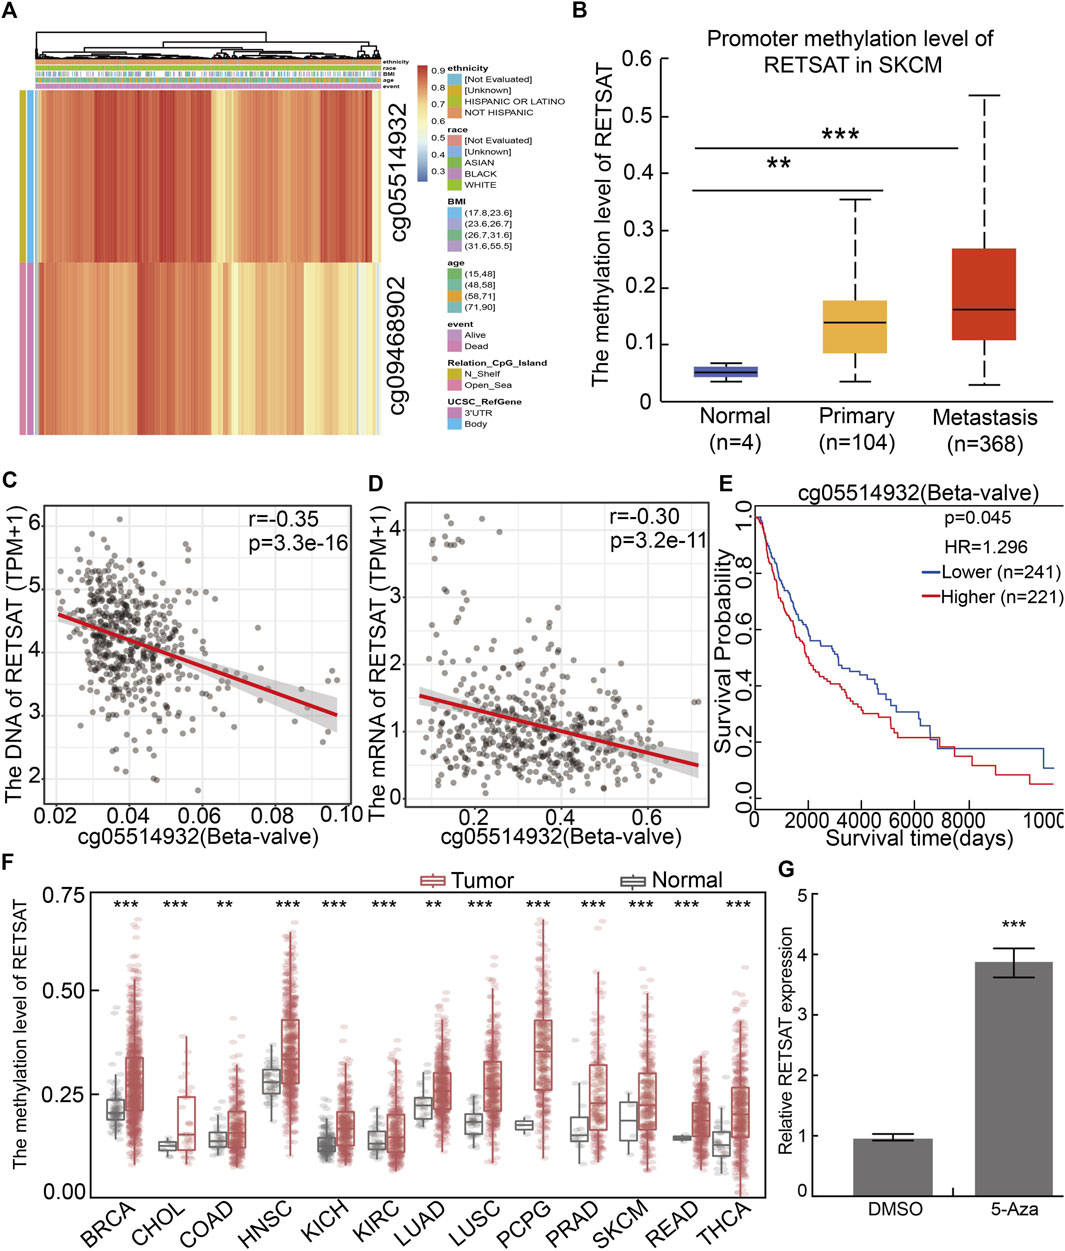
FIGURE 2. The methylation pattern in RETSAT promoter. (A) Critical methylation sites within RETSAT promoter region were indicated in the heatmap. The gradient color bars indicate the different methylation levels of the two methylation sites (cg05514932, cg09468902) within RETSAT promoter region in each SKCM sample, the browner the color is, the higher methylation level is. (B) The methylation level in RETSAT promoter region positively correlates with SKCM stages in ualcan database. (C,D) Both the DNA (C) and mRNA (D) expressions of RETSAT negatively correlate with the methylation level using SMART database. (E) Kaplan-Meier analysis of OS (overall survival) considering RETSAT methylation level using the TCGA SKCM dataset. (F) The methylation level of RETSAT in different types of human cancers compared with that in normal tissues using SMART database. (G) The relative expression of RETSAT mRNA in B16 cells after 5-azacytidine treatment, examine by Real time RT-PCR assay. *p < 0.05, **p < 0.01, ***p < 0.001.
Since RETSAT might function as a tumor suppressor and immune infiltration was considered as a promising independent prognostic factor in cancers, we next used the TIMER database to investigate the correlation between RETSAT expression and immune infiltration (Li et al., 2017). Specifically, RETSAT CNV significantly correlates with infiltrating levels of B cells, CD8+ T cells, macrophages, neutrophils and dendritic cells (Figure 3A). Next, we analyzed the correlation between RETSAT expression and six types of infiltrating immune cells, including B cells, CD8+ T cells, CD4+ T cells, macrophages, neutrophils and dendritic cells. The results demonstrated that the expression level of RETSAT was positively correlated with the infiltration level of B cells (r = 0.597, p = 3.63e-48), CD8+ T cells (r = 0.422, p = 2.09e-22), CD4+ T cells (r = 0.671, p = 1.25e-64), macrophages (r = 0.478, p = 4.55e-29), neutrophils (r = 0.744, p = 2.67e-86), and dendritic cells (r = 0.837, p = 3.66e-129) in SKCM (Figure 3B). Next, we used TISIDB database to further explore the relationship between RETSAT expression level and immunostimulators and immunoinhibitors, respectively in SKCM (Ru et al., 2019). We found that RETSAT was mostly positively, but negatively, associated with the expression of immunostimulators and the immunoinhibitors, respectively (Tables 2, 3). These results strongly implicate that RETSAT could serve as a key regulator for tumor immune infiltration in SKCM.
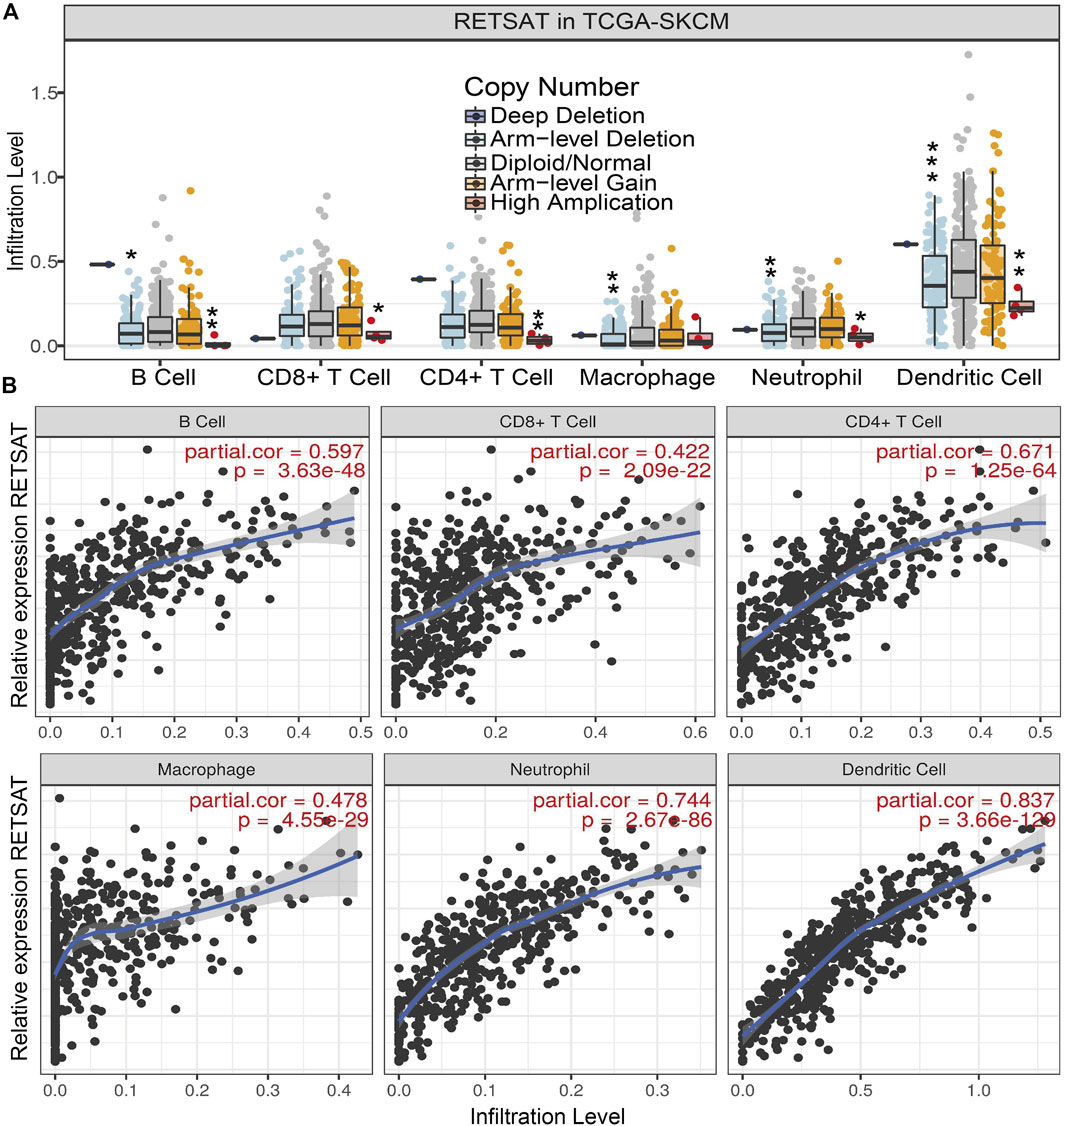
FIGURE 3. RETSAT correlates with immune cell infiltration in tumors. (A) The infiltration levels of various immune cells correlate with RETSAT mutations in SKCM using the TIMER database. (B) The correlation of RETSAT expression level with B cell, CD8+ T cell, CD4+ T cell, macrophage, neutrophil or dendritic cell infiltration level in SKCM analyzed by TIMER database. *p < 0.05, **p < 0.01, ***p < 0.001.
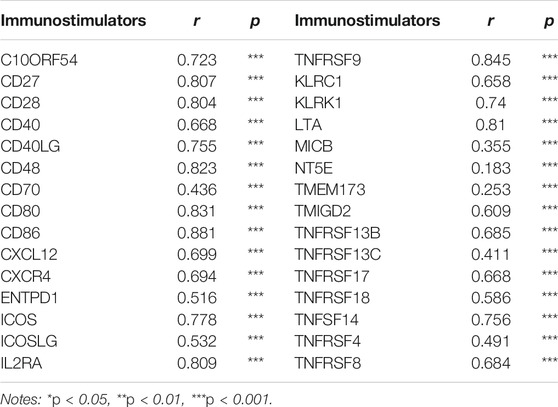
TABLE 2. The correlation analysis between RETSAT and the expression of immunostimulators in SKCM validated by TIMER database.
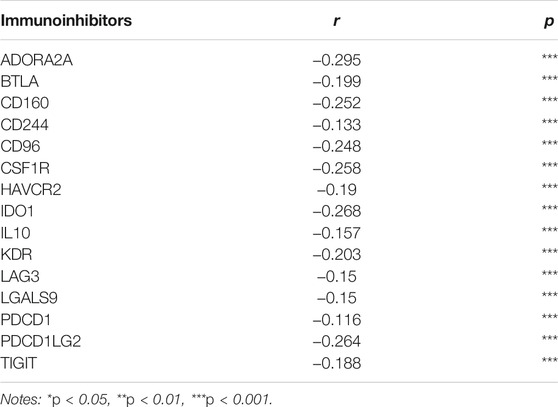
TABLE 3. The correlation analysis between RETSAT and the expressions of immunoinhibitors in SKCM validated by TIMER database.
To examine the functional role of RETSAT in SKCM cells, RETSAT was inhibited by two independent lenti-viral shRNAs in B16 cells and mouse embryonic fibroblasts (MEFs), and the knockdown and overexpression efficiencies were verified by Real-time RT-PCR, cell line expressing scramble shRNA was used as control. As expected, RETSAT knockdown promoted the cell proliferation ability of B16 and MEFs (Figures 4A–D,I,J,L), while RETSAT overexpression led to the opposite effect (Figures 4E–H,K,M). Taken together, these data suggest that RETSAT functions as a tumor suppressor in SKCM.
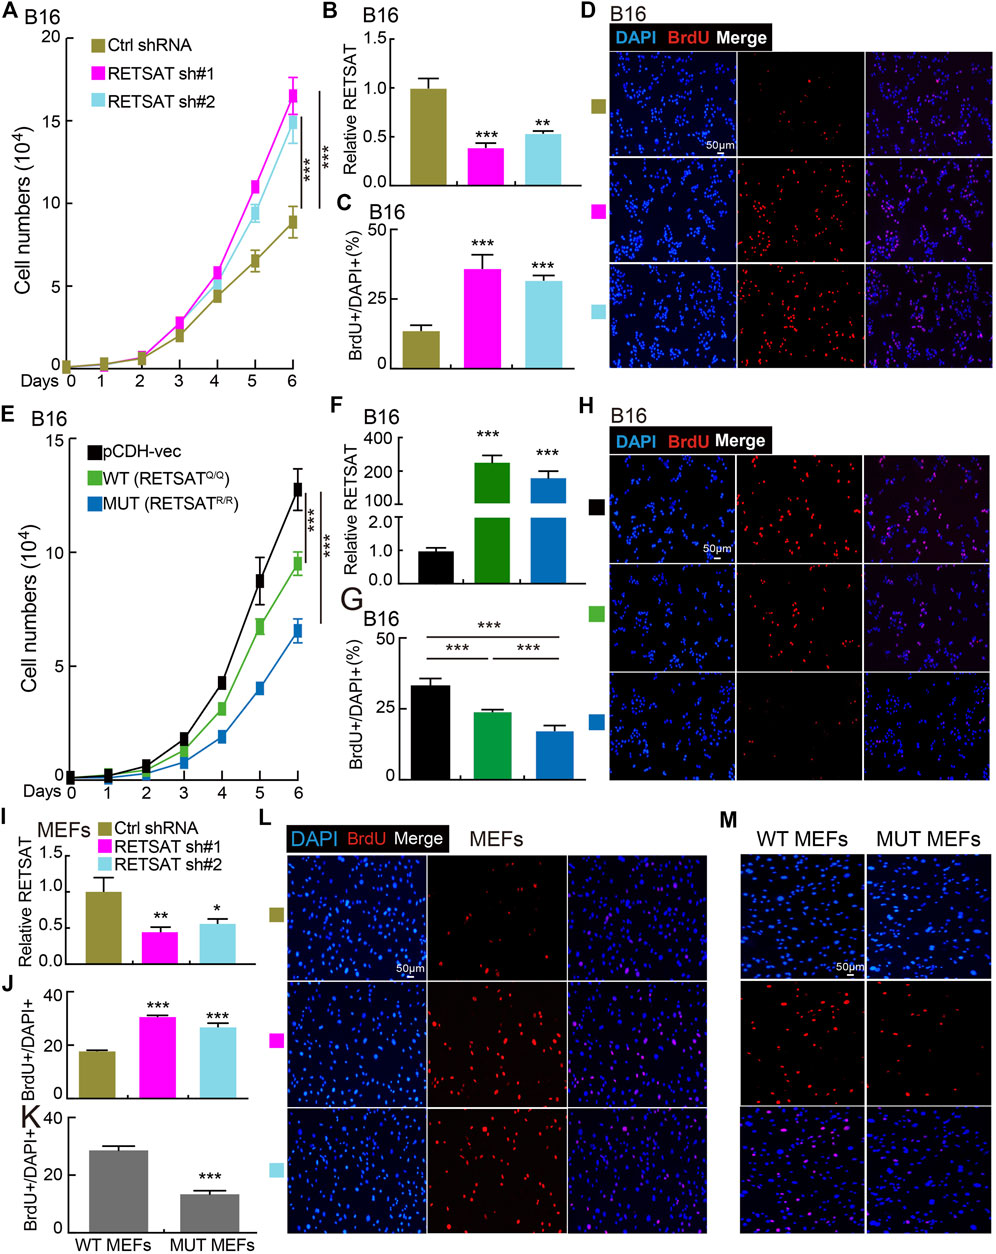
FIGURE 4. RETSAT knockdown promotes cell proliferation. (A) Knockdown of RETSAT promotes B16 cell growth examined by growth curve assay. (B) RETSAT targeting shRNA knockdown efficiency in B16 cells was verified by Real-time RT-PCR assay, scramble shRNA was used as control. sh#1 = shRNA#1, sh#2 = shRNA#2, Ctrl = control. (C,D) Knockdown of RETSAT promotes B16 cell proliferation examined by BrdU incorporation assay, (C) is the quantification data for (D). Scale bar = 50 μm. (E) Overexpression of RETSAT inhibits B16 cell proliferation examined by growth curve assay. (F) RETSAT overexpression efficiency in B16 cells was verified by Real-time RT-PCR assay. (G,H) RETSAT overexpression inhibits B16 cell proliferation examined by BrdU incorporation assay, (G) is the quantification data for (H). Scale bar = 50 μm. (I) RETSAT targeting shRNA knockdown in wild-type MEFs was verified by Real-time RT-PCR assay. (J,L) RETSAT inhibition promotes cell proliferation in MEFs examined by BrdU incorporation assay, (L) is the quantification data for (J). Scale bar = 50 μm. (K,M) RETSATR/R mutant MEFs exhibit higher proliferation rate compared to wild type RETSATQ/Q MEFs, (M) is the quantification data for (L). Scale bar = 50 μm. WT = wild type (RETSATQ/Q). MUT = mutant (RETSATR/R).*p < 0.05, **p < 0.01, ***p < 0.001.
To verify the in vivo functional role of RETSAT during tumorigenesis, we performed both the xenograft tumor formation and DMBA/TPA induced cutaneous keratinocyte carcinoma formation assays. Five-weeks old male mice of RETSATR/R mutant and wild-type littermates were randomly divided into indicated groups, and B16 cells were injected subcutaneously (2 × 10⁵ cells/point). As expected, the subcutaneous tumors in the wild-type littermates (RETSATQ/Q) were detected quickly, whereas the xenograft tumors were markedly retarded in RETSATR/R mice, which was visualized by the reduced tumor mass and volume compared to the control group (Figures 5A–C). Consistently, significant lower proliferation as measured by Ki67 immunohistochemistry (IHC) staining in the xenograft tumor sections from RETSATR/R group was detected, compared to control group (Figures 5D,E). In addition, by using the DMBA/TPA induced cutaneous keratinocyte carcinoma formation assay, better overall survival rate was observed in RETSATR/R mice compared to the littermate wild-type RETSATQ/Q mice (Figures 5F,G).
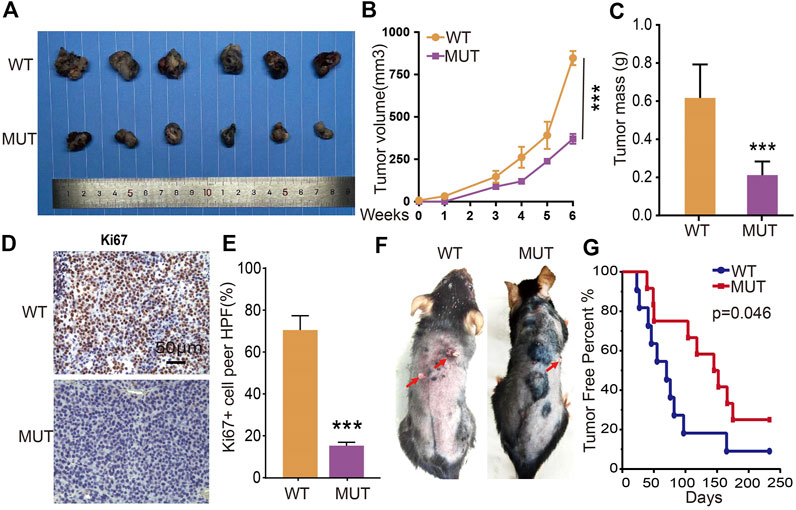
FIGURE 5. RETSAT (Q247R) mutation inhibits tumor growth in vivo. (A–C) RETSAT mutation inhibits xenograft tumor formation in vivo. Representative xenograft tumor images (A), tumor masses (B) and tumor volumes (C). (D,E) Representative IHC staining of Ki67 for indicated xenograft tumors. (F) Representative mice images after DMBA/TPA treatment. WT = wild type (RETSATQ/Q). MUT = mutant (RETSATR/R). (G) The overall survival (OS) analysis for RETSAT mutation and RETSAT WT mice after DMBA/TPA induced cutaneous keratinocyte carcinoma. *p < 0.05, **p < 0.01, ***p < 0.001.
To further explore the molecular events affected by RETSATR/R mutation in SKCM, a protein-protein interaction (PPI) network for RETSAT was created using the STRING database (Szklarczyk et al., 2017) (Figure 6A). Among the interacting proteins, Pin1 and Akt1 caught our attention. The oncogenic factor PIN1 has been well demonstrated to promote the occurrence and development of various cancers (Min et al., 2016; Rustighi et al., 2017; Chen et al., 2018; Nakatsu et al., 2020; Yu et al., 2020). Previous study also documented that Pin1 inhibition using small molecule inhibitor such as ATRA or short hairpin RNA, reduces tumor growth via inhibiting PI3K/AKT signaling pathways (Sun et al., 2019). In addition, we revealed that RETSAT is involved in regulating PI3K/AKT signaling pathway by GSEA dataset analysis (Subramanian et al., 2005), suggesting that RETSAT could inhibit the oncogenic effect mediated by Pin1 in SKCM (Figure 6B).
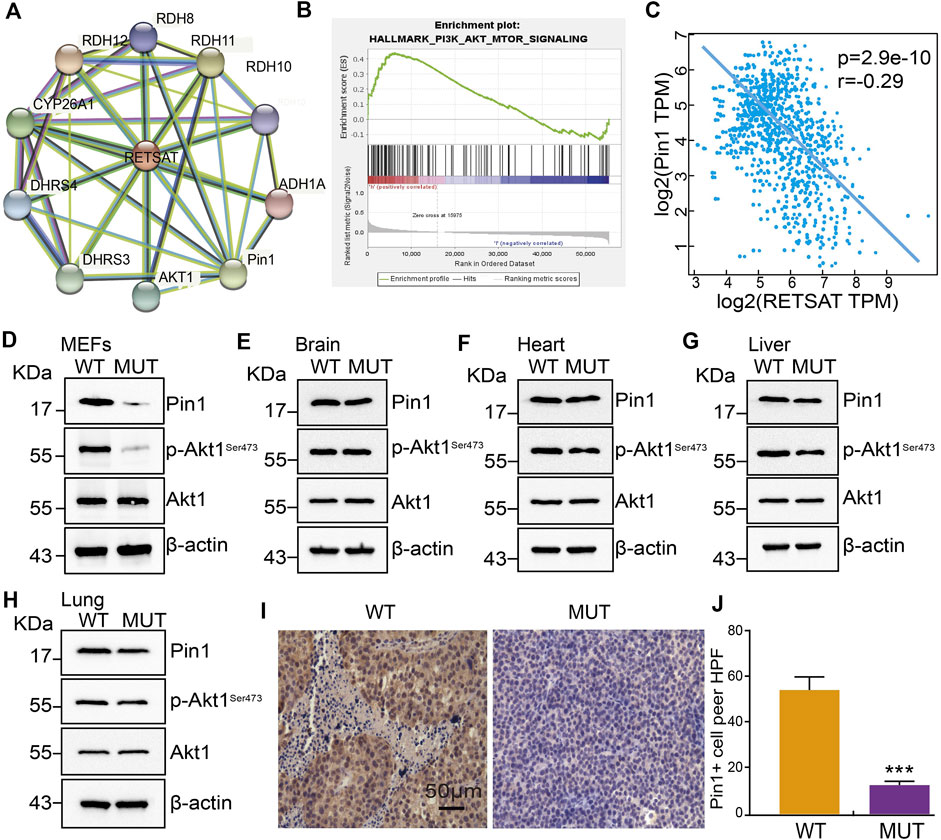
FIGURE 6. RETSAT (Q247R) mutation represses Pin1 related signaling pathway. (A) The protein interaction network of RETSAT was generated using STRING database. (B) Enrichment plots from GSEA showing the PI3K/Akt signaling pathway associated with RETSAT expression in SKCM. (C) The spearman correlation analysis revealed a correlation between RETSAT and Pin1 expression in TCGA-SKCM database. (D–H) Examining the relative protein expressions by immunoblot in MEFs (D), Brain (E), Heart (F), Liver (G) and Lung (H) isolated from of wild-type and mutant mice, respectively. (I–J) Representative IHC staining of PIN1 for indicated xenograft tumors after RETSAT mutation. *p < 0.05, **p < 0.01, ***p < 0.001.
Therefore, we decided to validate the correlation between RETSAT expression and Pin1 related signaling (Sun et al., 2019). We showed that RETSAT expression was significantly negatively correlated with Pin1 in SKCM (r = −0.29, p = 2.9e-10) (Figure 6C). To validate the signaling axis, we used various adult mouse tissues, including brain, heart, liver and lung, and uncovered that the markedly reduced Pin1 and phosphorylated Akt1 proteins in RETSATR/R background could only be detected in MEFs, liver and lung, but not in brain and heart, suggesting that the inhibitory effect could be cellular context or developmental stage dependent (Figures 6D–H). Furthermore, we revealed that RETSATR/R mutation inhibits Pin1 expressions in B16 xenograft tumors, compared to the RETSATQ/Q wild-type control groups, detected by immunohistochemistry (IHC) staining (Figures 6I,J).
Melanoma incidence rates have sky rocketed in the past decades, and there are recurrent somatic mutations that appear frequently in most types of melanoma (Scolyer et al., 2011; Read et al., 2016). Driving mutations have been linked to signaling pathways that regulate proliferation (BRAF, NF1 and PTEN), cellular apoptosis (TP53), and cell cycle control (CDKN2A) (Scolyer et al., 2011; Read et al., 2016). Melanoma cells quickly adapt to the immune response due to the highly mutagenic nature (Lee et al., 2016). Recent studies have demonstrated that melanoma can be efficiently overcome by treating with antibodies against PD1, PD-L1/2 and CTLA-4 (Koller et al., 2016).
Numerous studies focusing on RETSAT have demonstrated its critical role for liver metabolism (Schupp et al., 2009; Heidenreich et al., 2017). RETSAT depletion has been shown to reduce the activity of carbohydrate response element binding protein (ChREBP), a cellular hexose-phosphate sensor and inducer of lipogenesis (Heidenreich et al., 2017). Ectopic expression of RETSAT with an intact, but not a mutated, FAD/NAD dinucleotide-binding motif, increased endogenous PPARgamma transcriptional activity and promoted adipogenesis (Schupp et al., 2009). Previous results showed that all-trans retinoic acid (ATRA), one of the active metabolites of vitamin A, could successfully treat patients with acute promyelocytic leukemia (APL) (Gottardi et al., 2020). Another study uncovered that ATRA prevented the relapse of breast cancer via promoting the differentiation of cancer stem cells (Li et al., 2011). In addition, ATRA has been applied to inhibit tumor cell growth in glioblastoma (Mirani et al., 2019). 9-cis RA (9-cis-13,14-dihydroretinic acid) is a potential activator of RARs and RXRs, which has been uncovered to inhibit tumor progression (Gottardis et al., 1996; Christov et al., 2002; Karsy et al., 2010).
Peptidyl-prolyl cis-trans isomerase NIMA-interacting 1 (Pin1) was originally identified in 1996 (Ping Lu et al., 1996), which functions as an enzyme specifically catalyzing the isomerization of phosphorylated serine-proline or phosphorylated threonine-proline (pSer/Thr-Pro) motifs (Zhou and Lu, 2016). Emerging evidence has demonstrated that Pin1-mediated prolyl isomerization plays pivotal roles under both physiological and pathological conditions, including in human cancers (Sacktor, 2010; Tun-Kyi et al., 2011). Pin1 is aberrantly increased or constitutively activated in multiple tumors (Chen et al., 2018), and high expression of Pin1 is closely correlated to poor clinical prognosis (Zhou and Lu, 2016). Pin1 regulates the self-renewal of Cancer Stem Cells (CSCs) by maintenance the stability of Nanog, octamer-binding protein 4 (OCT4), and MYC (Nishi et al., 2011; Farrell et al., 2013). Importantly, recent study also showed that Pin1 inhibition by ATRA or short hairpin RNA, reduces cancer development by inhibiting Wnt/β-catenin and PI3K/AKT signaling pathways in gastric cancer (Zhang et al., 2019).
In this study, we showed that hypoxia adaptation selection mutant form of RETSATR/R inhibits xenograft tumor cell growth (Xu et al., 2021), and DMBA/TPA induced cutaneous keratinocyte carcinoma formation in vivo. However, higher expression of RETSAT was observed in gliomas (Figure 1A), suggesting that RETSAT may have differential role in the central nervous system. Multiple mutations on RETSAT were also identified in SKCM (Table 1), but none of them is Q247R mutation, which is more likely a gain-of-function mutation based on the in vitro enzymatic assay (Xu et al., 2021). Previous evidence has shown that RETSAT saturates the 13-14 double bond of all-trans-retinol to produce all-trans-13-14-dihydroretinol, a product important for vitamin A metabolism. While, all-trans retinoic acid (ATRA), the active metabolite of vitamin A and the downstream bio-product of RETSAT, has recently been used to inhibit and degrade Pin1, leading to reduced APL and triple negative breast cancer growth (Moise et al., 2004; Wei et al., 2015). Therefore, the extrinsic inhibitory function of RETSATR/R mutant might result from the increased generation of its downstream bio-products (Xu et al., 2021) or/and increased immune infiltration level (Figures 3A,B). In addition, we showed that RETSAT is closely associated with Pin1 and Akt1 by PPI network analysis, and also involved in PI3K/Akt signaling pathway by GSEA analysis (Figures 6A,B). Together with the findings that RETSAT knockdown promotes, while RETSAT overexpression inhibits, mouse B16 and fibroblast cell proliferation (Figures 4A–M), and RETSATR/R mutation reduces Pin1 and phosphorylated Akt1 protein expressions (Figures 6D–H), we hypothesized that the intrinsic inhibitory role of RETSAT could be mediated by protein-protein interaction. Therefore, to further explore the extrinsic and intrinsic mechanisms of RETSAT repressing tumor progression, the gene/protein interacting network as well as the expression profiles of the downstream bio-products, should be thoroughly characterized in the future.
Regard to our findings that RETSAT might play as a tumor suppressor in most types human cancers, we hypothesized that the somatic mutations on RETSAT in SKCM tissues mostly cause loss-of-function. Retinol has six biologically active isoforms, including all-trans, 11-cis, 13-cis, 9,13-di-cis, 9-cis, and 11,13-di-cis, with all-trans being the predominant form (Rhee and Plutzky, 2012). Exploring the potential anti-cancer roles of the precursors of vitamin A metabolism will pave a new way treating SKCM patients, especially those with advanced stages. Therefore, to improve the clinical outcome for SKCM patients, it will be critical to identify new drugs or strategy to stabilize and activate RETSAT in the future.
We employed the TIMER to analyze the correlation between RETSAT expression and immune infiltration (Li et al., 2017). The TISIDB database was employed analyzing the association between RETSAT and immune regulators (immunostimulators or immunoinhibitors) (Ru et al., 2019). GEPIA and UALcan databases were employed to analyze the expression and prognosis of RETSAT in TCGA SKCM (Chandrashekar et al., 2017; Tang et al., 2017).
Mouse embryonic fibroblasts (MEFs) were generated from RETSATR/R (mutant) or RETSATQ/Q (wild-type) mice, and B16 cells were cultured in DMEM medium (Corning) supplemented with 10% fetal bovine serum (FBS) and 1% penicillin/streptomycin. Cells were all incubated in a humidified atmosphere with 5% CO2 at 37°C.
As described before (Xu et al., 2021), RETSAT CDS (or mutant CDS DNA fragment) was sub-cloned into pCDH-MSCV-E2F-eGFP lenti-viral vector with a 3×Flag tag at the C-terminus. Independent shRNAs targeting RETSAT mRNA were synthesized and sub-cloned into the lenti-viral vector pLKO.1 (Addgene, Cambridge, United States). Cells were transfected with indicated shRNAs or control scramble shRNA using Lipofectamine 2000 (Invitrogen), and then collected for various experiments, mouse mRETSAT-shRNA#1: GTGGTGTCCTCCCTCCTACAG, mRETSAT-shRNA#2: AGCAATTCCTTGCACATATAA.
For Real-time RT-PCR assay, indicated cells were lysed by RNAiso Plus (Takara Bio, Beijing, China, Cat. 108-95-2). Total RNAs were extracted according to the manufacturer’s protocol, and then reverse transcribed using RT reagent Kit (Takara Bio, Beijing, China, Cat. RR047A; TIANGEN Biotech, Beijing, China, Cat. KR211-02). Real-time PCR was performed by FastStart Universal SYBR Green Master Mix (Roche, Cat. 04194194001; TIANGEN Biotech, Beijing, China, Cat. FP411-02) using an Applied Biosystems 7500 machine. The primers used in this study are: mRETSAT-qPCR-F: CCCATCAAGCAAGGATCCAA, mRETSAT-qPCR-R: ATGGGTACCAGCGCAGTCA.
The cell proliferation assay was performed as previously described (Xu et al., 2020). For cell growth assay, indicated cells were plated into 12-well plates and the cell numbers were subsequently counted each day. For BrdU incorporation assay, indicated cells were cultured in 8-well plates for 24 h, pulsed with 10 μM BrdU (Abcam, Cat# ab142567) for 20 min, and fixed with 4% PFA (paraformaldehyde). Cells were then incubated with BrdU (Cell Signaling Technology, Cat# 5292s, dilution 1:1,000) primary antibody followed by secondary antibody detection (Abclonal, Cat# 61303, dilution 1:500). Cell nuclei were stained with DAPI (4′, 6-diamidino-2-phenylindole).
The transgenic mice (RETSATR/R) and their wild-type littermates (RETSATQ/Q) were derived from C57BL/6 mouse. About 4–6 weeks old age mice were subcutaneously injected with B16 cell lines (2 × 10⁵ cells), 3 weeks later, all mice were sacrificed. The xenograft tumors from indicated groups were harvested and weighted. The mice were monitored every other day, xenograft tumor weights and volumes were measured with a sliding caliper, and tumor volumes were calculated using the formula (L×W2)/2. All animals were kept in a SPF environment and the protocols were pre-approved and conducted under the policy of Animal care and Use Committee at the Kunming Institute of Zoology, CAS.
The assay was performed as previously described (Darido et al., 2011; Jiang et al., 2017). Briefly, 25 μg DMBA (Sigma Aldrich) in 200 µl acetone were applied to the dorsal skin after shaving. After 2 weeks, TPA (10 nmol) in 200 μl was applied to the same area twice weekly for up to 30 weeks. Skin specimens were collected 5 and 8 weeks after DMBA treatment, and when papilloma and SCC formed. The number of tumors per mouse was counted each week as palpable mass >1 mm in size.
To detect the protein expressions of Pin1, Akt1 and P-Akt1, cells were lysed in IP lysis buffer, supplemented with complete protease inhibitor cocktail (Complete Mini, Roche). Indicated proteins were detected with indicated antibodies by western blot. Proteins were resolved on SDS polyacrylamide gels, and then transferred to a polyvinylidene difluoride membrane. After blocking with 5% (w/v) milk, the membrane was stained with indicated primary antibodies as follows: Pin1(Catalog number, R25374, Dilution, 1:1,000, Supplier, ZENBIO), (Akt, Catalog number, 9272, Dilution, 1:1,000, Supplier, Cell Signaling Technology), (p-S473-Akt, Catalog number, 9271, Dilution, 1:1,000, Supplier, Cell Signaling Technology), β-actin (Catalog number, 60008-1-1g, Dilution, 1:20,000, Supplier Proteintech).
For immunohistochemical staining, the sections were deparaffinized in xylene and rehydrated through graded ethanol. Antigen retrieval was performed for 20 min at 95°C with sodium citrate buffer (pH 6.0). After quenching endogenous peroxidase activity with 3% H2O2 and blocking non-specific binding with 1% bovine serum albumin buffer, sections were incubated overnight at 4°C with indicated primary antibodies: Pin1(Catalog number, R25374, Dilution, 1:1,000, Supplier, ZENBIO), Ki67 (Catalog number, 170, Dilution, 1:400, Supplier, NOVUS). Following several washes, the sections were treated with HRP conjugated secondary antibody for 40 min at room temperature, and stained with 3, 3-diaminobenzidine tetrahydrochloride (DAB). Slides were photographed with microscope (Olympus BX43F, Japan). The photographs were analyzed with the Image-Pro Plus 7.0 software (Media Cybernetics, Inc., Silver Spring, MD, United States).
All data are presented as the mean ± SEM. All experiments were performed at least three times. All analyses were performed using GraphPad Prism 7 (GraphPad Software). Two-tailed Student’s t-test was used for statistical analysis for experiments with two comparisons. p-values less than 0.05 were considered statistically significant. For all figures, *p < 0.05, **p < 0.01, ***p < 0.001.
The original contributions presented in the study are included in the article/Supplementary Material, further inquiries can be directed to the corresponding authors.
The animal study was reviewed and approved by All animals were kept in a SPF environment and the protocols were pre-approved and conducted under the policy of Animal care and Use Committee at the Kunming Institute of Zoology, CAS.
YC and PS initiated the project. YC and CY supervised and wrote the manuscript. XJ and YH performed the in vitro and in vivo functional assays. QS, LD, YY, LT, YS, BL, HZ, helped the bioinformatics and immunoblot assays.
This study was supported by National Nature Science Foundation of China (U1902216, 81772996, 82173110, 82002439), Yunnan Applied Basic Research Projects (2019FJ009, 202001AS070037, 2019HB076). CY was supported by Youth Innovation Promotion Association, CAS; Yunnan Ten Thousand Talents Plan Young and Elite Talents Project. YC was supported by grant from CAS, YJKYYQ20190048; Science and Technology Department of Sichuan Province Research Program (2020YFSY0009).
The authors declare that the research was conducted in the absence of any commercial or financial relationships that could be construed as a potential conflict of interest.
All claims expressed in this article are solely those of the authors and do not necessarily represent those of their affiliated organizations, or those of the publisher, the editors and the reviewers. Any product that may be evaluated in this article, or claim that may be made by its manufacturer, is not guaranteed or endorsed by the publisher.
The Supplementary Material for this article can be found online at: https://www.frontiersin.org/articles/10.3389/fcell.2021.744992/full#supplementary-material
Beall, C. M., Cavalleri, G. L., Deng, L., Elston, R. C., Gao, Y., Knight, J., et al. (2010). Natural Selection on EPAS1 (HIF2 ) Associated with Low Hemoglobin Concentration in Tibetan Highlanders. Proc. Natl. Acad. Sci. 107, 11459–11464. doi:10.1073/pnas.1002443107
Beall, C. M., Decker, M. J., Brittenham, G. M., Kushner, I., Gebremedhin, A., and Strohl, K. P. (2002). An Ethiopian Pattern of Human Adaptation to High-Altitude Hypoxia. Proc. Natl. Acad. Sci. 99, 17215–17218. doi:10.1073/pnas.252649199
Brustugun, O. T. (2015). Hypoxia as a Cause of Treatment Failure in Non-small Cell Carcinoma of the Lung. Semin. Radiat. Oncol. 25, 87–92. doi:10.1016/j.semradonc.2014.11.006
Brutsaert, T. D. (2008). Do high-altitude Natives Have Enhanced Exercise Performance at Altitude? Appl. Physiol. Nutr. Metab. 33, 582–592. doi:10.1139/h08-009
Chandrashekar, D. S., Bashel, B., Balasubramanya, S. A. H., Creighton, C. J., Ponce-Rodriguez, I., Chakravarthi, B. V. S. K., et al. (2017). UALCAN: A Portal for Facilitating Tumor Subgroup Gene Expression and Survival Analyses. Neoplasia 19, 649–658. doi:10.1016/j.neo.2017.05.002
Chen, Y., Wu, Y.-r., Yang, H.-y., Li, X.-z., Jie, M.-m., Hu, C.-j., et al. (2018). Prolyl Isomerase Pin1: a Promoter of Cancer and a Target for Therapy. Cell Death Dis 9, 883. doi:10.1038/s41419-018-0844-y
Cheviron, Z. A., and Brumfield, R. T. (2012). Genomic Insights into Adaptation to High-Altitude Environments. Heredity 108, 354–361. doi:10.1038/hdy.2011.85
Christman, J. K. (2002). 5-Azacytidine and 5-Aza-2′-Deoxycytidine as Inhibitors of DNA Methylation: Mechanistic Studies and Their Implications for Cancer Therapy. Oncogene 21, 5483–5495. doi:10.1038/sj.onc.1205699
Christov, K. T., Moon, R. C., Lantvit, D. D., Boone, C. W., Steele, V. E., Lubet, R. A., et al. (2002). 9-cis-retinoic Acid but Not 4-(hydroxyphenyl)retinamide Inhibits Prostate Intraepithelial Neoplasia in Noble Rats. Cancer Res. 62, 5178–5182.
Darido, C., Georgy, S. R., Wilanowski, T., Dworkin, S., Auden, A., Zhao, Q., et al. (2011). Targeting of the Tumor Suppressor GRHL3 by a miR-21-dependent Proto-Oncogenic Network Results in PTEN Loss and Tumorigenesis. Cancer cell 20, 635–648. doi:10.1016/j.ccr.2011.10.014
De Bels, D., Corazza, F., and Balestra, C. (2011). Oxygen Sensing, Homeostasis, and Disease. N. Engl. J. Med. 365, 1845–1846. doi:10.1056/NEJMc1110602
Farrell, A. S., Pelz, C., Wang, X., Daniel, C. J., Wang, Z., Su, Y., et al. (2013). Pin1 Regulates the Dynamics of C-Myc DNA Binding to Facilitate Target Gene Regulation and Oncogenesis. Mol. Cel Biol 33, 2930–2949. doi:10.1128/mcb.01455-12
Gao, J., Aksoy, B. A., Dogrusoz, U., Dresdner, G., Gross, B., Sumer, S. O., et al. (2013). Integrative Analysis of Complex Cancer Genomics and Clinical Profiles Using the cBioPortal. Sci. Signal. 6, pl1. doi:10.1126/scisignal.2004088
Gottardi, M., Sperotto, A., Ghelli Luserna Di Rorà, A., Padella, A., Cangini, D., Giannini, M. B., et al. (2020). Gemtuzumab Ozogamicin in Acute Myeloid Leukemia: Past, Present and Future. Minerva Med. 111, 395–410. doi:10.23736/S0026-4806.20.07019-6
Gottardis, M. M., Lamph, W. W., Shalinsky, D. R., Wellstein, A., and Heyman, R. A. (1996). The Efficacy of 9-cis Retinoic Acid in Experimental Models of Cancer. Breast Cancer Res. Tr 38, 85–96. doi:10.1007/bf01803787
Heidenreich, S., Witte, N., Weber, P., Goehring, I., Tolkachov, A., von Loeffelholz, C., et al. (2017). Retinol Saturase Coordinates Liver Metabolism by Regulating ChREBP Activity. Nat. Commun. 8, 384. doi:10.1038/s41467-017-00430-w
Jiang, L. P., Shen, Q. S., Yang, C. P., and Chen, Y. B. (2017). Establishment of Basal Cell Carcinoma Animal Model in Chinese Tree Shrew (Tupaia Belangeri Chinensis). Zool Res. 38, 180–190. doi:10.24272/j.issn.2095-8137.2017.045
Kang, J., Shin, S.-H., Yoon, H., Huh, J., Shin, H.-W., Chun, Y.-S., et al. (2018). FIH Is an Oxygen Sensor in Ovarian Cancer for G9a/GLP-Driven Epigenetic Regulation of Metastasis-Related Genes. Cancer Res. 78, 1184–1199. doi:10.1158/0008-5472.can-17-2506
Karsy, M., Albert, L., Tobias, M. E., Murali, R., and Jhanwar-Uniyal, M. (2010). All-trans Retinoic Acid Modulates Cancer Stem Cells of Glioblastoma Multiforme in an MAPK-dependent Manner. Anticancer Res. 30, 4915–4920.
Koller, K. M., Wang, W., Schell, T. D., Cozza, E. M., Kokolus, K. M., Neves, R. I., et al. (2016). Malignant Melanoma-The Cradle of Anti-neoplastic Immunotherapy. Crit. Rev. oncology/hematology 106, 25–54. doi:10.1016/j.critrevonc.2016.04.010
Lee, N., Zakka, L. R., Mihm, M. C., and Schatton, T. (2016). Tumour-infiltrating Lymphocytes in Melanoma Prognosis and Cancer Immunotherapy. Pathology 48, 177–187. doi:10.1016/j.pathol.2015.12.006
Lee, P., Chandel, N. S., and Simon, M. C. (2020). Cellular Adaptation to Hypoxia through Hypoxia Inducible Factors and beyond. Nat. Rev. Mol. Cel Biol 21, 268–283. doi:10.1038/s41580-020-0227-y
Li, R.-J., Ying, X., Zhang, Y., Ju, R.-J., Wang, X.-X., Yao, H.-J., et al. (2011). All-trans Retinoic Acid Stealth Liposomes Prevent the Relapse of Breast Cancer Arising from the Cancer Stem Cells. J. Controlled Release 149, 281–291. doi:10.1016/j.jconrel.2010.10.019
Li, T., Fan, J., Wang, B., Traugh, N., Chen, Q., Liu, J. S., et al. (2017). TIMER: A Web Server for Comprehensive Analysis of Tumor-Infiltrating Immune Cells. Cancer Res. 77, e108–e110. doi:10.1158/0008-5472.can-17-0307
Li, Y., Ge, D., and Lu, C. (2019). The SMART App: an Interactive Web Application for Comprehensive DNA Methylation Analysis and Visualization. Epigenetics & Chromatin 12, 71. doi:10.1186/s13072-019-0316-3
Min, S.-H., Zhou, X. Z., and Lu, K. P. (2016). The Role of Pin1 in the Development and Treatment of Cancer. Arch. Pharm. Res. 39, 1609–1620. doi:10.1007/s12272-016-0821-x
Mirani, B., Pagan, E., Shojaei, S., Duchscherer, J., Toyota, B. D., Ghavami, S., et al. (2019). A 3D Bioprinted Hydrogel Mesh Loaded with All-Trans Retinoic Acid for Treatment of Glioblastoma. Eur. J. Pharmacol. 854, 201–212. doi:10.1016/j.ejphar.2019.04.007
Modhukur, V., Iljasenko, T., Metsalu, T., Lokk, K., Laisk-Podar, T., and Vilo, J. (2018). MethSurv: a Web Tool to Perform Multivariable Survival Analysis Using DNA Methylation Data. Epigenomics 10, 277–288. doi:10.2217/epi-2017-0118
Moise, A. R., Kuksa, V., Blaner, W. S., Baehr, W., and Palczewski, K. (2005). Metabolism and Transactivation Activity of 13,14-dihydroretinoic Acid. J. Biol. Chem. 280, 27815–27825. doi:10.1074/jbc.m503520200
Moise, A. R., Kuksa, V., Imanishi, Y., and Palczewski, K. (2004). Identification of All-Trans-Retinol:all-Trans-13,14-Dihydroretinol Saturase. J. Biol. Chem. 279, 50230–50242. doi:10.1074/jbc.m409130200
Nakatsu, Y., Yamamotoya, T., Ueda, K., Ono, H., Inoue, M.-K., Matsunaga, Y., et al. (2020). Prolyl Isomerase Pin1 in Metabolic Reprogramming of Cancer Cells. Cancer Lett. 470, 106–114. doi:10.1016/j.canlet.2019.10.043
Nishi, M., Akutsu, H., Masui, S., Kondo, A., Nagashima, Y., Kimura, H., et al. (2011). A Distinct Role for Pin1 in the Induction and Maintenance of Pluripotency. J. Biol. Chem. 286, 11593–11603. doi:10.1074/jbc.m110.187989
Pang, X.-Y., Wang, S., Jurczak, M. J., Shulman, G. I., and Moise, A. R. (2017). Retinol Saturase Modulates Lipid Metabolism and the Production of Reactive Oxygen Species. Arch. Biochem. Biophys. 633, 93–102. doi:10.1016/j.abb.2017.09.009
Ping Lu, K., Hanes, S. D., and Hunter, T. (1996). A Human Peptidyl-Prolyl Isomerase Essential for Regulation of Mitosis. Nature 380, 544–547. doi:10.1038/380544a0
Rademaker, K., Hodgins, G., Moore, K., Zarrillo, S., Miller, C., Bromley, G. R. M., et al. (2014). Paleoindian Settlement of the High-Altitude Peruvian Andes. Science 346, 466–469. doi:10.1126/science.1258260
Read, J., Wadt, K. A. W., and Hayward, N. K. (2016). Melanoma Genetics. J. Med. Genet. 53, 1–14. doi:10.1136/jmedgenet-2015-103150
Rhee, E.-J., and Plutzky, J. (2012). Retinoid Metabolism and Diabetes Mellitus. Diabetes Metab. J. 36, 167–180. doi:10.4093/dmj.2012.36.3.167
Ru, B., Wong, C. N., Tong, Y., Zhong, J. Y., Zhong, S. S. W., Wu, W. C., et al. (2019). TISIDB: an Integrated Repository portal for Tumor-Immune System Interactions. Bioinformatics (Oxford, England) 35, 4200–4202. doi:10.1093/bioinformatics/btz210
Rustighi, A., Zannini, A., Campaner, E., Ciani, Y., Piazza, S., and Del Sal, G. (2017). PIN1 in Breast Development and Cancer: a Clinical Perspective. Cell Death Differ 24, 200–211. doi:10.1038/cdd.2016.122
Scheinfeldt, L. B., Soi, S., Thompson, S., Ranciaro, A., Woldemeskel, D., Beggs, W., et al. (2012). Genetic Adaptation to High Altitude in the Ethiopian highlands. Genome Biol. 13, R1. doi:10.1186/gb-2012-13-1-r1
Schödel, J., and Ratcliffe, P. J. (2019). Mechanisms of Hypoxia Signalling: New Implications for Nephrology. Nat. Rev. Nephrol. 15, 641–659. doi:10.1038/s41581-019-0182-z
Schupp, M., Lefterova, M. I., Janke, J., Leitner, K., Cristancho, A. G., Mullican, S. E., et al. (2009). Retinol Saturase Promotes Adipogenesis and Is Downregulated in Obesity. Proc. Natl. Acad. Sci. 106, 1105–1110. doi:10.1073/pnas.0812065106
Scolyer, R. A., Long, G. V., and Thompson, J. F. (2011). Evolving Concepts in Melanoma Classification and Their Relevance to Multidisciplinary Melanoma Patient Care. Mol. Oncol. 5, 124–136. doi:10.1016/j.molonc.2011.03.002
Shi, Y., Fan, S., Wu, M., Zuo, Z., Li, X., Jiang, L., et al. (2019). YTHDF1 Links Hypoxia Adaptation and Non-small Cell Lung Cancer Progression. Nat. Commun. 10, 4892. doi:10.1038/s41467-019-12801-6
Storz, J. F., and Scott, G. R. (2021). Phenotypic Plasticity, Genetic Assimilation, and Genetic Compensation in Hypoxia Adaptation of High-Altitude Vertebrates. Comp. Biochem. Physiol. A: Mol. Integr. Physiol. 253, 110865. doi:10.1016/j.cbpa.2020.110865
Subramanian, A., Tamayo, P., Mootha, V. K., Mukherjee, S., Ebert, B. L., Gillette, M. A., et al. (2005). Gene Set Enrichment Analysis: a Knowledge-Based Approach for Interpreting Genome-wide Expression Profiles. Proc. Natl. Acad. Sci. 102, 15545–15550. doi:10.1073/pnas.0506580102
Sun, B., Zhang, Y., Zhou, L., Yin, L., Li, F., Li, C., et al. (2019). The Proliferation of Cervical Cancer Is Promoted by miRNA-125b through the Regulation of the HMGA1. Ott 12, 2767–2776. doi:10.2147/ott.s197740
Szklarczyk, D., Morris, J. H., Cook, H., Kuhn, M., Wyder, S., Simonovic, M., et al. (2017). The STRING Database in 2017: Quality-Controlled Protein-Protein Association Networks, Made Broadly Accessible. Nucleic Acids Res. 45, D362–d368. doi:10.1093/nar/gkw937
Tang, Z., Li, C., Kang, B., Gao, G., Li, C., and Zhang, Z. (2017). GEPIA: a Web Server for Cancer and normal Gene Expression Profiling and Interactive Analyses. Nucleic Acids Res. 45, W98–W102. doi:10.1093/nar/gkx247
Tun-Kyi, A., Finn, G., Greenwood, A., Nowak, M., Lee, T. H., Asara, J. M., et al. (2011). Essential Role for the Prolyl Isomerase Pin1 in Toll-like Receptor Signaling and Type I Interferon-Mediated Immunity. Nat. Immunol. 12, 733–741. doi:10.1038/ni.2069
Wei, S., Kozono, S., Kats, L., Nechama, M., Li, W., Guarnerio, J., et al. (2015). Active Pin1 Is a Key Target of All-Trans Retinoic Acid in Acute Promyelocytic Leukemia and Breast Cancer. Nat. Med. 21, 457–466. doi:10.1038/nm.3839
Wu, D.-D., Yang, C.-P., Wang, M.-S., Dong, K.-Z., Yan, D.-W., Hao, Z.-Q., et al. (2020). Convergent Genomic Signatures of High-Altitude Adaptation Among Domestic Mammals. Natl. Sci. Rev. 7, 952–963. doi:10.1093/nsr/nwz213
Xiong, Q., Liu, B., Ding, M., Zhou, J., Yang, C., and Chen, Y. (2020). Hypoxia and Cancer Related Pathology. Cancer Lett. 486, 1–7. doi:10.1016/j.canlet.2020.05.002
Xu, D., Yang, C., Shen, Q., Pan, S., Liu, Z., Zhang, T., et al. (2021). A Single Mutation Underlying Phenotypic Convergence for Hypoxia Adaptation on the Qinghai-Tibetan Plateau. London, England: Cell research.
Xu, P., Jiang, L., Yang, Y., Wu, M., Liu, B., Shi, Y., et al. (2020). PAQR4 Promotes Chemoresistance in Non-small Cell Lung Cancer through Inhibiting Nrf2 Protein Degradation. Theranostics 10, 3767–3778. doi:10.7150/thno.43142
Yang, G., Shi, R., and Zhang, Q. (2020). Hypoxia and Oxygen-Sensing Signaling in Gene Regulation and Cancer Progression. Int. J. Mol. Sci. 21. doi:10.3390/ijms21218162
Yi, X., Liang, Y., Huerta-Sanchez, E., Jin, X., Cuo, Z. X. P., Pool, J. E., et al. (2010). Sequencing of 50 Human Exomes Reveals Adaptation to High Altitude. Science 329, 75–78. doi:10.1126/science.1190371
Yu, J. H., Im, C. Y., and Min, S.-H. (2020). Function of PIN1 in Cancer Development and its Inhibitors as Cancer Therapeutics. Front. Cel Dev. Biol. 8, 120. doi:10.3389/fcell.2020.00120
Zhang, Z., Yu, W., Zheng, M., Liao, X., Wang, J., Yang, D., et al. (2019). Pin1 Inhibition Potently Suppresses Gastric Cancer Growth and Blocks PI3K/AKT and Wnt/β‐catenin Oncogenic Pathways. Mol. Carcinog 58, 1450–1464. doi:10.1002/mc.23027
Zhou, X. Z., and Lu, K. P. (2016). The Isomerase PIN1 Controls Numerous Cancer-Driving Pathways and Is a Unique Drug Target. Nat. Rev. Cancer 16, 463–478. doi:10.1038/nrc.2016.49
Keywords: retinol saturase (RETSAT), hypoxia adaptation, evolution, Pin1, skin cutaneous melanoma (SKCM)
Citation: Jiang X, He Y, Shen Q, Duan L, Yuan Y, Tang L, Shi Y, Liu B, Zhai H, Shi P, Yang C and Chen Y (2021) RETSAT Mutation Selected for Hypoxia Adaptation Inhibits Tumor Growth. Front. Cell Dev. Biol. 9:744992. doi: 10.3389/fcell.2021.744992
Received: 21 July 2021; Accepted: 18 October 2021;
Published: 04 November 2021.
Edited by:
Yih-Cherng Liou, National University of Singapore, SingaporeReviewed by:
Fuming Li, Fudan University, ChinaCopyright © 2021 Jiang, He, Shen, Duan, Yuan, Tang, Shi, Liu, Zhai, Shi, Yang and Chen. This is an open-access article distributed under the terms of the Creative Commons Attribution License (CC BY). The use, distribution or reproduction in other forums is permitted, provided the original author(s) and the copyright owner(s) are credited and that the original publication in this journal is cited, in accordance with accepted academic practice. No use, distribution or reproduction is permitted which does not comply with these terms.
*Correspondence: Yongbin Chen, eWJjaGVuQG1haWwua2l6LmFjLmNu; Cuiping Yang, Y3VpcGluZ3lhbmdAbWFpbC5raXouYWMuY24=; Peng Shi, c2hpcEBtYWlsLmtpei5hYy5jbg==
†These authors have contributed equally to this work
Disclaimer: All claims expressed in this article are solely those of the authors and do not necessarily represent those of their affiliated organizations, or those of the publisher, the editors and the reviewers. Any product that may be evaluated in this article or claim that may be made by its manufacturer is not guaranteed or endorsed by the publisher.
Research integrity at Frontiers

Learn more about the work of our research integrity team to safeguard the quality of each article we publish.