 Apurva Gahankari
 Chunmin Dong
 Garrett Bartoletti
 Maria Galazo
 Fenglei He
- 1Department of Cell and Molecular Biology, Tulane University, New Orleans, LA, United States
- 2Tulane Brain Institute, Tulane University, New Orleans, LA, United States
Mutations in RAC1 allele are implicated in multiple brain tumors, indicating a rigorous control of Rac1 activity is required for neural tissue normal development and homeostasis. To understand how elevated Rac1 activity affects neural crest cells (NCCs) development, we have generated Rac1CA;Wnt1-Cre2 mice, in which a constitutively active Rac1G12V mutant is expressed specifically in NCCs derivatives. Our results revealed that augmented Rac1 activity leads to enlarged midbrain and altered cell density, accompanied by increased NCCs proliferation rate and misrouted cell migration. Interestingly, our experimental data also showed that elevated Rac1 activity in NCCs disrupts regionalization of dopaminergic neuron progenitors in the ventral midbrain and impairs their differentiation. These findings shed light on the mechanisms of RAC1 mutation correlated brain tumor at the cellular and molecular level.
Introduction
Small GTPases are essential for embryonic development and homeostasis. Ras-related C3 botulinum toxin substrate 1 (Rac1), which encodes a small GTPase of the Ras superfamily, is implicated in multiple processes including actin cytoskeleton rearrangement, cell migration, and cell cycle progression (Didsbury et al., 1989; Ridley, 2001; Wittmann et al., 2003; Hall, 2005; Bosco et al., 2009; Hua et al., 2015). In cells, Rac1 protein shuttles between two states, the GTP-bound active state and GDP-bound inactive form. Formation of Rac1-GTP is catalyzed by guanine exchange factors (GEFs), which facilitate exchange of GDP for GTP (Rossman et al., 2005). On the other hand, Rac1-GTP can be inactivated by GTPase activating proteins (GAPs), which hydrolyze Rac1 bound GTP to GDP (Jaffe and Hall, 2005). GEFs and GAPs recognize and bind to specific amino acids of Rac1 and modulate its activity. Mutation in these amino acids causes deregulated Rac1 activity. For example, G12V mutation of Rac1 impairs its interaction with GAP, and causes its constitutive activation in a Rac1-GTP form (Kobayashi et al., 1998). Mutation in RAC1 and its regulators have been implicated in abnormal development and tumorigenesis (Khalil and El-Sibai, 2012). In brain tumors, multiple mutations in RAC1 putative effector domain have been identified (Hwang et al., 2004), suggesting a correlation between excessive RAC1 activity and brain tumorigenesis and abnormal development. However, the mechanisms underlying excessive Rac1 activity in regulation of neuronal tissues and brain development have not been fully elucidated.
Neural crest cells (NCCs) are a unique cell population characterized by their transient, highly migratory, and multi-potent features (Le Douarin and Kalcheim, 1999). Originated as ectodermal cells at the border of the neural plate at the dorsal neural tube, NCCs undergo epithelial to mesenchymal transition (EMT), then migrate to the ventral destinations. Lineage tracing studies demonstrate that NCCs give rise to a broad range of cell types in craniofacial and cardiovascular tissues (Chai et al., 2000; Jiang et al., 2000, 2002; Yoshida et al., 2008). NCCs derivatives are also identified in the developing midbrain (Jiang et al., 2002; Lewis et al., 2013). Neural crest development is subject to rigorous genetic control (Simões-Costa and Bronner, 2015; Bronner and Simões-Costa, 2016). While Rac1 is required for all three germ layers formation, as Rac1 null mutant mice die at embryonic day (E) 9.5 (Sugihara et al., 1998), tissue-specific inactivation in mice identified an important role for Rac1 in neural crest development. Wnt1Cre mediated Rac1 deletion in NCCs causes embryonic lethality at E12.5 with severe midfacial clefting and cardiovascular malformation (Fuchs et al., 2009; Thomas et al., 2010). We have reported that chemical inhibition of Rac1 activity represses NCCs proliferation and migration in neural crest explant culture (He and Soriano, 2013). Together, these studies demonstrated that Rac1 is essential for NCCs development using loss-of-function models.
At the onset of midbrain development, NCCs derived cells are detected at the midbrain-hindbrain boundary, in close proximity to the ventral midbrain dopaminergic neurons (mDA). The mDA differentiation is well documented and can be divided into three stages. First, the mDA precursors are induced within the neuroepithelium and express Shh, Wnt1, and other midbrain regionalization markers at E8.5–10.5. Next, these mDA progenitors undergo differentiation characterized by the expression of neurogenin-2 (Ngn2) and nuclear receptor related 1 (Nurr1) between E10.5 and E12.5. Finally, mDA undergo terminal differentiation and are characterized by the expression of tyrosine hydroxylase (TH) at E12.5 (Prakash and Wurst, 2006a,b; Gale and Li, 2008; Lewis et al., 2013). Previous studies also showed that Rac1 is implicated in dopaminergic neuron development (Čajánek et al., 2013; Hua et al., 2015; Kim et al., 2018). However, whether augmented Rac1 activity affects mDA development has not been elucidated.
To understand how augmented Rac1 activity affects NCCs and midbrain development, we have generated Rac1CA;Wnt1-Cre2 mice, which express Rac1G12V specifically in NCCs derivatives (Srinivasan et al., 2009; Lewis et al., 2013). Our data showed that Rac1CA;Wnt1-Cre2 can survive to adulthood with enlarged midbrain. Histological analysis revealed that cell density and organization are altered in the mutant midbrain. At the cellular level, the mutant NCCs exhibit increased proliferation rate and abnormal migration patterns. Interestingly, we have identified dramatic loss of mDA and likely impaired neuronal differentiation in the mutant ventral midbrain. These findings, together with the results from previous studies using loss-of-function models, provide a comprehensive view of Rac1 regulation on NCCs and mDA development.
Materials and Methods
Animals
All animal experimentation was approved by the Institutional Animal Care and Use Committee of Tulane University. Rosa26-LSL-Rac1G12V (Srinivasan et al., 2009), referred to as Rac1CA and B6.Cg-E2f1Tg(Wnt1–cre)2Sor/J (Lewis et al., 2013), referred to as Wnt1-Cre2, are maintained on a C57BL6/J129 mixed genetic background. For embryo collection, noon of the day when vaginal plug was found in the mating female was defined as E0.5. In all the experiment, genotyped Wnt1-Cre2 transgenic littermates were used as control.
Histology
Staged embryos were dissected in PBS, and fixed in 4% paraformaldehyde (PFA) in PBS at 4°C. Following overnight fixation, the embryos were dehydrated by gradient ethanol washes and were embedded in paraffin. Samples were sectioned at 10 μm and subjected to standard Hematoxylin/Eosin staining and histological analysis as described (Dong et al., 2019).
BrdU Labeling
For mouse embryos, BrdU/PBS solution was administered by IP injection into pregnant females at 5 mg/100 g body weight. 1 h later, embryos were dissected and fixed in 4% paraformaldehyde (PFA) overnight at 4°C. Samples were then dehydrated and embedded in paraffin. Immunostaining was performed on 10 μm coronal sections according to standard protocols using anti-BrdU antibody (1:400, Novus, NBP2-14890) and Alexa Fluor 594 goat anti-rabbit IgG secondary antibody (1:500, Invitrogen, A11012). Sections were counterstained with DAPI to facilitate quantification. BrdU positive cells were quantified and the data were analyzed using ImageJ (Rueden et al., 2017). For quantification, the value in Y axis was shown as the ration of number of positive cells against the total nuclei in the defined area. Statistical analysis was performed on data collected from three consecutive sections from each of four to five independent experiments. Statistical data are presented as mean value ± SEM and subjected to double tailed Student’s t-tests.
In situ Hybridization and Immunohistochemistry
Section In situ hybridization on paraffin sections was carried out as described previously (Bartoletti et al., 2020). A 820 bp of Ngn2 cDNA fragment was amplified using primers 5- GCCCTTCTCCACCTTCCT-3 and 5-GAAGGGCGGGACAATAGG-3, 967 bp of Nurr1 cDNA fragment using primers 5-CGTAGCATCACCACGGACTT-3 and 5-GGCATCATCTCCTCGGACTG-3, a 520 bp of TH cDNA fragment using primers 5- GTCGGGTGTCTGACGATGTG-3 and 5-TGGCTCGGGTGAGTGCATA, and a 650 bp Shh probe (Echelard et al., 1993) were generated by PCR.
Whole-mount in situ hybridization was performed as previously described (He and Soriano, 2013). Briefly, E9.5 embryos were dissected in ice cold PBS and fixed in 4% PFA/PBS overnight. Following gradient washes, the embryos were dehydrated to 100% methanol, and were bleached in methanol: 30% hydrogen peroxide (4:1) solution at room temperature for 1 h. The embryos were then rinsed with PBT (PBS + 0.1% Tween-20) followed by treatment with proteinase K (10 μg/ml) in PBT at room temperature for 10 min. Subsequently, the embryos were washed with 2 mg/ml glycine in PBT, fixed with 4% PFA/PBS for 20 min, and washed in PBT twice for 5 min each time. Following wash in prehybridization buffer for 1 h at 65°C, the embryos were incubated overnight in hybridization buffer with denatured RNA probe (1 μg/mL in hybridization buffer) at 65°C. Post- hybridization washes were performed followed by incubation with 10% normal sheep serum for 1 h at room temperature, and anti-digoxigenin antibody/1% sheep serum (1:2000) at 4°C overnight. The embryos were subjected to post-antibody washes followed by color development.
For immunohistochemistry, samples were sectioned at 10 μm and subjected to standard protocols using anti-Rac1-GTP antibody (1:500, NewEast Bio, 26903), anti-cleaved caspase 3 antibody (1:500, Cell Signaling Technology, 9664), anti-TH antibody (1:1000, Millipore, AB152), and Alexa Fluor 594 goat anti-rabbit IgG secondary antibody (1:500, Invitrogen, A11012). For whole-mount immunostaining, E10.5 embryos were dissected and fixed with 4% PFA/PBS overnight. The embryos were then rinsed with PBS three times followed by wash with 0.1% Triton X-100. Following blocking in 5% normal goat serum for 1 h at room temperature, the samples were treated with anti-neurofilament-L (1:500, Cell Signaling Technology, C28E10) for 2 days at 4°C. The immunofluorescence signal was developed with Alexa Fluor 594 goat anti-rabbit IgG secondary antibody (1:500, Invitrogen, A11012). The embryos were then dehydrated with 100% MeOH and cleared with BABB solution (benzyl alcohol: benzyl benzoate at a ratio of 1:2) for imaging.
Results
Generation of Rac1CA;Wnt1-Cre2 Mice and Validation of Rac1 Activity Augmentation in NCCs Derivatives
To examine the role of increased Rac1 activity in NCCs development, Rac1CA has been crossed to Wnt1-Cre2 to generate Rac1CA;Wnt1-Cre2 mice (Srinivasan et al., 2009; Lewis et al., 2013). First we examined the expression pattern of Rac1CA in the mutant. The Rac1CA knock-in line was generated using ROSA26 allele harboring sequentially a loxP-flanked STOP cassette, Rac1G12V cDNA and IRES-EGFP. When crossed to a Cre line and successful recombination, Rac1G12V cDNA and IRES-EGFP will be expressed coincidentally in cells expressing Cre (Srinivasan et al., 2009). In Rac1CA;Wnt1-Cre2 mice, we have identified EGFP expression in Rac1CA;Wnt1-Cre2 embryos in the craniofacial mesenchyme, midbrain, and dorsal neural tube at both E10.5 and E13.5 (Figures 1A–F, n = 5 at each stage), in a pattern recapitulated by Wnt1-Cre2 triggered reporter expression in NCC derived cells (Lewis et al., 2013). Rac1-GTP overexpression is further validated by immunostaining in the sections across the midbrain of E13.5 Rac1CA;Wnt1-Cre2 embryo (Figures 1G,H) at level indicated in Figure 1I. These results demonstrated successful expression of Rac1CA in NCCs derived cells in the mutant mice.
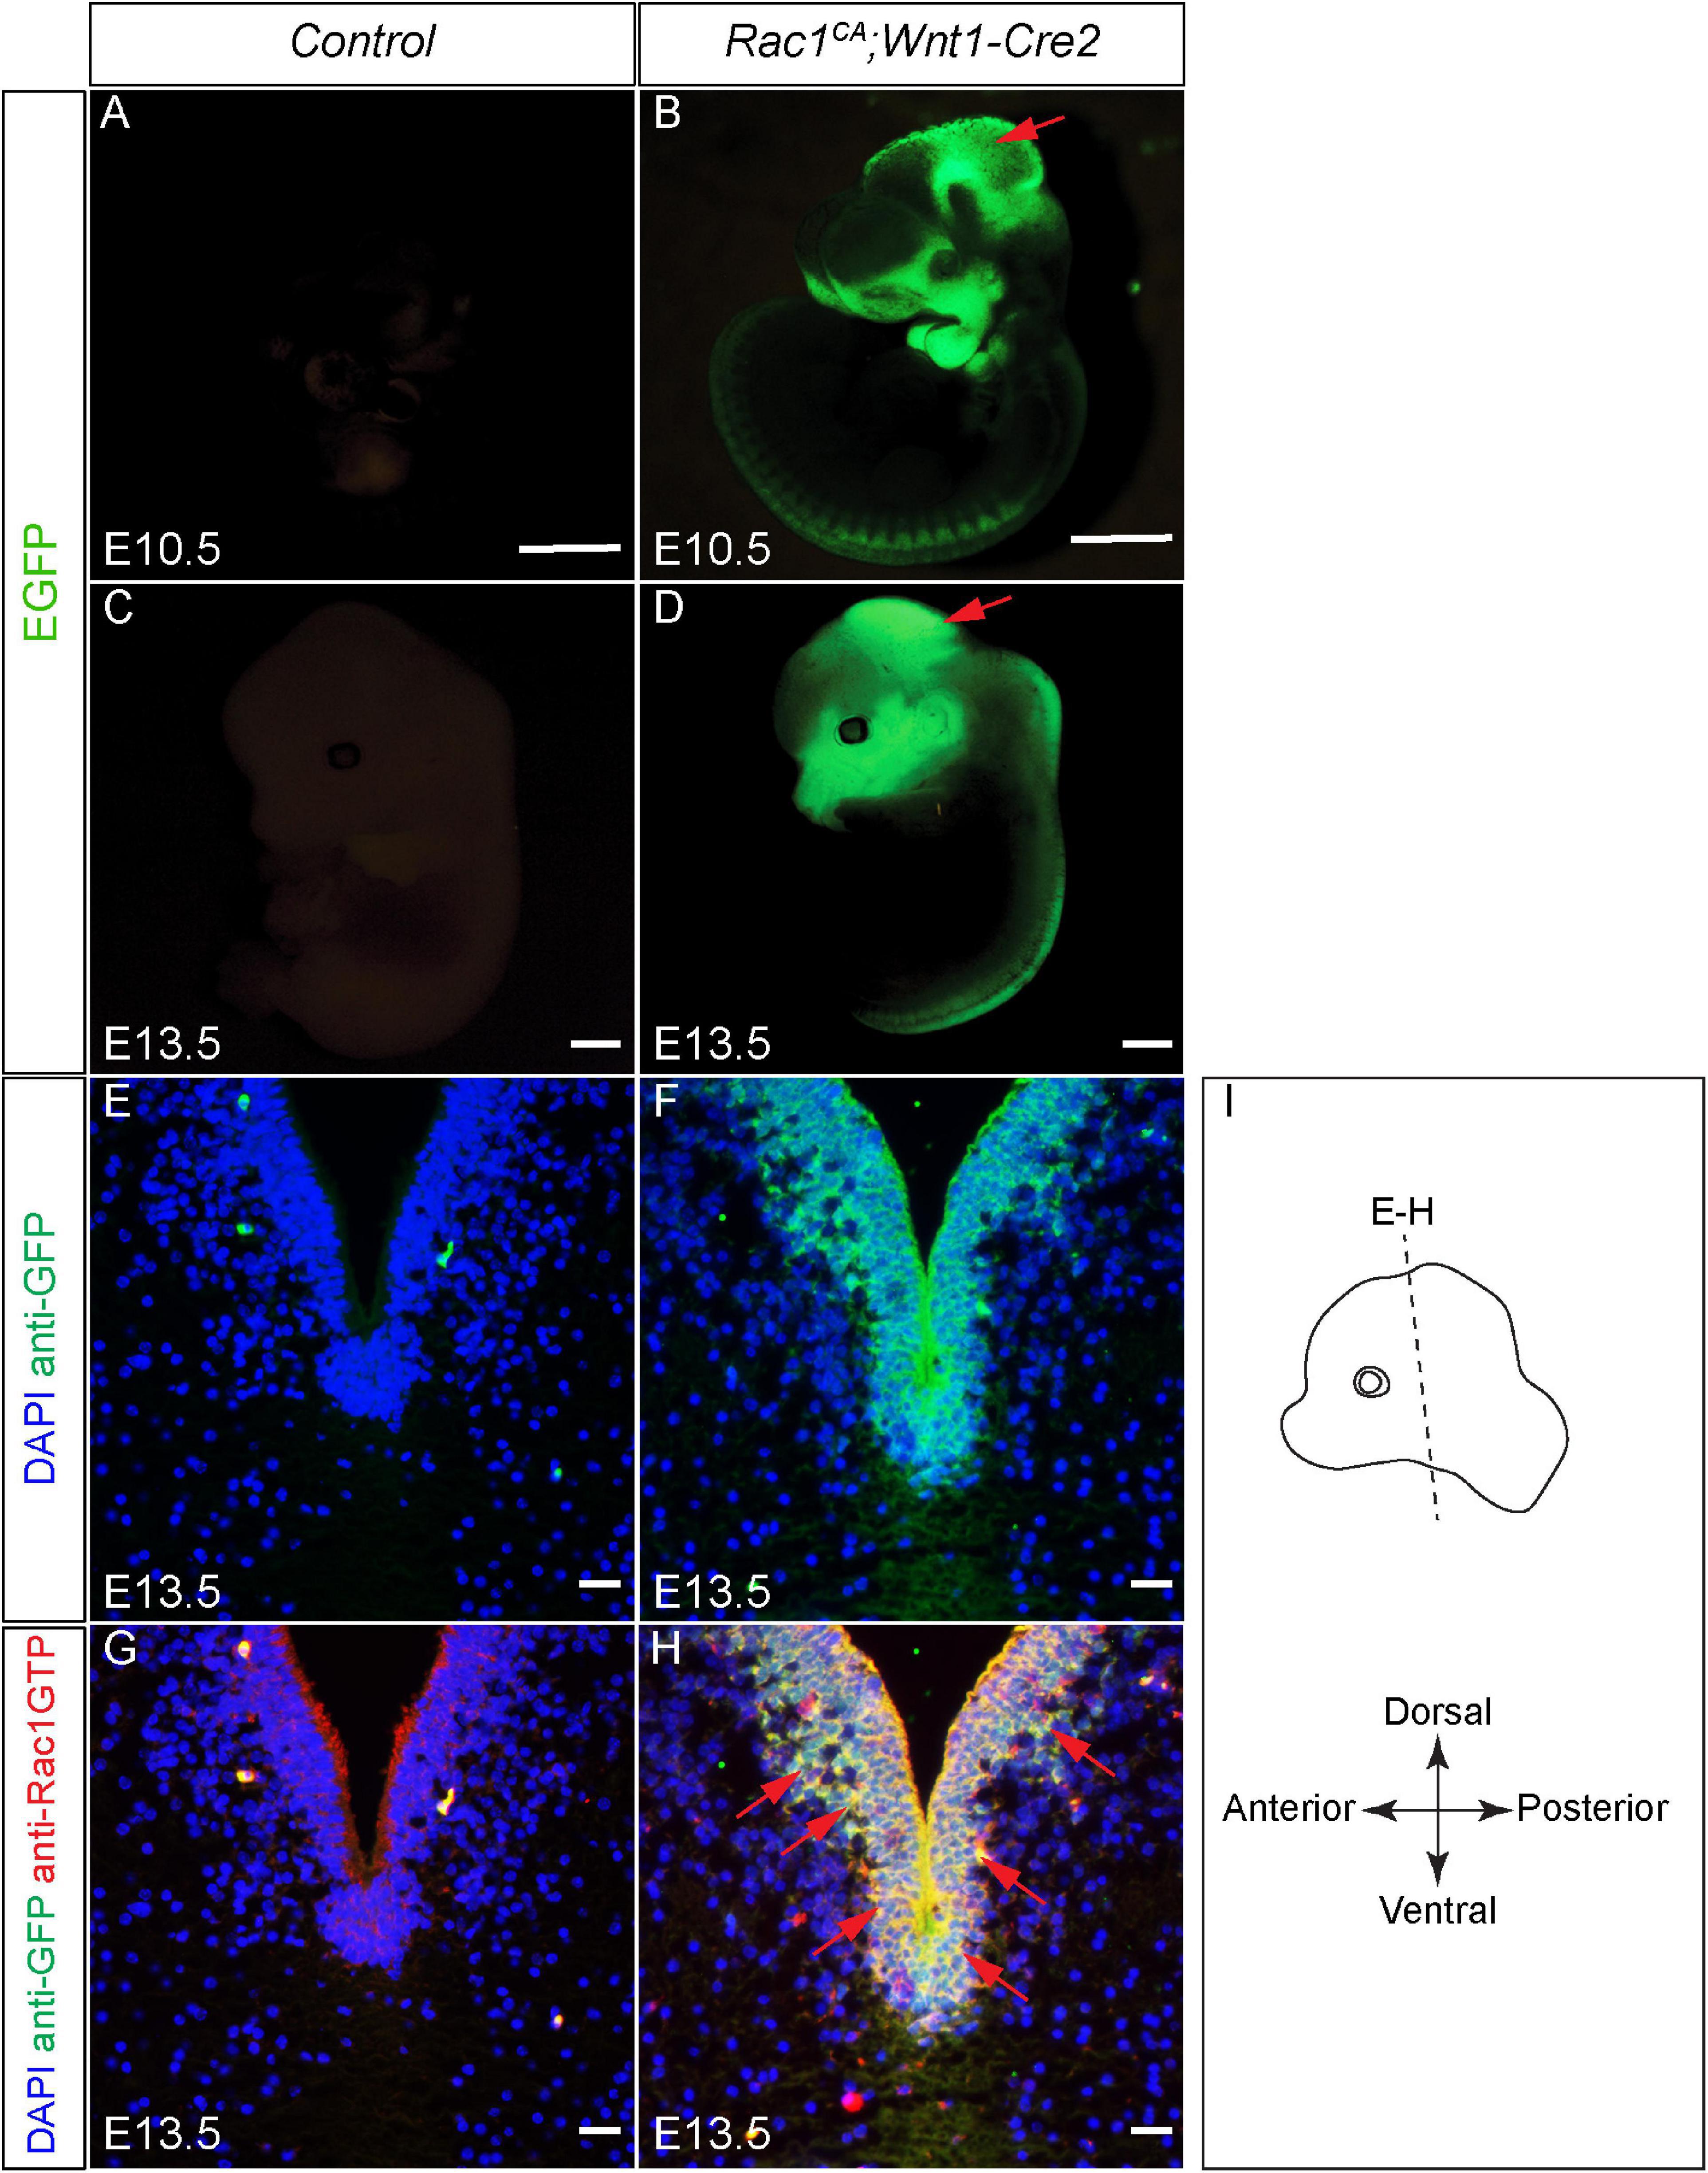
Figure 1. Validation of augmented Rac1 activity in Rac1CA;Wnt1-Cre2 embryos. (A–D) Whole-mount view of the control (A,C) and Rac1CA;Wnt1-Cre2 (B,D) embryo at E10.5 (A,B) and E13.5 (C,D). (E,F) Immunostaining with anti-GFP antibody (green) on coronal sections of the control (E) and Rac1CA;Wnt1-Cre2 (F) at the level of ventral midbrain at E13.5. Slides are counterstained with DAPI (blue). (G,H) Co-immunostaining with anti-Rac1-GTP antibody (red) and anti-GFP antibody (green) on coronal sections of E13.5 littermate control (G) and Rac1CA;Wnt1-Cre2 (H) at the level of ventral midbrain. Slides are counterstained with DAPI (blue). Red arrows point to overlapped expression of EGFP and Rac1-GTP. (I) Illustration of the embryo orientation and section level in figure and following figures. Scale bar in A–D, 1 mm. Scale bar in E–H, 10 μm.
Histological Analysis of Rac1CA;Wnt1-Cre2
Next, we analyzed the phenotype of the Rac1CA;Wnt1-Cre2 mice. We found that two out of six mutant mice survived beyond P20, and both showed an enlarged head. To examine the midbrain phenotype, we have collected and analyzed mutant embryos at stages from E9.5 through P5. The mutant embryos are comparable to the control littermates at E9.5 (data not shown) and E10.5 (Figures 2A,B, n = 5). Morphological difference was first observed at E11.5, and the mutant embryo exhibit a “bulge” at the junction of forebrain and midbrain (Figures 2C,D, n = 4). This phenotype is observed throughout E13.5 (Figures 2E,F, n = 5) and later stages. At P5, the whole brain tissue of the mutants is enlarged compared to the controls (Figures 2G,H, n = 7). Hematoxylin and Eosin (H.E.) staining on cross sections at the level of midbrain confirmed that the mutant midbrain is enlarged at above stages (Figures 3A–H). Statistical analysis revealed that at P5, the mutant midbrain area is 1.42 ± 0.08 fold of the control (Figure 3I, p < 0.01, n = 5). Such a change in brain size indicates alteration of cell density or cell numbers, or a combination of both. To answer this question, we have quantified the cell density of the mutant midbrain and the littermate control. Statistical analysis results showed that the cell density of the mutant midbrain increased to 1.56 ± 0.09 fold (p < 0.01) of the control at E10.5 (n = 4), to 0.73 ± 0.06 fold (p < 0.01) of the control at E13.5 (n = 4) and decreased to 0.69 ± 0.03 fold of the control at P5 (n = 5) (Figures 4A–G). These results suggest that expression of Rac1G12V in neural crest might altered cell proliferation rate and survival in the mutant.
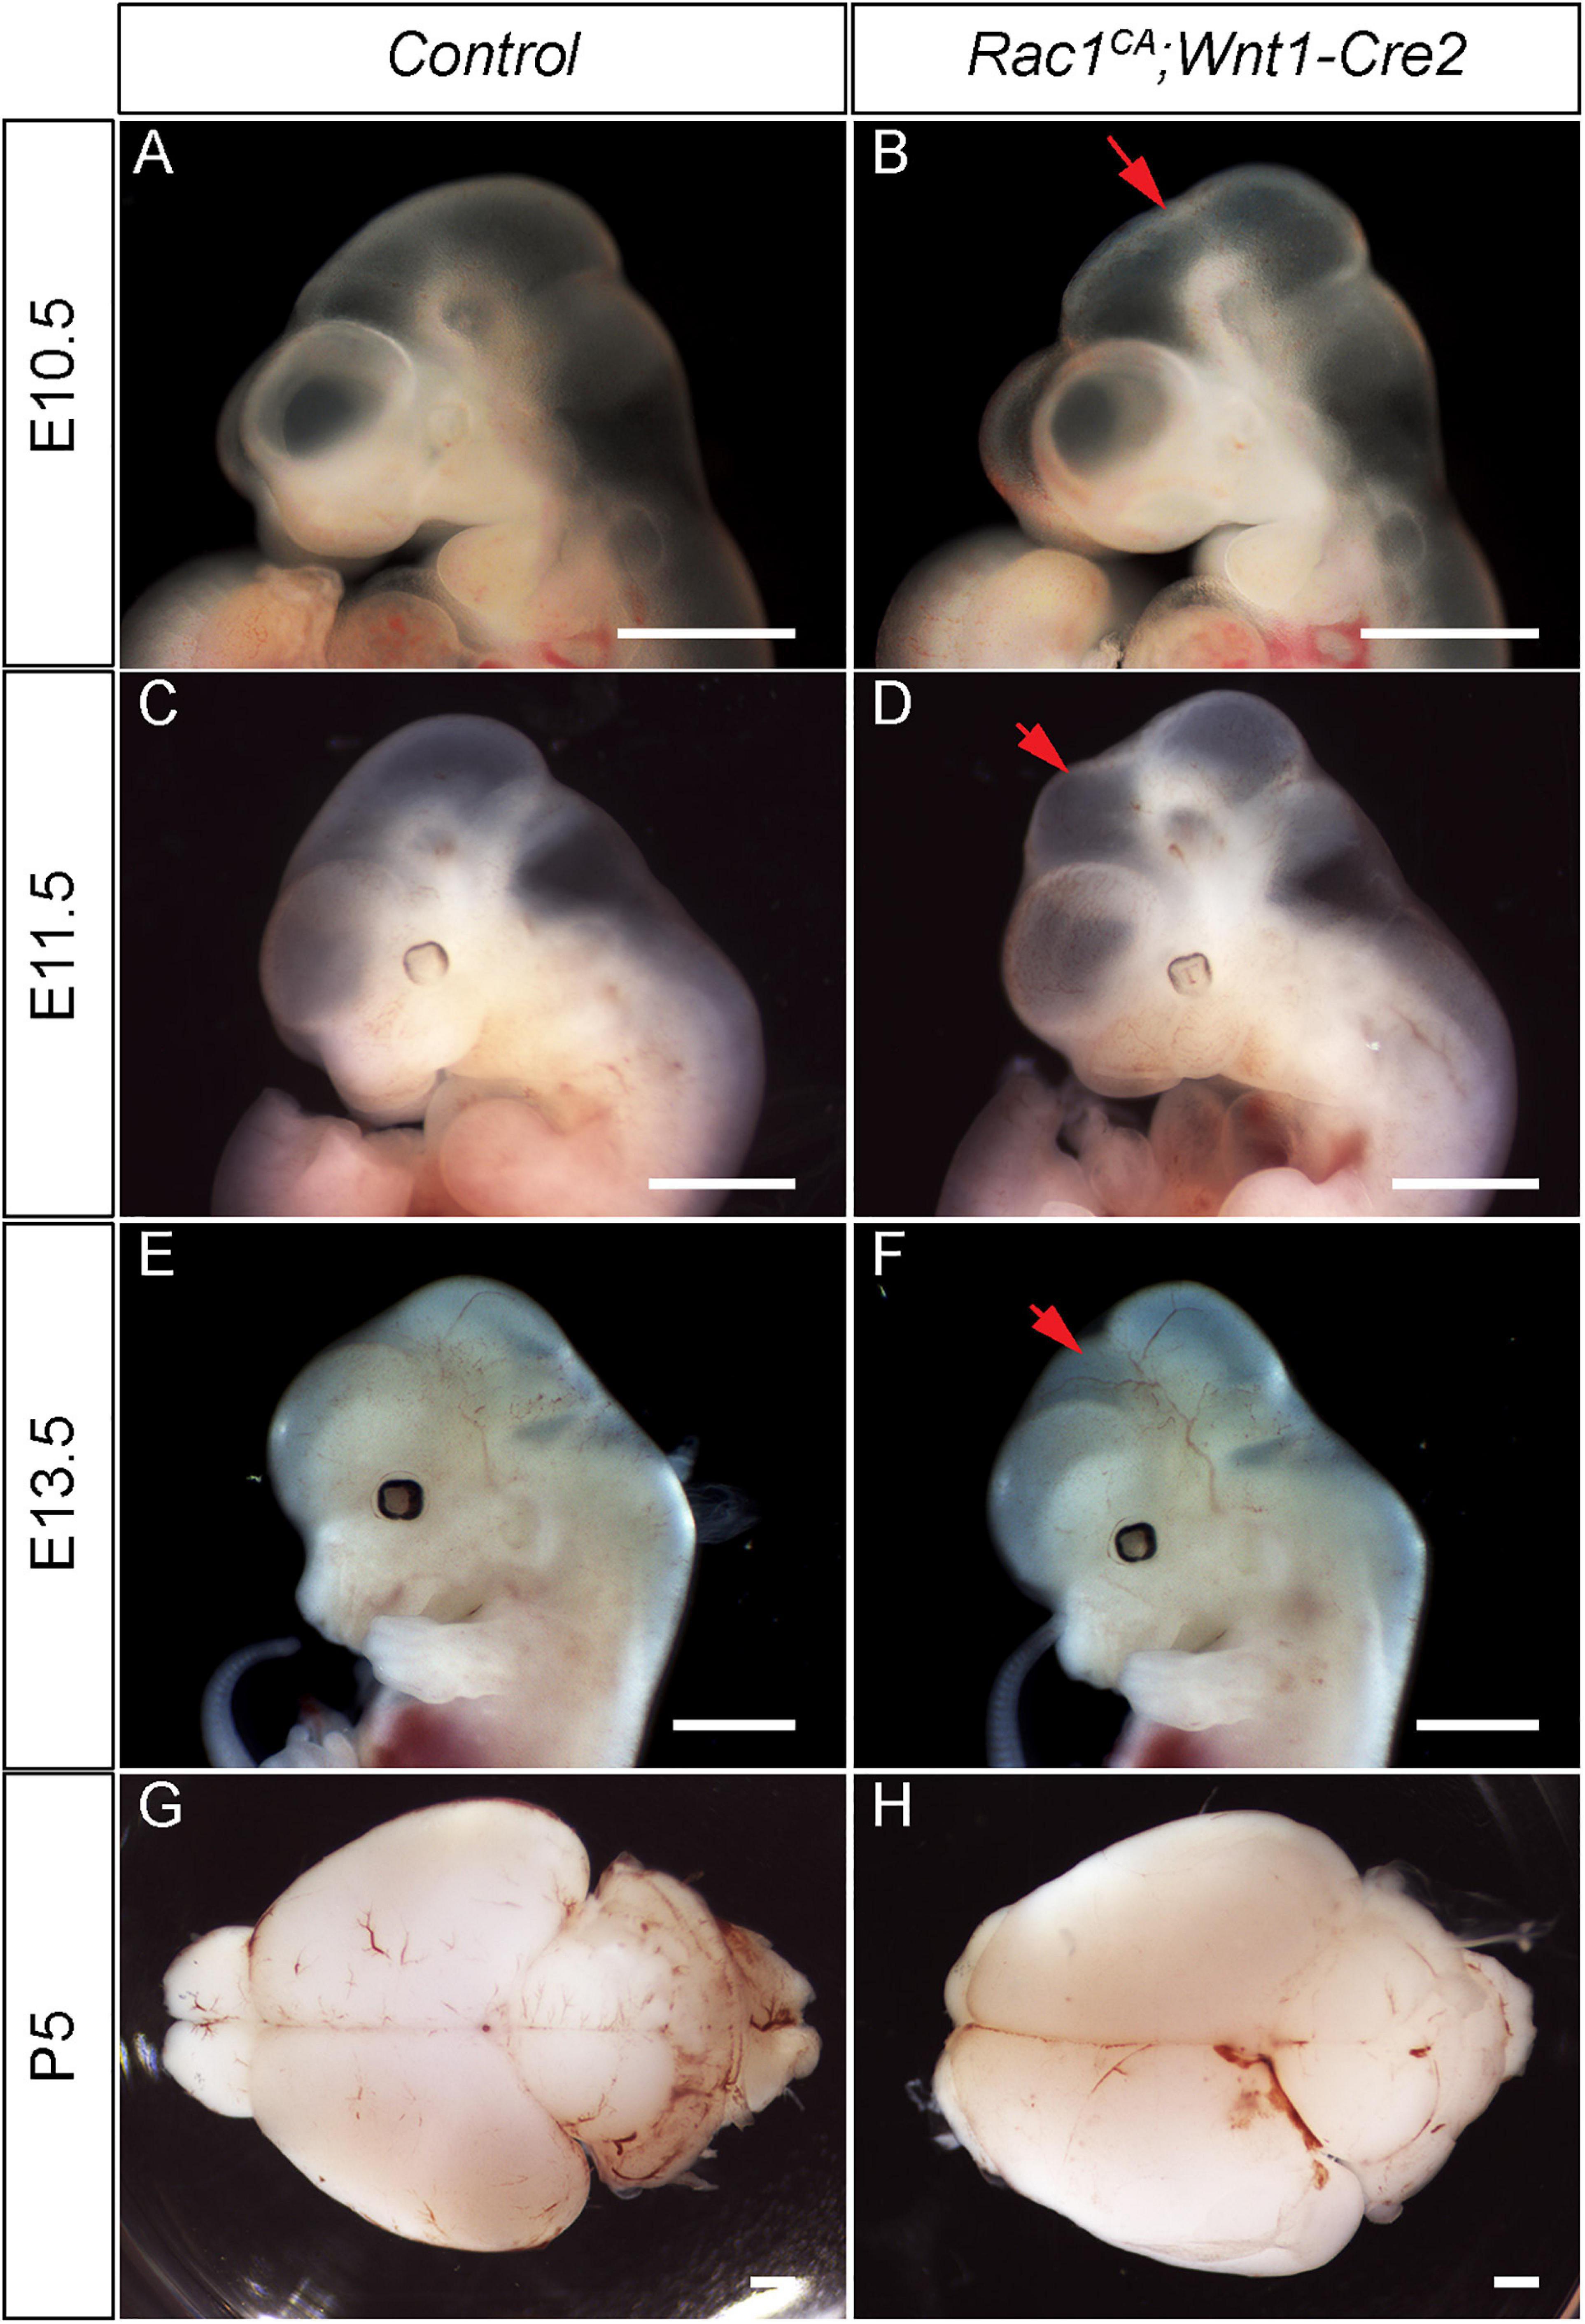
Figure 2. Dysregulated Rac1 activity leads to abnormal neural crest development and midbrain malformation. (A–F) Lateral view of the control (A,C,E) and Rac1CA;Wnt1-Cre2 (B,D,F) embryos at E10.5 (A,B), E11.5 (C,D), and E13.5 (E,F). Red arrows in B,D,F point to the midbrain of the mutant. (G,H) Whole-mount view of P5 brain of the littermate control (G) and Rac1CA;Wnt1-Cre2 (H). Scale bar in A–H, 1 mm.
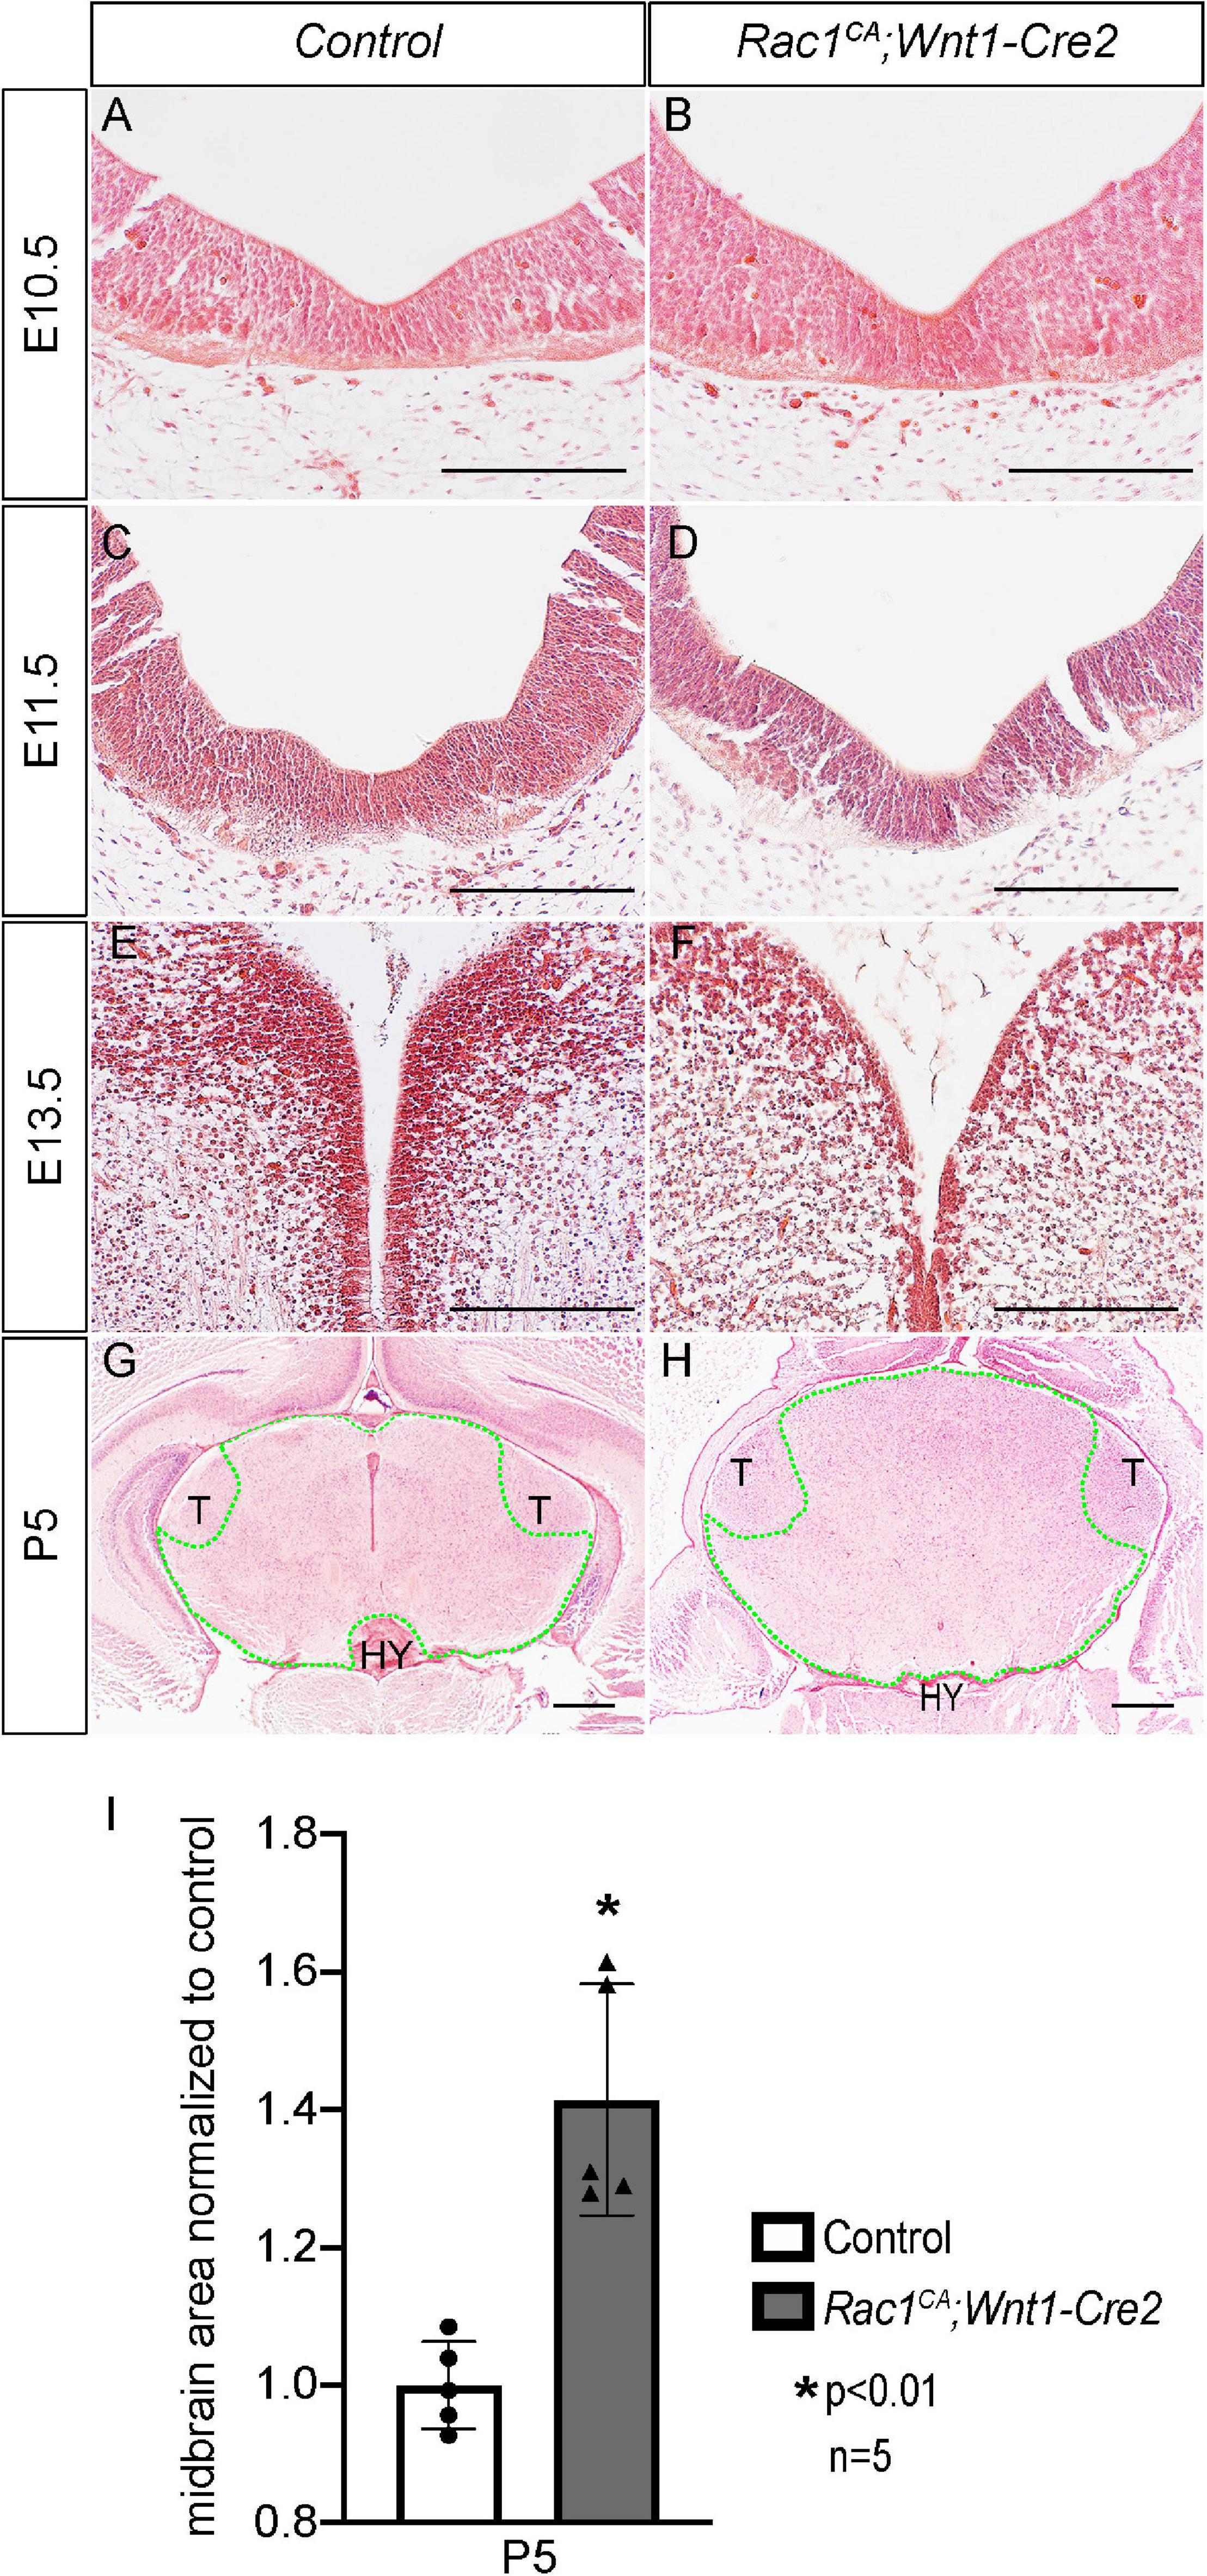
Figure 3. Histological analysis of Rac1CA;Wnt1-Cre2 embryos. (A–H) H.E. staining on coronal sections of littermate control (A,C,E,G) and Rac1CA;Wnt1-Cre2 (B,D,F,H) at E10.5 (A,B), E11.5 (C,D), E13.5 (E,F), and P5 (G,H) at midbrain level. (I) Scatter plot of statistical analysis of midbrain area (outlined by green dots) quantified in (G,H). Scale bar in A–H, 200 μm. HY, hypothalamus; T, thalamus.
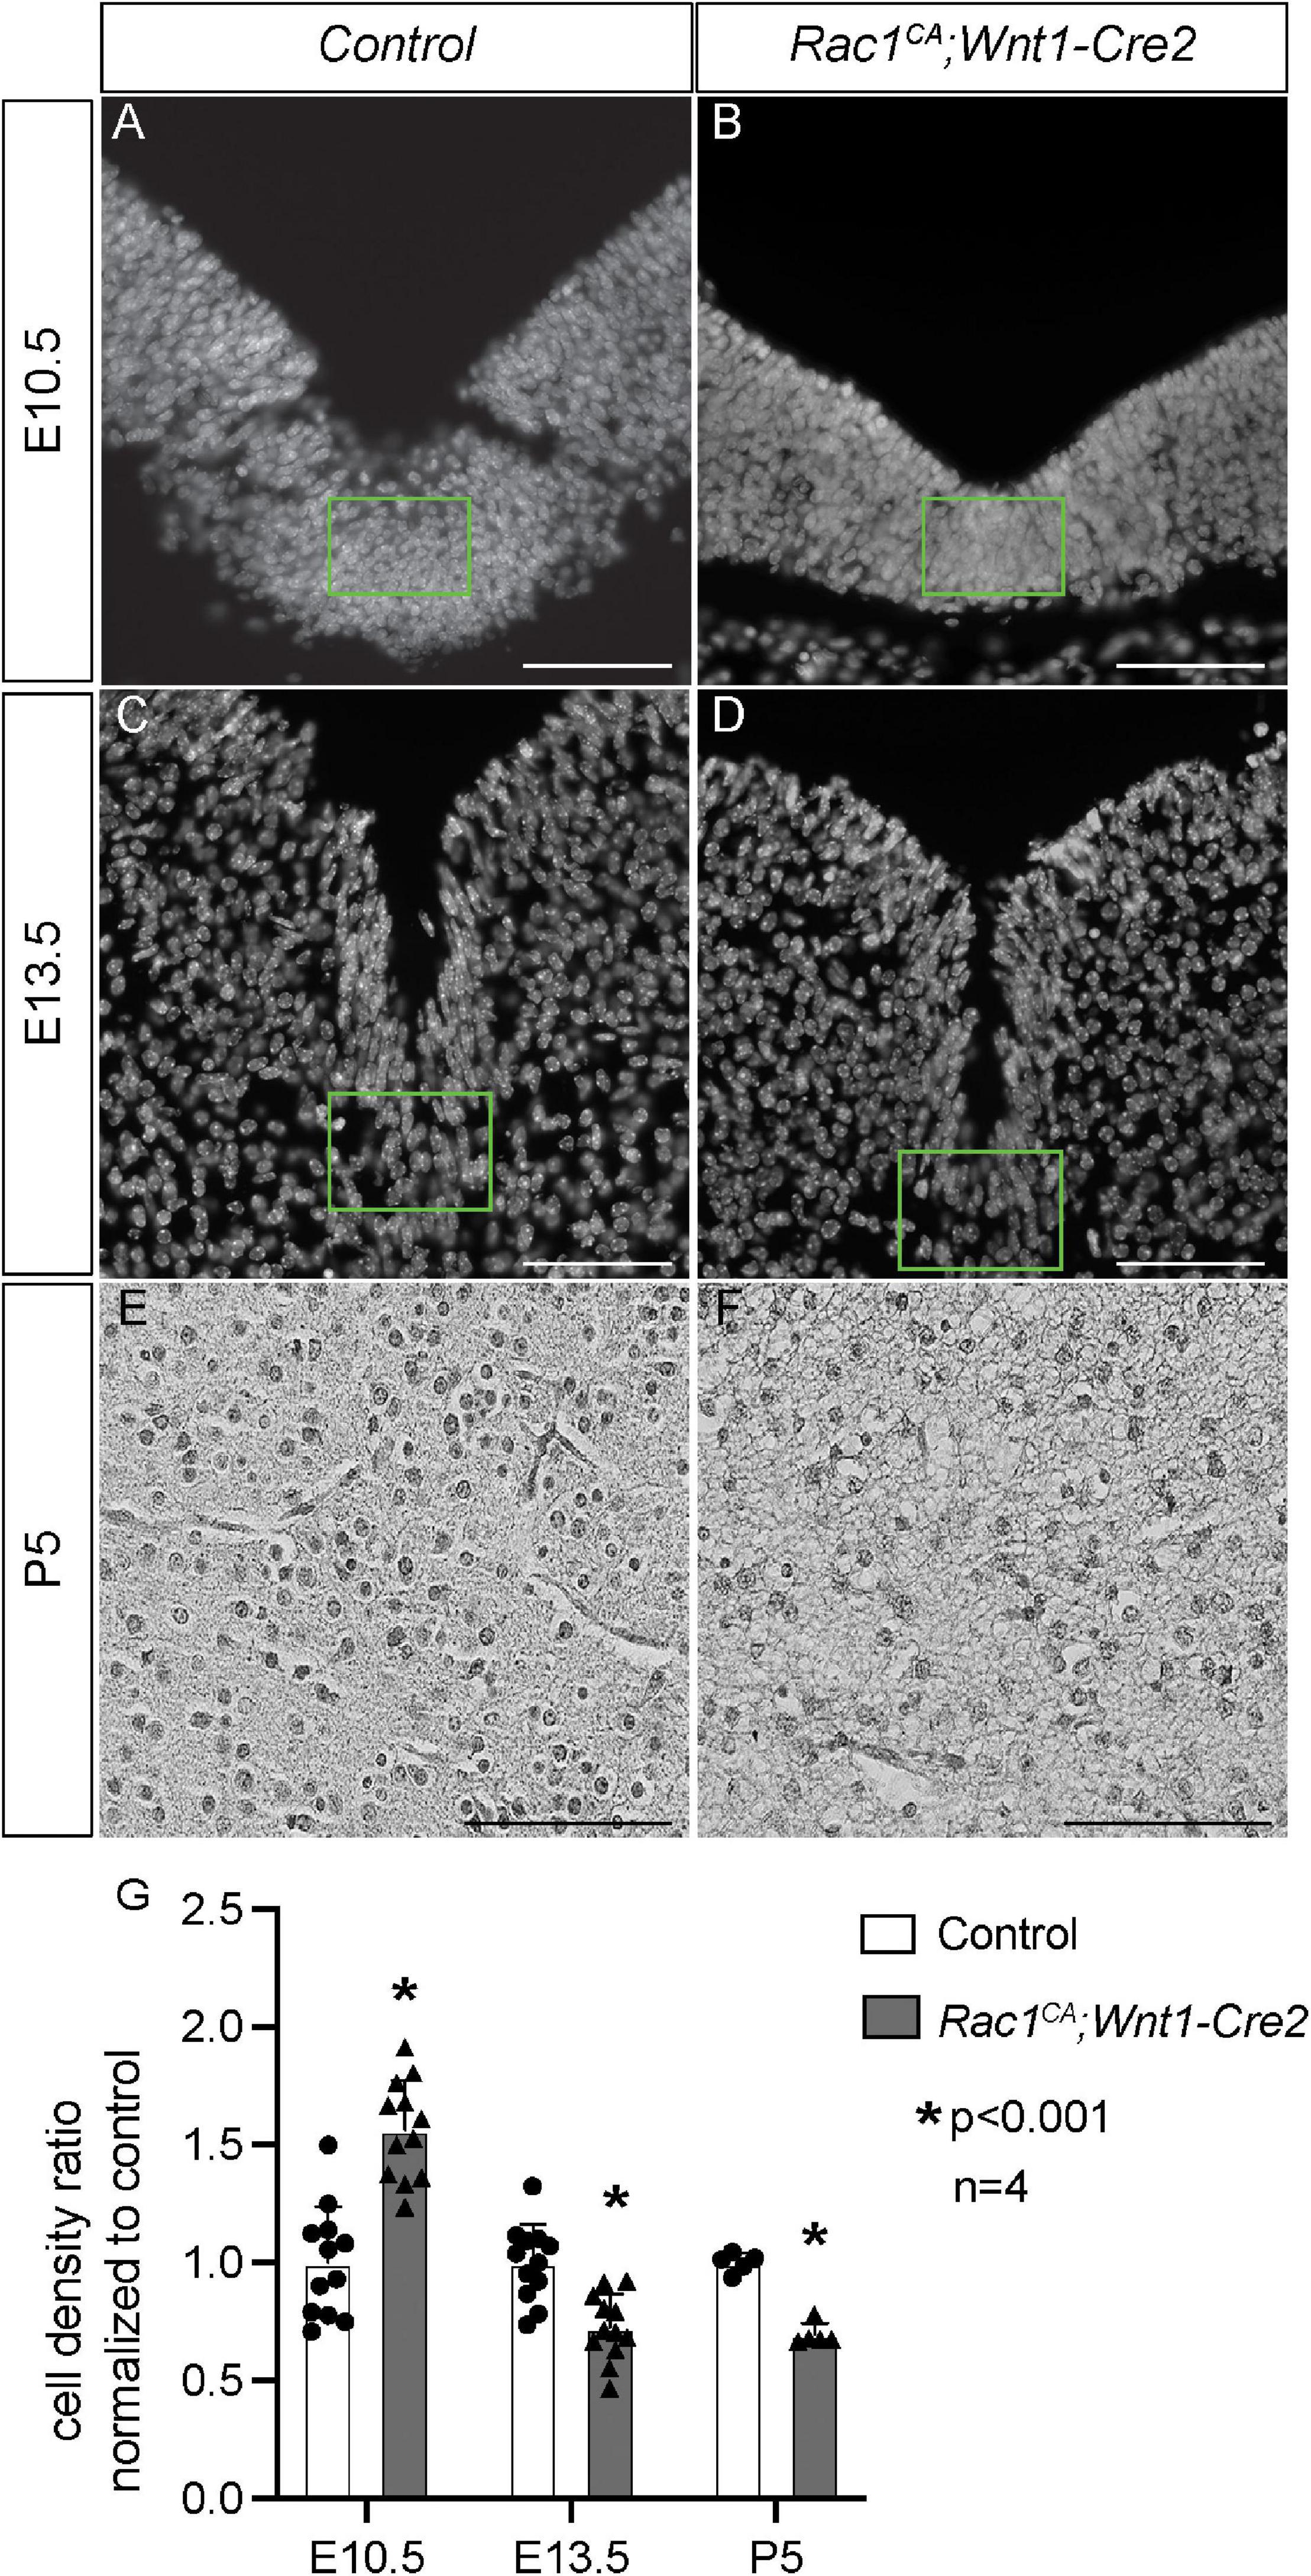
Figure 4. Rac1CA;Wnt1-Cre2 mice exhibit altered cell density in ventral midbrain. (A–C) Grayscale conversion of DAPI staining on coronal sections of littermate control midbrain (A,C) and that of Rac1CA;Wnt1-Cre2 (B,D) at E10.5 (A,B) and E13.5 (C,D). Ventral midbrain tissue defined in green rectangles are used for quantification and statistical analysis. (E,F) Grayscale conversion of H.E. staining on coronal sections of littermate control midbrain (E) and that of Rac1CA;Wnt1-Cre2 (F) at P5. (G) Quantification and statistical analysis of cell density in A–F. Scale bar in A–D, 50 μm. Scale bar in E,F, 200 μm.
Analysis of Cell Proliferation Rate and Apoptosis in Rac1CA;Wnt1-Cre2 Midbrain
To examine the role of augmented Rac1 activity in midbrain development at the cellular level, we have assayed cell proliferation rate using BrdU labeling and apoptosis using immunostaining with anti-cleaved caspase 3 antibody, respectively. Statistical analysis revealed a significant increased cell proliferation rate in mutant midbrain cells at E10.5 (Figures 5A,A’,B,B’,E; 1.54 ± 0.18 fold, p < 0.01, n = 4) and at E13.5 (Figures 5C,C’,D,D’,E; 3.13 ± 0.42 fold, p < 0.01, n = 4). On the other hand, we did not observe significant change in the ratio of apoptotic cells in the mutant compared to that in the control (Figures 5F–J) at either E10.5 (1.32 ± 0.55 fold, p > 0.05, n = 4) or at E13.5 (1.59 ± 0.56 fold, p > 0.05, n = 4). These data demonstrated that Rac1 constitutive activation promotes cell proliferation in the NCCs derived midbrain cells but does not affect apoptosis.
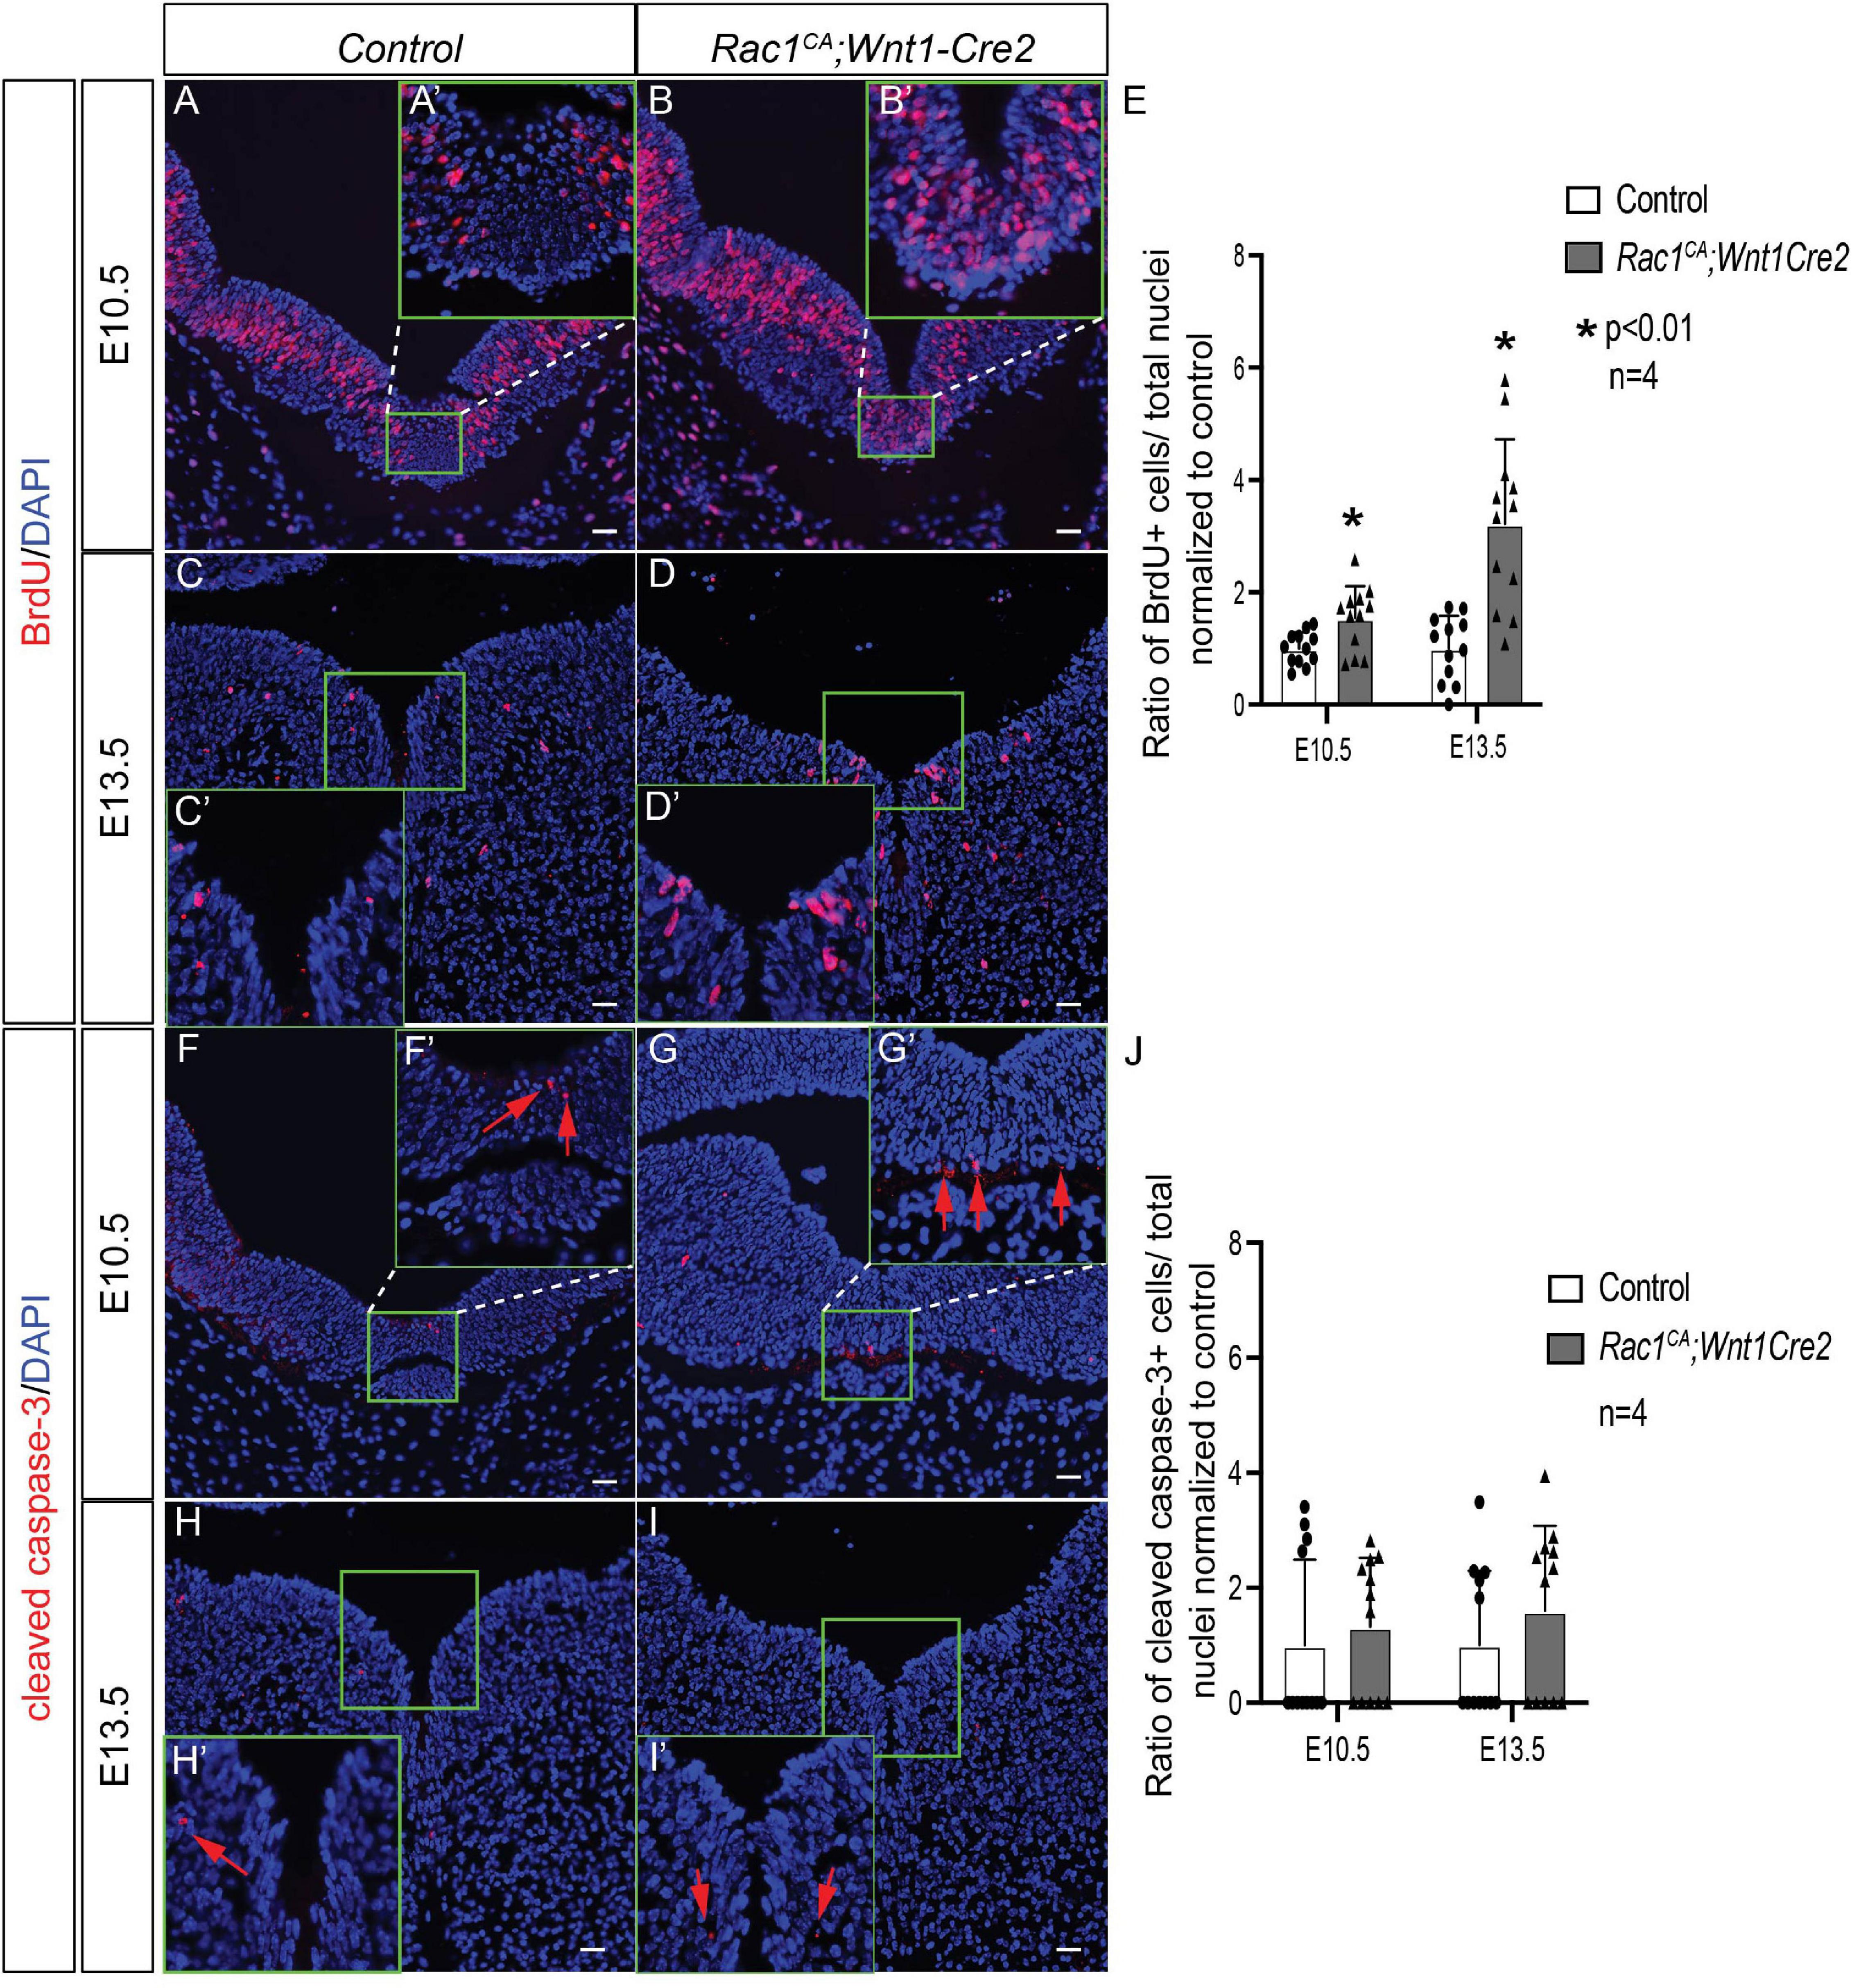
Figure 5. Analysis of cell proliferation and apoptosis of Rac1CA;Wnt1-Cre2. (A–D) BrdU labeling (red) on coronal sections of midbrain in littermate control (A,C) and Rac1CA;Wnt1-Cre2 (B,D) at E10.5 (A,B) and at E13.5 (C,D). Insets A’–D’ are magnification of defined areas in A–D. (E) Statistical analysis of quantification results in A–D. (F–I) Immunostaining using anti-cleaved caspase 3 antibody (red) on coronal sections of midbrain in littermate control (F,H) and Rac1CA;Wnt1-Cre2 (G,I) at E10.5 (F,G) and at E13.5 (H,I). Insets F’–I’ are magnification of defined areas in F–I. Red arrows point to cells expressing cleaved caspase 3. (J) Statistical analysis of quantification results in F–I. Cells in ventral midbrain (green rectangles in A–D,F–I) are quantified and used for statistical analysis. Scale bar in A–I, 10 μm.
Augmented Rac1 Activity Alters NCCs Migration in vivo
Rac1 is an essential regulator of cell migration. Previous studies have shown that Rac1 deficiency impairs normal NCCs migration (Fort et al., 2011; He and Soriano, 2013). To examine the potential effect of excessive Rac1 activity on NCCs migration, we carried out whole-mount in situ hybridization with anti-Sox10 mRNA probe. Our results revealed reduced Sox10 expression in the mutant midbrain, hindbrain, and prospective trigeminal ganglia (Figures 6A,B, n = 3). To further identify the migrating routes and patterning of neural crest cells in vivo, we have performed immunostaining using anti-neurofilament-L antibody, which labels NCCs derived neurofilament (Nie et al., 2018). At E10.5, whole-mount staining results revealed decreased intensity of neurofilament expression in mutant midbrain region (blank arrows in Figures 6C,D, n = 7). These results are in line with the whole-mount in situ hybridization data, and both support the notion that constitutive activation of Rac1 decreases neural crest cells population at their original destination. In addition, the immunostaining result also showed altered neurofilament expression pattern in mutant pharyngeal arches (green arrows in Figures 6C,D). Sections of these embryos confirmed that in the mutant embryos, the neurofilament-L staining is decreased in the roof of brain (blank arrows in Figures 6G,H) and adjacent tissues (blank arrows in Figures 6I,J), as well as the alteration of its expression pattern in the mutant embryos (green arrows in Figures 6K,L). These results demonstrated that expression of Rac1G12V alters NCCs migration pattern, and a finely tuned Rac1 activity is required for normal NCCs migration.
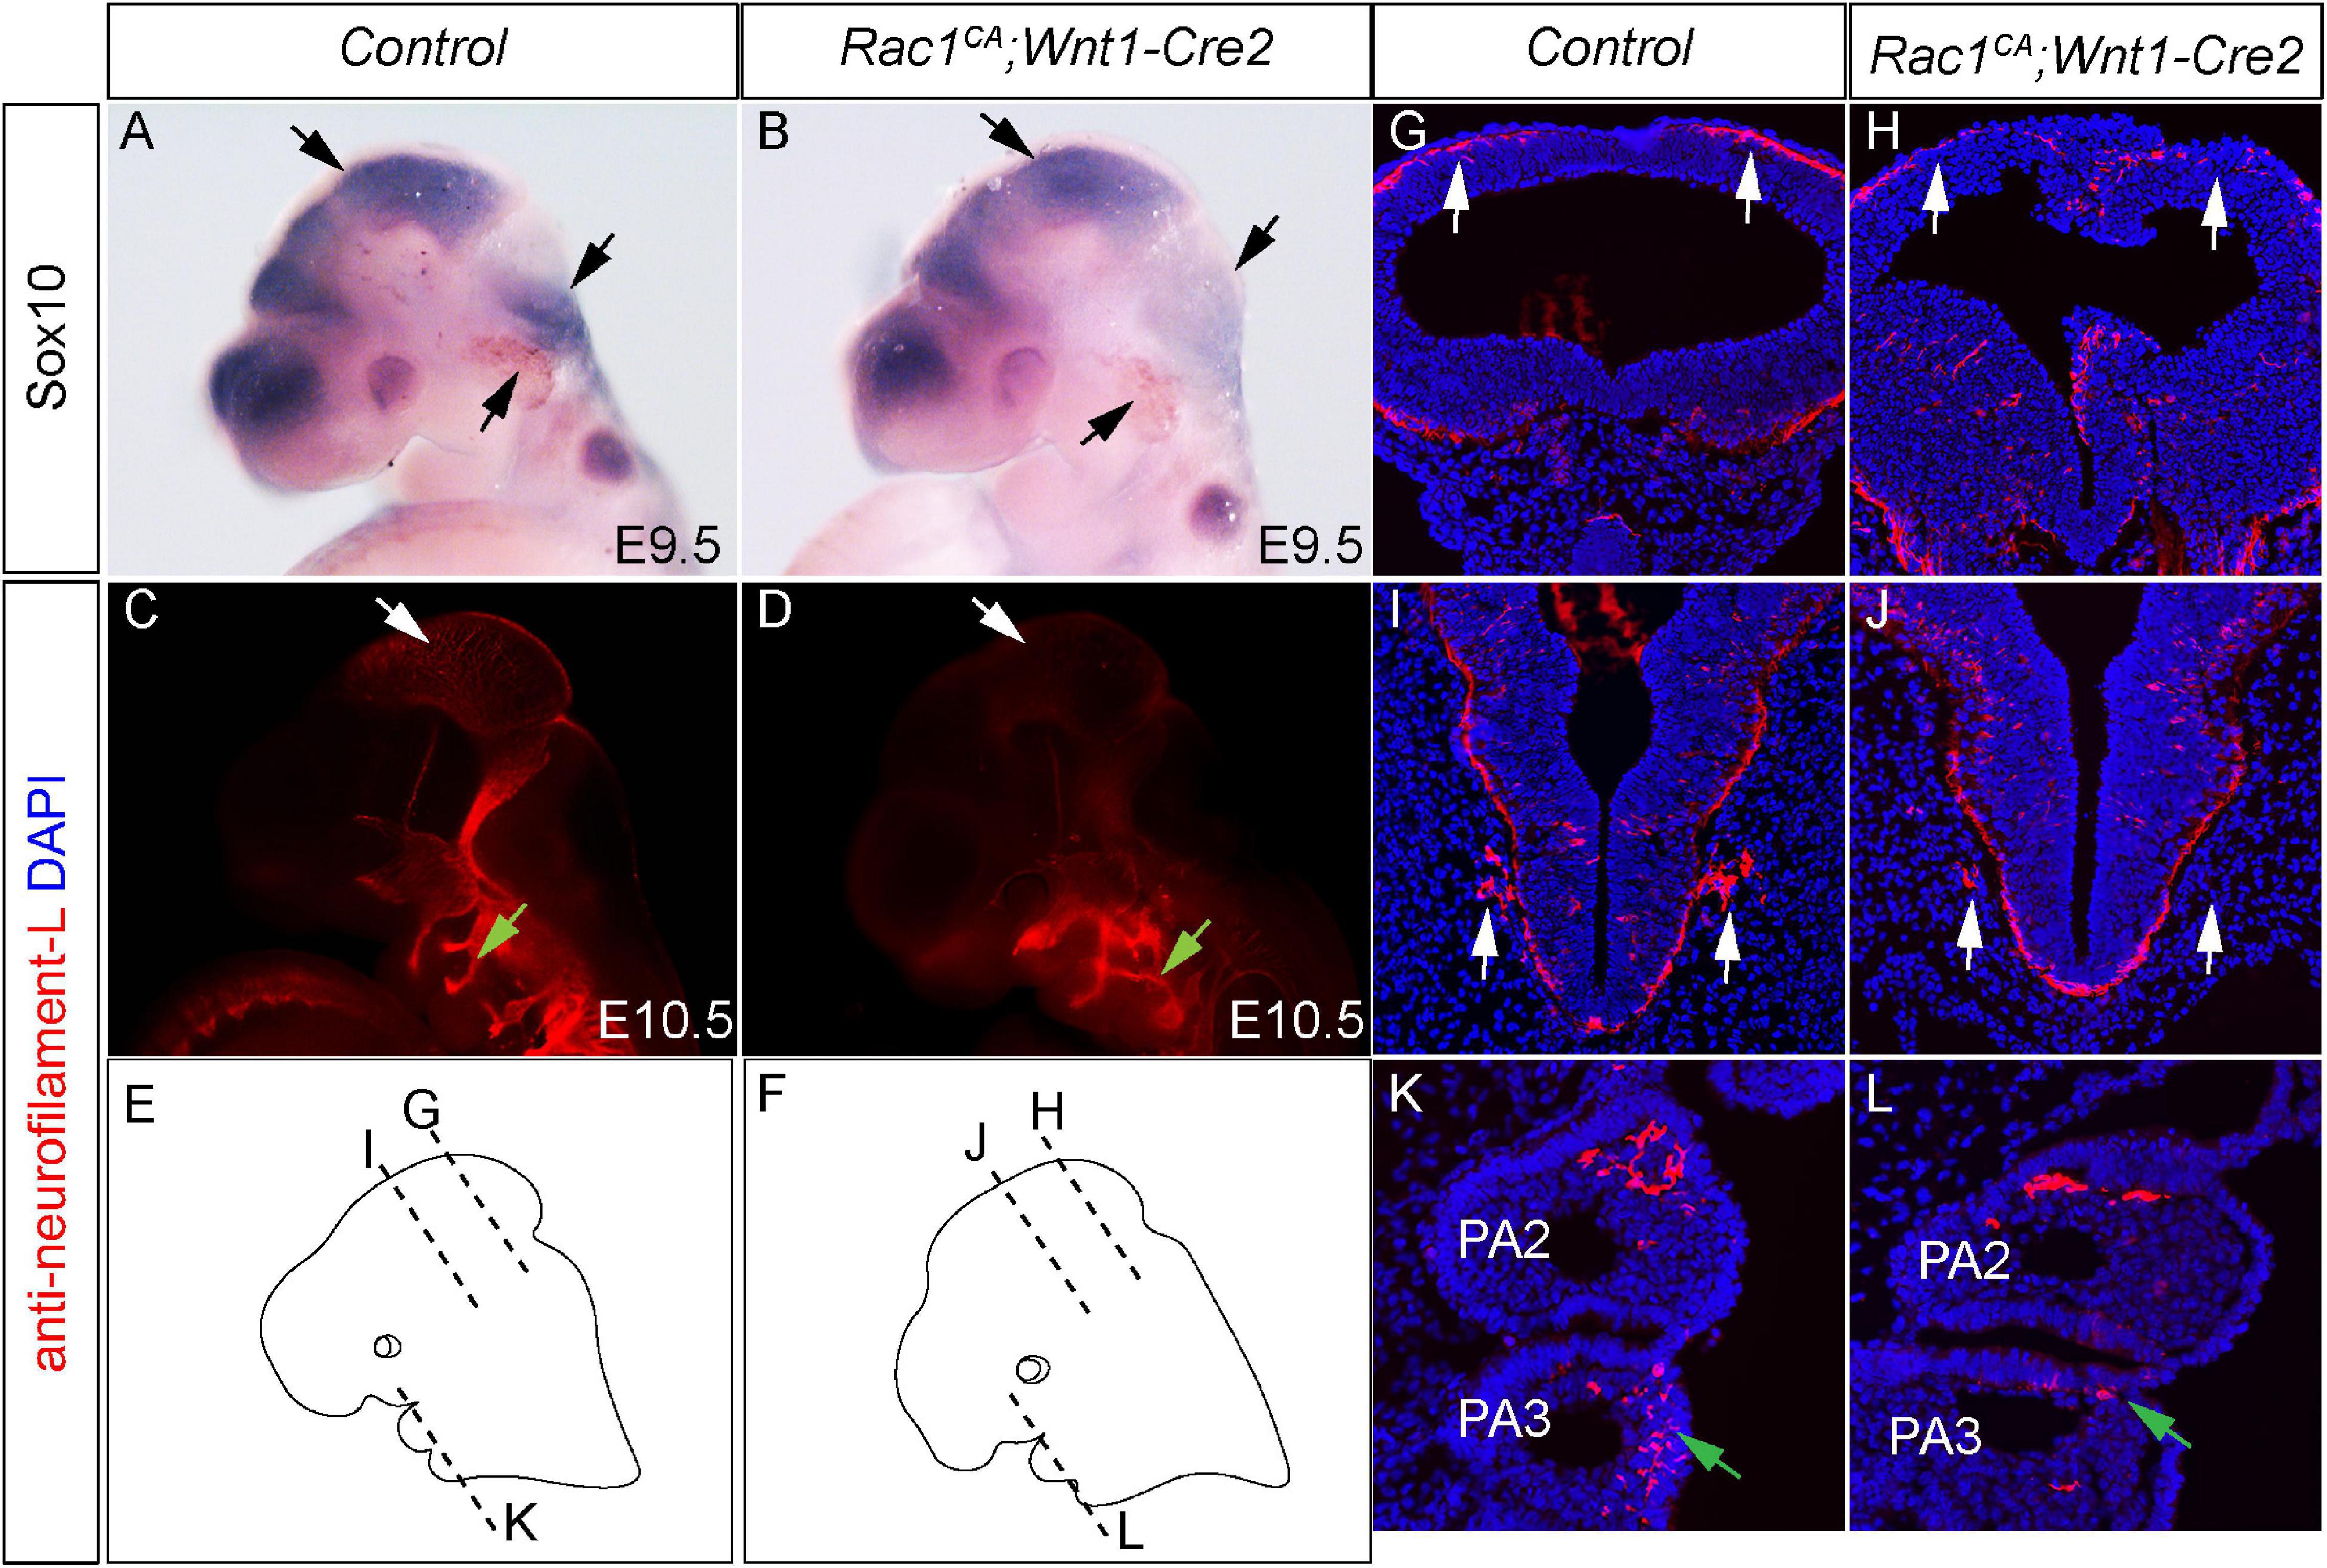
Figure 6. Augmented Rac1 activity alters neural crest cell migration in vivo. (A,B) Whole-mount in situ hybridization with Sox10 antisense mRNA probe in E10.5 littermate control (A) and Rac1CA;Wnt1-Cre2 (B) embryos. Arrows point to counterparts in both embryos, where Sox10 expression is altered in the mutant. (C,D) Whole-mount immunostaining using anti-neurofilament L antibody of E10.5 littermate control (C) and Rac1CA;Wnt1-Cre2 (D) embryos. Blank arrows point to midbrain. Green arrows point to neurofilament in pharyngeal arch (PA) 2. (E,F) Diagram shows section levels in C,D, as illustrated in G–L. (G–L) Coronal sections of C,D at comparable levels illustrated in E,F. Blank arrows in H,J point to reduced neurofilament L expression in the mutant compared to that in G,I, respectively. Green arrow in L points to misguided NCCs expressing neurofilament in mutant PA3 when compared to the counterpart tissues in the control PA3 shown in K.
Expression of Rac1CA Disrupts mDA Progenitor Domain and Neuronal Differentiation in Ventral Midbrain
While Rac1 is known to be essential for mDA differentiation (Čajánek et al., 2013; Hua et al., 2015; Kim et al., 2018), it remains unclear whether or how augmented Rac1 activity affects mDA development. To address this question, we have examined expression of the key markers of mDA differentiation in the ventral midbrain of Rac1CA;Wnt1-Cre2 mice and controls. In the control embryos, in situ hybridization results show that Shh is expressed in the ventral midbrain (arrow in Figure 7A) and lateral midbrain at E11.5. At this stage, expression of Ngn2, Nurr1, and low level of TH, are also detected in the ventral midbrain (Figures 7C,I,O), showing that most mDA are at progenitor stage. Compared to the control, the mutant embryos exhibit decreased expression of Shh, Ngn2, and Nurr1 at the ventral midbrain (arrow in Figures 7B,D,J), suggesting fewer mDA progenitors are generated in the mutant embryos. At E12.5, control embryos showed expression of Ngn2 and Nurr1 in the ventral midbrain (arrow in Figures 7E,K), and TH expression emerges at the same location (arrow in Figure 7Q), demonstrating that some mDA already undergo terminal differentiation at this stage. In the mutant embryos, Ngn2 expression is barely detected in the ventral midbrain (arrow Figure 7F). Expression of Nurr1 and TH is detected in the mutant, but in a more restricted domain compared to that in the control (arrow in Figures 7L,R). At E13.5, expression of Ngn2 and Nurr1 is mostly restricted to the midline in the control embryos, while TH expression is detected broadly in the ventral midbrain neurons, indicating most mDA reach terminal differentiation (Figures 7G,M,S). In contrast, in the mutant embryos, expression level of these markers is decreased and their expression becomes restricted to a narrow area at the midline (Figures 7H,N,T). Importantly, TH expression in the ventral midbrain, away from the midline progenitor domain, is greatly reduced in mutants compared to controls indicating that only a few TH+ differentiated mDA reach their destination in the mutants. These data suggest augmented Rac1 activity impairs mDA progenitor formation and differentiation in vivo. Together our results indicate that a rigorous control of Rac1 activity is required to ensure normal NCCs and mDA development.
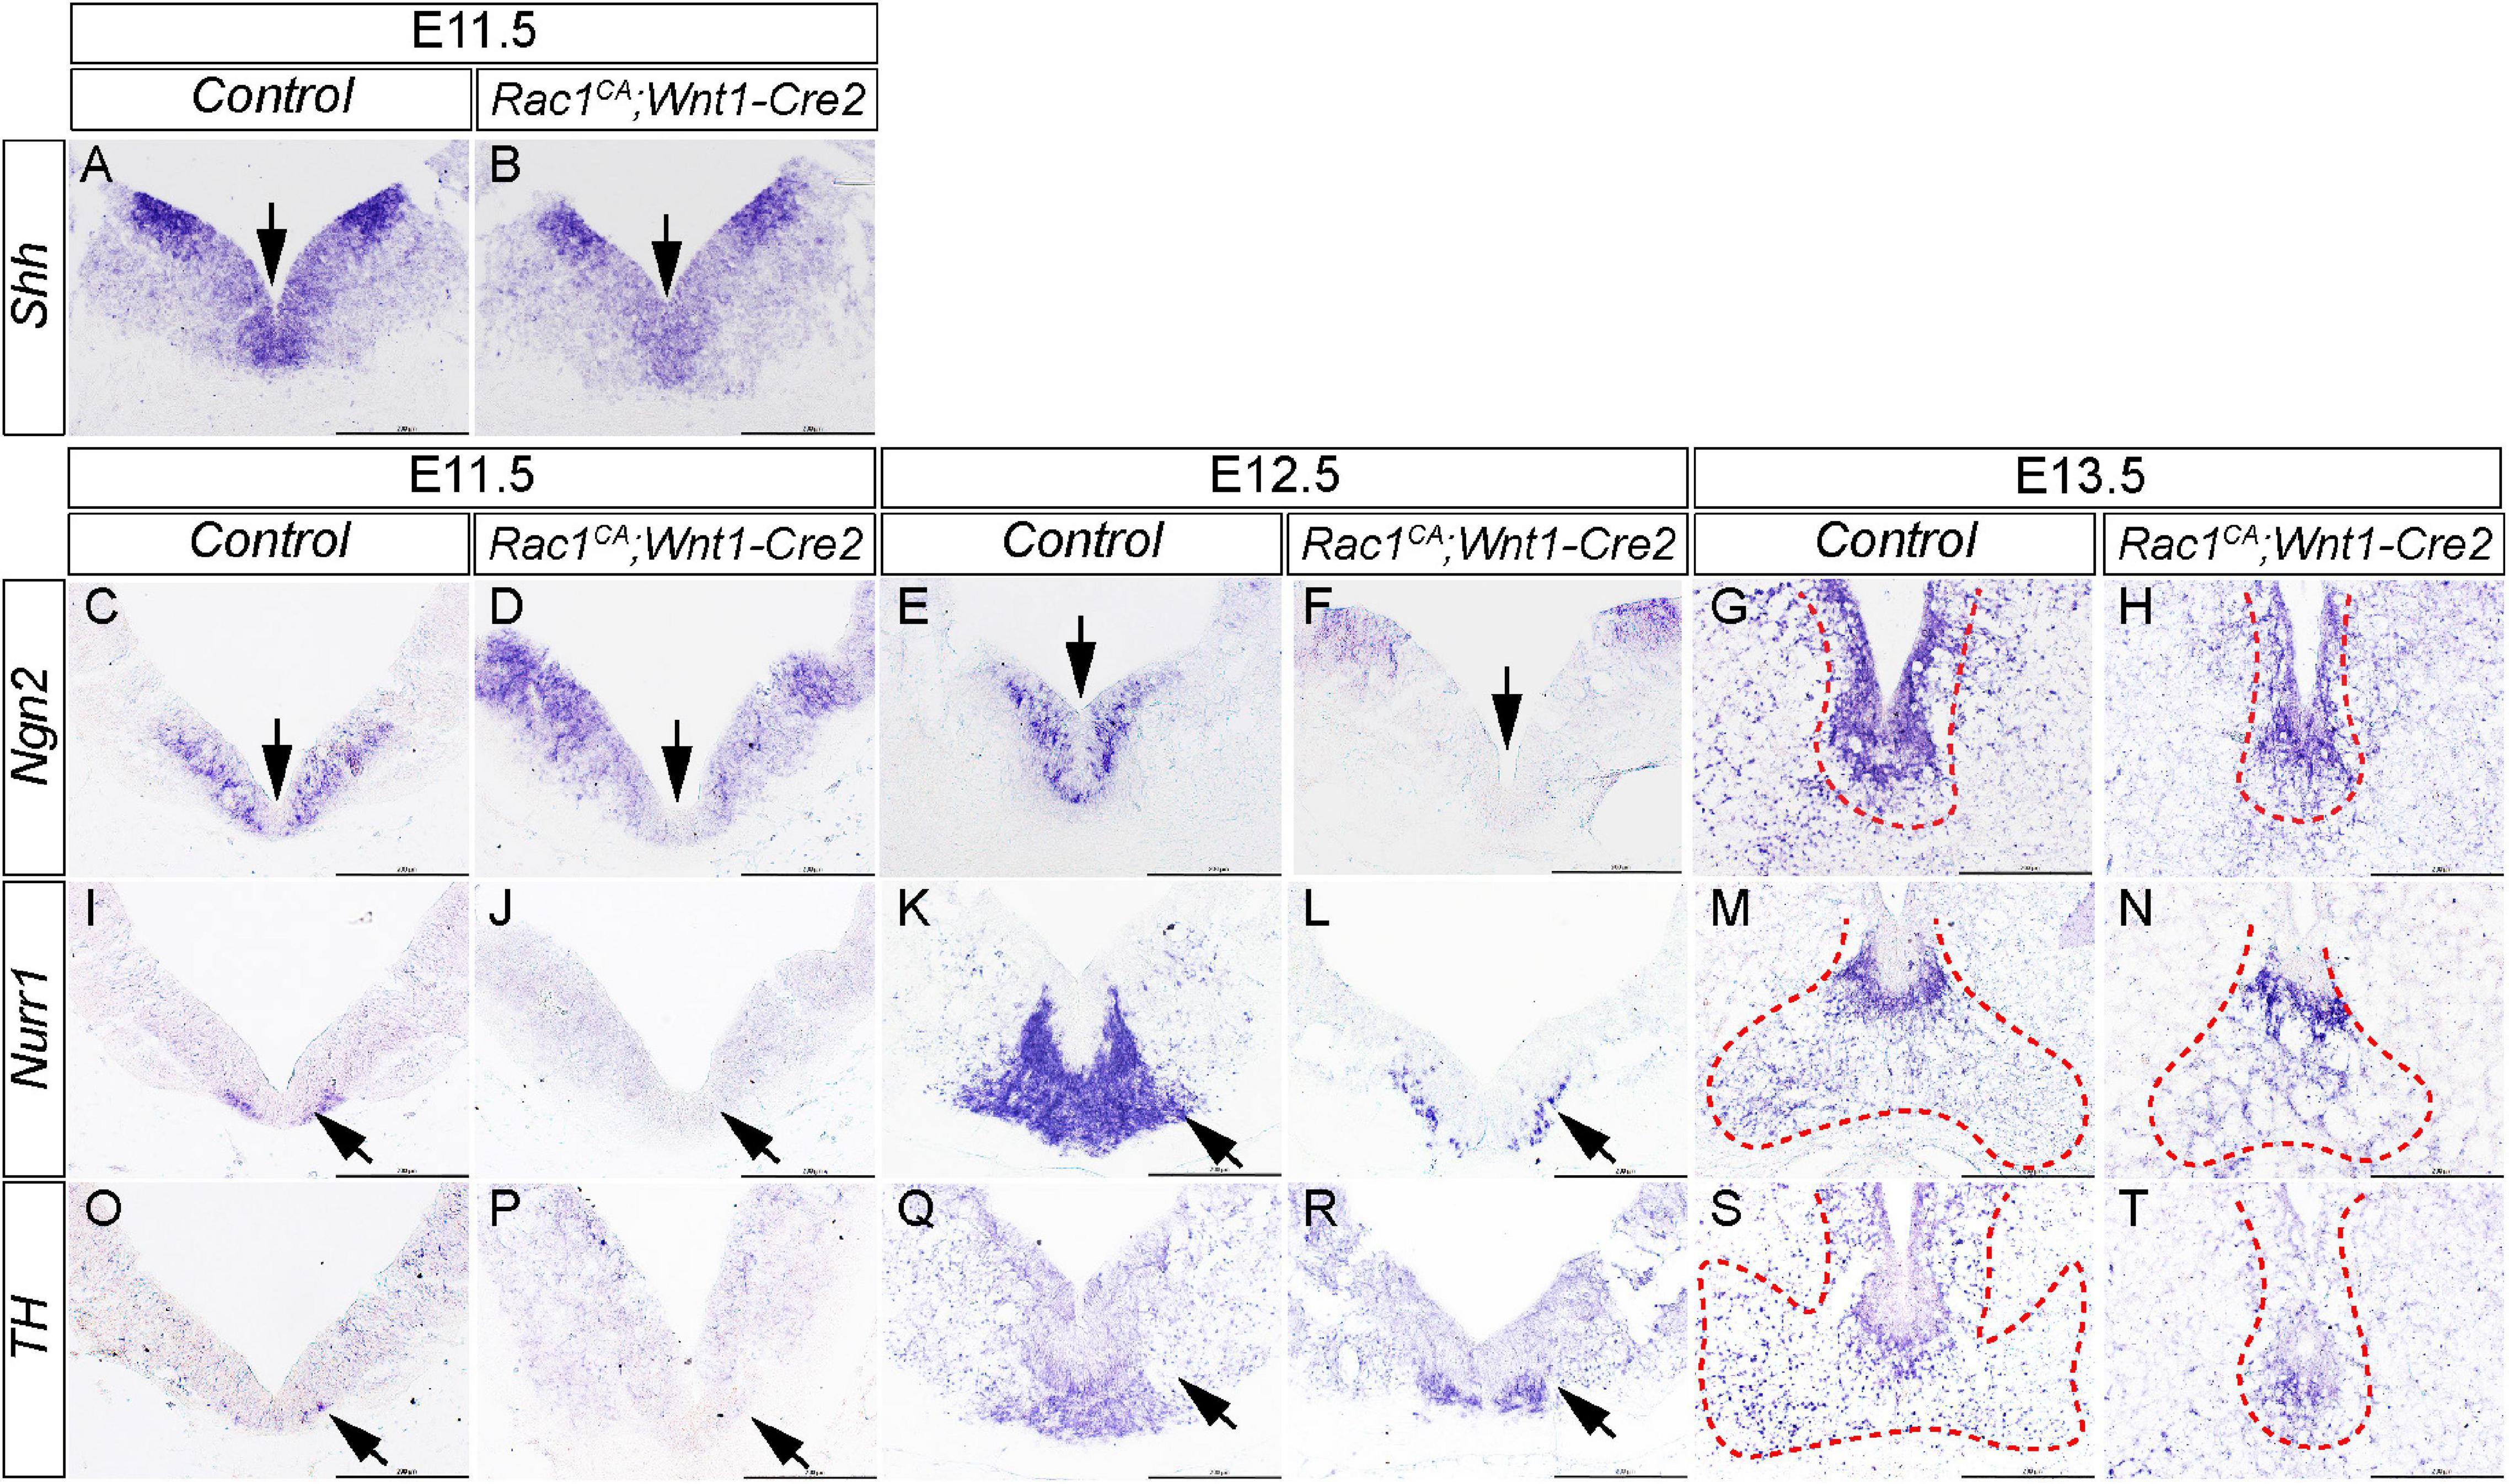
Figure 7. Elevated Rac1 activity disrupts mDA differentiation in ventral midbrain. (A,B) In situ hybridization with Shh antisense probe on coronal sections of E11.5 littermate control and Rac1CA;Wnt1-Cre2 embryo. Arrows point to ventral midbrain. (C–T) In situ hybridization with antisense probes of Ngn2 (C–H), Nurr1 (I–N), and TH (O–T) on coronal sections of littermate control and Rac1CA;Wnt1-Cre2 embryos at E11.5, E12.5, and E13.5, respectively. Arrows point to ventral midbrain. Positive signals in G,H,M,N,S,T are encompassed with red dashed line. Scale bar in A–T, 200 μm.
Discussion
Rac1 plays an important role in development and homeostasis. While multiple mutations in RAC1 allele have been correlated to tumorigenesis, it remains unclear whether elevated Rac1 activity affects embryonic development. In this study, the generation of Rac1CA;Wnt1-Cre2 mice enables evaluation of elevated Rac1 activity on NCCs development in vivo. Our results show that Rac1CA;Wnt1-Cre2 mice exhibit increased proliferation rate, altered cell density, and migration pattern of NCCs. In addition, expression of constitutive active Rac1 also disrupts normal mDA precursor regionalization and neuronal differentiation in the ventral midbrain. These findings demonstrate a rigorous control of Rac1 activity is required for normal NCCs development.
Rac1 regulates multiple cell processes during mouse development, and its regulation seems to be cell context-dependent. Rac1 null mutant mice die by E9.5, accompanied by ectopic cell death and disrupted germ layers (Sugihara et al., 1998). Wnt1Cre mediated NCCs specific Rac1 depletion causes embryonic lethality at E12.5, and the conditional knockout embryos exhibit severe mid-facial clefting and cardiovascular malformation (Fuchs et al., 2009; Thomas et al., 2010). While both groups reported attenuated cell proliferation rate in the conditional knockout mice NCCs, ectopic cell death was not observed in both studies, indicating that Rac1 is essential for cell proliferation and normal cell cycle progress of NCCs. In line with these findings, our previous study also revealed chemical inhibition of Rac1 activity represses NCCs proliferation in explant culture (He and Soriano, 2013). In the present study, our results show that expression of Rac1G12V, a constitutive active form of Rac1, increases cell proliferation rate in ventral midbrain (Figures 5A–E). Together these data support the notion that Rac1 is a positive regulator of NCCs proliferation in both loss-of-function and gain-of-function mouse models. Interestingly, although Rac1 NCCs conditional knockout mice exhibit severe craniofacial and cardiovascular defects, NCCs migration was not affected (Fuchs et al., 2009; Thomas et al., 2010). On the other hand, it is observed that NCCs migration pattern, represented by neurofilament L expression, was altered in Rac1CA;Wnt1-Cre2 embryos (Figure 6). These results indicate Rac1 is not required for NCC migration, but ectopic Rac1 activity disrupts NCCs derivative patterning in vivo.
Our results revealed that increased Rac1 activity in NCCs causes disrupted mDA development in the ventral midbrain (Figure 7), suggesting two potential mechanisms of Rac1 regulation in mDA development. In the first scenario, dysregulated Rac1 activity might affect mDA differentiation in an autonomous manner. This model is supported by previous studies showing that Wnt5a engaged Rac1 activity is required to maintain TH expression of mDA (Andersson et al., 2008; Čajánek et al., 2013). However, it has not been tested whether increased Rac1 activity affects TH expression or mDA differentiation. In the second model, Rac1 activation might lead to extended maintenance of mDA-incompetent domain. This model is supported by multiple lines of evidence. First, we showed increased cell proliferation rate and decreased expression of markers of mDA progenitors in ventral midbrain of Rac1CA;Wnt1-Cre2 mutant (Figures 5, 7). These data indicate a change of mDA progenitor domain in the mutant. This is likely because our data show that neurofilament L+ neurons are actually misrouted in the mutant embryos (Figure 6). In addition, the midbrain phenotype of Rac1CA;Wnt1-Cre2 is strikingly consistent with that of Wnt1-CreTg/Tg, which misexpresses a truncated but functional Wnt1 mRNA in the midbrain (Lewis et al., 2013). Both models exhibit enlarged midbrain phenotype, accompanied by increased cell proliferation and disrupted mDA differentiation. In addition, Tiam1, which encodes a GEF activating Rac1 specifically, is an established Wnt responsive gene (Malliri et al., 2006). It is thus likely that a Wnt1/Tiam1/Rac1 axis promotes cell proliferation rate and expansion of the mDA-incompetent domain and disrupted normal midbrain development and mDA differentiation. It would be interesting to test whether Tiam1 expression and Rac1 activity increases in Wnt1-CreTg/Tg ventral midbrain, and whether Rac1-GTP and TH are co-localized in the differentiating mDA. To this end, we have carried out double immunostaining using anti-TH antibody and anti-Rac1-GTP antibody in the ventral midbrain of the control and mutant embryos. We found the mutant ventral midbrain exhibit increased expression of Rac1-GTP and dramatic decrease of TH expression (Figures 8A–F). However, there is only few cells co-incidentally express both proteins. This result support the notion that neural crest expressed Rac1G12V regulates mDA differentiation in a non-autonomous manner.
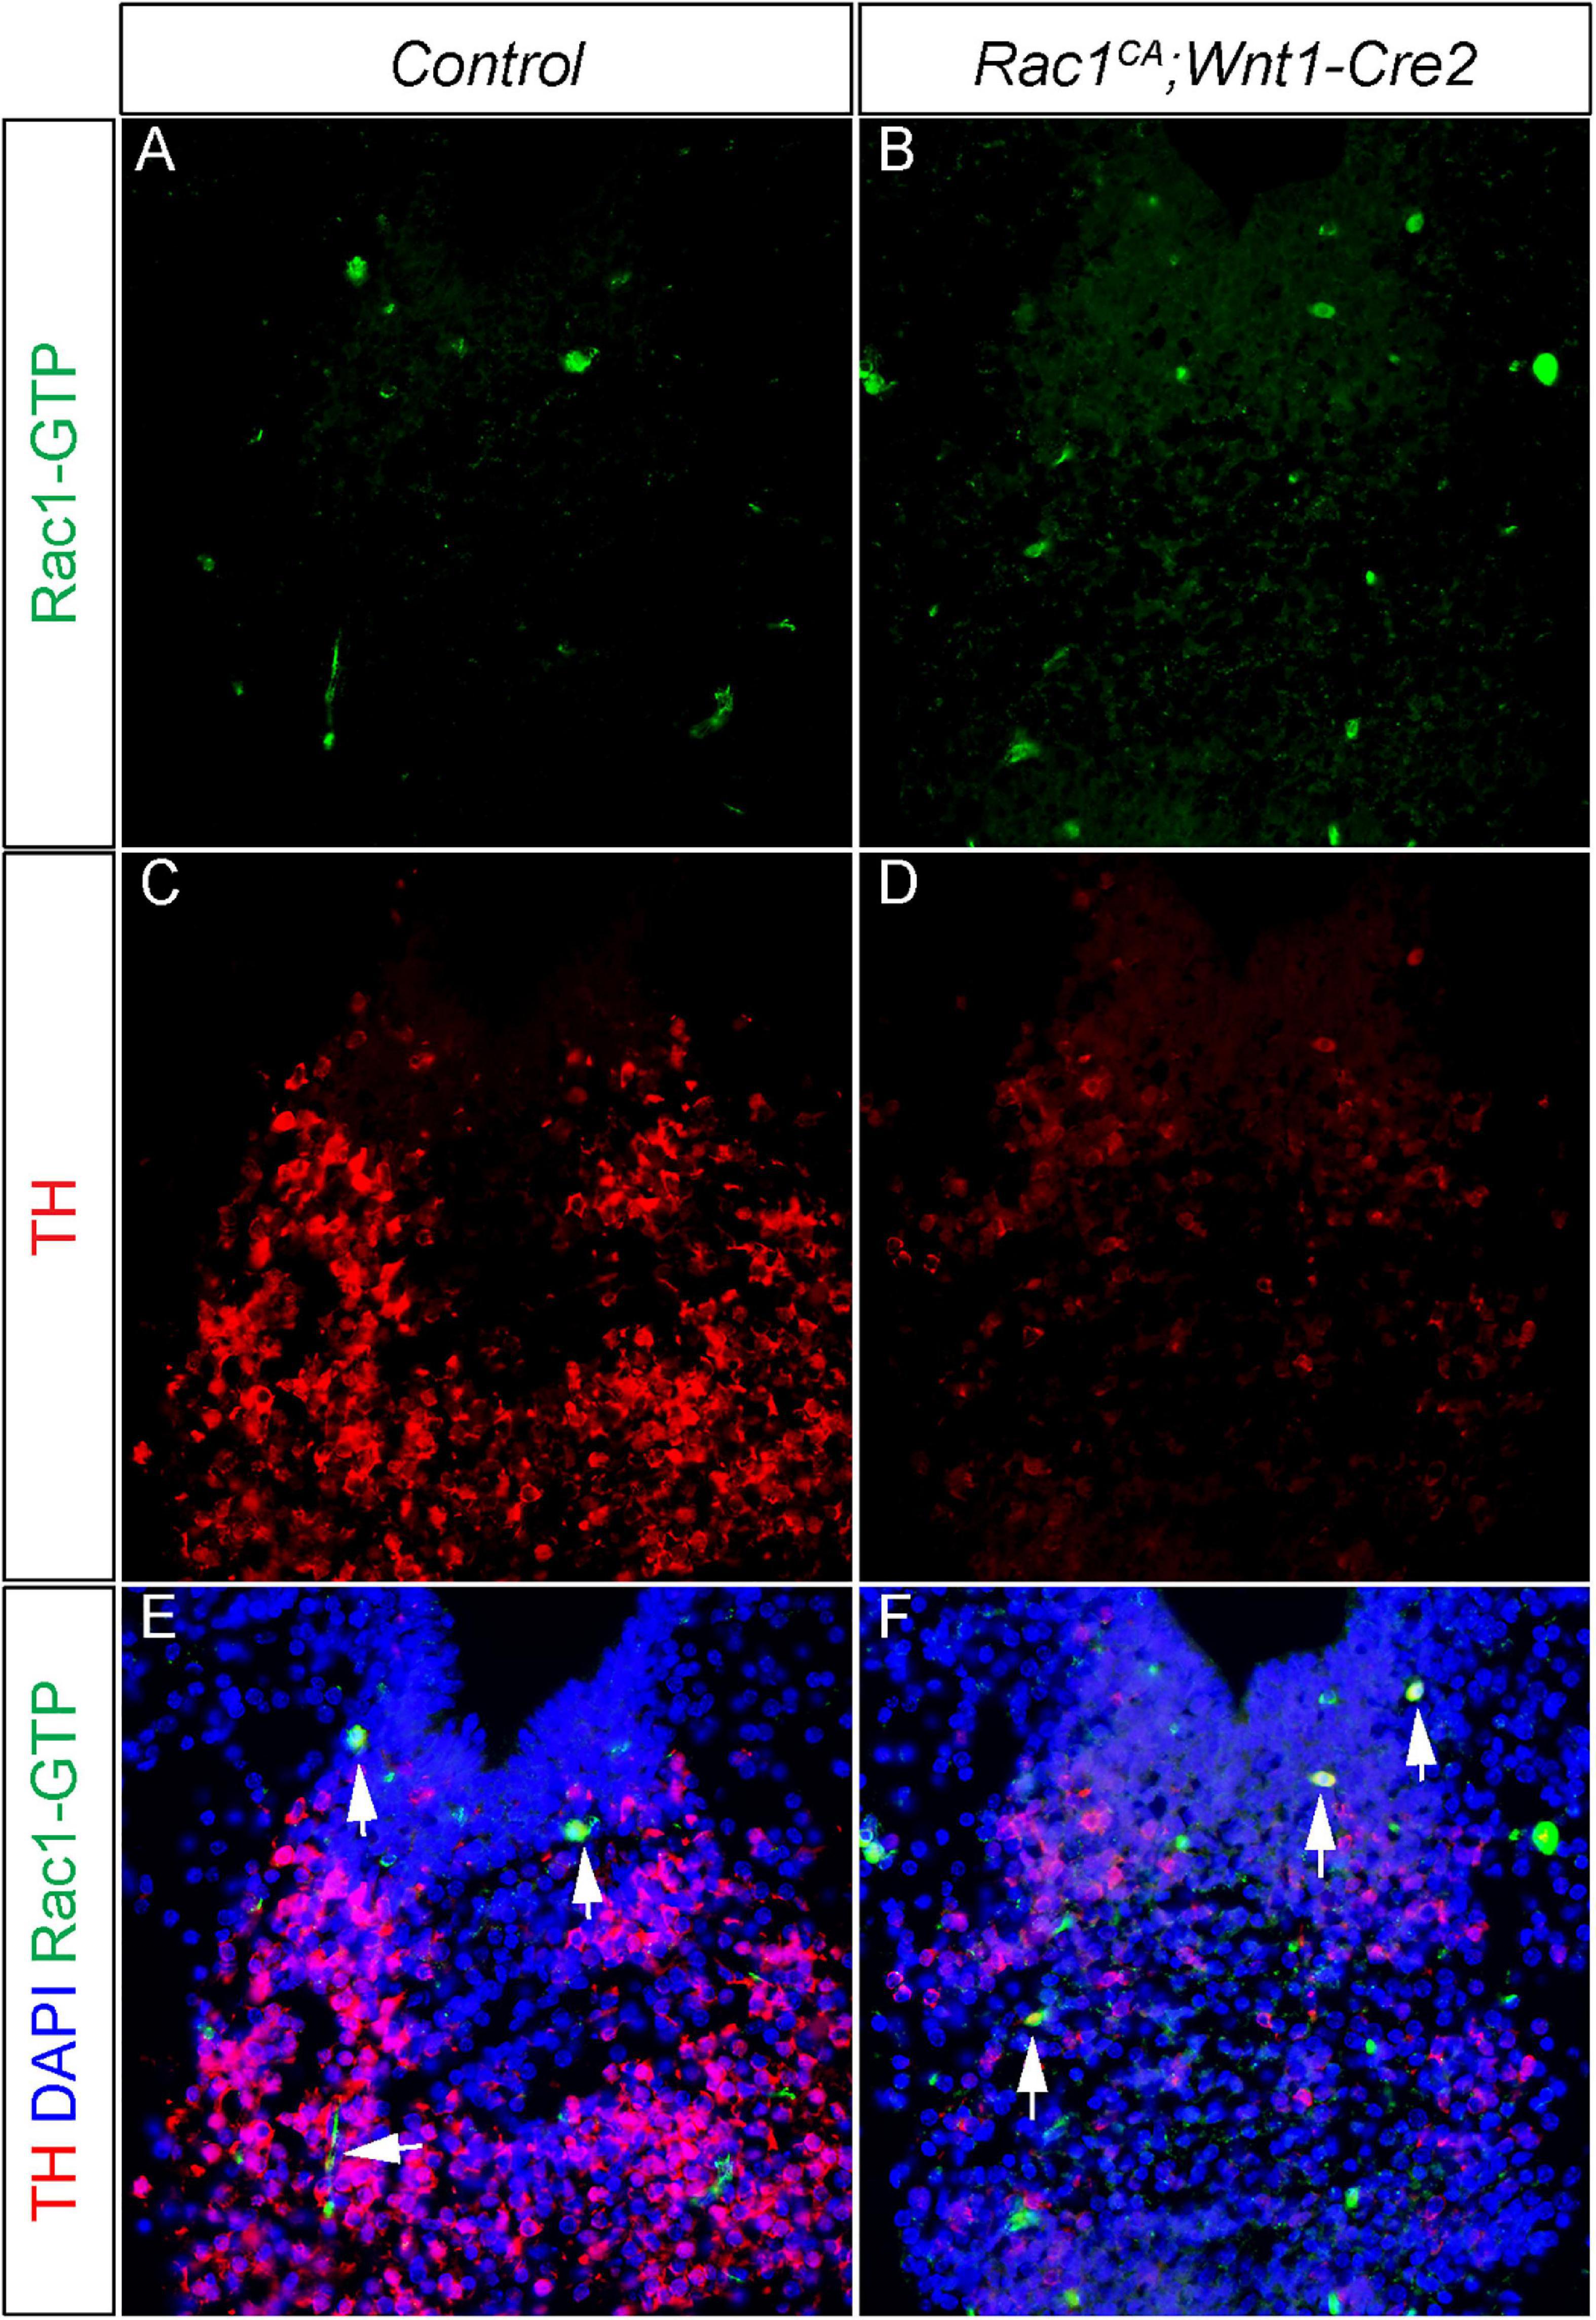
Figure 8. Neural crest driven Rac1G12V expression regulates mDA differentiation in a non-autonomous manner. (A,B) Immunostaining with anti Rac1-GTP antibody (green) on coronal sections of E13.5 littermate control and Rac1CA;Wnt1-Cre2 embryo at the midbrain level. (C,D) Immunostaining with anti TH antibody (red) on same sections of A,B. (E,F) Merged images of A–D with DAPI staining (blue). Blank arrows point to cells express both TH and Rac1-GTP.
In summary, we presented an in vivo model to study augmented Rac1 activity in midbrain morphogenesis and mDA development, and our data show that elevated Rac1 activity alters NCCs proliferation and migration pattern, as well as mDA differentiation in the ventral midbrain. These findings shed light on the mechanisms underlying brain tumors correlated with mutations in RAC1 allele.
Data Availability Statement
The raw data supporting the conclusions of this article will be made available by the authors, without undue reservation.
Ethics Statement
The animal study was reviewed and approved by the Institutional Animal Care and Use Committee of Tulane University.
Author Contributions
AG and FH: conceptualization, methodology, and writing. AG, CD, GB, and MG: experiment and data analysis. All authors contributed to review and approved the submission.
Funding
This work was supported by Tulane University and NIH/National Institute of Dental and Craniofacial Research grant R01DE028918 to FH.
Conflict of Interest
The authors declare that the research was conducted in the absence of any commercial or financial relationships that could be construed as a potential conflict of interest.
Publisher’s Note
All claims expressed in this article are solely those of the authors and do not necessarily represent those of their affiliated organizations, or those of the publisher, the editors and the reviewers. Any product that may be evaluated in this article, or claim that may be made by its manufacturer, is not guaranteed or endorsed by the publisher.
Acknowledgments
We are grateful to our lab colleagues for their critical and constructive comments. We thank Phil Soriano and Jianfu Chen for the Sox10 probe plasmid. We also thank Jeff Tasker for the anti-TH antibody.
References
Andersson, E. R., Prakash, N., Cajanek, L., Minina, E., Bryja, V., Bryjova, L., et al. (2008). Wnt5a regulates ventral midbrain morphogenesis and the development of A9-A10 dopaminergic cells in vivo. PLoS One 3:e3517. doi: 10.1371/journal.pone.0003517
Bartoletti, G., Dong, C., Umar, M., and He, F. (2020). Pdgfra regulates multipotent cell differentiation towards chondrocytes via inhibiting Wnt9a/beta-catenin pathway during chondrocranial cartilage development. Dev. Biol. 466, 36–46. doi: 10.1016/j.ydbio.2020.08.004
Bosco, E. E., Mulloy, J. C., and Zheng, Y. (2009). Rac1 GTPase: a “Rac” of all trades. Cellular Mol. life Sci.: CMLS 66, 370–374. doi: 10.1007/s00018-008-8552-x
Bronner, M. E., and Simões-Costa, M. (2016). The neural crest migrating into the twenty-first century. Curr. Top. Dev. Biol. 116, 115–134. doi: 10.1016/bs.ctdb.2015.12.003
Čajánek, L., Ganji, R. S., Henriques-Oliveira, C., Theofilopoulos, S., Koník, P., Bryja, V., et al. (2013). Tiam1 regulates the Wnt/Dvl/Rac1 signaling pathway and the differentiation of midbrain dopaminergic neurons. Mol. Cell. Biol. 33, 59–70. doi: 10.1128/mcb.00745-12
Chai, Y., Jiang, X., and Ito, Y. (2000). Fate of the mammalian cranial neural crest during tooth and mandibular morphogenesis. Development 127, 1671–1679. doi: 10.1242/dev.127.8.1671
Didsbury, J., Weber, R. F., Bokoch, G. M., Evans, T., and Snyderman, R. (1989). rac, a novel ras-related family of proteins that are botulinum toxin substrates. J. Biol. Chem. 264, 16378–16382. doi: 10.1016/s0021-9258(19)84716-6
Dong, C., Umar, M., Bartoletti, G., Gahankari, A., Fidelak, L., and He, F. (2019). Expression pattern of Kmt2d in murine craniofacial tissues. Gene Expr. Patterns 34:119060. doi: 10.1016/j.gep.2019.119060
Echelard, Y., Epstein, D. J., St-Jacques, B., Shen, L., Mohler, J., McMahon, J. A., et al. (1993). Sonic hedgehog, a member of a family of putative signaling molecules, is implicated in the regulation of CNS polarity. Cell 75, 1417–1430. doi: 10.1016/0092-8674(93)90627-3
Fort, P., Guemar, L., Vignal, E., Morin, N., Notarnicola, C., de Santa Barbara, P., et al. (2011). Activity of the RhoU/Wrch1 GTPase is critical for cranial neural crest cell migration. Dev. Biol. 350, 451–463. doi: 10.1016/j.ydbio.2010.12.011
Fuchs, S., Herzog, D., Sumara, G., Büchmann-Møller, S., Civenni, G., Wu, X., et al. (2009). Stage-Specific control of neural crest stem cell proliferation by the small Rho GTPases Cdc42 and Rac1. Cell Stem Cell 4, 236–247. doi: 10.1016/j.stem.2009.01.017
Gale, E., and Li, M. (2008). Midbrain dopaminergic neuron fate specification: of mice and embryonic stem cells. Mol. Brain 1:8. doi: 10.1186/1756-6606-1-8
He, F., and Soriano, P. (2013). A critical role for PDGFRalpha signaling in medial nasal process development. PLoS Genet. 9:e1003851. doi: 10.1371/journal.pgen.1003851
Hua, Z. L., Emiliani, F. E., and Nathans, J. (2015). Rac1 plays an essential role in axon growth and guidance and in neuronal survival in the central and peripheral nervous systems. Neural Dev. 10:21.
Hwang, S. L., Hong, Y. R., Sy, W. D., Lieu, A. S., Lin, C. L., Lee, K. S., et al. (2004). Rac1 gene mutations in human brain tumours. Eur. J. Surg. Oncol. 30, 68–72. doi: 10.1016/j.ejso.2003.10.018
Jaffe, A. B., and Hall, A. (2005). Rho GTPases: biochemistry and biology. Annu. Rev. Cell Dev. Biol. 21, 247–269.
Jiang, X., Iseki, S., Maxson, R. E., Sucov, H. M., and Morriss-Kay, G. M. (2002). Tissue origins and interactions in the mammalian skull vault. Dev. Biol. 241, 106–116. doi: 10.1006/dbio.2001.0487
Jiang, X., Rowitch, D. H., Soriano, P., McMahon, A. P., and Sucov, H. M. (2000). Fate of the mammalian cardiac neural crest. Development 127, 1607–1616. doi: 10.1242/dev.127.8.1607
Khalil, B. D., and El-Sibai, M. (2012). Rho GTPases in primary brain tumor malignancy and invasion. J. Neurooncol. 108, 333–339. doi: 10.1007/s11060-012-0866-8
Kim, H., Calatayud, C., Guha, S., Fernández-Carasa, I., Berkowitz, L., Carballo-Carbajal, I., et al. (2018). The small GTPase RAC1/CED-10 is essential in maintaining dopaminergic neuron function and survival against α-synuclein-induced toxicity. Mol. Neurobiol. 55, 7533–7552. doi: 10.1007/s12035-018-0881-7
Kobayashi, K., Kuroda, S., Fukata, M., Nakamura, T., Nagase, T., Nomura, N., et al. (1998). p140Sra-1 (specifically Rac1-associated protein) is a novel specific target for Rac1 small GTPase. J. Biol. Chem. 273, 291–295. doi: 10.1074/jbc.273.1.291
Lewis, A. E., Vasudevan, H. N., O’Neill, A. K., Soriano, P., and Bush, J. O. (2013). The widely used Wnt1-Cre transgene causes developmental phenotypes by ectopic activation of Wnt signaling. Dev. Biol. 379, 229–234. doi: 10.1016/j.ydbio.2013.04.026
Malliri, A., Rygiel, T. P., van der Kammen, R. A., Song, J. Y., Engers, R., Hurlstone, A. F., et al. (2006). The rac activator Tiam1 is a Wnt-responsive gene that modifies intestinal tumor development. J. Biol. Chem. 281, 543–548. doi: 10.1074/jbc.m507582200
Nie, X., Zheng, J., Ricupero, C. L., He, L., Jiao, K., and Mao, J. J. (2018). mTOR acts as a pivotal signaling hub for neural crest cells during craniofacial development. PLoS Genet. 14:e1007491. doi: 10.1371/journal.pgen.1007491
Prakash, N., and Wurst, W. (2006a). Development of dopaminergic neurons in the mammalian brain. Cell. Mol. Life Sci. 63, 187–206. doi: 10.1007/s00018-005-5387-6
Prakash, N., and Wurst, W. (2006b). Genetic networks controlling the development of midbrain dopaminergic neurons. J. Physiol. 575, 403–410. doi: 10.1113/jphysiol.2006.113464
Rossman, K. L., Der, C. J., and Sondek, J. (2005). GEF means go: turning on RHO GTPases with guanine nucleotide-exchange factors. Nat. Rev. Mol. Cell Biol. 6, 167–180. doi: 10.1038/nrm1587
Rueden, C. T., Schindelin, J., Hiner, M. C., DeZonia, B. E., Walter, A. E., Arena, E. T., et al. (2017). ImageJ2: imageJ for the next generation of scientific image data. BMC Bioinform. 18:529. doi: 10.1186/s12859-017-1934-z
Simões-Costa, M., and Bronner, M. E. (2015). Establishing neural crest identity: a gene regulatory recipe. Development (Cambridge, England) 142, 242–257. doi: 10.1242/dev.105445
Srinivasan, L., Sasaki, Y., Calado, D. P., Zhang, B., Paik, J. H., DePinho, R. A., et al. (2009). PI3 kinase signals BCR-dependent mature B cell survival. Cell 139, 573–586. doi: 10.1016/j.cell.2009.08.041
Sugihara, K., Nakatsuji, N., Nakamura, K., Nakao, K., Hashimoto, R., Otani, H., et al. (1998). Rac1 is required for the formation of three germ layers during gastrulation. Oncogene 17, 3427–3433. doi: 10.1038/sj.onc.1202595
Thomas, P. S., Kim, J., Nunez, S., Glogauer, M., and Kaartinen, V. (2010). Neural crest cell-specific deletion of Rac1 results in defective cell-matrix interactions and severe craniofacial and cardiovascular malformations. Dev. Biol. 340, 613–625. doi: 10.1016/j.ydbio.2010.02.021
Wittmann, T., Bokoch, G. M., and Waterman-Storer, C. M. (2003). Regulation of leading edge microtubule and actin dynamics downstream of Rac1. J. Cell Biol. 161, 845–851. doi: 10.1083/jcb.200303082
Keywords: Rac1, constitutive activation, neural crest, midbrain development, dopaminergic neuron, mouse
Citation: Gahankari A, Dong C, Bartoletti G, Galazo M and He F (2021) Deregulated Rac1 Activity in Neural Crest Controls Cell Proliferation, Migration and Differentiation During Midbrain Development. Front. Cell Dev. Biol. 9:704769. doi: 10.3389/fcell.2021.704769
Received: 03 May 2021; Accepted: 18 August 2021;
Published: 07 September 2021.
Edited by:
Poongodi Geetha-Loganathan, SUNY Oswego, United StatesReviewed by:
Rosa Uribe, Rice University, United StatesLasse Sinkkonen, University of Luxembourg, Luxembourg
Kristin Artinger, University of Colorado Anschutz Medical Campus, United States
Copyright © 2021 Gahankari, Dong, Bartoletti, Galazo and He. This is an open-access article distributed under the terms of the Creative Commons Attribution License (CC BY). The use, distribution or reproduction in other forums is permitted, provided the original author(s) and the copyright owner(s) are credited and that the original publication in this journal is cited, in accordance with accepted academic practice. No use, distribution or reproduction is permitted which does not comply with these terms.
*Correspondence: Fenglei He, ZmhlQHR1bGFuZS5lZHU=