
94% of researchers rate our articles as excellent or good
Learn more about the work of our research integrity team to safeguard the quality of each article we publish.
Find out more
ORIGINAL RESEARCH article
Front. Cell Dev. Biol., 11 June 2021
Sec. Epigenomics and Epigenetics
Volume 9 - 2021 | https://doi.org/10.3389/fcell.2021.682561
This article is part of the Research TopicEpigenetics in Cancer: Mechanisms and Drug DevelopmentView all 15 articles
 Luyao Zhang1†
 Dan Xiong2†
 Qian Liu3Yiling Luo3Yuhan Tian2
 Xi Xiao1Ye Sang4
 Yihao Liu5
 Shubin Hong1Shuang Yu1
 Jie Li6
 Weiming Lv6Yanbing Li1Zhonghui Tang2
 Rengyun Liu4*
 Qian Zhong3*
 Haipeng Xiao1*
Thyroid carcinoma (TC) is the most common endocrine malignancy, and papillary TC (PTC) is the most frequent subtype of TC, accounting for 85–90% of all the cases. Aberrant histone acetylation contributes to carcinogenesis by inducing the dysregulation of certain cancer-related genes. However, the histone acetylation landscape in PTC remains elusive. Here, we interrogated the epigenomes of PTC and benign thyroid nodule (BTN) tissues by applying H3K27ac chromatin immunoprecipitation followed by deep sequencing (ChIP-seq) along with RNA-sequencing. By comparing the epigenomic features between PTC and BTN, we detected changes in H3K27ac levels at active regulatory regions, identified PTC-specific super-enhancer-associated genes involving immune-response and cancer-related pathways, and uncovered several genes that associated with disease-free survival of PTC. In summary, our data provided a genome-wide landscape of histone modification in PTC and demonstrated the role of enhancers in transcriptional regulations associated with prognosis of PTC.
Thyroid carcinoma (TC) is the most common endocrine malignancy with an increasing incidence during the past decades (Kilfoy et al., 2009). Papillary TC (PTC) is the most frequent subtype, which accounts for 85–90% of all the TC cases and occurs three times more frequently in women than in men (Jemal et al., 2010). It is now well accepted that both genetic alterations and epigenetic changes contribute to PTC development and progression. Some somatic driver mutations, such as the BRAF V600E and TERT promoter mutations (Liu et al., 2017), and epigenetic alterations, such as specific non-coding RNAs and DNA methylation modifications (Yu et al., 2012; Yim et al., 2019), have been well established as diagnostic and prognostic markers of PTC.
Histones are subject to a variety of post-transcriptional modifications including methylation, acetylation, phosphorylation, and ubiquitination (Bártová et al., 2008; Matsuda et al., 2015), which influence interactions between DNA and histones, resulting in global regulation of gene expression. Typically, histone acetylation is related to active transcription, while deacetylation induced transcriptional silencing. Histone modifications control gene expression, and numerous studies have found that dysregulation of this modification functionally impacts transcriptome in carcinogenesis. Several histone deacetylated inhibitors such as vorinostat (SAHA), a suberoylanilide hydroxamic acid that inhibits deacetylase enzymatic activity, had been used in clinical trials treating TC patients. Moreover, it was reported that SAHA induced apoptosis in PTC cell lines (Brest et al., 2011). Recently, one study reported global levels of histone modifications in four thyroid tissues (Siu et al., 2017). Studies reported histone acetylation increment at the promoters of NIS and ECAD in TC cells (Federico et al., 2009; Zhang et al., 2014).
It is now recognized that enhancers and super-enhancers (SEs) are crucial components of genetic transcription regulators in cancers. Enhancer, a DNA region that transcription factors can bind, could positively regulate gene expression in cis- or trans- manner. It has been proposed that tumorigenesis is usually accompanied by dysregulation of enhancer activities (Bulger and Groudine, 2011). SEs, defined as clusters of enhancers densely occupied with mediators and chromatin regulators, can facilitate expressions of important genes in determining cell identity and fate (Whyte et al., 2013). Characterized by high levels of H3K27ac, enhancers can be readily identified by chromatin immunoprecipitation followed by deep-sequencing (CHIP-seq). Moreover, SEs are more prone to perturbations than typical enhancers (Zhou et al., 2015). One of the mechanisms that histone acetylation mediates RNA transcriptions is to interact with the bromodomain and extra-terminal domain (BET) protein BRD4 (Dey et al., 2003), which could serve as potential therapeutic targets of cancers. BET inhibitor JQ1 inhibits interactions between BET protein and acetylated histones, resulting in downregulation of a number of genes and related signaling pathways (Filippakopoulos et al., 2010). It has been reported that JQ1 inhibited the tumor growth in differentiated and undifferentiated TC (Gao et al., 2016; Zhu et al., 2017).
Accumulating evidence underscored the role of enhancer-driven transcriptional programs in tumor pathogenesis. However, the H3K27ac landscape and enhancer pattern of PTC remained unclear. Here, we generated reference epigenome data for PTC and benign thyroid nodule (BTN) tissues using H3K27ac ChIP-seq along with global transcriptome, comparing epigenomic features and SEs between these two groups. This study provided an epigenetic insight for understanding the development of PTC, revealing regulations of epigenomic modifications on the transcription level, and identified several enhancer-regulated genes that hold the potential to serve as diagnostic and prognostic markers for PTC.
This study included eight PTC and four BTN female cases who were treated at The First Affiliated Hospital of Sun Yat-sen University. The diagnosis of PTC was performed according to the WHO criteria. The thyroid specimens and clinicopathologic data were collected after our institutional review board approval.
Primary PTC and BTN were pulverized in liquid nitrogen with mortar. Tissue powder was then cross-linked with 1% formaldehyde and lysed with lysis buffer. Genomic DNA was then sonicated into 200 to 500 bp fragments using ultrasonicator in lysis buffer. The supernatant was diluted, and the lysates were incubated with anti-H3K27ac antibody (ab4729; Abcam, Cambridge, United Kingdom) overnight at 4°C. Protein–DNA complexes were captured with protein A agarose beads. After extensive washing, protein–DNA complexes were eluted and reverse cross-linked. DNA was purified with QIAGEN (Hilden, Germany) PCR purification kit (Cat No. 28106). Ten nanograms of purified DNA was used for downstream library-prep with NEBNext Ultra II DNA Library Prep Kit for Illumina (NEB #E7103; New England Biolabs, Ipswich, MA, United States), following the manufacturer’s instructions. The quality of sequencing libraries was analyzed with bioanalyzer (Agilent Technologies, Santa Clara, CA, United States) and then sequenced by Illumina NovaSeq 6000 platform. Input DNA from each sample were sequenced using different bar codes.
The clean ChIP-seq reads were aligned to the human genome (hg38) using BWA with default parameters. Then, the unmapped reads and non-uniquely mapped reads (mapping quality < 20) were removed by SAMtools, while the PCR duplicate reads were filtered by Picard. The H3K27ac modification regions were defined using MACS. To find out the differential H3K27ac modification region, the modification regions were merged by BEDtools, and the reads of the merged regions were estimated by HTSeq. Finally, DESeq2 was performed to normalize the counts and to detect differential H3K27ac regions (| fold change| ≥ 2 and p value < 0.05).
Primary tissues were pulverized in liquid nitrogen, and RNA was extracted with TRIzol (Invitrogen, Carlsbad, CA, United States) following manufacturer’s protocol. RNA-seq was performed by Berry Genomics Co., China. Briefly, RNA degradation and contamination were monitored on 1% agarose gels, and purity was checked with NanoPhotometer spectrophotometer (IMPLEN, Westlake Village, CA, United States). RNA integrity was assessed with RNA Nano 6000 Assay Kit of the Bioanalyzer 2100 system (Agilent Technologies, Santa Clara, CA, United States). A total amount of 1 μg of RNA per sample was used as input material for the RNA preparations. Sequencing libraries were generated with NEBNext Ultra RNA Library Prep Kit for Illumina (NEB, United States) following manufacturer’s recommendations, and index codes were added to attribute sequences to corresponding sample. Library quality was assessed on the Agilent Bioanalyzer 2100 system. After cluster generation, the library preparations were sequenced on an Illumina NovaSeq 6000 platform.
Differential expression analysis was performed with DESeq; the clean RNA-seq reads were aligned to the human genome (hg38) using HISAT with default parameters. Then, the reads overlapped with genes were estimated by HTseq. The normalization, counts, and detection of differentially expressed genes were performed by DEseq2 (| fold change| ≥ 2 and p value < 0.05).
Genomic Regions Enrichment of Annotations Tool (GREAT)1 was used to analyze the functional significance of differentiated H3K27ac-modified regions (McLean et al., 2010). Pathway analysis was performed with gene names using DAVID. Selected Kyoto Encyclopedia of Genes and Genomes (KEGG) pathways that have p values of less than 0.05 were reported. Pathway enrichment analysis was performed using gene set enrichment analysis (GSEA)2 (Liao et al., 2019).
Enhancers and promoters were identified by MACS (Liu, 2014). To identify SEs, all enhancers were ranked according to their total ChIP-seq signal using ROSE (Zhou et al., 2015). Enhancers were sorted and plotted based on H3K27ac signals in ascending order. The cutoff value was set to distinguish SEs from typical enhancers, in which enhancers were assigned as SEs if their H3K27ac signals exceeded this threshold level.
BCPAP and KTC-1 cells were cultured in RPMI-1640 media supplemented with 10% fetal bovine serum (FBS; #10270-106; Gibco, Thermo Fisher Scientific, Waltham, MA, United States). TPC-1 cells were cultured with Dulbecco modified Eagle medium supplemented with 10% FBS (Gibco). All the cells were maintained at 37°C in a 5% CO2 humidified chamber.
BCPAP, KTC-1, and TPC-1 cells were seeded on day 0 and treated with JQ1 (S7110; Selleck, Houston, TX, United States) or Vorinostat (SAHA) (S1047; Selleck) or vehicle for 48 h with indicated concentrations on day 1. Fresh culture medium with drugs or vehicle was replenished every 24 h.
Total mRNAs were extracted using RNAsimple Total RNA Kit (#DP419; TIANGEN Biotech, Beijing, China). Five hundred nanograms of mRNA was used as template for reverse transcription with PrimeScript RT Master Mix (RR036A; Takara, Dalian, China). cDNAs were then amplified on ABI QuantStudio 5 Real-Time PCR System (Thermo Fisher), and SYBR Green Master Mix (A25742; Thermo Fisher Scientific, Waltham, MA, United States) was used to detect cDNA amplification. GAPDH was used to normalize gene expression. RNA relative expression was calculated using the 2–ΔΔCT method.
Statistical analyses were performed using R and GraphPad Prism software. Student’s t-test was performed to compare two groups of the continuous variables. All the p values were two-sided, and p < 0.05 was regarded as statistically significant.
To identify histotype-specific landscapes of active chromatin in thyroid tissues, ChIP-seq using H3K27ac (acetylated lysine 27 of histone H3) antibody was performed on eight PTC and four BTN samples from 12 Chinese females (Supplementary Data). Model-based analysis for ChIP-seq (MACS) was used to analyze and identify significant peaks from the samples. Principal component analysis (PCA) indicated that PTC and BTN samples grouped into two clusters according to their genome-wide H3K27ac profiles, suggesting that the differences were etiology specific (Figure 1A). When comparing H3K27ac peaks between PTC and BTN, 395 peaks were unique to PTC samples, while 437 peaks were unique to BTN. With all the differentiated peaks, PTC and BTN samples segregated well on hierarchical clustering (Figure 1B). Differentiated H3K27ac peaks distributed across different regions genome-wide, which showed a greater distribution in intron and intergenic regions with 8.6% PTC-specific and 14.8% BTN-unique peaks located at promoter–transcription start site (TSS) regions (Figure 1C). After the differentiated peaks were annotated with GREAT, we found that gene ontology (GO) terms enriched with PTC-specific peaks included T-cell activation, regulation of lymphocyte activation, leukocyte cell–cell adhesion, and interferon-gamma secretion. Vasculature development, vascular endothelial growth factor signaling pathway, tube morphogenesis, etc., were enriched with BTN-unique peaks (Figure 1D).
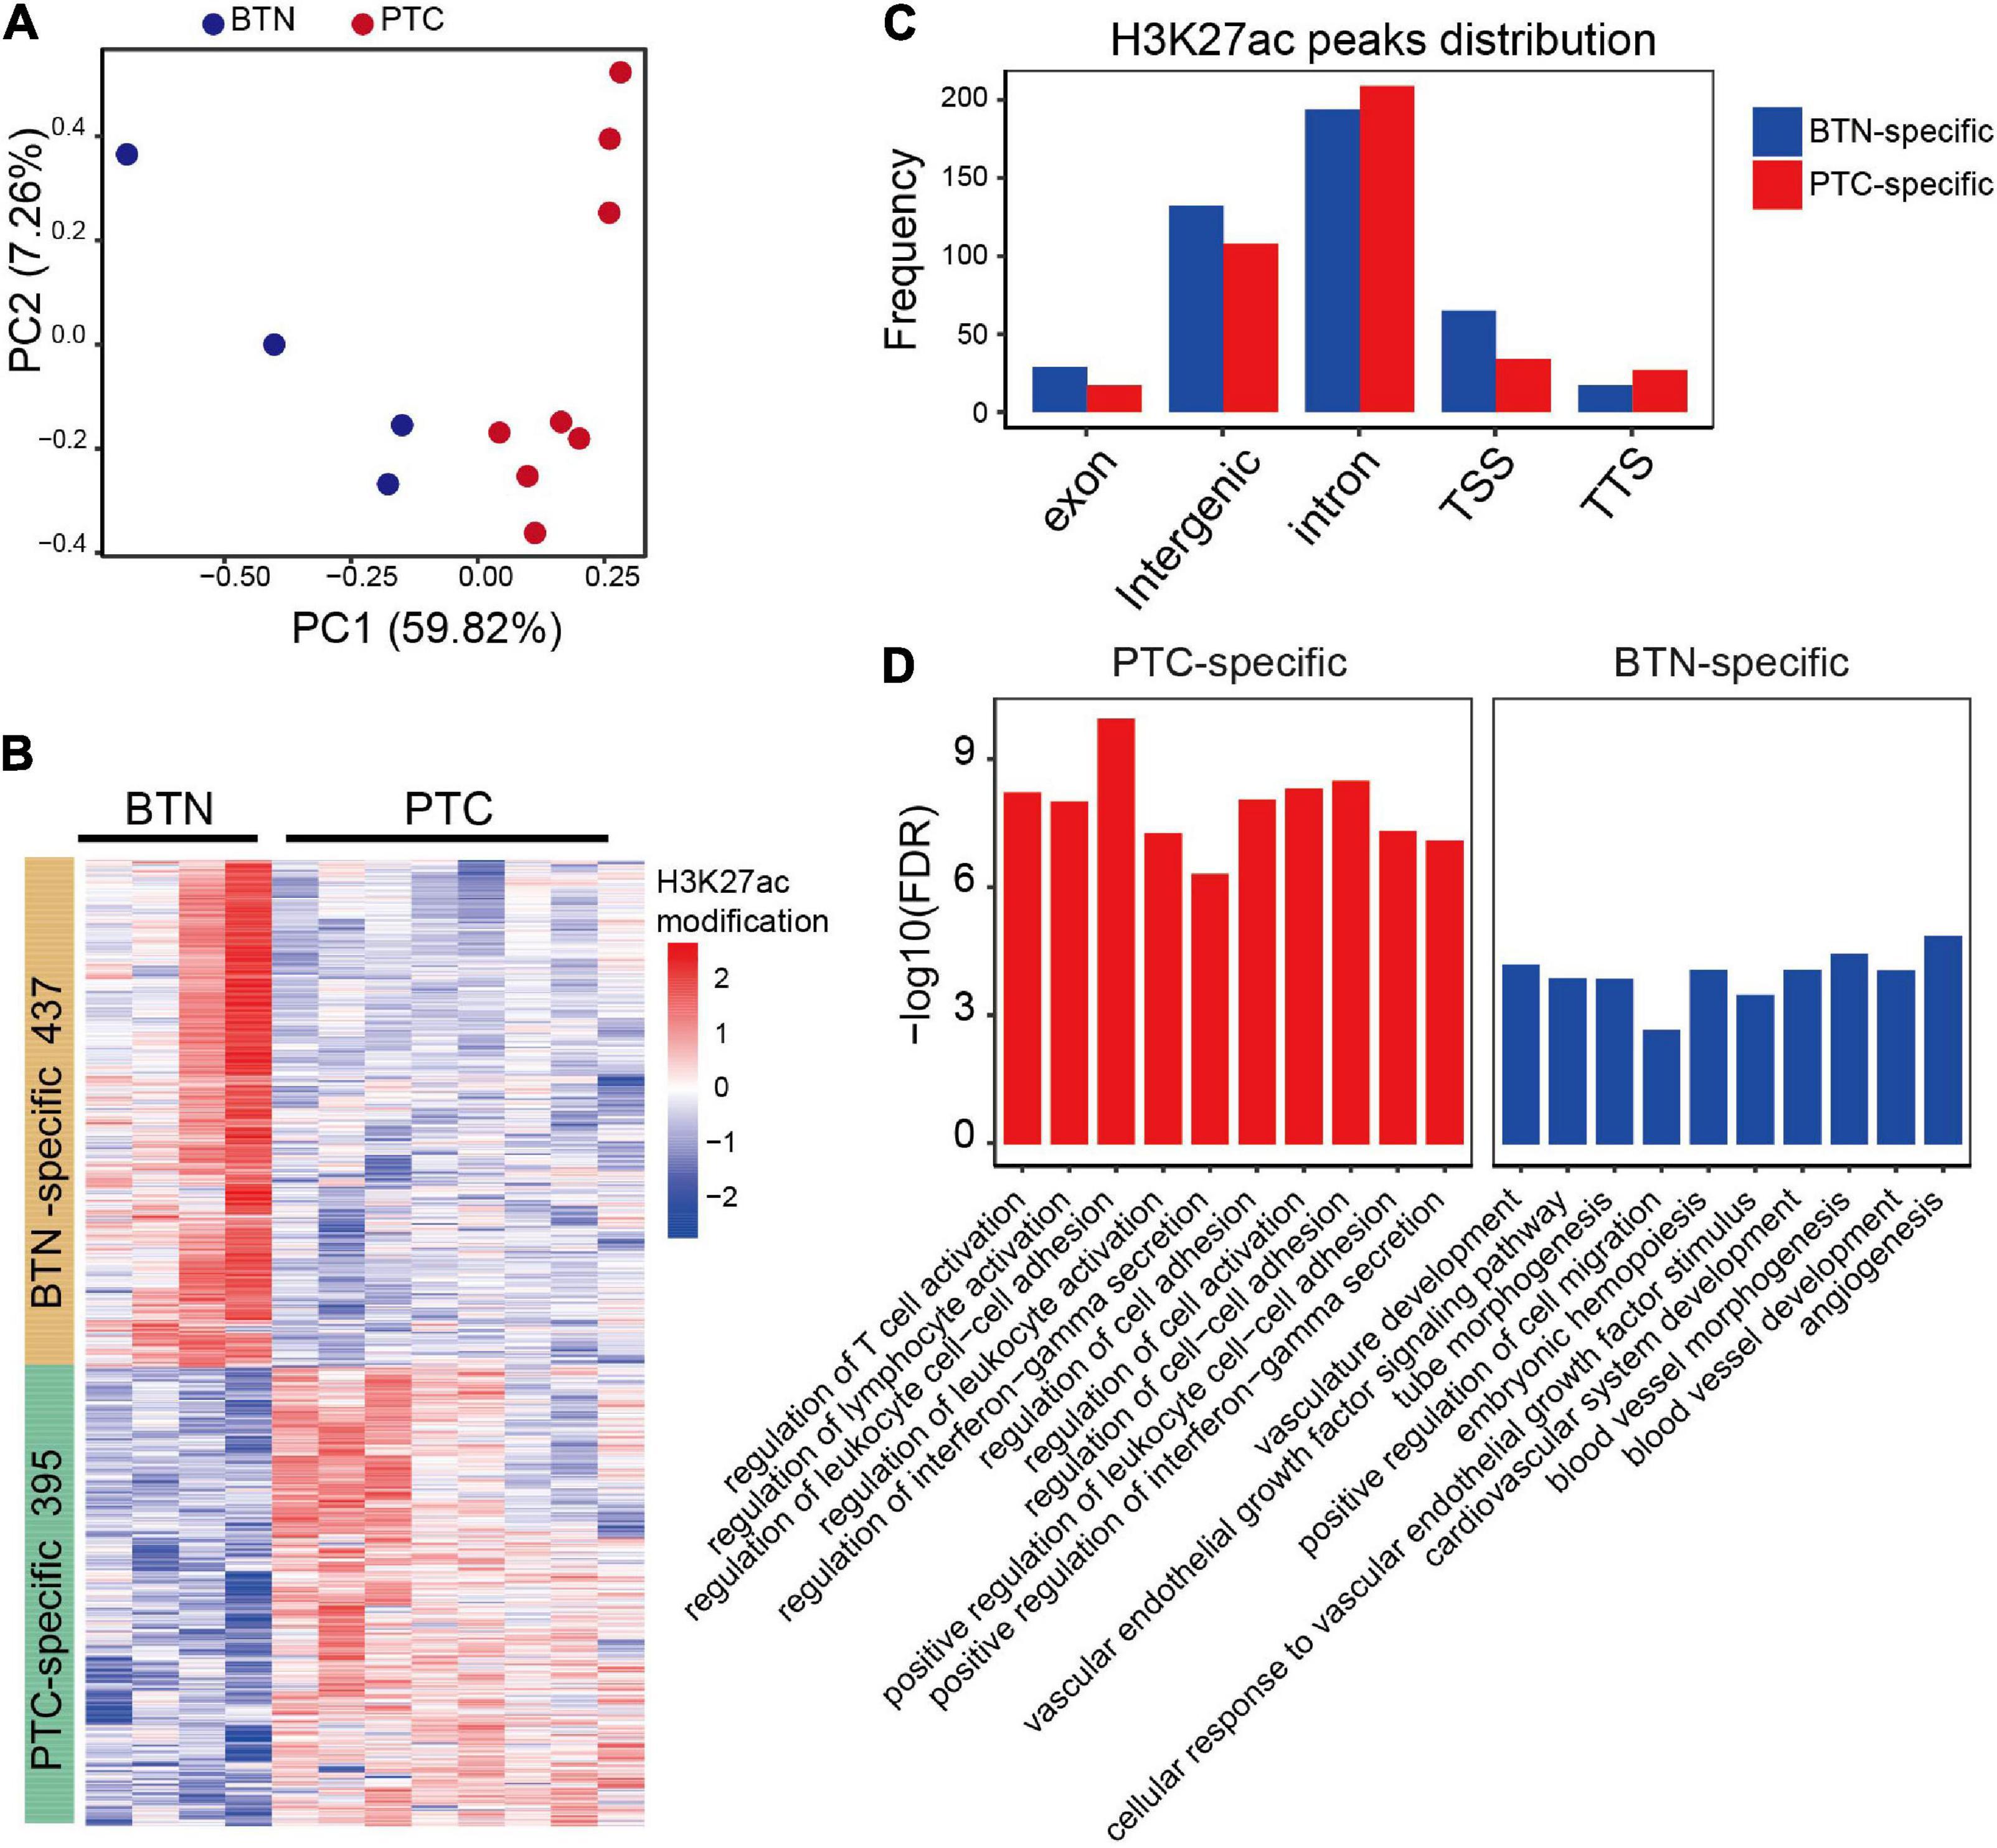
Figure 1. Characterization of H3K27ac landscapes in PTC and BTN. (A) Principal component analysis of normalized PTC and BTN H3K27ac peaks. (B) Heatmap of differentiated H3K27ac-modified peaks between PTC and BTN. (C) Distribution of differentiated histone H3K27ac marks in genome. TSS, transcription start sites; TTS, transcription termination sites. (D) Bar plots showing top gene ontology (GO) terms of PTC and BTN-specific H3K27ac peaks. PTC, papillary thyroid carcinoma; BTN, benign thyroid nodule.
Super-enhancers are clusters of enhancers and are critically important in development, differentiation, and oncogenesis (Whyte et al., 2013). To identify SEs, H3K27ac signals from sliding windows containing enhancers were ranked using ROSE (Zhou et al., 2015). We first identified the SEs in the tumor and BTN tissues, and enhancers in each sample were annotated (Supplementary Data). A total of 3,369 SEs were identified in PTC and 3,366 SEs in BTN samples, among which 367 and 364 SEs were specific to PTC and BTN, respectively (Figure 2A). SE genomic sites were categorized into PTC-specific and BTN-specific SE sites. H3K27ac signaling of BTN SEs at PTC-specific genomic sites was significantly lower than that of PTC, contrary to the situation at BTN-specific SE genomic sites (Figure 2B).
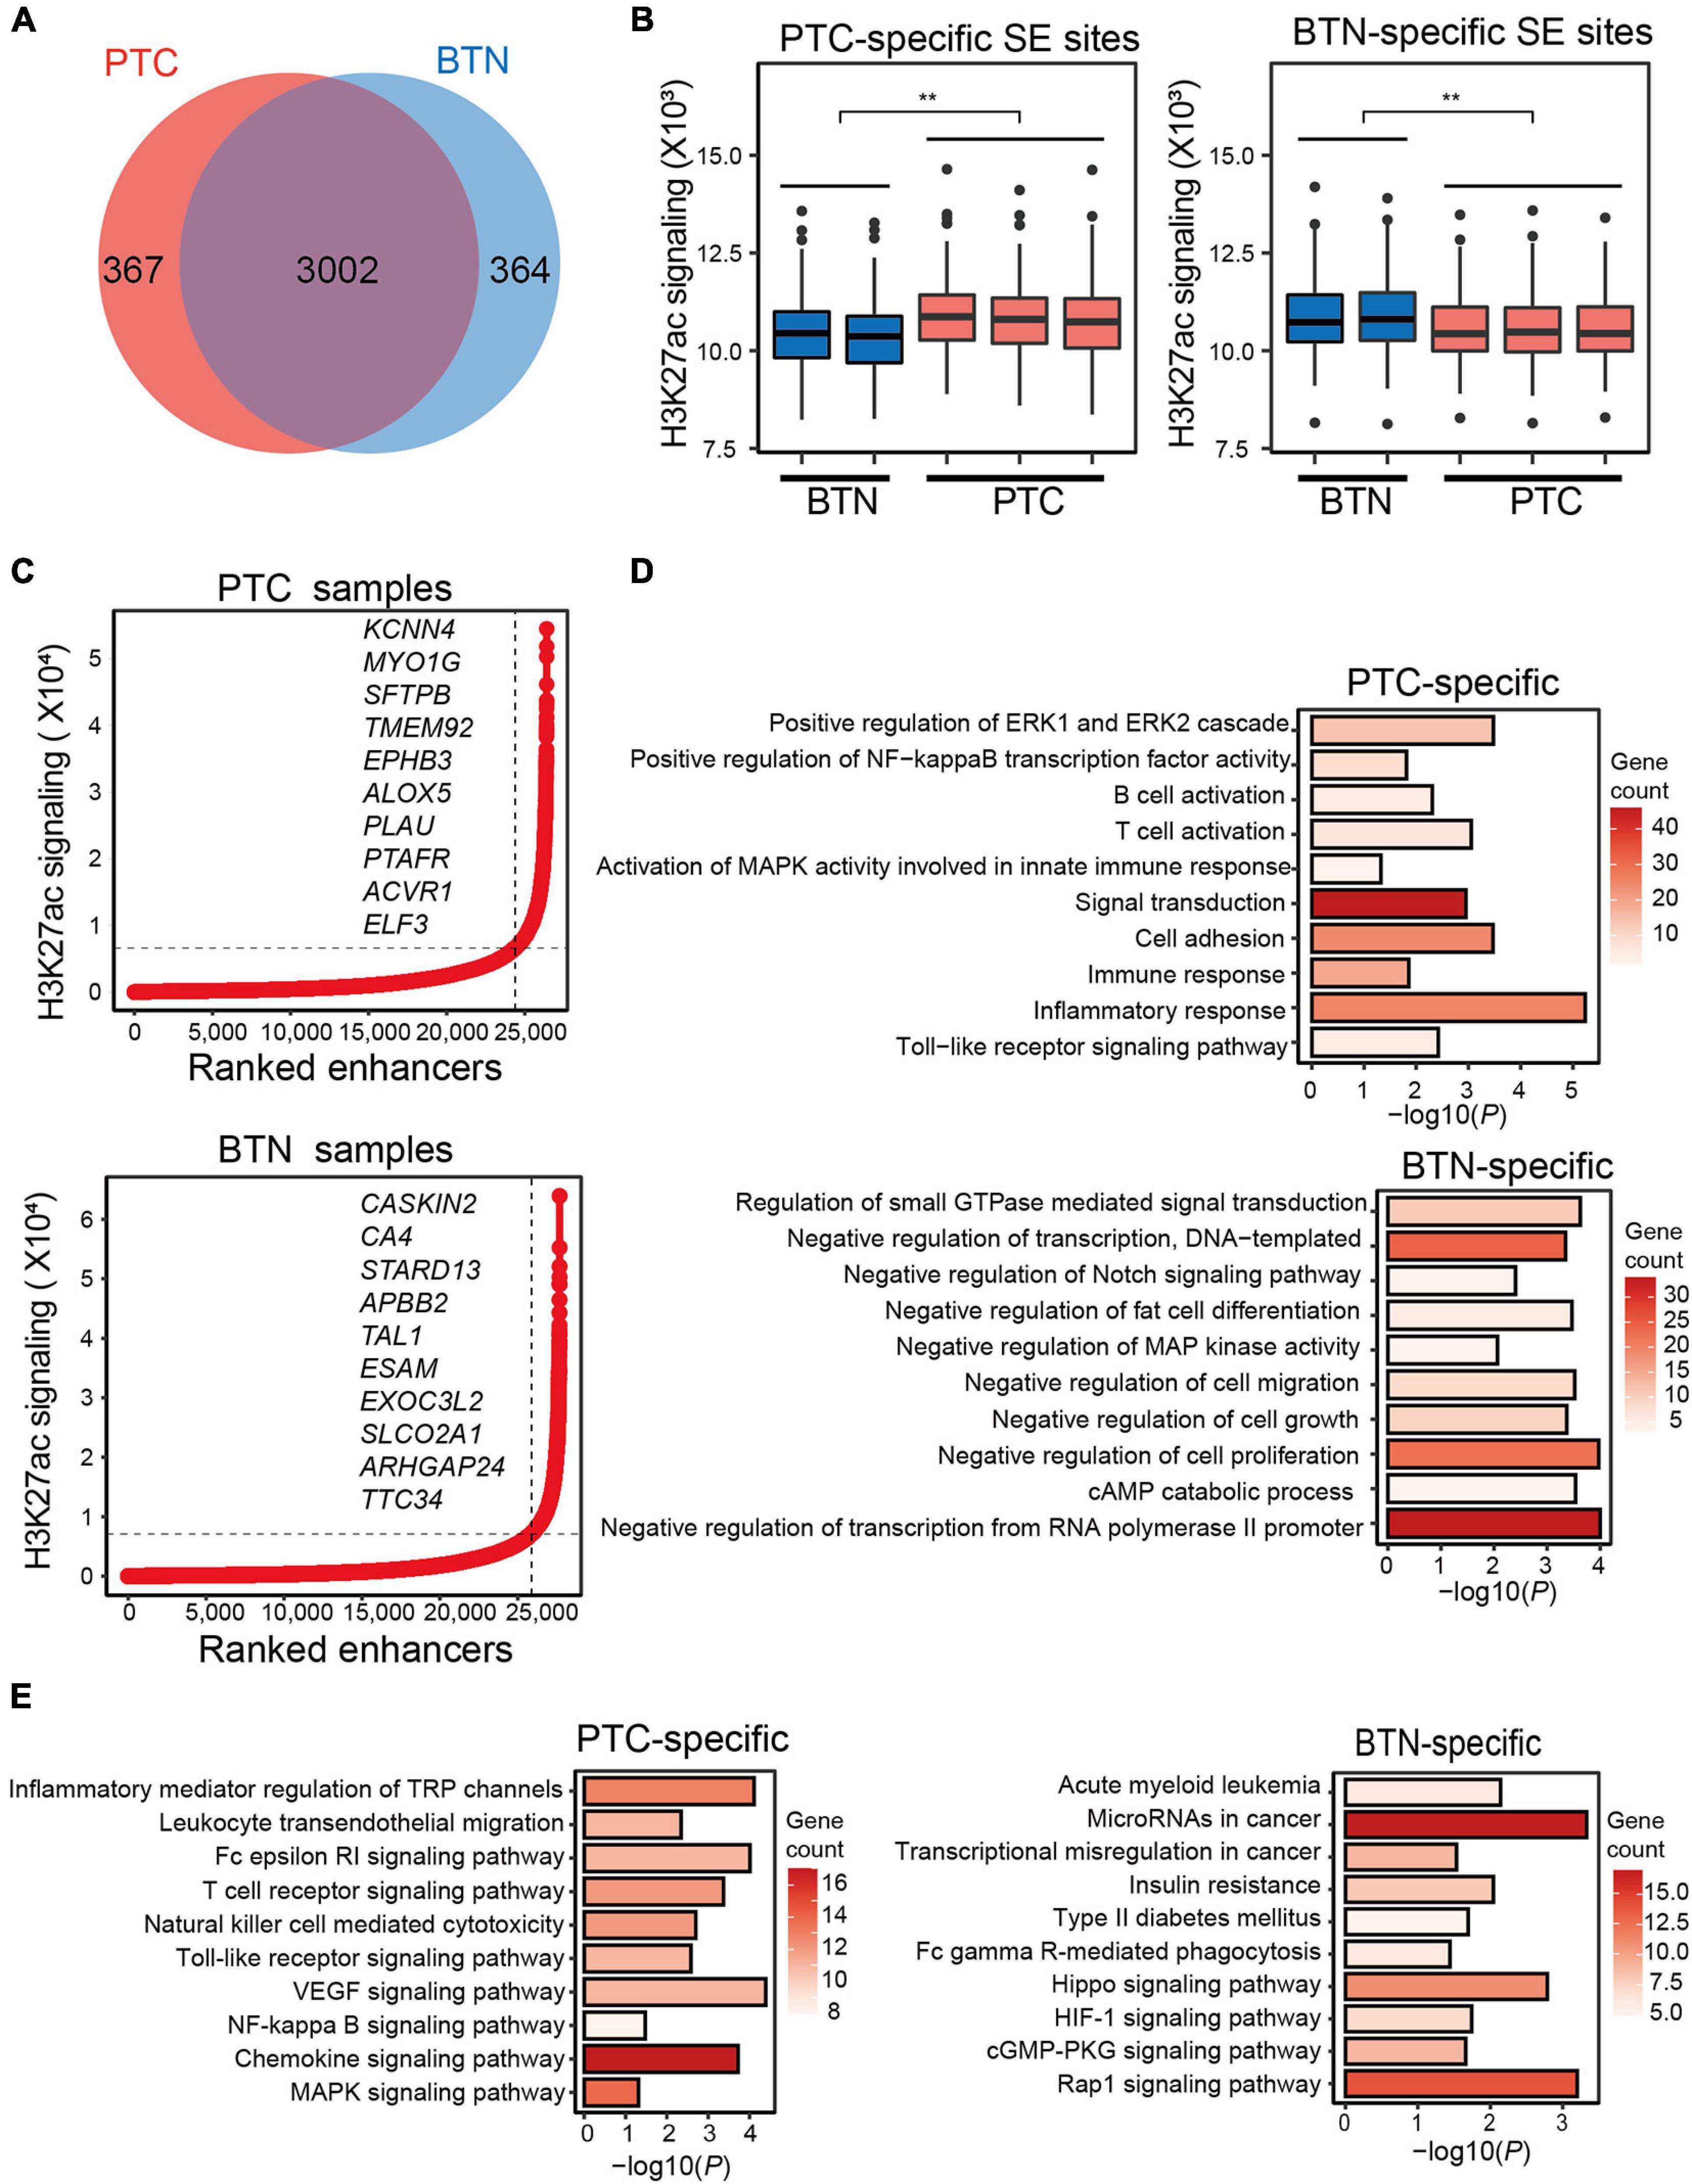
Figure 2. Characterization of super-enhancers in PTC and BTN. (A) Venn diagram showing SE numbers of PTC-specific, BTN-specific, and overlapped SEs. (B) Histotype-specific genomic SEs showed significantly different H3K27ac signaling levels at PTC-specific or BTN-specific SE genomic sites. **p < 0.01. (C) Enhancers of representative PTC and BTN sample were ranked by their H3K27ac signaling. Important genes were indicated by their ranks. (D) Bar plots showing GO terms of PTC- and BTN-specific SE-associated genes. (E) Bar plots showing KEGG pathway analysis in PTC and BTN. PTC, papillary thyroid carcinoma; BTN, benign thyroid nodule; SE, super-enhancer; GO, gene ontology; KEGG, Kyoto Encyclopedia of Genes and Genomes.
Enhancers were ranked based on their H3K27ac signals (Figure 2C). Some SE-adjacent genes in PTC were known to be involved in TC or play a part in oncogenesis, such as EPHB3, ALOX5, and ELF3. In contrast, SEs in BTN included some tumor suppressor genes, which were previously reported in various cancers, such as ARHGAP24 and CA4. SEs were assigned to their putative target genes and were then subjected to pathway enrichment analysis to determine their biological functional classifications (Supplementary Data). As is shown in GO analyses, these SE-adjacent genes of PTC uncovered some immune-related pathways such as immune cell activation and immune response, and other related pathways included positive regulation of ERK1 and ERK2 cascades, and regulation of NF-kappa B transcription factor activity. BTN-specific GO terms revealed pathways of negative regulation of transcription, cell migration, cell growth, etc. (Figure 2D). KEGG pathway analysis indicated some immune-related and cancer-related pathways in SE-adjacent genes of PTC (Figure 2E).
Global transcriptomic features were analyzed in thyroid samples, and histotype-specific patterns of gene expression for the two groups were identified. There were 2,019 differentially expressed genes specific to PTC, while 800 genes showed a higher expression in BTN (Figures 3A,B and Supplementary Data). KEGG enrichment analysis of differentiated genes revealed that genes with higher expressions in PTC were mostly enriched in immune functions such as T-cell receptor signaling pathway, chemokine signaling pathway, antigen processing, and presentation, while BTN-specific genes were over-represented in Rap1 signaling pathway, calcium signaling pathway, mineral absorption, etc. GO annotations also revealed that genes with a higher expression in PTC were mainly involved in pathways such as immune response and inflammatory response. In contrast, BTN samples had a higher expression in metabolism pathways such as oxidation-reduction process, cellular response to hypoxia, and cellular response to zinc ion (Figures 3C,D and Supplementary Data).
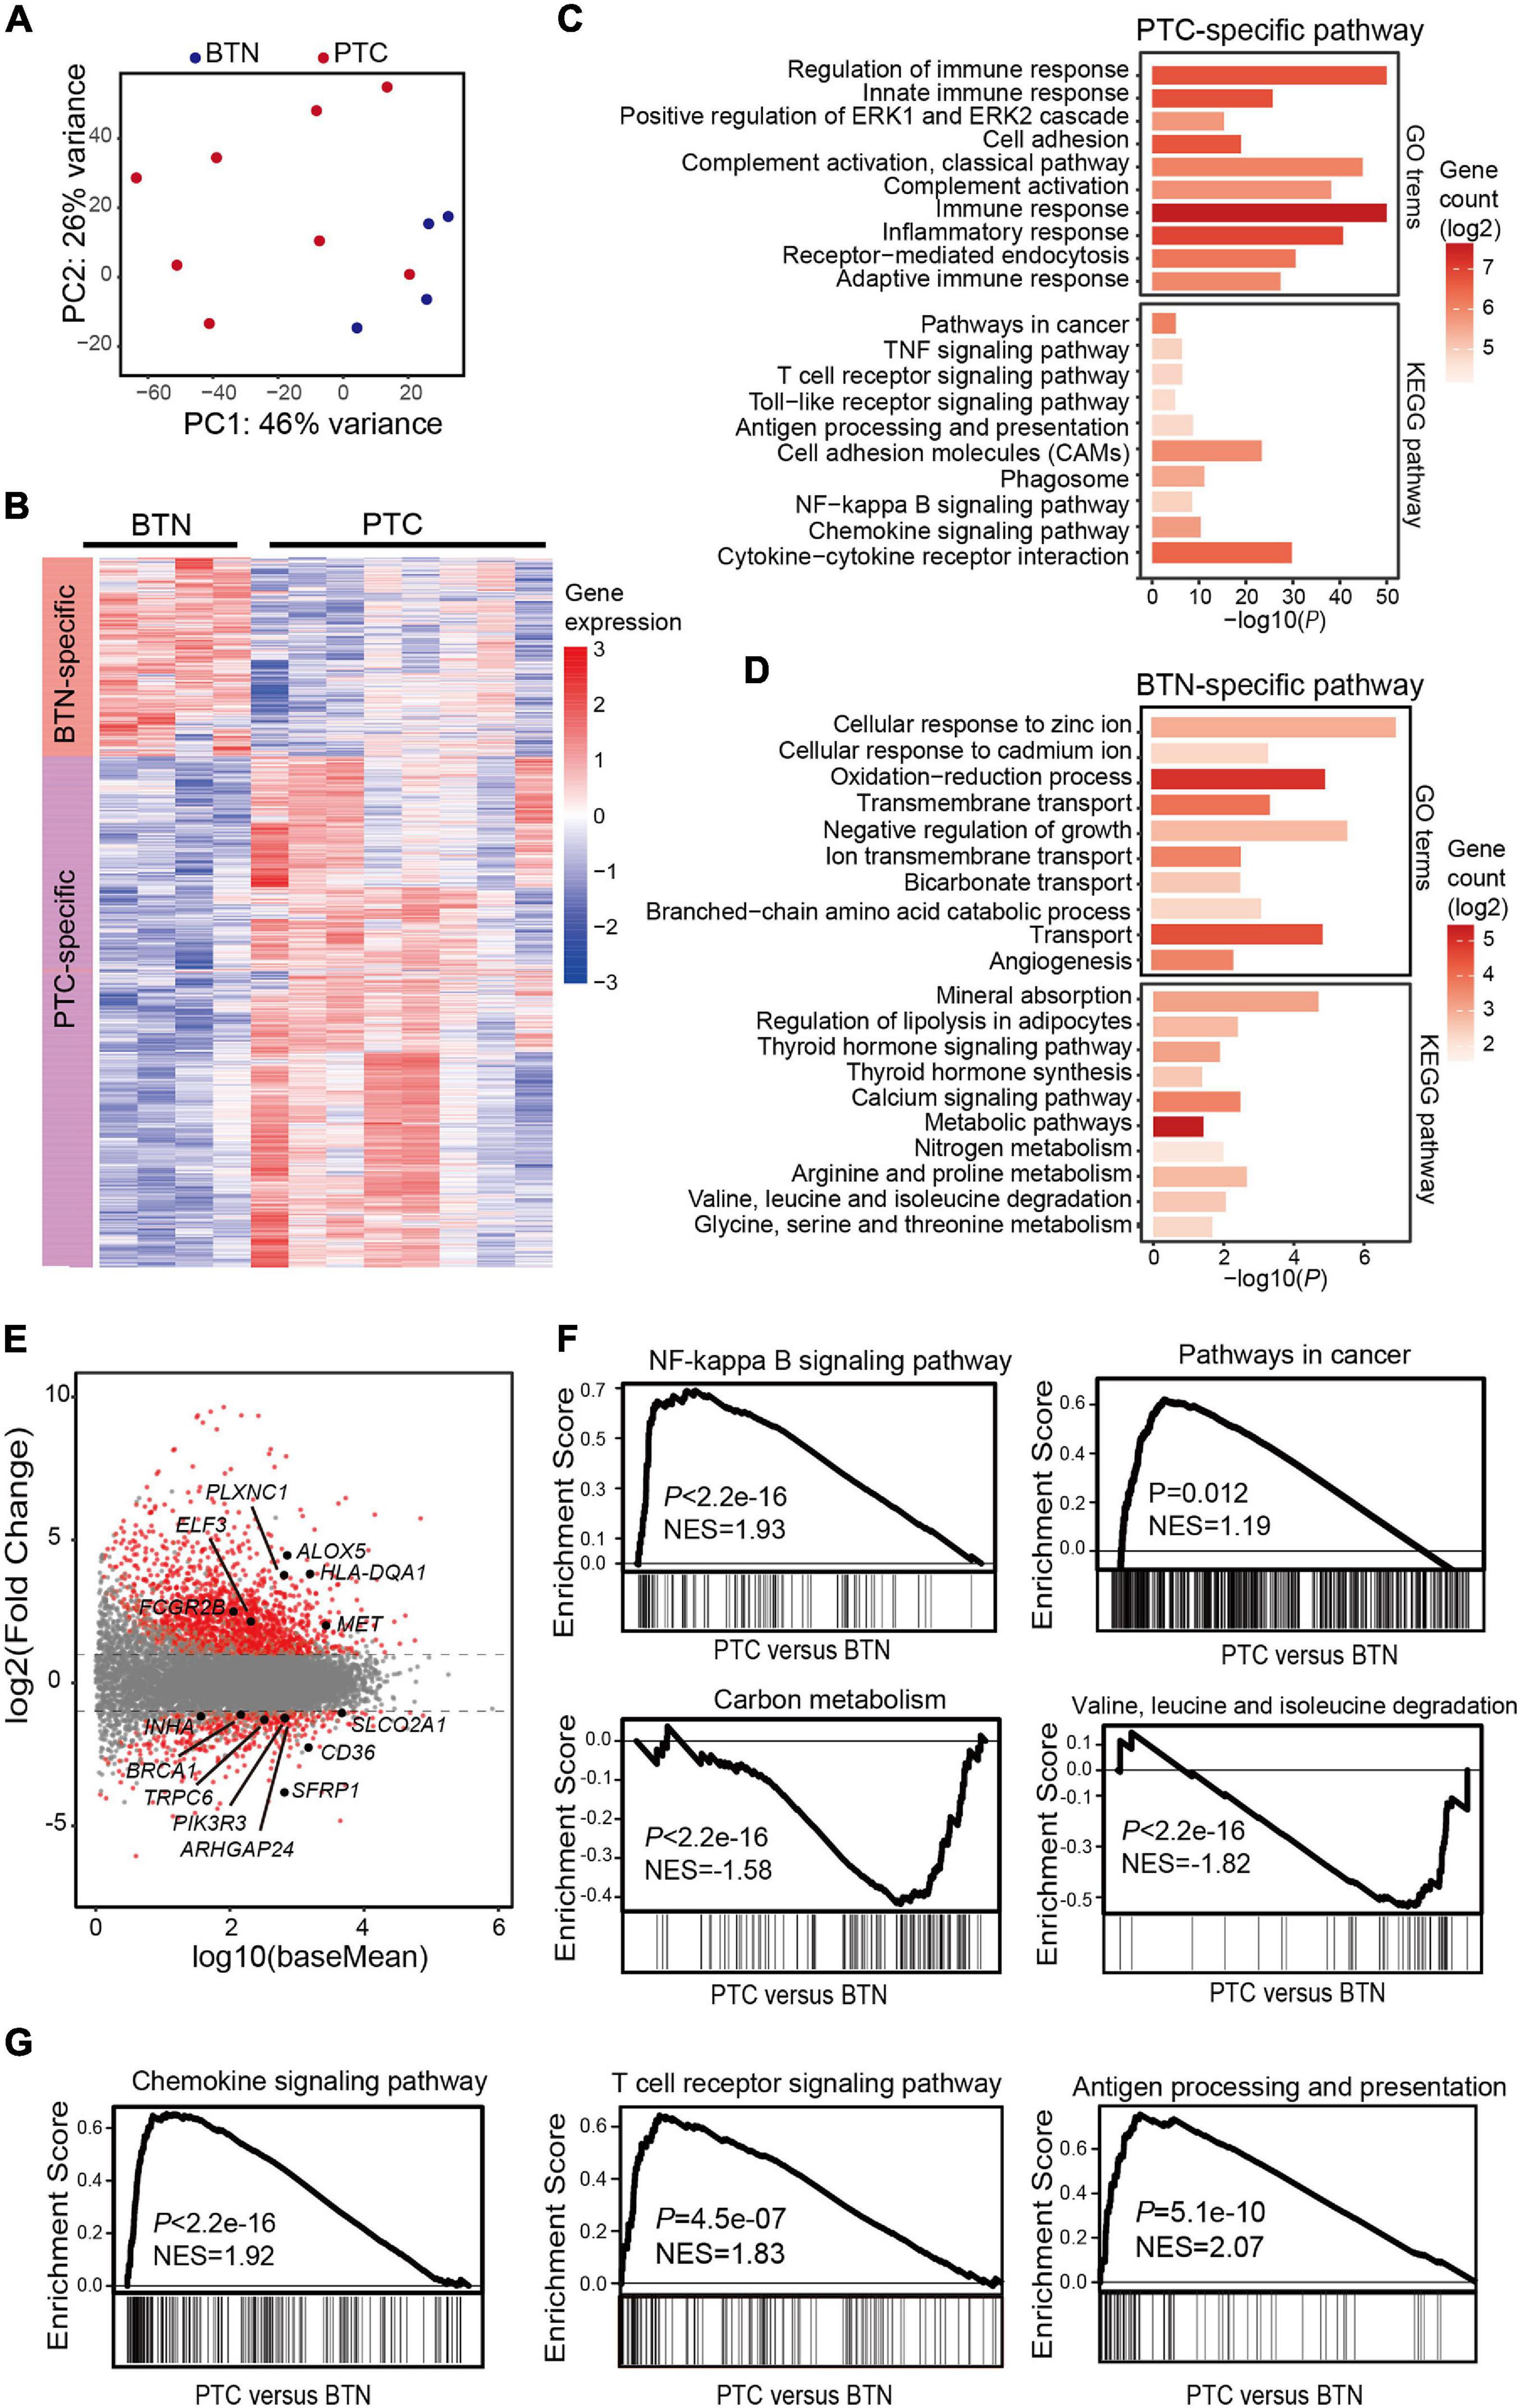
Figure 3. Transcriptome characterization of PTC and BTN tissues. (A) Principal component analysis of transcriptomes in PTC and BTN. (B) Heatmap of gene expression values in PTC and BTN. (C,D) Enrichment analysis for GO terms and KEGG pathway. Top pathways for PTC-upregulated and BTN-upregulated genes are shown. (E) MA plot for differentiated analysis of gene expression between PTC and nodule tissues. The red plots at the upper side of the line represent PTC-specific genes, while plots at the opposite side represent nodule-specific genes. (F) GSEA plots indicated cancer-related and metabolism-related genes in PTC and BTN samples. (G) GSEA plots showed PTC-upregulated genes enriched in immune-related pathways. PTC, papillary thyroid carcinoma; BTN, benign thyroid nodule; GO, gene ontology; KEGG, Kyoto Encyclopedia of Genes and Genomes; GSEA, gene set enrichment analysis.
The differentiated genes between the two groups were depicted (Figure 3E). Some known oncogenes and tumor suppressor genes were found in PTC-specific or BTN-specific genes, respectively (Figure 3E). GSEA was conducted and showed significant enrichment of PTC-specific genes in cancer-related pathways, such as NF-kappa B, while BTN-specific genes were enriched in metabolism-related pathways (Figure 3F). Besides, GSEA indicated enrichment of immune-related pathways in PTC-specific genes (Figure 3G).
The SEs were assigned to the most adjacent genes, and the expressions of SE-associated genes were higher in the histotype of interest. As exemplified in SE-associated genes in PTC (Figures 4A,C), oncogenes ALOX5 and ELF3 were more highly expressed in PTC compared with BTN tissues. Moreover, The Cancer Genome Atlas (TCGA) and Genotype-Tissue Expression (GTEx) data indicated higher levels of ALOX5 and ELF3 in TC compared with adjacent and normal thyroid tissues (Figures 4B,D). The tracks of ChIP-seq and RNA-seq signals of SLCO2A1 and ARHGAP24 were shown to present wide BTN-specific SEs (Figures 4E,G), coinciding with their higher expressions in BTN and in normal thyroid tissues compared with PTC and TC, respectively (Figures 4F,H). Notably, lower transcription level of SLCO2A1 was observed in advanced TC stages and associated with poor disease-free survival (Supplementary Figure 1).
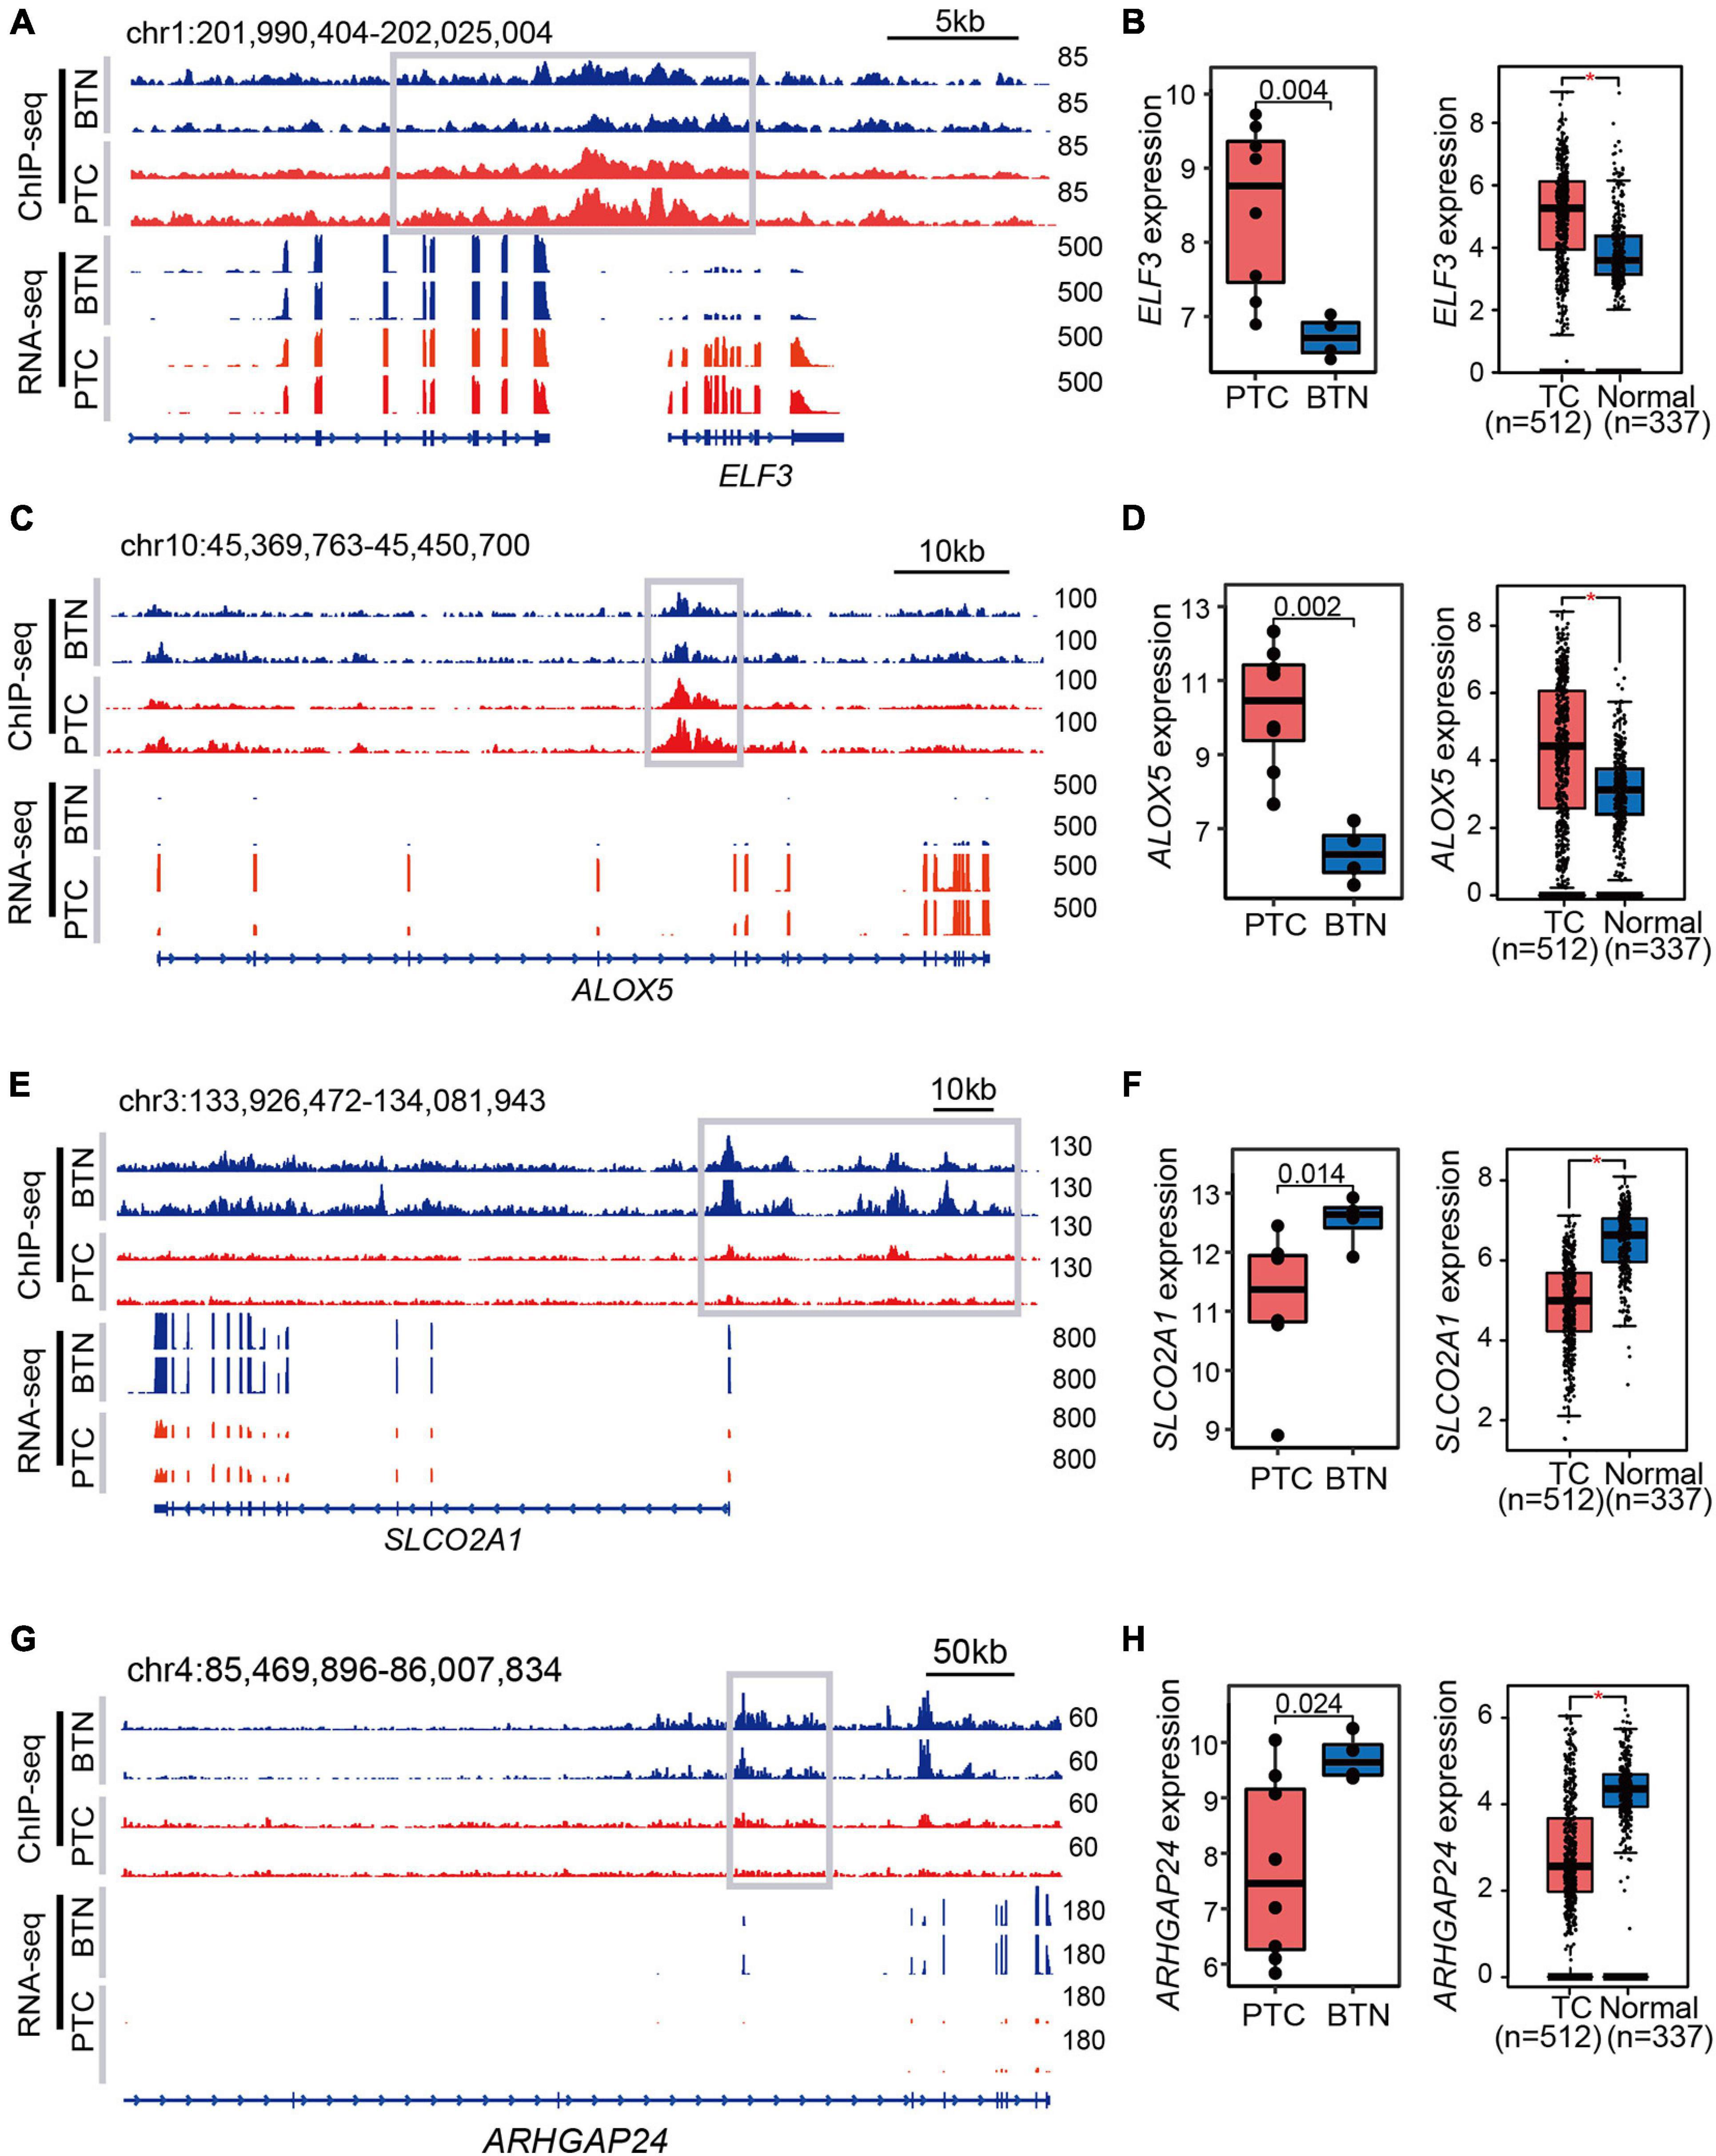
Figure 4. Examples of histotype-specific SE-associated genes. (A,C) Gene tracks of PTC-specific SEs. The adjacent genes ELF3 and ALOX5 showed strong SE peaks and RNA-seq signals in PTC tissues. (B,D) Expression profiles in PTC-specific SEs. Relative expression levels between PTC and BTN are shown in the left panel, while the right box plots indicate expression analysis of TC and normal samples from TCGA and GTEx datasets. (E,G) BTN-specific SE tracks and RNA-seq signals. (F,H) High expression levels of SLCO2A1 and ARHGAP24 in BTN tissues, and similar trends were observed in TCGA and GTEx databases. *p < 0.05. SE, super-enhancer; PTC, papillary thyroid carcinoma; BTN, benign thyroid nodule; TCGA, The Cancer Genome Atlas; GTEx, Genotype-Tissue Expression.
We integrated H3K27ac ChIP-seq and RNA-seq data to map typical enhancers and promoters to their putative targets. As shown in Figure 5A, PTC samples had stronger H3K27ac signals than BTN samples in the genome location of the PLXNC1 gene. After a comparison of active chromatin regions of PLXNC1 with an available database to infer potential enhancers, predicted enhancer–promoter associations were found (Supplementary Figure 2). The RNA-seq revealed that the PLXNC1 was expressed higher in PTC than BTN samples (Figure 5A). Consistently, a higher expression of PLXNC1 in PTC than normal controls was found when analyzing data from TCGA and GTEx samples (Figure 5B). In contrast, CD36 and TRPC6 showed significantly stronger H3K27ac signals and higher expressions in BTN than PTC (Figures 5C–F). Importantly, treatment of thyroid cancer cells with BRD4 inhibitor JQ1 significantly downregulated the expression of PLXNC1 and some PTC-specific genes, while the histone deacetylase inhibitors (HDACi) SAHA treatment induced robust increases of CD36 and TRPC6 expressions in thyroid cancer cell lines (Figure 5G and Supplementary Figure 3). Furthermore, low expression levels of CD36 and TRPC6 were observed in advanced stages of PTC (Figure 5H) and correlated with poor disease-free survival in patients with PTC (Figure 5I), suggesting that these genes are potential predictors for PTC recurrence.
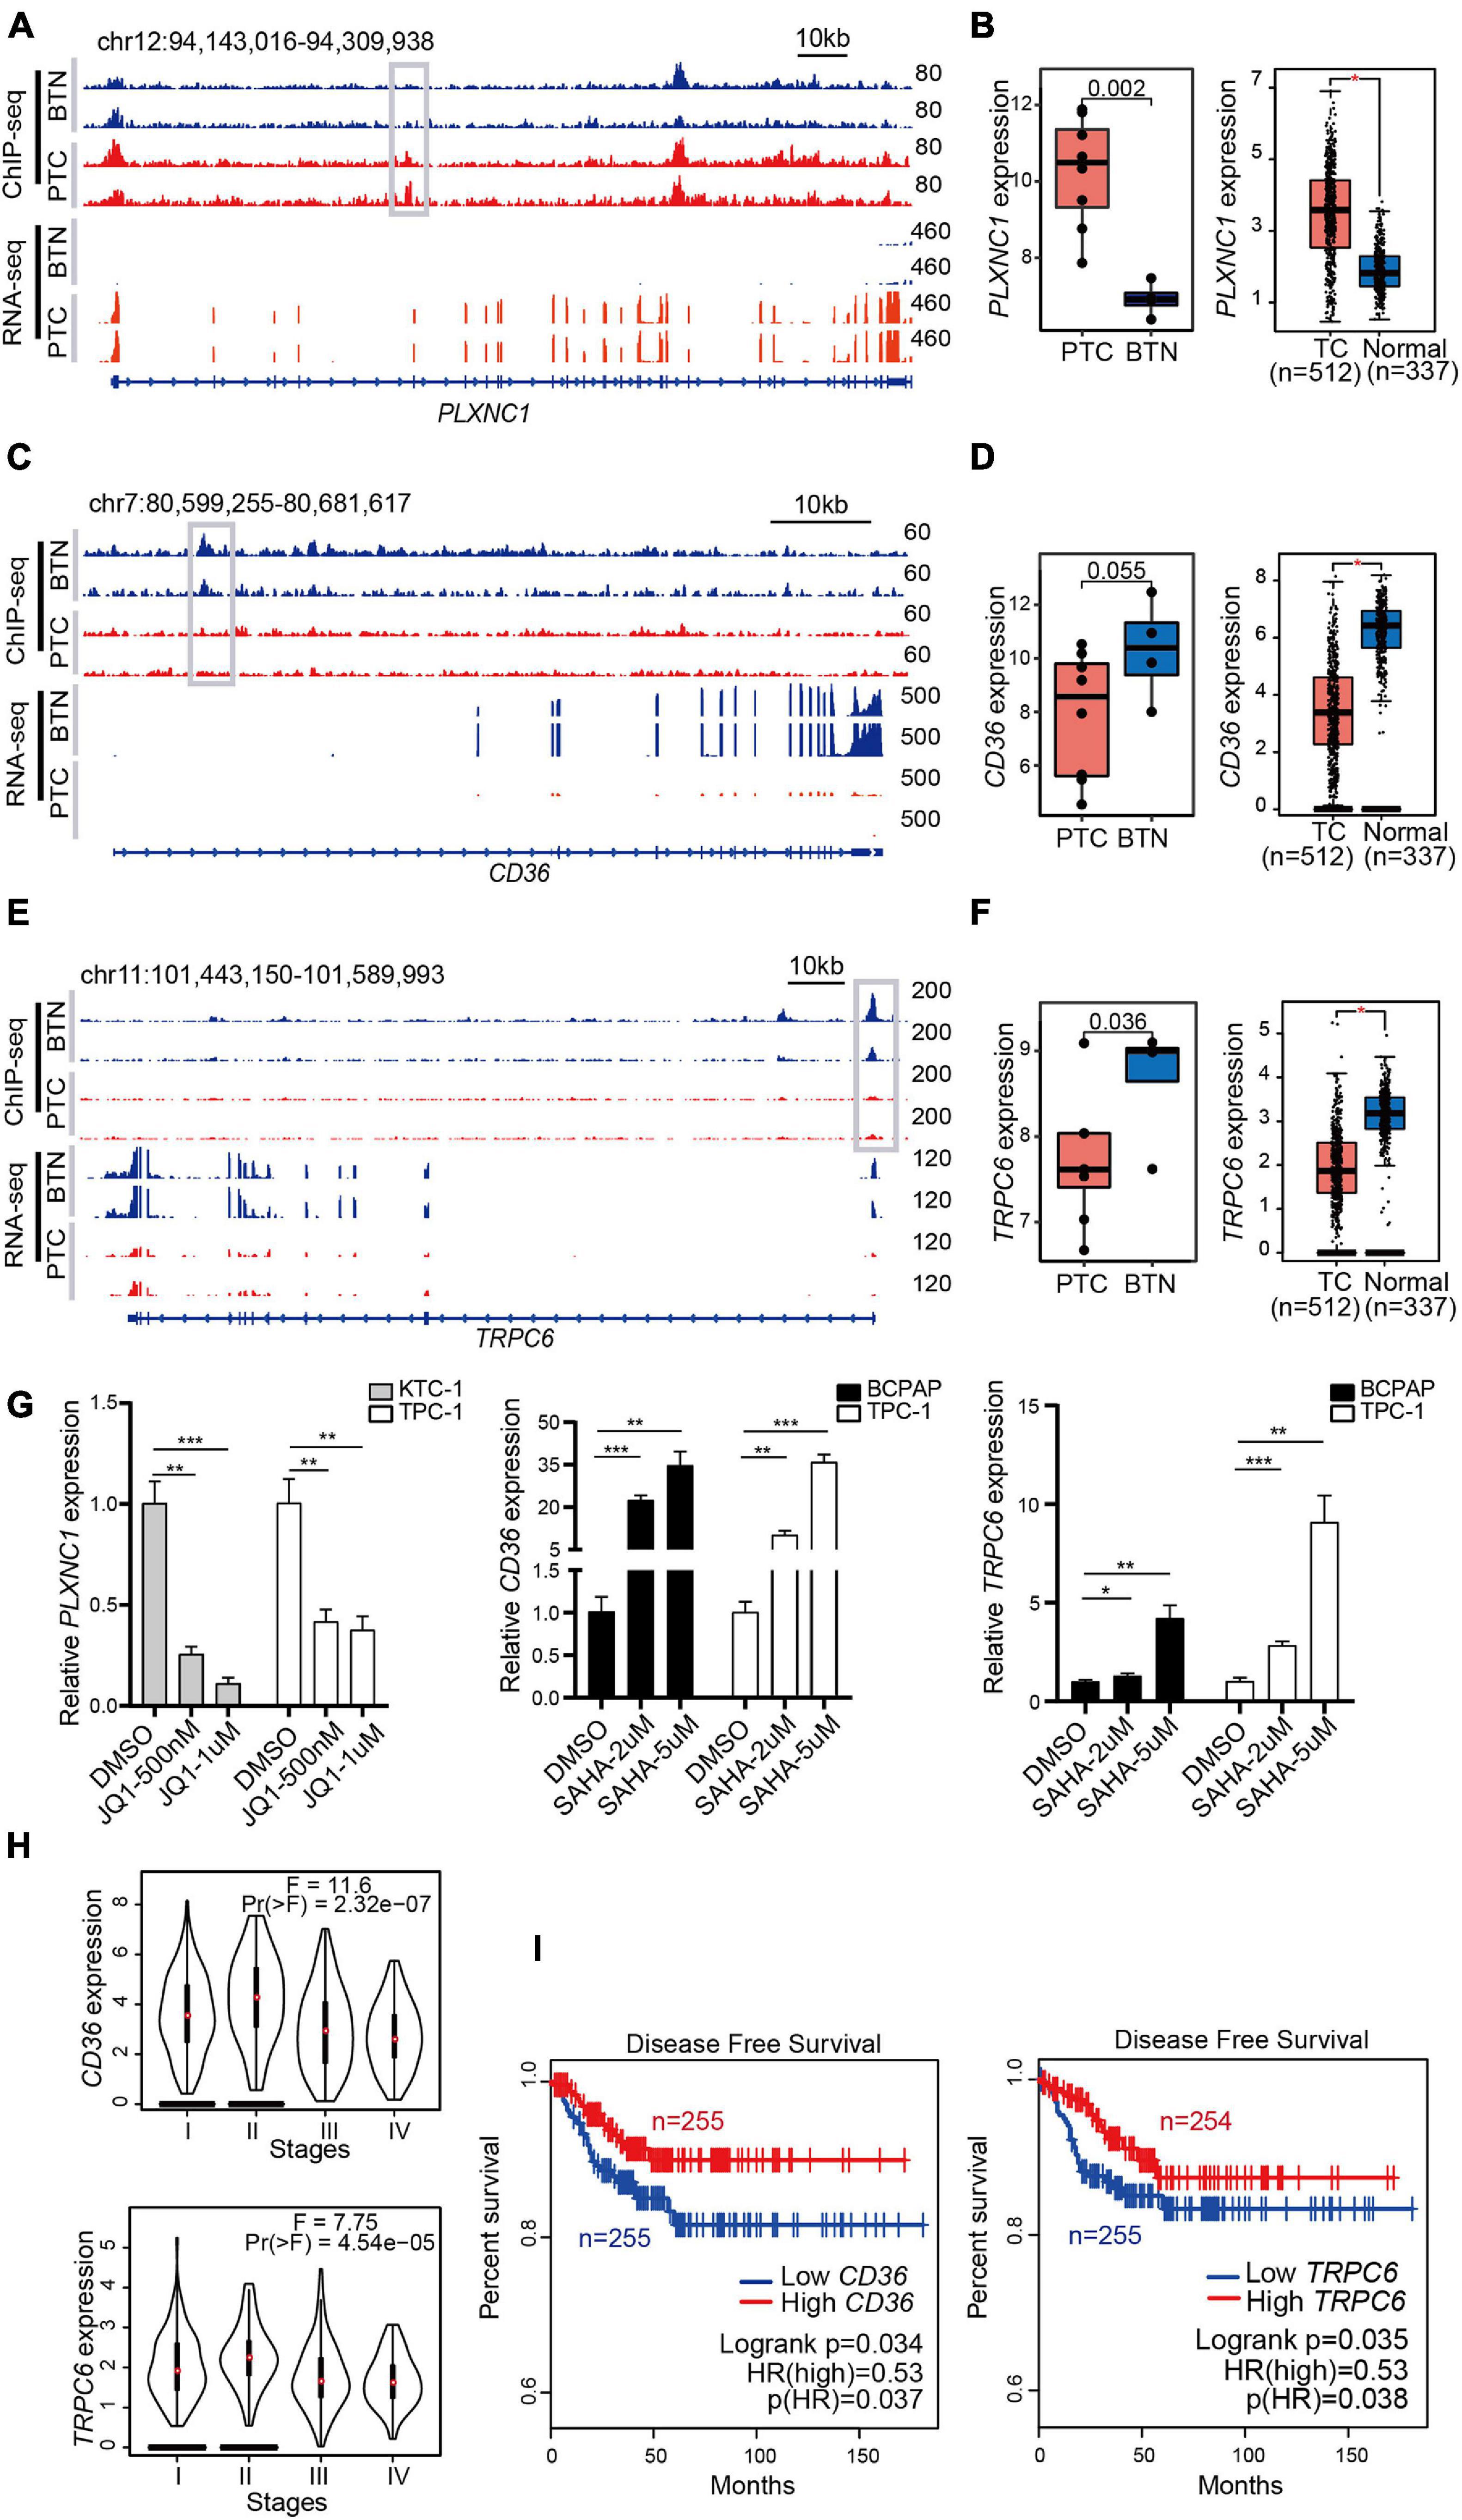
Figure 5. Identification of H3K27ac modification-related genes that are sensitive to epigenetic drugs and associated with the prognosis of PTC. (A) H3K27ac ChIP-seq signals and RNA-seq tracks of PLXNC1. (B) High expressions of PLXNC1 in PTC (left box plot), and transcriptome data from TCGA and GTEx exhibited consistent difference (right box plot). *p < 0.05. (C,E) Strong H3K27ac peaks and RNA-seq signals in CD36 and TRPC6 in BTN tissues. (D,F) Higher expressions of CD36 and TRPC6 in BTN (left box plots) and normal tissues (right box plots). *p < 0.05. (G) Treatment with JQ1 or vehicles as control at indicated concentrations for 48 h greatly reduced PLXNC1 expression levels in KTC-1 and TPC-1 cell lines. SAHA treatment induced a significant higher expression of CD36 and TRPC6 in BCPAP and TPC-1 cells. Expression analysis was normalized against GAPDH. *p < 0.05, **p < 0.01, ***p < 0.001. (H) Lower levels of CD36 and TRPC6 transcription were observed in stage III and IV in TCGA (THCA) datasets. (I) Higher levels of CD36 and TRPC6 transcription associated with higher disease-free survival rate in patients with thyroid cancers. Analysis was performed with TCGA (THCA) datasets. PTC, papillary thyroid carcinoma; TCGA, The Cancer Genome Atlas; GTEx, Genotype-Tissue Expression.
Accumulating evidence suggested that epigenome alterations greatly impact cancer development (Hamdane et al., 2019). In this study, we revealed histone modification features by comparing PTC and BTN, facilitating the knowledge of active regulatory patterns and global expression profiles in thyroid tissues. H3K27ac is an established mark of transcriptional activation. Our data presented differentiated epigenomes between PTC and BTN, with an epigenetic landscape for the PTC progression compared with BTN, and provided references for novel biomarkers for the prognosis of thyroid tumors.
It was recognized that SEs have great impact on tumor pathogenesis and cell identity (Hnisz et al., 2013). The common histone features indicated the common epigenetic modulations between PTC and BTN. Different enhancers might underline specific gene expression patterns in these two groups. In the present study, we found that PTC-specific SE-adjacent genes showed higher expression levels than those in BTN, such as ALOX5 and ELF3. ALOX5 had been reported to be highly expressed in PTC compared with normal tissues and was related to PTC tumor invasion (Kummer et al., 2012; Reyes et al., 2019). ELF3 was reported to be overexpressed with poor prognosis in PTC patients and likely function as an oncogene in TC (Chen et al., 2019). As for BTN-specific SE-adjacent genes identified in this study, SLCO2A1 was reported to be downregulated in follicular thyroid cancer than benign adenoma (Pfeifer et al., 2013), suggesting its role in thyroid tumor pathogenesis. Several studies reported ARHGAP24 as a tumor suppressor gene in various malignant tumors, including malignant lymphomas (Nishi et al., 2015), breast cancer (Saito et al., 2012), renal cancer (Wang et al., 2017), lung cancer (Wang et al., 2020), and colorectal cancer (Zhang et al., 2018). However, no study was performed on the functions of ARHGAP24 in thyroid tumors so far. Though the H3K27ac profile and TCGA database pinpointed that SLCO2A1 and ARHGAP24 could be potential predictors for PTC recurrence, their post-transcriptional modification and biological functions require further validation in PTC.
Principal component analysis of PTC and BTN showed two distinct clusters, suggesting etiology-specific epigenetic profiles in these two groups. Interestingly, pathway analysis showed that PTC-specific peaks and genes are enriched in immune-response pathways, indicating that immunoreactions might get involved in thyroid tumor pathogenesis. Whereas the H3K27ac patterns in the two histotypes could not explain all the differentiated gene expressions, one explanation could be that hypomethylation also plays a role in the upregulation of cancer-related genes (Rodríguez-Rodero et al., 2013).
The overexpression of oncogene and silencing of tumor suppressor genes caused by epigenetic modifications were usually reversible with epigenetic enzyme inhibitors. JQ1/SAHA had been assessed in numerous malignancies including TC in clinical trials, and previous studies showed their anti-tumorigenesis functions in TC (Tan et al., 2010). SAHA inhibits deacetylase enzymatic activity. BRD4 inhibitor JQ1 could induce cell growth arrest and apoptosis. The expression levels of certain genes altered following treatment of JQ1 and SAHA, indicating that these drugs might inhibit tumor growth by regulating the expression of some key genes. PLXNC1 is reported as an oncogene in liver carcinoma (Odabas et al., 2018) and gastric cancer (Chen et al., 2020) and also played a part in TC progression. MiR-4500 repressed PTC development by decreasing PLXNC1 expression (Li et al., 2019). Besides, it was found that PLXNC1 was highly expressed in TC (Chen et al., 2013), and the expression level was higher in PTC tissues compared with their paired normal tissues (Qu et al., 2016). Among the genes regulated by SAHA, CD36 low expression was associated with higher metastasis grade and poor prognosis in colon, breast, and ovarian cancers (Tanase et al., 2020) and pancreatic ductal adenocarcinoma (Jia et al., 2018). TRPC6 is an important member of the transient receptor potential channels superfamily, participating in the various biological processes (Dietrich and Gudermann, 2014; Jardin et al., 2020). Though it remained unclear if these genes were sufficient to promote or inhibit PTC pathogenesis, their higher transcription levels were related to favorable disease-free rate in TC. Our results suggested the potential roles of these genes in PTC, and their molecular and biological functions warrant further investigation.
While it remained to be elucidated whether epigenetic dysregulation precedes the tumorigenesis, the different histone modification and expression levels in PTC and BTN provided evidence that histone modifications differed in disease states. Though heterogeneity existed in these samples, the results obtained from clustering and statistical algorithm along with supporting evidence from population database and previous biological studies allowed arresting conclusions.
In summary, our results presented different epigenomic features of PTC and BTN, and dysregulation of enhancers and their targeted genes provide new insights into the pathogenesis and development of PTC. Some enhancer-regulated genes were associated with disease-free survival of PTC, which may hold potential as markers for the prognosis of the disease.
The original contributions presented in the study are publicly available. This data can be found here: Genome Sequence Archive in National Genomics Data Center, China National Center for Bioinformation/Beijing Institute of Genomics, Chinese Academy of Sciences, under accession number HRA000779.
The studies involving human participants were reviewed and approved by the Institutional Ethics Committee of The First Affiliated Hospital of Sun Yat-sen University. The ethics committee waived the requirement of written informed consent for participation.
HX, QZ, RL, and ZT designed the study. WL, JL, YaL, YLi, SH, and SY collected the tissue samples and clinical information. LZ, QL, YLu, XX, and YS performed the experiments. LZ, DX, ZT, YT, XX, RL, and QZ analyzed the data. LZ and DX drafted the manuscript. All authors contributed to the manuscript revision and approved the final version of the manuscript.
This study was supported by the National Natural Science Foundation of China (Nos. 81772850, 82072982, and 82072952) and the Guangzhou Science and Technology Project (No. 201803010057).
The authors declare that the research was conducted in the absence of any commercial or financial relationships that could be construed as a potential conflict of interest.
The Supplementary Material for this article can be found online at: https://www.frontiersin.org/articles/10.3389/fcell.2021.682561/full#supplementary-material
Bártová, E., Krejcí, J., Harnicarová, A., Galiová, G., and Kozubek, S. (2008). Histone modifications and nuclear architecture: a review. J. Histochem. Cytochem. 56, 711–721. doi: 10.1369/jhc.2008.951251
Brest, P., Lassalle, S., Hofman, V., Bordone, O., Gavric, T. V., Bonnetaud, C., et al. (2011). MiR-129-5p is required for histone deacetylase inhibitor-induced cell death in thyroid cancer cells. Endocr. Relat. Cancer 18, 711–719. doi: 10.1530/ERC-10-0257
Bulger, M., and Groudine, M. (2011). Functional and mechanistic diversity of distal transcription enhancers. Cell 144, 327–339. doi: 10.1016/j.cell.2011.01.024
Chen, H., Chen, W., Zhang, X., Hu, L., Tang, G., Kong, J., et al. (2019). E26 transformation (ETS)-specific related transcription factor-3 (ELF3) orchestrates a positive feedback loop that constitutively activates the MAPK/Erk pathway to drive thyroid cancer. Oncol. Rep. 41, 570–578. doi: 10.3892/or.2018.6807
Chen, J., Liu, H., Chen, J., Sun, B., Wu, J., and Du, C. (2020). PLXNC1 enhances carcinogenesis through transcriptional activation of IL6ST in gastric cancer. Front. Oncol. 10:33. doi: 10.3389/fonc.2020.00033
Chen, Y., Soong, J., Mohanty, S., Xu, L., and Scott, G. (2013). The neural guidance receptor Plexin C1 delays melanoma progression. Oncogene 32, 4941–4949. doi: 10.1038/onc.2012.511
Dey, A., Chitsaz, F., Abbasi, A., Misteli, T., and Ozato, K. (2003). The double bromodomain protein Brd4 binds to acetylated chromatin during interphase and mitosis. Proc. Natl. Acad. Sci. U.S.A. 100, 8758–8763. doi: 10.1073/pnas.1433065100
Dietrich, A., and Gudermann, T. (2014). TRPC6: physiological function and pathophysiological relevance. Handb. Exp. Pharmacol. 222, 157–188. doi: 10.1007/978-3-642-54215-2_7
Federico, A., Pallante, P., Bianco, M., Ferraro, A., Esposito, F., Monti, M., et al. (2009). Chromobox protein homologue 7 protein, with decreased expression in human carcinomas, positively regulates E-cadherin expression by interacting with the histone deacetylase 2 protein. Cancer Res. 69, 7079–7087. doi: 10.1158/0008-5472.CAN-09-1542
Filippakopoulos, P., Qi, J., Picaud, S., Shen, Y., Smith, W. B., Fedorov, O., et al. (2010). Selective inhibition of BET bromodomains. Nature 468, 1067–1073. doi: 10.1038/nature09504
Gao, X., Wu, X., Zhang, X., Hua, W., Zhang, Y., Maimaiti, Y., et al. (2016). Inhibition of BRD4 suppresses tumor growth and enhances iodine uptake in thyroid cancer. Biochem. Biophys. Res. Commun. 469, 679–685. doi: 10.1016/j.bbrc.2015.12.008
Hamdane, N., Jühling, F., Crouchet, E., El, S. H., Thumann, C., Oudot, M. A., et al. (2019). HCV-Induced epigenetic changes associated with liver cancer risk persist after sustained virologic response. Gastroenterology 156, 2313–2329. doi: 10.1053/j.gastro.2019.02.038
Hnisz, D., Abraham, B. J., Lee, T. I., Lau, A., Saint-André, V., Sigova, A. A., et al. (2013). Super-enhancers in the control of cell identity and disease. Cell 155, 934–947. doi: 10.1016/j.cell.2013.09.053
Jardin, I., Nieto, J., Salido, G. M., and Rosado, J. A. (2020). TRPC6 channel and its implications in breast cancer: an overview. Biochim. Biophys. Acta Mol. Cell Res. 1867:118828. doi: 10.1016/j.bbamcr.2020.118828
Jemal, A., Siegel, R., Xu, J., and Ward, E. (2010). Cancer statistics, 2010. CA Cancer J. Clin. 60, 277–300. doi: 10.3322/caac.20073
Jia, S., Zhou, L., Shen, T., Zhou, S., Ding, G., and Cao, L. (2018). Down-expression of CD36 in pancreatic adenocarcinoma and its correlation with clinicopathological features and prognosis. J. Cancer 9, 578–583. doi: 10.7150/jca.21046
Kilfoy, B. A., Zheng, T., Holford, T. R., Han, X., Ward, M. H., Sjodin, A., et al. (2009). International patterns and trends in thyroid cancer incidence, 1973-2002. Cancer Causes Control 20, 525–531. doi: 10.1007/s10552-008-9260-4
Kummer, N. T., Nowicki, T. S., Azzi, J. P., Reyes, I., Iacob, C., Xie, S., et al. (2012). Arachidonate 5 lipoxygenase expression in papillary thyroid carcinoma promotes invasion via MMP-9 induction. J. Cell. Biochem. 113, 1998–2008. doi: 10.1002/jcb.24069
Li, R., Teng, X., Zhu, H., Han, T., and Liu, Q. (2019). MiR-4500 regulates PLXNC1 and inhibits papillary thyroid cancer progression. Horm Cancer 10, 150–160. doi: 10.1007/s12672-019-00366-1
Liao, Y., Wang, J., Jaehnig, E. J., Shi, Z., and Zhang, B. (2019). WebGestalt 2019: gene set analysis toolkit with revamped UIs and APIs. Nucleic Acids Res. 47, W199–W205. doi: 10.1093/nar/gkz401
Liu, R., Bishop, J., Zhu, G., Zhang, T., Ladenson, P. W., and Xing, M. (2017). Mortality risk stratification by combining BRAF V600E and TERT promoter mutations in papillary thyroid cancer: genetic duet of BRAF and TERT promoter mutations in thyroid cancer mortality. JAMA Oncol. 3, 202–208. doi: 10.1001/jamaoncol.2016.3288
Liu, T. (2014). Use model-based Analysis of ChIP-Seq (MACS) to analyze short reads generated by sequencing protein-DNA interactions in embryonic stem cells. Methods Mol. Biol. 1150, 81–95. doi: 10.1007/978-1-4939-0512-6_4
Matsuda, S., Furuya, K., Ikura, M., Matsuda, T., and Ikura, T. (2015). Absolute quantification of acetylation and phosphorylation of the histone variant H2AX upon ionizing radiation reveals distinct cellular responses in two cancer cell lines. Radiat. Environ. Biophys. 54, 403–411. doi: 10.1007/s00411-015-0608-3
McLean, C. Y., Bristor, D., Hiller, M., Clarke, S. L., Schaar, B. T., Lowe, C. B., et al. (2010). GREAT improves functional interpretation of cis-regulatory regions. Nat. Biotechnol. 28, 495–501. doi: 10.1038/nbt.1630
Nishi, T., Takahashi, H., Hashimura, M., Yoshida, T., Ohta, Y., and Saegusa, M. (2015). FilGAP, a Rac-specific Rho GTPase-activating protein, is a novel prognostic factor for follicular lymphoma. Cancer Med. 4, 808–818. doi: 10.1002/cam4.423
Odabas, G., Cetin, M., Turhal, S., Baloglu, H., Sayan, A. E., and Yagci, T. (2018). Plexin c1 marks liver cancer cells with epithelial phenotype and is overexpressed in hepatocellular carcinoma. Can. J. Gastroenterol. Hepatol. 2018:4040787. doi: 10.1155/2018/4040787
Pfeifer, A., Wojtas, B., Oczko-Wojciechowska, M., Kukulska, A., Czarniecka, A., Eszlinger, M., et al. (2013). Molecular differential diagnosis of follicular thyroid carcinoma and adenoma based on gene expression profiling by using formalin-fixed paraffin-embedded tissues. BMC Med. Genomics 6:38. doi: 10.1186/1755-8794-6-38
Qu, T., Li, Y. P., Li, X. H., and Chen, Y. (2016). Identification of potential biomarkers and drugs for papillary thyroid cancer based on gene expression profile analysis. Mol. Med. Rep. 14, 5041–5048. doi: 10.3892/mmr.2016.5855
Reyes, I., Reyes, N., Suriano, R., Iacob, C., Suslina, N., Policastro, A., et al. (2019). Gene expression profiling identifies potential molecular markers of papillary thyroid carcinoma. Cancer Biomark. 24, 71–83. doi: 10.3233/CBM-181758
Rodríguez-Rodero, S., Fernández, A. F., Fernández-Morera, J. L., Castro-Santos, P., Bayon, G. F., Ferrero, C., et al. (2013). DNA methylation signatures identify biologically distinct thyroid cancer subtypes. J. Clin. Endocrinol. Metab. 98, 2811–2821. doi: 10.1210/jc.2012-3566
Saito, K., Ozawa, Y., Hibino, K., and Ohta, Y. (2012). FilGAP, a Rho/Rho-associated protein kinase-regulated GTPase-activating protein for Rac, controls tumor cell migration. Mol. Biol. Cell. 23, 4739–4750. doi: 10.1091/mbc.E12-04-0310
Siu, C., Wiseman, S., Gakkhar, S., Heravi-Moussavi, A., Bilenky, M., Carles, A., et al. (2017). Characterization of the human thyroid epigenome. J. Endocrinol. 235, 153–165. doi: 10.1530/JOE-17-0145
Tan, J., Cang, S., Ma, Y., Petrillo, R. L., and Liu, D. (2010). Novel histone deacetylase inhibitors in clinical trials as anti-cancer agents. J. Hematol. Oncol. 3:5. doi: 10.1186/1756-8722-3-5
Tanase, C., Gheorghisan-Galateanu, A. A., Popescu, I. D., Mihai, S., Codrici, E., Albulescu, R., et al. (2020). CD36 and CD97 in pancreatic cancer versus other malignancies. Int. J. Mol. Sci. 21:5656. doi: 10.3390/ijms21165656
Wang, L., Shen, S., Xiao, H., Ding, F., Wang, M., Li, G., et al. (2020). ARHGAP24 inhibits cell proliferation and cell cycle progression and induces apoptosis of lung cancer via a STAT6-WWP2-p27 axis. Carcinogenesis 41, 711–721. doi: 10.1093/carcin/bgz144
Wang, L., Wei, W. Q., Wu, Z. Y., and Wang, G. C. (2017). MicroRNA-590-5p regulates cell viability, apoptosis, migration and invasion of renal cell carcinoma cell lines through targeting ARHGAP24. Mol. Biosyst. 13, 2564–2573. doi: 10.1039/c7mb00406k
Whyte, W. A., Orlando, D. A., Hnisz, D., Abraham, B. J., Lin, C. Y., Kagey, M. H., et al. (2013). Master transcription factors and mediator establish super-enhancers at key cell identity genes. Cell 153, 307–319. doi: 10.1016/j.cell.2013.03.035
Yim, J. H., Choi, A. H., Li, A. X., Qin, H., Chang, S., Tong, S. T., et al. (2019). Identification of Tissue-Specific DNA methylation signatures for thyroid nodule diagnostics. Clin. Cancer Res. 25, 544–551. doi: 10.1158/1078-0432.CCR-18-0841
Yu, S., Liu, Y., Wang, J., Guo, Z., Zhang, Q., Yu, F., et al. (2012). Circulating microRNA profiles as potential biomarkers for diagnosis of papillary thyroid carcinoma. J. Clin. Endocrinol. Metab. 97, 2084–2092. doi: 10.1210/jc.2011-3059
Zhang, S., Sui, L., Zhuang, J., He, S., Song, Y., Ye, Y., et al. (2018). ARHGAP24 regulates cell ability and apoptosis of colorectal cancer cells via the regulation of P53. Oncol. Lett. 16, 3517–3524. doi: 10.3892/ol.2018.9075
Zhang, Z., Liu, D., Murugan, A. K., Liu, Z., and Xing, M. (2014). Histone deacetylation of NIS promoter underlies BRAF V600E-promoted NIS silencing in thyroid cancer. Endocr. Relat. Cancer 21, 161–173. doi: 10.1530/ERC-13-0399
Zhou, H., Schmidt, S. C., Jiang, S., Willox, B., Bernhardt, K., Liang, J., et al. (2015). Epstein-Barr virus oncoprotein super-enhancers control B cell growth. Cell Host Microbe 17, 205–216. doi: 10.1016/j.chom.2014.12.013
Keywords: papillary thyroid carcinoma, benign thyroid nodule, enhancer, H3K27ac, transcriptome, epigenetics
Citation: Zhang L, Xiong D, Liu Q, Luo Y, Tian Y, Xiao X, Sang Y, Liu Y, Hong S, Yu S, Li J, Lv W, Li Y, Tang Z, Liu R, Zhong Q and Xiao H (2021) Genome-Wide Histone H3K27 Acetylation Profiling Identified Genes Correlated With Prognosis in Papillary Thyroid Carcinoma. Front. Cell Dev. Biol. 9:682561. doi: 10.3389/fcell.2021.682561
Received: 18 March 2021; Accepted: 14 May 2021;
Published: 11 June 2021.
Edited by:
Xiao Zhu, Guangdong Medical University, ChinaReviewed by:
Yanqiang Li, Boston Children’s Hospital and Harvard Medical School, United StatesCopyright © 2021 Zhang, Xiong, Liu, Luo, Tian, Xiao, Sang, Liu, Hong, Yu, Li, Lv, Li, Tang, Liu, Zhong and Xiao. This is an open-access article distributed under the terms of the Creative Commons Attribution License (CC BY). The use, distribution or reproduction in other forums is permitted, provided the original author(s) and the copyright owner(s) are credited and that the original publication in this journal is cited, in accordance with accepted academic practice. No use, distribution or reproduction is permitted which does not comply with these terms.
*Correspondence: Haipeng Xiao, eGlhb2hwQG1haWwuc3lzdS5lZHUuY24=; Qian Zhong, emhvbmdxaWFuQHN5c3VjYy5vcmcuY24=; Rengyun Liu, bGl1cnk5QG1haWwuc3lzdS5lZHUuY24=
†These authors have contributed equally to this work
Disclaimer: All claims expressed in this article are solely those of the authors and do not necessarily represent those of their affiliated organizations, or those of the publisher, the editors and the reviewers. Any product that may be evaluated in this article or claim that may be made by its manufacturer is not guaranteed or endorsed by the publisher.
Research integrity at Frontiers
Learn more about the work of our research integrity team to safeguard the quality of each article we publish.