 Lucie Crouzier1
 Camille Diez1
 Elodie M. Richard1Nicolas Cubedo1Clément Barbereau1
 Mireille Rossel1Thomas Delaunay2
 Tangui Maurice1
 Benjamin Delprat1*
- 1MMDN, Univ Montpellier, EPHE, INSERM, Montpellier, France
- 2IES, Univ Montpellier, CNRS, Montpellier, France
Retinitis pigmentosa (RP) is one of the most common forms of inherited retinal degeneration with 1/4,000 people being affected. The vision alteration primarily begins with rod photoreceptor degeneration, then the degenerative process continues with cone photoreceptor death. Variants in 71 genes have been linked to RP. One of these genes, PDE6a is responsible for RP43. To date no treatment is available and patients suffer from pronounced visual impairment in early childhood. We used the novel zebrafish pde6aQ70X mutant, generated by N-ethyl-N-nitrosourea at the European Zebrafish Resource Centre, to better understand how PDE6a loss of function leads to photoreceptor alteration. Interestingly, zebrafish pde6aQ70X mutants exhibited impaired visual function at 5 dpf as evidenced by the decrease in their visual motor response (VMR) compared to pde6aWT larvae. This impaired visual function progressed with time and was more severe at 21 dpf. These modifications were associated with an alteration of rod outer segment length at 5 and 21 dpf. In summary, these findings suggest that rod outer segment shrinkage due to Pde6a deficiency begins very early in zebrafish, progresses with time. The zebrafish pde6aQ70X mutant represents an ideal model of RP to screen relevant active small molecules that will block the progression of the disease.
Introduction
Ocular diseases, such as photoreceptor dystrophy, retinitis pigmentosa (RP), glaucoma, cataract or corneal dystrophy, lead to visual impairment. The degeneration of photoreceptors is one of the most common causes of hereditary blindness. In vertebrates, there are two classes of photoreceptors: the rods, responsible for dark vision, and the cones, responding to a bright light and giving colors vision (Fu, 1995; Kawamura and Tachibanaki, 2008). RP can be inherited in an autosomal recessive, dominant and X-linked manner. RP is a progressive disorder, characterized by the initial degeneration of rods followed by a secondary degeneration of cones (Tsang and Sharma, 2018a, b; Verbakel et al., 2018). Variants in 71 different genes1, have been associated with RP so far, among which PDE6a gene encodes the alpha subunit of cyclic phosphodiesterase 6-GMP (cGMP), expressed in the rods of the retina (Dryja et al., 1995; Huang et al., 1995).
Light detection by rod and cone photoreceptors of vertebrate retina utilizes cGMP as an intracellular messenger in the conversion of photon stimulation into an electrical response. Cyclic nucleotide phosphodiesterases (PDEs) catalyze the hydrolysis of 3′, 5′-cyclic nucleotides into inactive 5′-monophosphates. Five of the 11 PDE families contain regulatory segments called GAF-domain (GAF A and GAF B) that are located N-terminally to the more conserved catalytic domains (Aravind and Ponting, 1997). The GAF domain is named after some of the proteins it is found in, including cGMP-specific phosphodiesterases, adenylyl cyclases and FhlA. It is also present in guanylyl cyclases and phytochromes (Aravind and Ponting, 1997; Heikaus et al., 2009). Adenylyl and guanylyl cyclases catalyze ATP and GTP to the second messengers cAMP and cGMP, respectively. These products up-regulate catalytic activity by binding to the regulatory GAF domain(s). The opposite hydrolysis reaction is catalyzed by phosphodiesterase. cGMP-dependent 3′,5′-cyclic phosphodiesterase catalyzes the conversion of guanosine 3′,5′-cyclic phosphate to guanosine 5′-phosphate (Corbin et al., 2000). cGMP regulates catalytic activity by GAF-domain binding (Gillespie and Beavo, 1989) in the photoreceptor PDE6 family and provides one mechanism for regulating visual signal transduction.
PDE6a protein is therefore an effector enzyme of phototransduction and participates in the processes of transmission and amplification of the visual signal. Previous studies have revealed that variants of PDE6a gene lead to the degeneration of rods (Sakamoto et al., 2009; Sothilingam et al., 2015; Takahashi et al., 2018).
RP causes a gradual loss of vision which can extend over several years and today no effective treatment alleviates retinal disorders. It is therefore urgent to identify new therapeutic molecules that can slow the progression of the disease or preserve the vision in order to improve the patients’ quality of life. For this purpose, zebrafish is a model of choice as 70% of human genes have a homolog in zebrafish and 84% of its genes are associated with human pathologies (Howe et al., 2013). Several procedures have been set up to allow the high-throughput screening of behavioral alterations in zebrafish larvae. We therefore characterized a mutant zebrafish line expressing pde6aQ70X as a study model for the development of therapies to treat photoreceptor degeneration in humans, particularly suitable for in vivo screening. We here detail its morphological and behavioral phenotyping.
Materials and Methods
Zebrafish Generation, Maintenance, and Breeding
Pde6asa14581 carrier zebrafish were created by N-ethyl-N-nitrosourea (ENU) mutagenesis in the AB/Tupfel long fin mixed strain and were purchased from the European Zebrafish Resource Centre (EZRC) (Karlsruhe, Germany). The mutation changed the glutamine in position 70 into a stop codon and has been named pde6aQ70X. Heterozygous carriers of the mutation were outcrossed three times against wild type (AB strain) at EZRC and were subsequently intercrossed two times in our laboratory. Heterozygous fish of the resulting offspring were then used to produce embryos. The heterozygous pde6aQ70X mutant line was maintained in an automated fish tank system (ZebTEC, Tecniplast) at 28°C, pH 7, conductivity around 500 μS and with a 14 h:10 h light:dark cycle. They were fed a standard diet. Heterozygous pde6a+/Q70X zebrafish were intercrossed to generate homozygous wild-type (pde6aWT) and mutant pde6a zebrafish (pde6aQ70X). These fish became breeders and were incrossed in order to generate future generations for the experimental procedures. Embryos were collected from natural spawning, raised at 28.5°C in E3 medium (5 mM NaCl, 0.17 mM KCl, 0.33 mM CaCl2, 0.33 mM MgSO4, 0.05% methylene blue). Unfertilized embryos were discarded, and the water was changed only the first day. Larvae were euthanized by an extended bath of ice for biochemical experiments and immobilized in a 2.5% methylcellulose solution for imaging. Each experimental procedure was carried out in triplicate and larvae were from three different crosses.
Genotyping
For isolated homozygous pde6aWT and pde6aQ70X zebrafish, genomic DNA was extracted from the tail fins at 2 months of age by lysing the tissue in 50 mM NaOH at 95°C during 1 h (Meeker et al., 2007). A fragment of the pde6a gene was amplified by PCR using GoTaq Green Master Mix (Promega, Madison, United States) and the following primers: pde6a forward = 5′-ATAGGACAACTGTGACCCCACA-3′; pde6a reverse = 3′-GTGACATCAGTACGTACGTTGACAG-5′. The PCR program included initial denaturing at 95°C for 5min, followed by 25 cycles of denaturation at 95°C for 30 s, annealing at 55°C for 30 s, and elongation at 72°C for 30 s. These primers amplify a 539-bp region encompassing the pde6aQ70X mutation site. The products were subsequently digested with restriction enzyme Mwo1 (Thermo Fisher Scientific, ER1732), which is able to cut the WT amplicon twice and the mutant only once as the mutation abolishes one Mwo1 specific restriction site. For analysis, the digested products were separated by electrophoresis on a 2% agarose gel. The WT digested amplicon should give three bands of 271, 121, and 148 bp while the mutant should give two bands of 392 and 148 bp. The mutation was confirmed by Sanger sequencing.
RT-PCR and Quantitative Real-Time PCR (qPCR)
Twenty whole pde6aWT or pde6aQ70X larvae were collected and pooled at 5 days post fertilization (dpf) and total RNAs were extracted using a Nucleospin RNA Kit (Macherey-Nagel, Hoerdt, France) according to the manufacturer’s instructions. RNAs were reverse transcribed using M-MLV reverse transcriptase and quantitative RT-PCR were performed on a LightCycler 480 system (Roche, Boulogne-Billancourt, France). Primer sequences of zebrafish genes pde6a or zef1α were as follows: pde6a forward = 5′-ATGGCAGTCAACAAGATCGG-3′; pde6a reverse: 3′-TCATGTCGAGAAGGCCAACA-5′; zef1α forward: 5′-TTCTGTTACCTGGCAAAGGG-3′; zef1α reverse: 3′-TTCAGTTTGTCCAACACCCA-5′.
Control reactions were conducted with sterile water to determine signal background and DNA contamination. The standard curve of each gene was confirmed to be in a linear range, while zef1α gene was selected as reference.
Visual Motor Response (VMR) Assay
The VMR assay quantifies the locomotor activity of zebrafish larvae to light changes using infrared tracking system. At 4 dpf, individual larvae were transferred in a 96 well plate (Whatman, #7701-1651, square and flat bottom wells) with 300 μl embryo medium and at 3 weeks post fertilization, the individual zebrafish were transferred in wells of a 24 well plate (Falcon®, 353047, square and flat bottom wells) with 2 ml embryo medium. pde6aWT larvae were deposited in even wells and mutants in odd wells. Larvae without swim bladders or presenting visible physical deformities were not used for the experiment.
The locomotor behavior was monitored with an automated videotracking device (Zebrabox®, ViewPoint, Lissieu, France), employing a DinionXF 1/3-inch Monochrome camera (model BFLY-PGE-13H2M, Flir, Oregon, United States) fitted with a fixed-angle megapixel lens (SR5014MP-5C, SEIKO Optical, Willich, Germany). In the device, larvae in the plate were isolated from environmental surrounding noise. The floor of the box emitted by a light-controlling unit a white light (69–83 μW/cm2 measured at 495 λ). The response to stimuli was recorded by an infra-red (IR) camera (25 frames/s) under IR light illumination at 850 nm, which the animals could not perceive.
To characterize the rod physiology, zebrafish were acclimatized in the dark (0% brightness) for 1 h without tracking, then followed the same protocol with light (1% brightness; 3.5 Lux) and dark (0% brightness). In addition, in order to further reduce the contrast of light changes, a neutral density filter 8 (ND8) was placed on the light source. This was repeated twice, giving a total experiment duration of 100 min. The brightness changes were immediate (<<1 s).
The detection sensitivity was set to 31, activity burst threshold to 30 and activity freeze threshold to 10. Locomotor activity between the two threshold values was considered as normal activity. The distance covered was measured in mm/s. The values obtained in OFF were subtracted for each larvae by their ON values in order to remove the difference in basic locomotion that one could have between groups.
Optokinetic Response (OKR) Assay
Larvae were randomly chosen and placed per group of four in a Petri dish (35 mm diameter) containing 2 ml of 2.5% methylcellulose (#9004-65-3, Sigma Aldrich, Missouri, United States). Using a tip, larvae were placed dorsal up and forming an X to avoid touching and interfering with each other. All measurements were done in the afternoon between 2:00 p.m. and 6:00 p.m. The room temperature was 28°C and the light was off.
Visual system performance of larval zebrafish was assessed using a videotracking device (VisioBox®, ViewPoint). Forty 6 mm-wide black and white strips were projected at a speed of 2 rpm on a white cylinder surrounding the fish (9 cm diameter). Larvae were trained for 1 min to the movement of the bands, going from left to right. Eye saccades were videotracked for 1 min. The direction of rotation of the bands was then reversed. The fish were trained again during 1 min and finally videotracked for 1 min.
The IR illuminated larvae from the bottom and responses were tracked using a FL3-U3-32S2M 1/2.8-inch Monochrome camera (FLEA3, Flir) at 25 frames/s. The macrolens had a focus at 0.10x (VS-MCA10, VS Technology, Tokyo, Japan). The number of eye saccades was manually measured (PHIVisualize software) and the average number of saccades per 2 min quantified.
Morphological Analyses
Images were obtained using a stereo microscope (Olympus, Tokyo, Japan) equipped with a digital camera. Larvae were placed in a petri dish containing 2.5% methylcellulose. The total body length and eye diameter of the larvae were measured on an image taken at ×3.2 magnification. Ear area and anterior and posterior otoliths were measured at ×6.3 magnification. Images were processed with the ImageJ v1.46 software (NIH, Bethesda, MD, United States) to perform the various measurements.
Photoreceptors Counting
Images were taken in the same session to ensure identical microscope settings used within the different groups. Individual cone cells, immunolabeled with Zpr-1 antibody, were quantified from three sections per fish (n = 14 for pde6aWT and n = 12 for pde6aQ70X for 5 dpf larvae; n = 14 for pde6aWT and n = 13 for pde6aQ70X for 21 dpf zebrafish). The total area of photoreceptor outer segments (immunolabeled with Rho4D2 antibody, three sections per fish, n = 3 for pde6aWT and n = 3 for pde6aQ70X for 5 dpf larvae; n = 3 for pde6aWT and n = 3 for pde6aQ70X for 21 dpf zebrafish) was measured using ImageJ, by selecting each region of interest and utilizing the Measurement tool. Average active caspase-3 positive cell number was measured by counting the number of positive cells (immunolabeled with a cleaved caspase-3 antibody) from three sections per fish (n = 16 for pde6aWT and n = 15 for pde6aQ70X for 5 dpf larvae; n = 10 for pde6aWT and n = 10 for pde6aQ70X for 21 dpf zebrafish). Individual cone numbers and total area of rod outer segments were normalized against the total length of the retina in μm. The number of active Caspase-3 positive cells was normalized per whole retinal section.
Immunohistochemistry and Confocal Microscopy
Larvae were fixed in 4% paraformaldehyde for 24 h at 4°C and dehydrated in 25% sucrose-PBS for 24 h then in 35% sucrose-PBS for 24 h. Embryos were placed in plastic molds, oriented in Cryomatrix (O.C.T.TM, Sakura, Tissue-Tek, Netherlands) at room temperature and rapidly frozen in liquid nitrogen.
Larvae were transversely sectioned in 10 μm-thick slices, using a cryostat (Leica, Wetzlar, Germany) at –20°C and mounted on positively charged glass slides. To prevent unspecific binding of the antibody, cryosections were blocked with 0.1% PBS/Triton X-100, 5% Horse serum for 30min at room temperature and incubated overnight at 4°C with either an anti-Rho4d2 antibody (dilution 1:7000; ab98887, Abcam, Cambridge, UK), an anti-ZPR-1 antibody (dilution 1:500; ab174435, Abcam) or an anti-cleaved Caspase-3 (Asp175) antibody (dilution 1:500, #9661, Cell Signaling Technology, United States). The sections were incubated 2 h at room temperature with the following secondary antibodies conjugated with Cy3 anti-mouse (dilution 1:800; 715-165-150, Jackson ImmunoResearch), Cy3 anti-rabbit (dilution 1:1,000; 711-166-152, Jackson ImmunoResearch) or Alexa Fluor® 488 anti-mouse (dilution 1:1,000; 715-545-150, Jackson ImmunoResearch). Nuclei were counterstained with 4′,6-diamidino-2-phenylendole (DAPI; dilution 1:5,000; Sigma Aldrich). The emitted fluorescence was measured using a confocal microscope (LSM880 Fastairyscan, Zeiss).
Statistical Analyses
Statistical analysis was performed using PrismTM v5.0 software (GraphPad, San Diego, CA, United States). To compare two experimental groups (pde6aWT vs. pde6aQ70X), one-tailed Student’s t-test was used. All data were presented as mean ± standard deviation (SD). The levels of statistical significance were: ∗p < 0.05, ∗∗p < 0.01, ∗∗∗p < 0.001, and ****p < 0.0001.
Results
Generation of a pde6aQ70X Mutant Zebrafish Line
To determine the role of Pde6a in photoreceptor function, we analyzed pde6aQ70X mutant zebrafish, generated using the ENU method, at the EZRC. The mutation results in the production of a truncated protein (less than 10% of the wild type protein should be produced) and disrupts almost all of the functional domains (Figure 1A). Heterozygous pde6a+/Q70X zebrafish were intercrossed to generate pde6aWT, pde6a+/Q70X, and pde6aQ70X littermates. Sanger sequencing of several larvae genomic DNA confirmed the mutation, with wild type allele (C) in pde6aWT and the ENU mutant allele (T) in pde6aQ70X. The heterozygous fish showed the wild type (C) and ENU mutant alleles (T) (Figure 1B). The genotypes of the fish were assessed by PCR and Mwo1 endonuclease digestion, as the recognition of the restriction site is disrupted by the pde6aQ70X mutation. As expected, pde6aWT digested amplicon resulted in three distinct bands migrating at 121, 148, and 271 bp, while the pde6aQ70X digested amplicon showed two bands at 148 and 392 bp (Figure 1C). Finally, in order to determine if the mutation induced mRNA decay, qPCR experiment was achieved. qPCR showed that larvae carrying the pde6aQ70X mutation had decreased pde6a expression level compared to controls (Figure 1D). Curiously, pde6b expression level was also decreased in the pde6aQ70X mutant. Thus, these results confirmed that a mutant zebrafish line deficient in pde6a had indeed been generated.
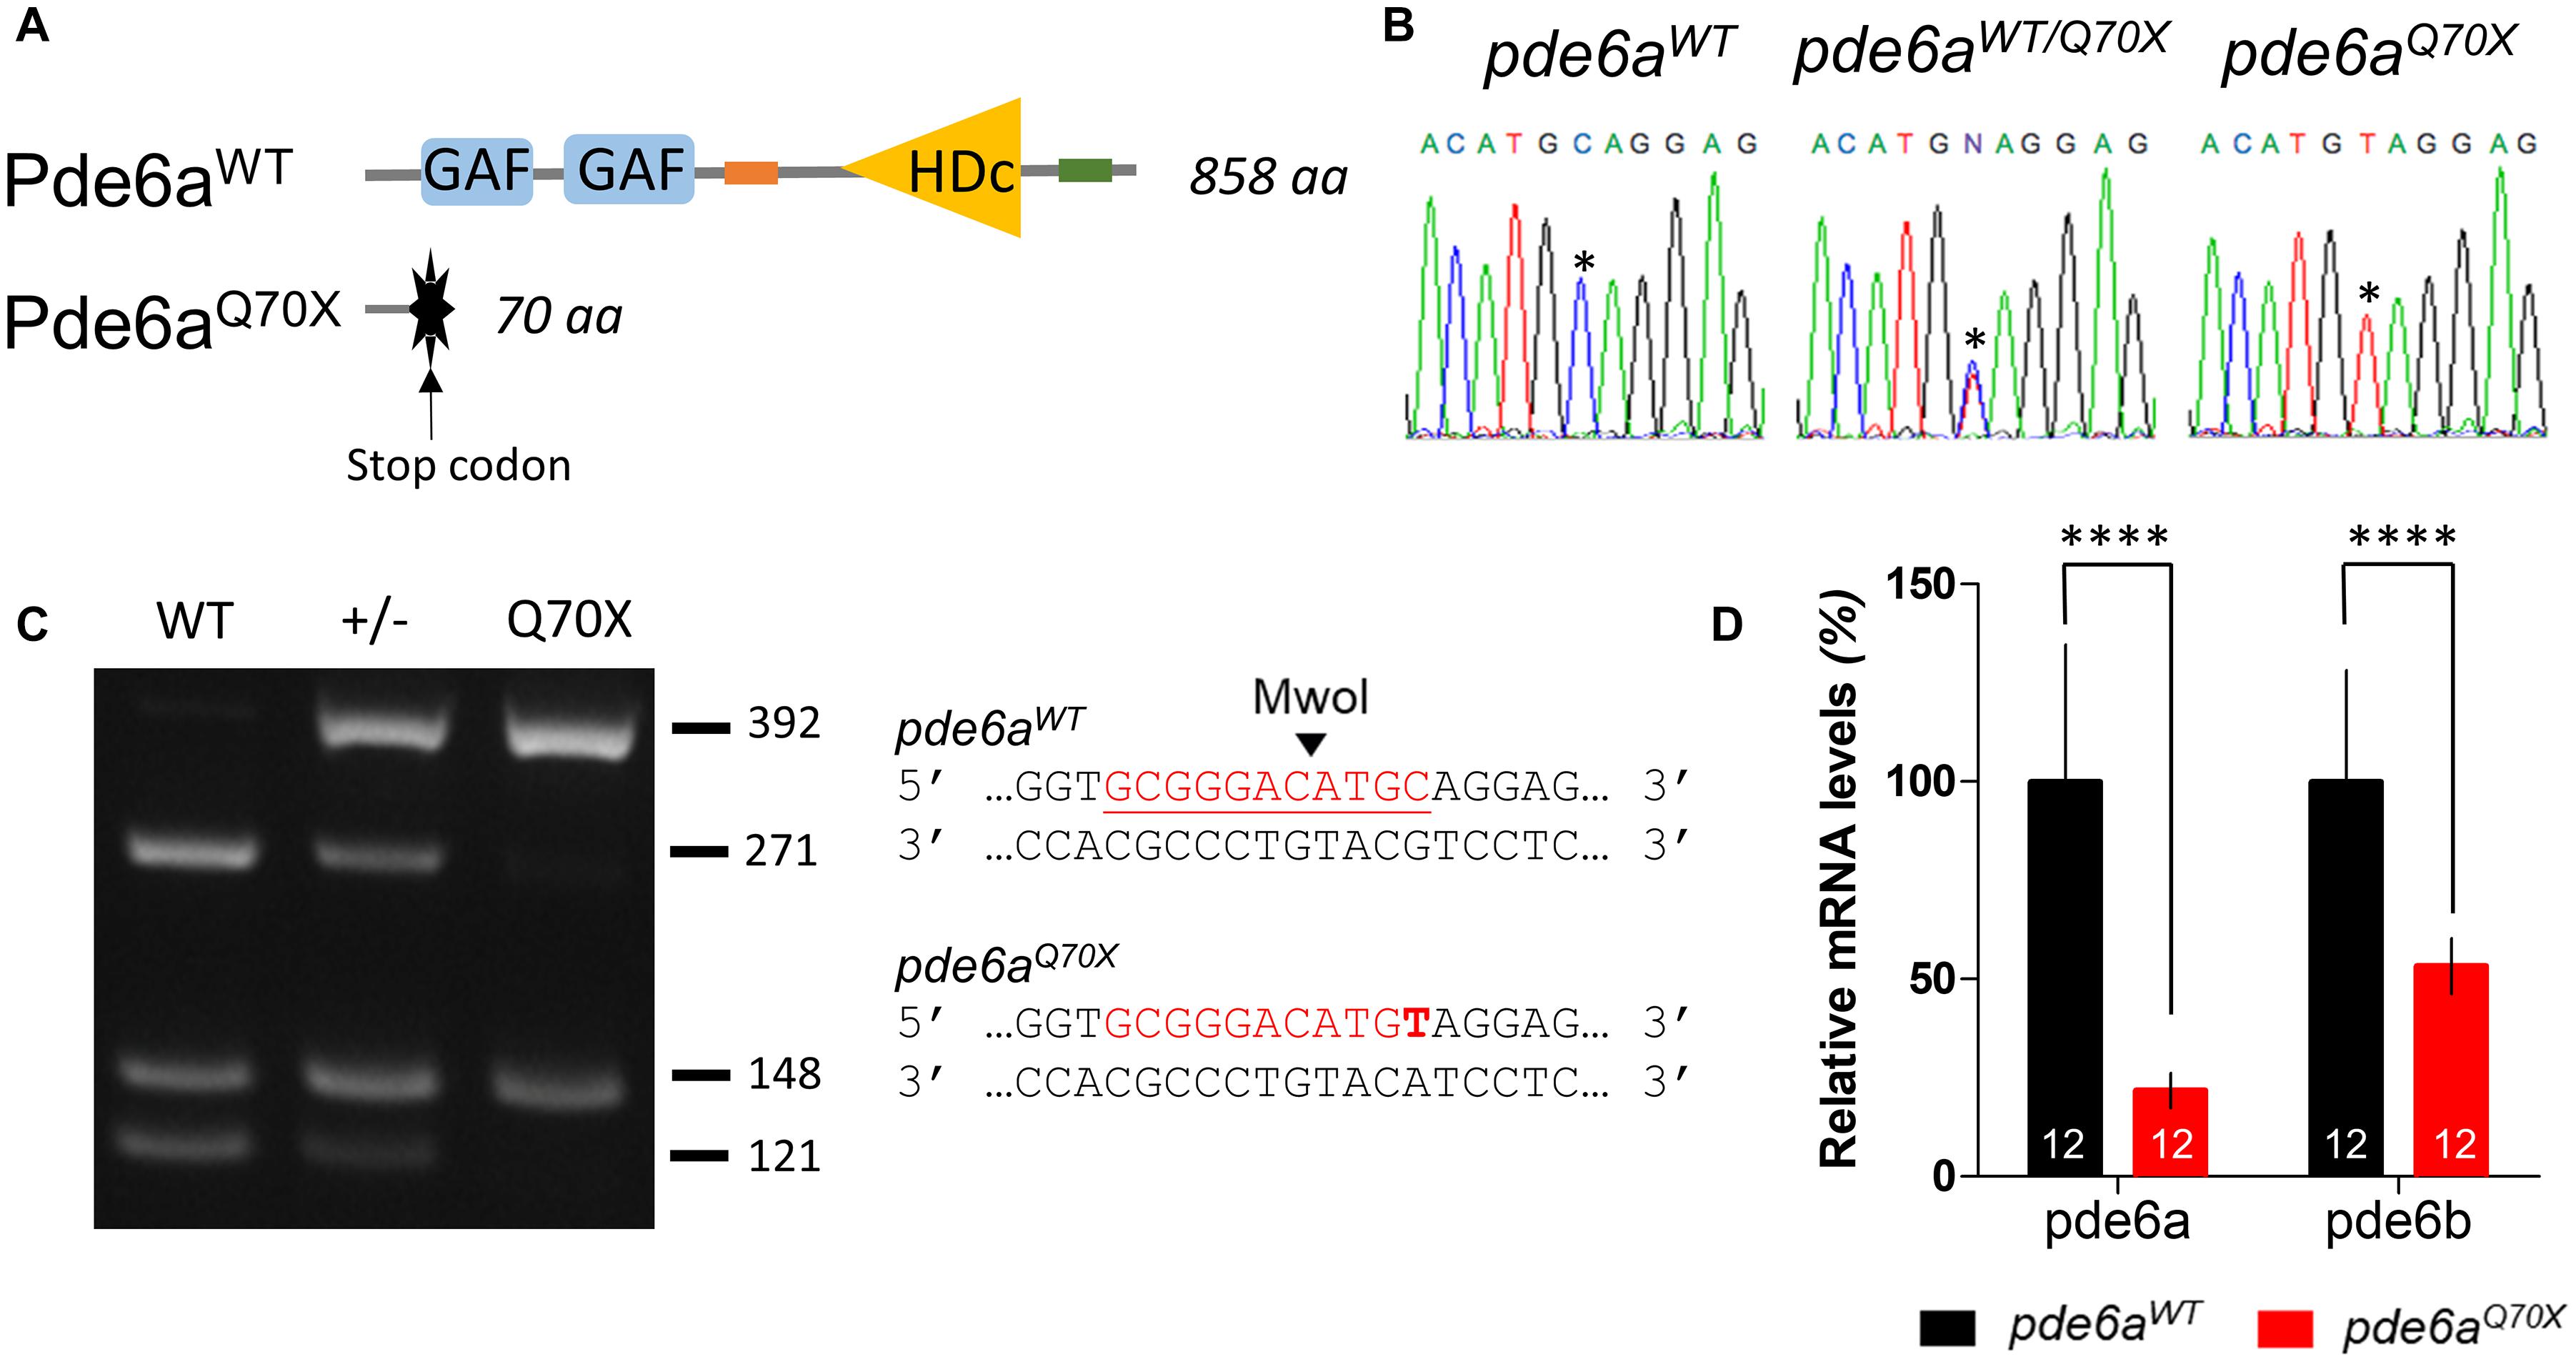
Figure 1. Mutation in pde6a zebrafish causes a premature stop codon. (A) Structure of zebrafish Pde6a protein with specific GAF (cGMP-specific phosphodiesterases, adenylyl cyclases and FhlA) and HDc [histidine (H) and/or aspartate (D) amino acid residues] domains. (B) Sanger sequencing identified the nucleotide mutation in exon 1 of pde6a sequence. Asterisk (*) denotes the substituted nucleotide in the knock-out pde6a sequencing trace. (C) A targeted fragment was amplified by PCR from the genomic DNA of adult zebrafish tail followed by an enzymatic digestion with Mwo1. The three rows present digested products for pde6aQ70X, pde6aWT, and pde6aWT/Q70X fish. Mwo1 restriction site is shown on the side of the agarose gel image. The mutation is highlighted in bold. (D) Expression level of pde6a and pde6b mRNA revealed by qPCR in pde6aQ70X and pde6aWT zebrafish larvae. Expression of pde6a and pde6b were normalized using the zef1α reference gene. Error bars represent SD calculated from three replicas. ****p < 0.0001.
Zebrafish pde6aQ70X Mutants Do Not Develop Gross Morphological Alteration
Genotyping of numerous larvae from pde6a+/Q70X intercrosses revealed that homozygous offspring (pde6aQ70X) appeared normal and were present in Mendelian ratios at 5 dpf. To decipher the impact of pde6a gene mutation on zebrafish development, morphological analyzes were carried out at the same stage than behavioral tests: 5 dpf. The body length, eye diameter, ear area as well as posterior and anterior otolith area were measured (Figure 2A). Neither the body length (Figures 2B,C), nor the eye diameter were different between pde6aWT and pde6aQ70X (Figure 2D). In addition, no significant difference was found in ear area (Figure 2E), or anterior (Figure 2F) and posterior (Figure 2G) otolith areas. Taken together, these data suggested that the disruption of Pde6a level did not induce gross morphological alterations in pde6aQ70X line.
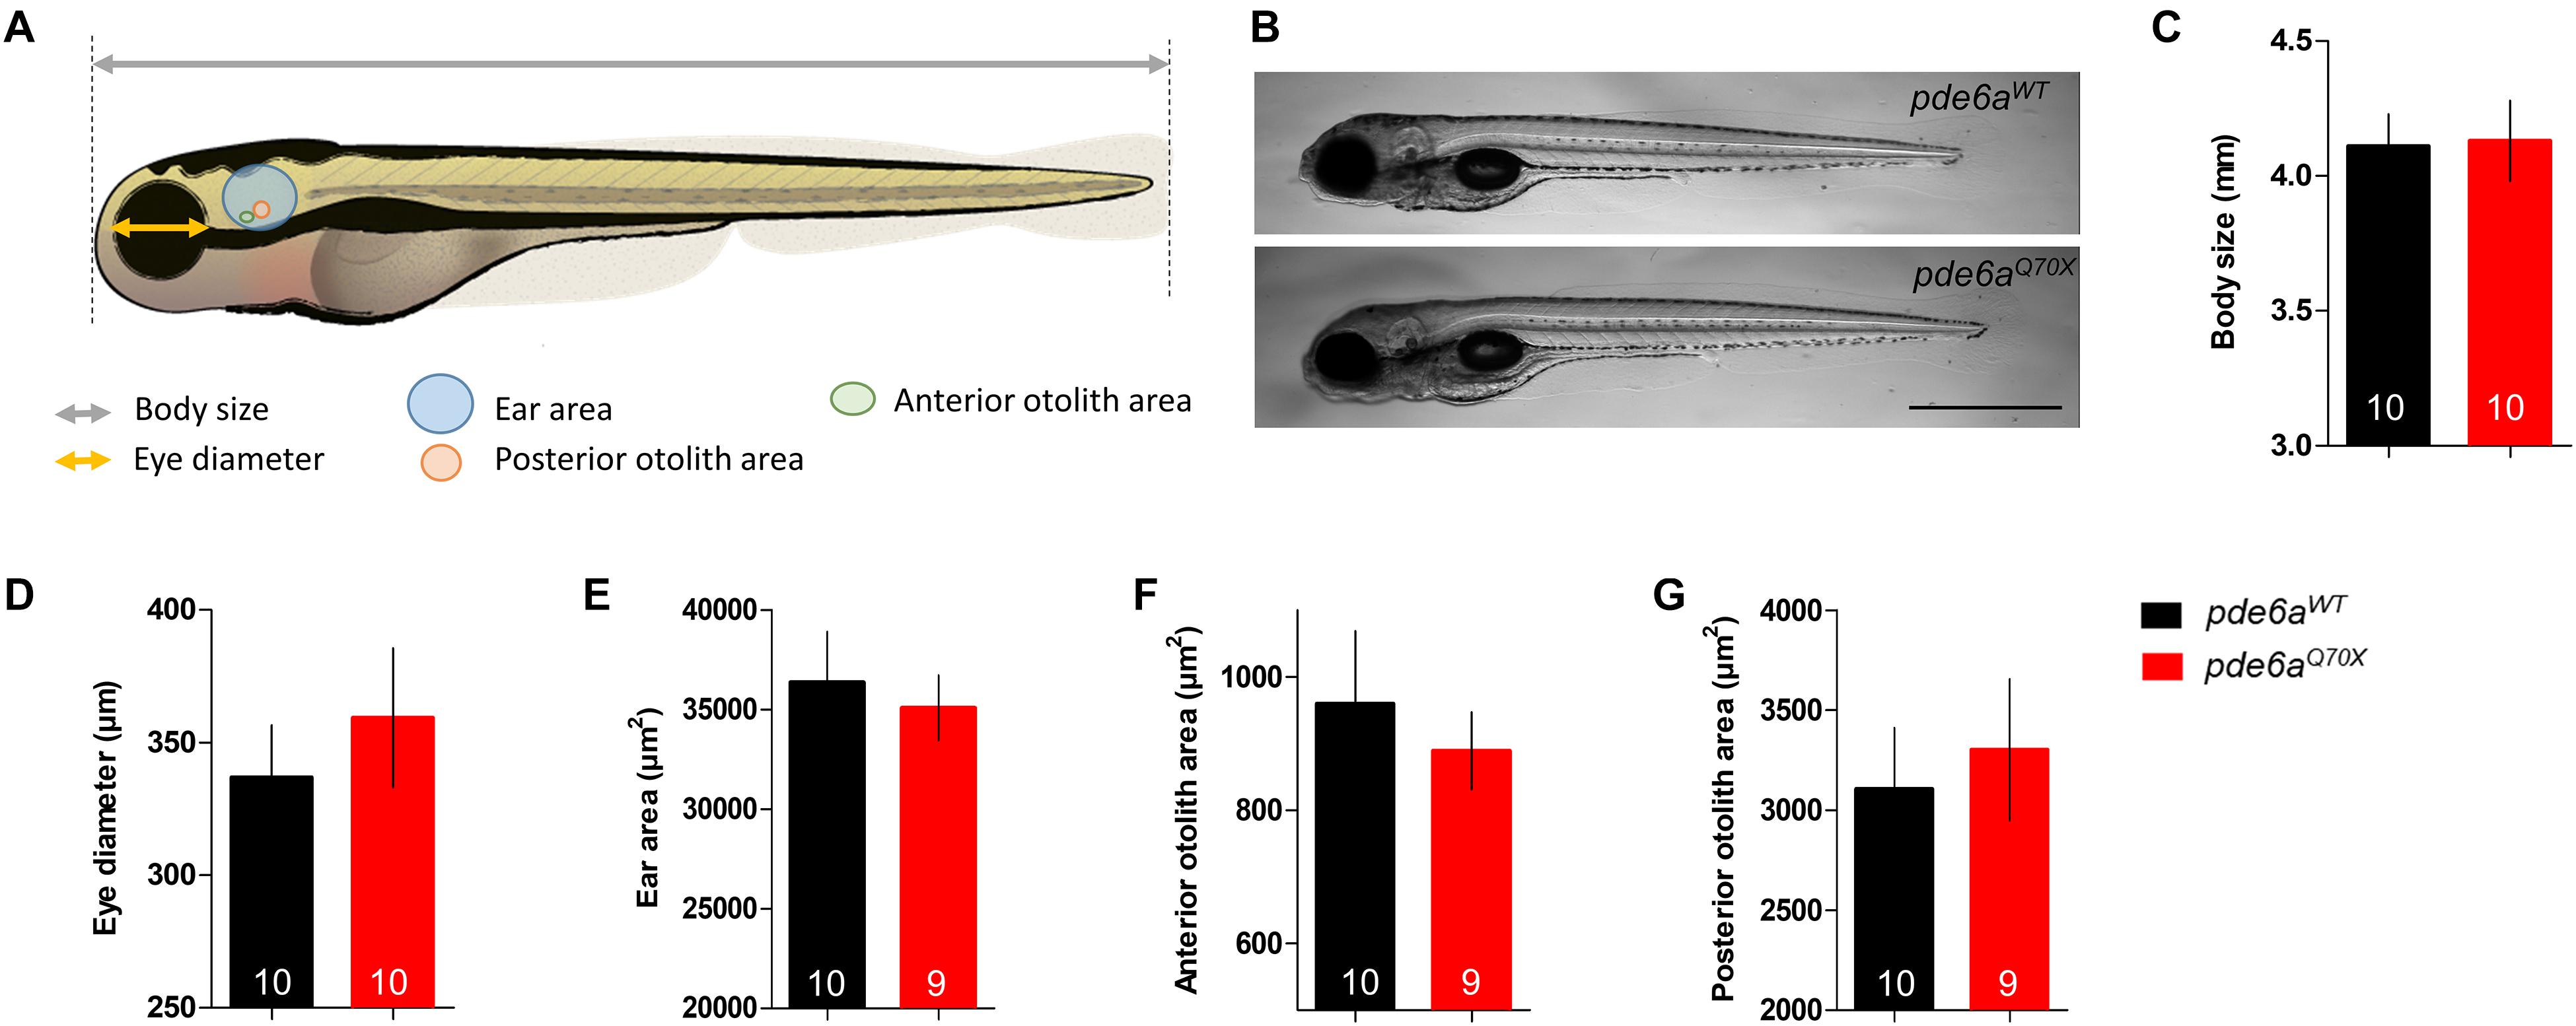
Figure 2. Morphology of the pde6aQ70X larvae at 5-dpf. (A) Schematic representation of the different measurements of the larva (modified from Lizzy Griffiths). (B) pde6aQ70X larvae showed presence of swim bladders and absence of any morphological abnormality as compared to pde6aWT controls. (C) Measurement of body length, from the mouth to the end of the tail fin and (D) the diameter of the eye. The area of the ear (E), anterior (F), and posterior (G) otolith were also analyzed. Scale = 1 mm. The number of animals is indicated within the columns. p > 0.05 for all comparisons.
Zebrafish pde6aQ70X Mutants Have Impaired Visual Function
Visual function was first assessed in pde6aQ70X mutant larvae and control siblings at 5 dpf using the optokinetic response (OKR). In the OKR test, saccade movements of larvae in response to black and white stripes were measured (Figure 3A), reflecting the visual acuity of the larvae. No difference in the number of saccades was observed between pde6aWT and pde6aQ70X larvae (Figures 3A,B). The decrease of Pde6a level did not impair the visual acuity of the larvae at 5 dpf.
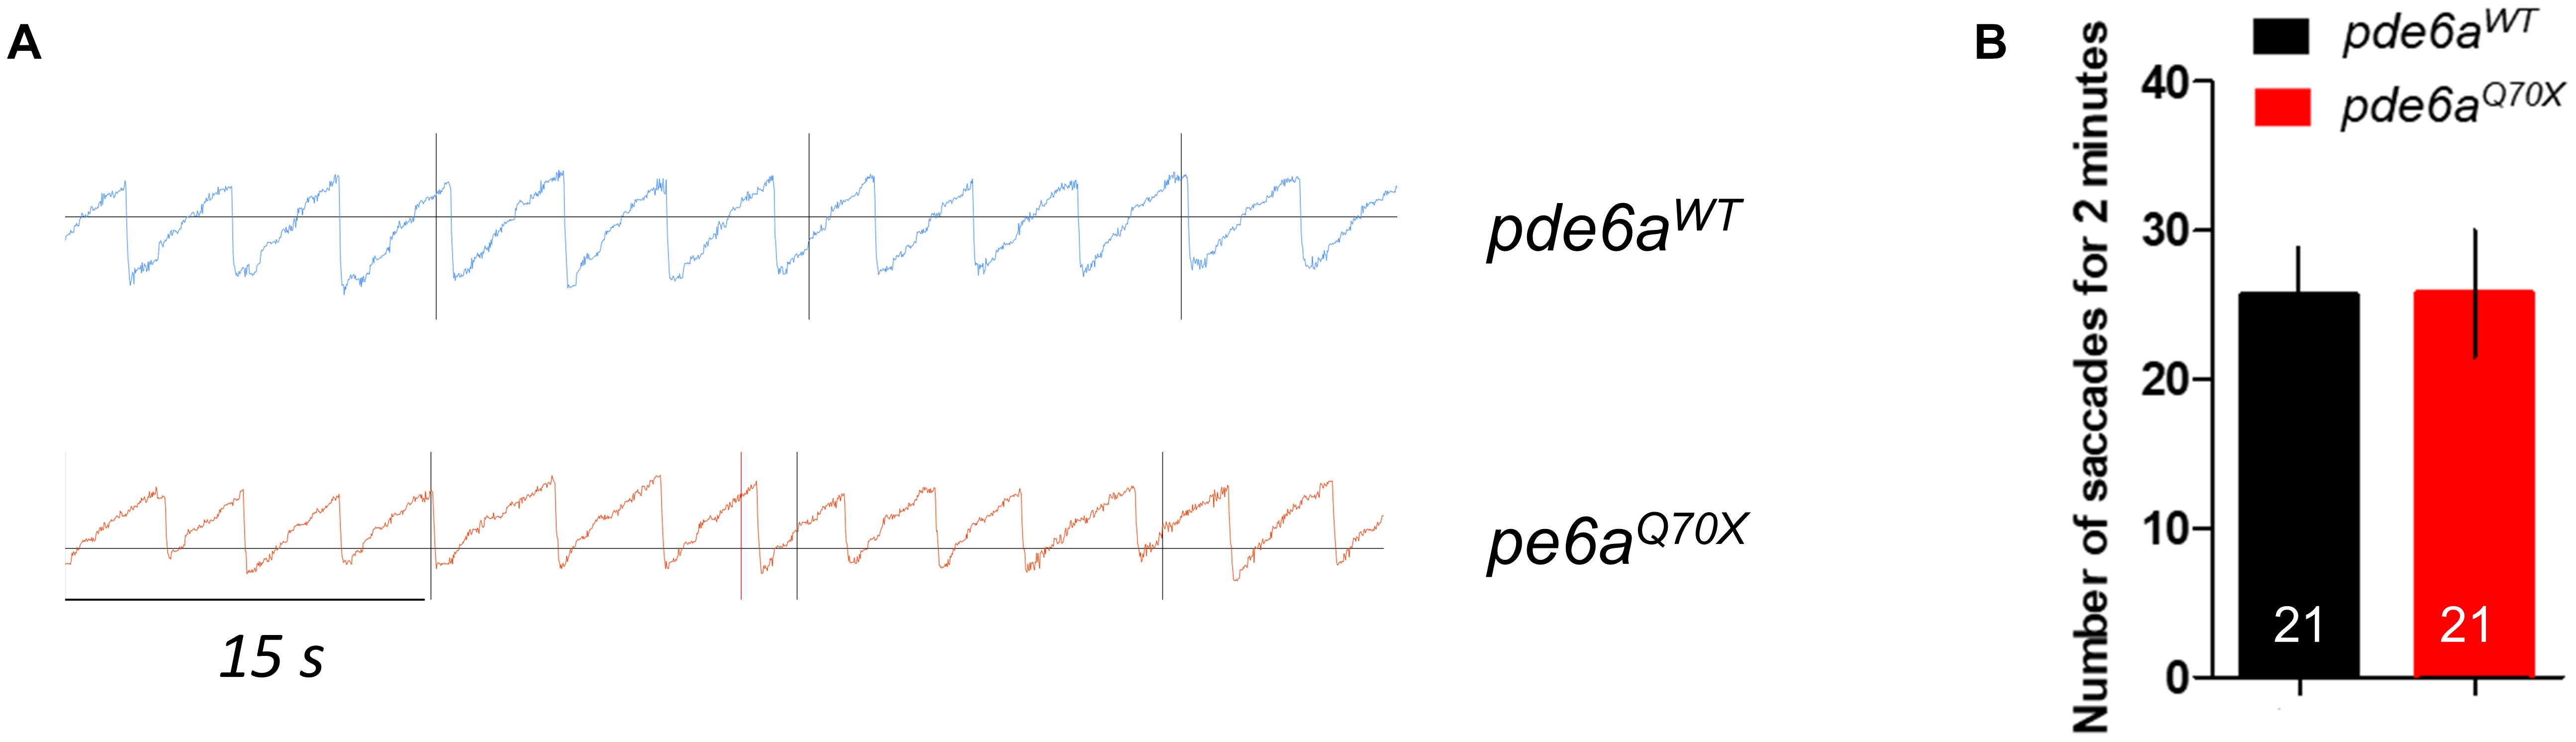
Figure 3. Impact of pde6a mutation on the OKR test of larvae at 5-dpf. (A) OKR chromograph illustrating the saccades performed by pde6aWT larvae (in blue) and pde6aQ70X larvae (in red) for 1 min. (B) Quantification of the number of saccades performed in 2 min. The number of animals is indicated within the columns. The experiment was repeated 3 times.
Then, we analyzed rod function using a modified protocol of the visual motor response (VMR). The initial VMR test measures locomotor activity of larvae in response to drastic changes from 100% brightness to 0% brightness, this change in brightness being presented twice sequentially. The light intensity of the 100% brightness activates the cones and will not reflect rod function. Consequently, we applied a neutral density filter 8 and changed the light intensity from 1 to 0% (Figure 4A). The locomotor response of the 5 dpf pde6aQ70X mutant larvae was significantly decreased in the OFF phases (Figures 4B,C). No difference in traveled distance was observed during the training (Figure 4D) and ON phases (Figure 4E).
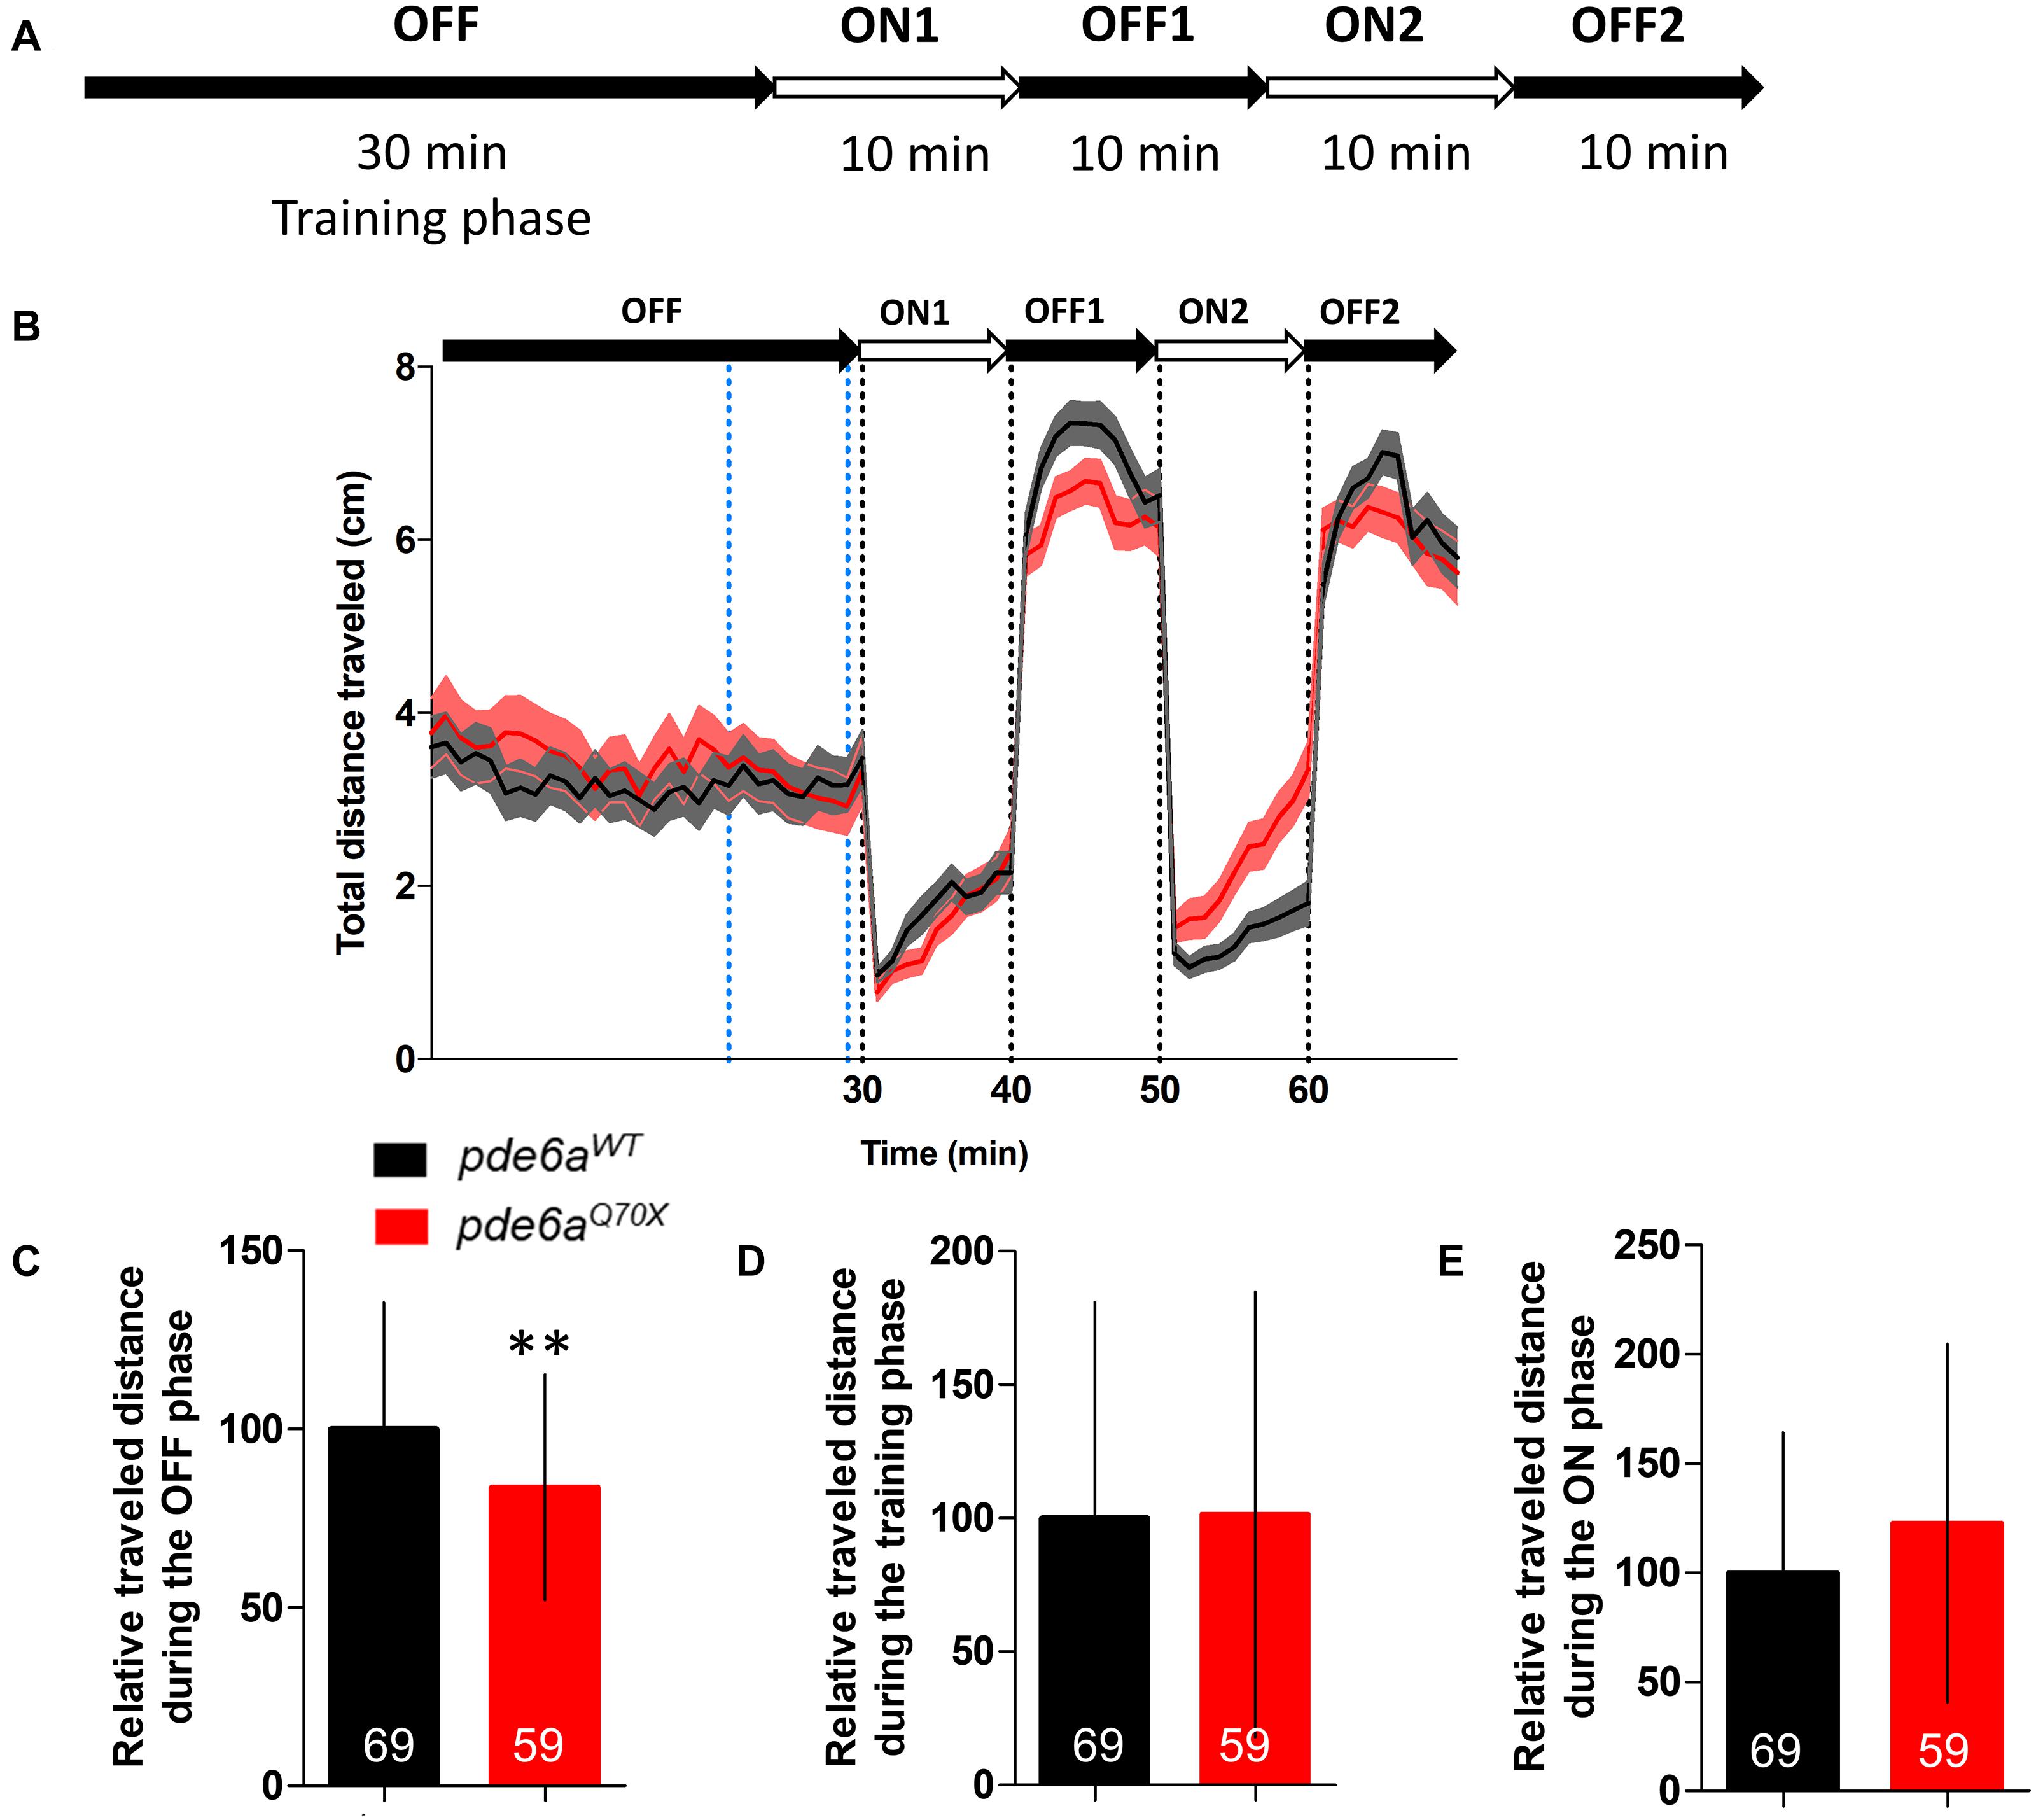
Figure 4. Analysis of the distance traveled by the larvae during the light/dark cycle in the VMR test at 5 dpf. (A) Sequence protocol: the activity is measured for 70 min, with 30 min of training in the dark (OFF), then 2 cycles of light/dark (ON/OFF) of 10 min each. (B) Average distance traveled per min for each condition according to the light/dark protocol. Distance traveled by the larvae during: (C) the averaged OFF1 and OFF2 phases; (D) the training phase [blue dotted lines in (B), between 21 and 29 min]; and (E) the averaged ON1 and ON2 phases. Distance were expressed as % of controls. Error bars represent the SD from three replicas except for B where errors bars represent the SEM. The number of animals is indicated within the columns. ∗∗p < 0.01.
Since RP is a progressive retinal pathology, we analyzed the VMR of 21 dpf zebrafish. Using the same protocol (Figure 5A), a statistically significant decrease of the traveled distance was also observed between pde6aWT and pde6aQ70X larvae in the OFF periods (Figures 5B,C). Similarly to the results obtained on 5dpf larvae, no difference in traveled distance was observed during the training (Figure 5D) and ON phases (Figure 5E) in 21 dpf larvae.
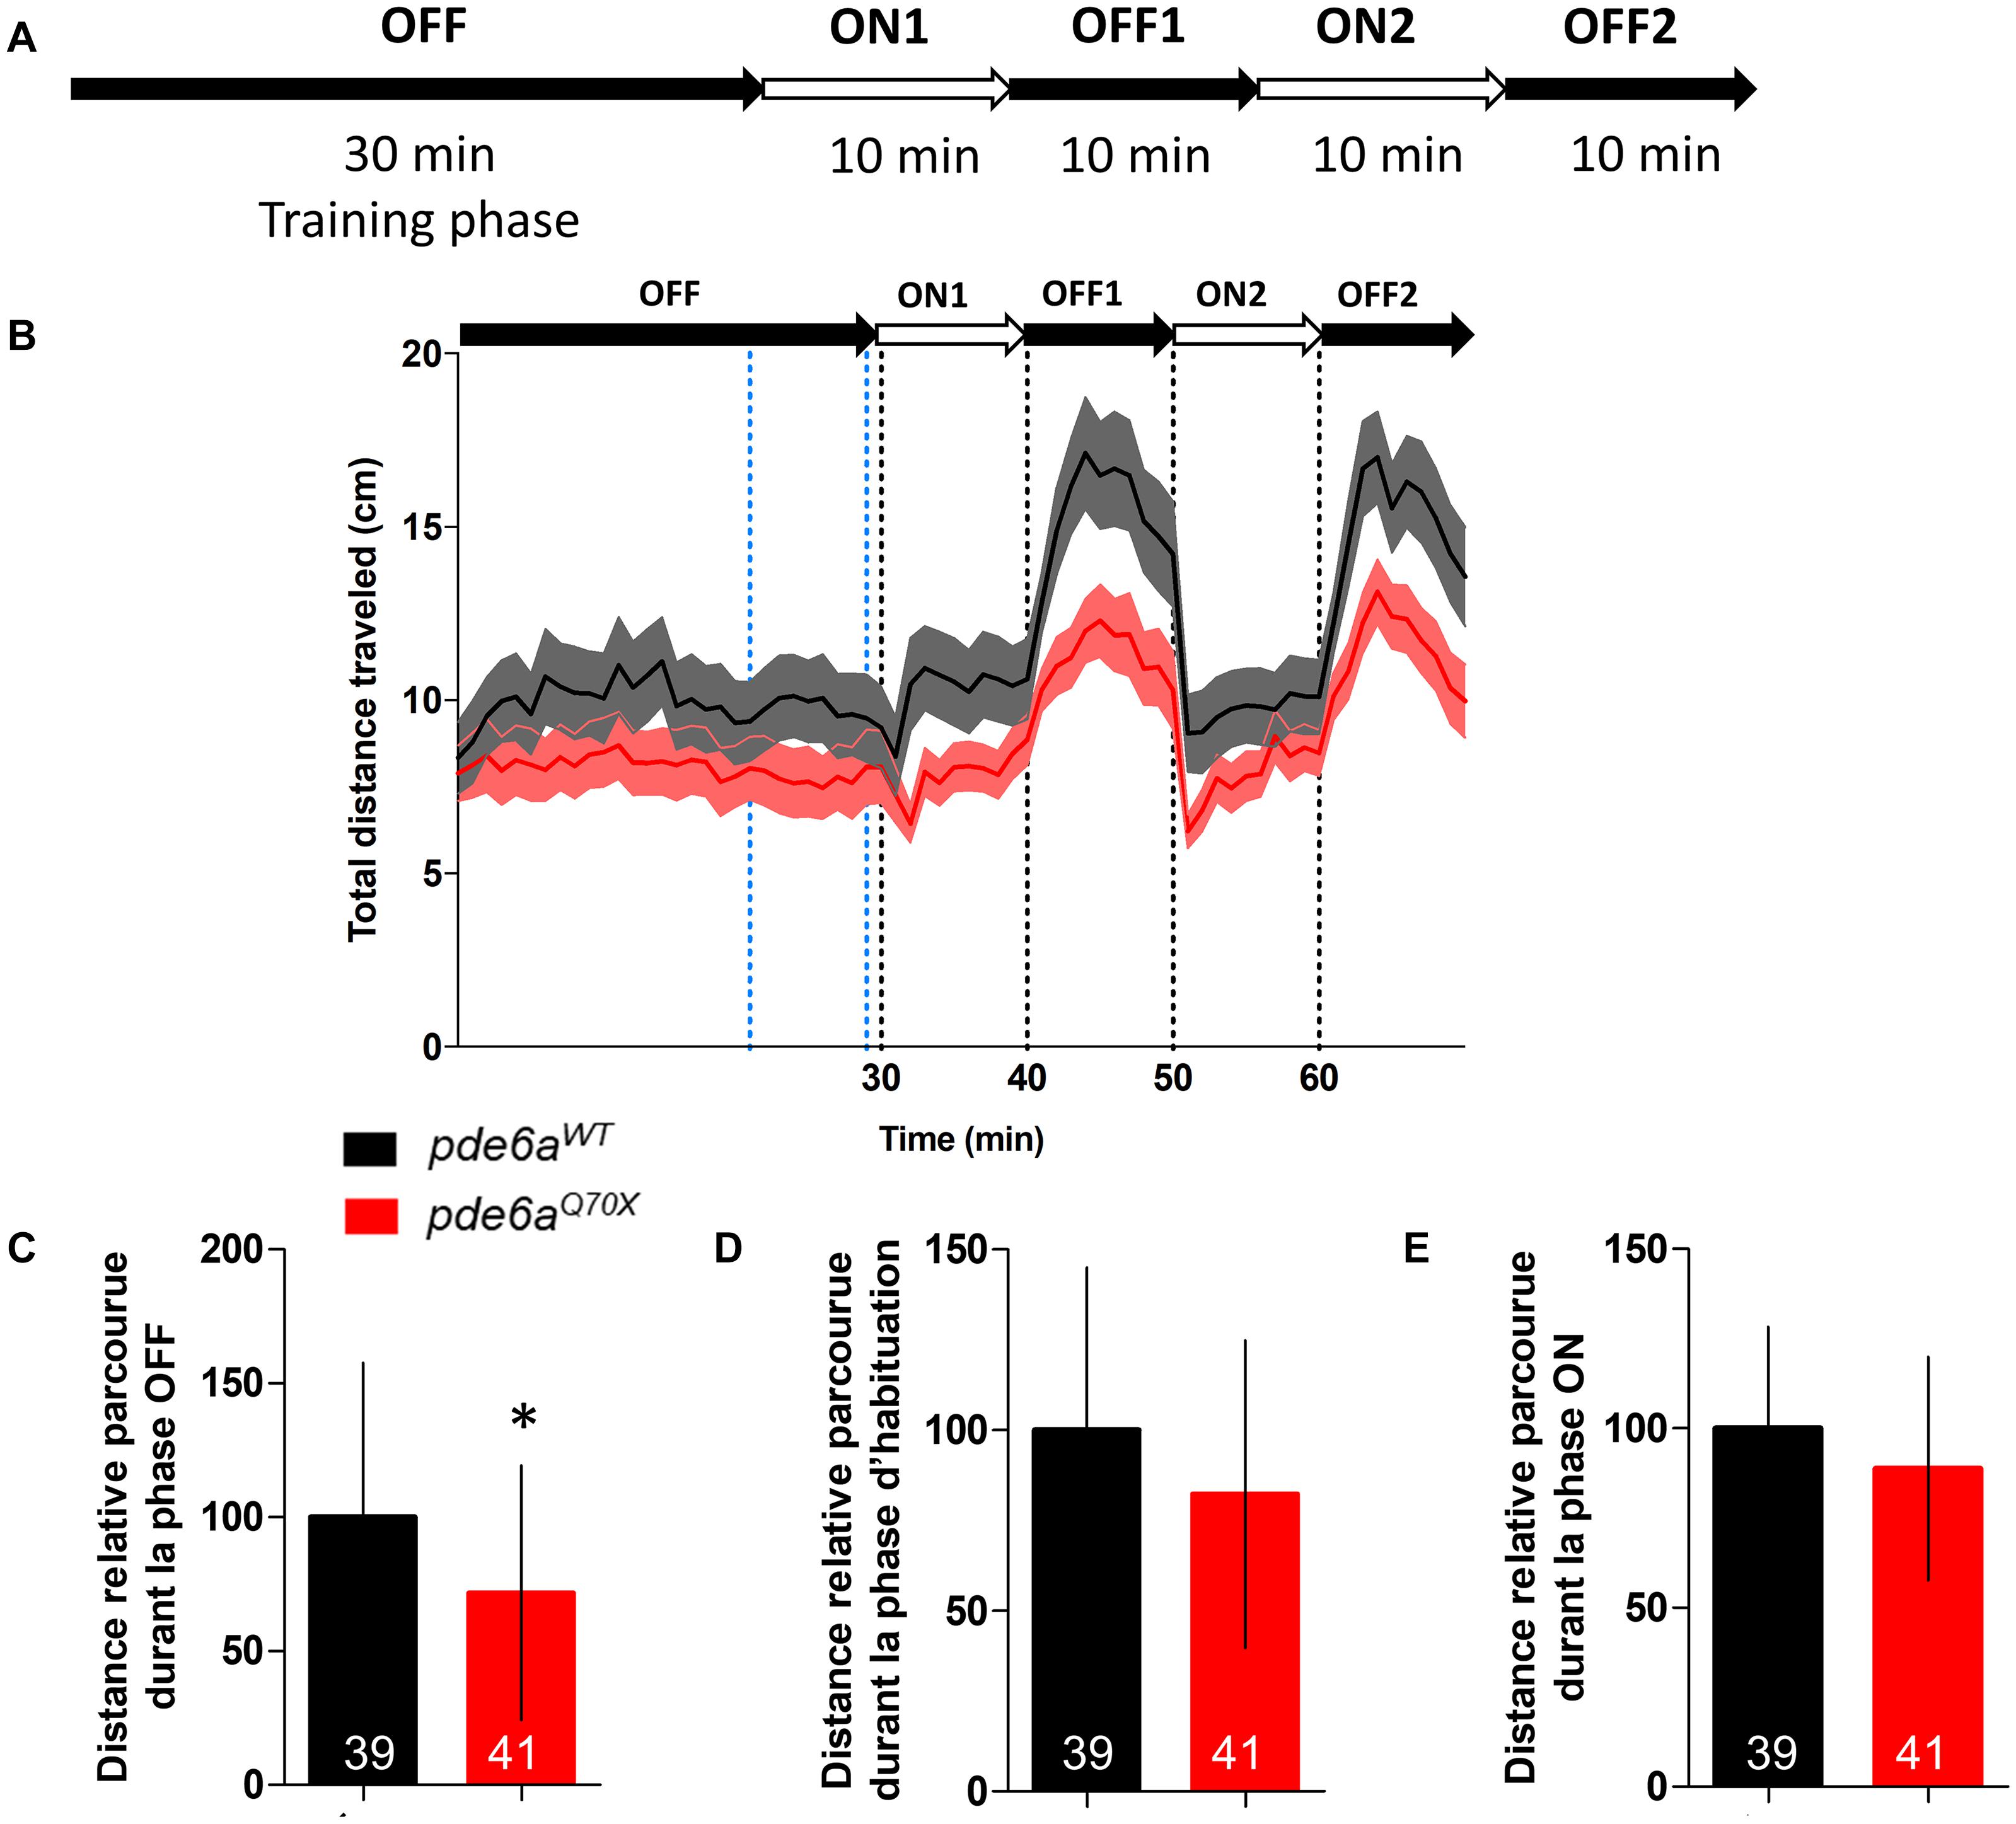
Figure 5. Analysis of the distance traveled by the larvae during the light/dark cycle in the VMR test at 21 dpf. (A) Sequence protocol: the activity is measured for 70 min, with 30 min of training in the dark (OFF), then 2 cycles of light/dark (ON/OFF) of 10 min each. (B) Average distance traveled per min for each condition according to the light/dark protocol. Distance traveled by the larvae during: (C) the averaged OFF1 and OFF2 phases; (D) the training phase [blue dotted lines in (B), between 21 and 29 min]; and (E) the averaged ON1 and ON2 phases. Distance were expressed as % of controls. Error bars represent the SD from three replicas except for B where errors bars represent the SEM. The number of animals is indicated within the columns. ∗p < 0.05.
Rod Photoreceptor Outer Segments Shrink in pde6aQ70X Mutants
In order to determine if these behavioral deficits are correlated to histological alterations, we performed a histological analysis of the retina in pde6aWT and pde6aQ70X larvae. A specific immunolabeling of Rhodopsin, with an anti-Rho4d2 antibody, was used to count and compare the number of rods between the two genotypes. At 5 dpf, the total area occupied by rod photoreceptor outer segments was significantly smaller in pde6aQ70X (5.61 μm2/μm of retina section ± 0.33) compared to pde6aWT (6.71 μm2/μm ± 0.29) (Figures 6A,C). At 21 dpf, the total area occupied by rod photoreceptor outer segments was significantly smaller in pde6aQ70X (4.07 μm2/μm ± 0.79) compared to pde6aWT (15.90 μm2/μm ± 1.47) (Figures 6B,D).
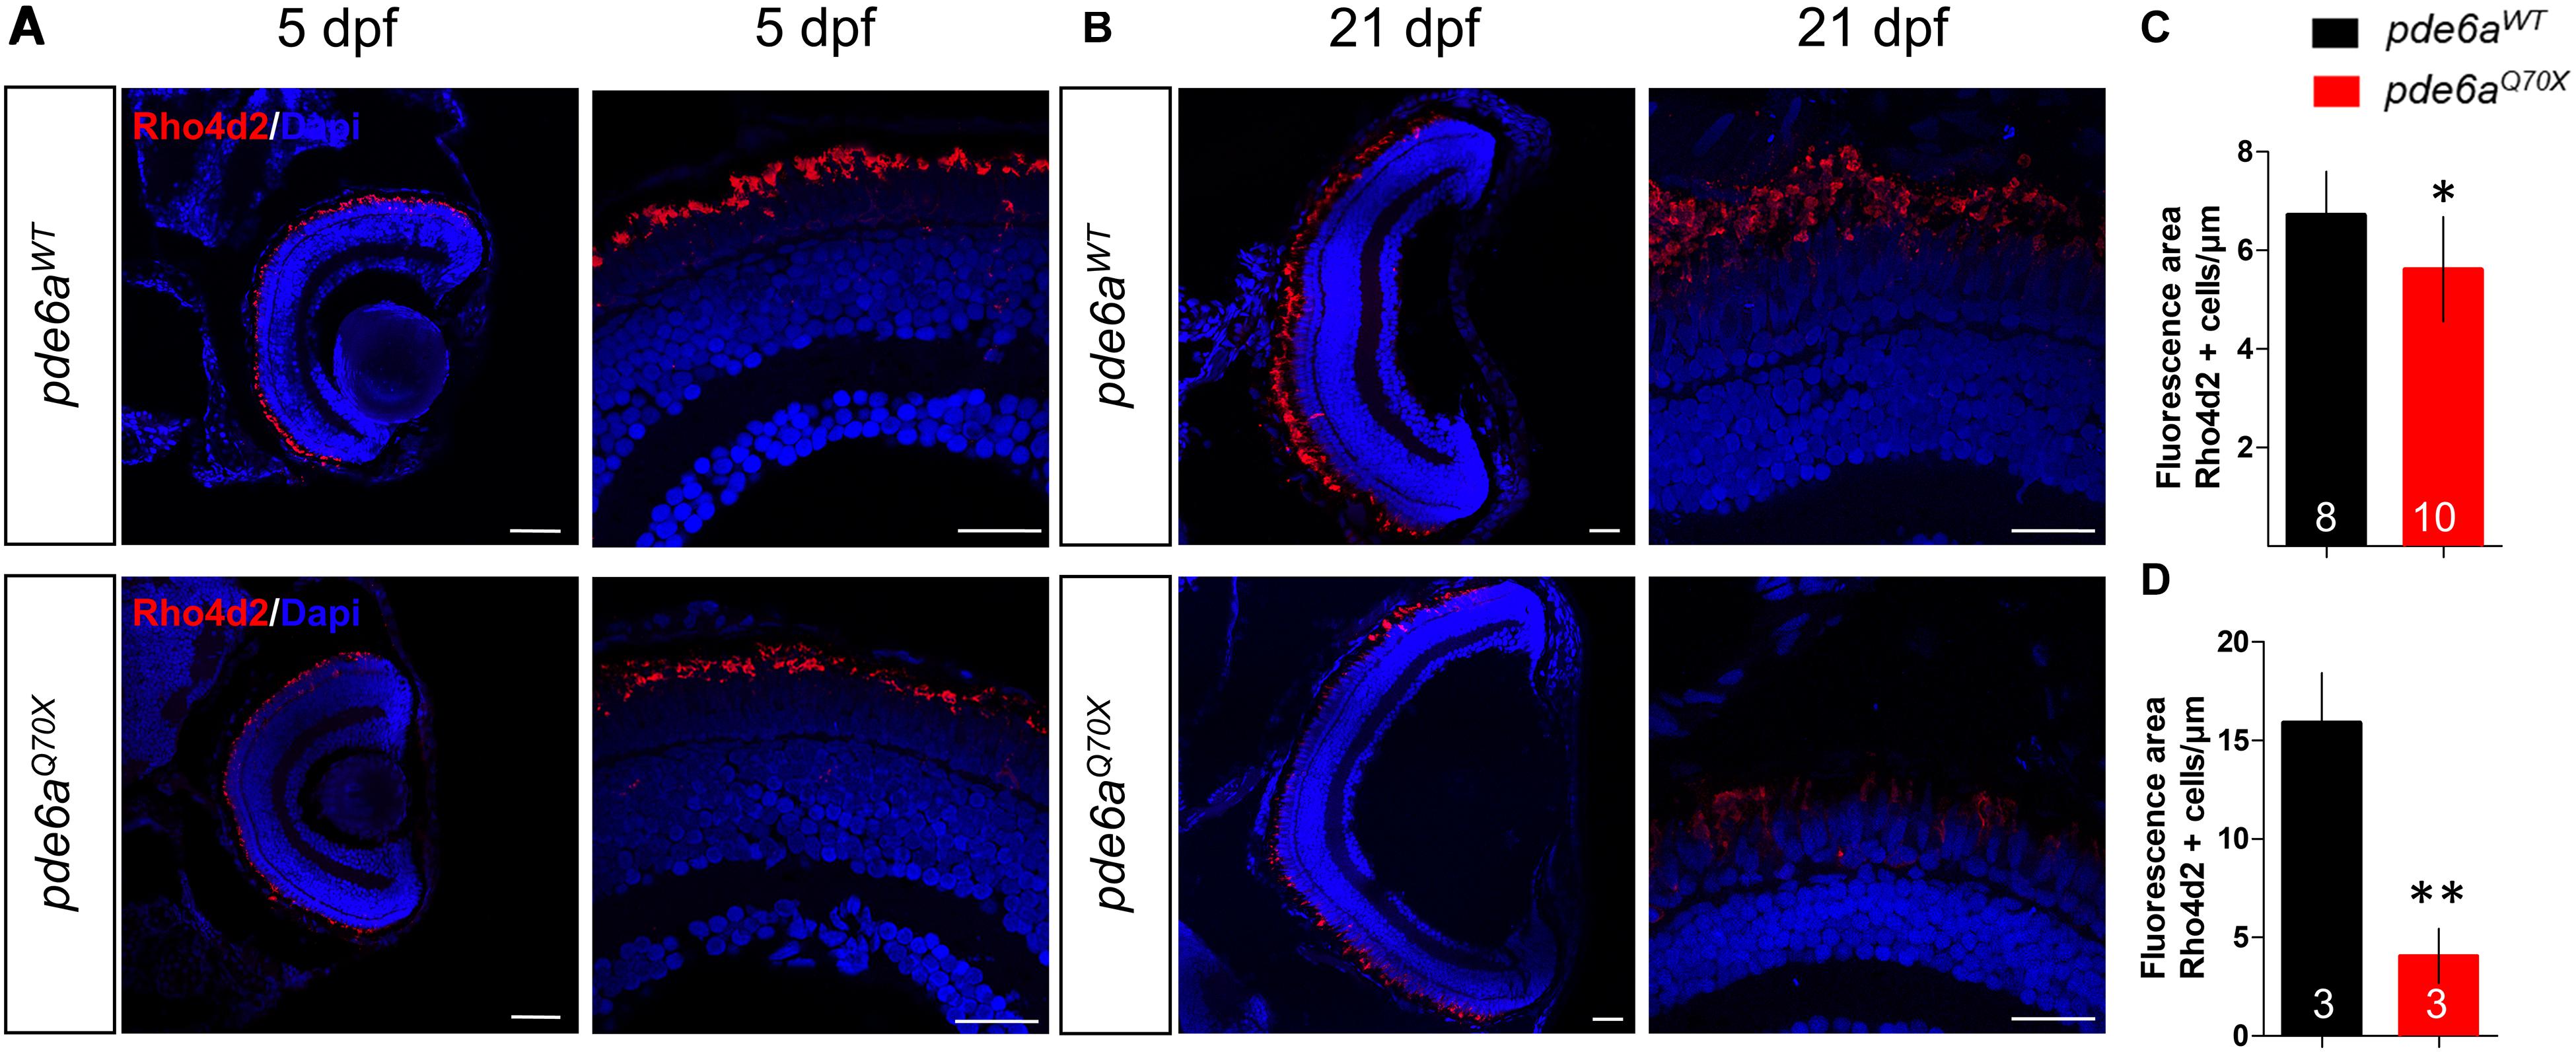
Figure 6. Analysis of rods in pde6aQ70X zebrafish during development. Representative confocal images of the retina of pde6aWT and pde6aQ70X zebrafish obtained after immunostaining of rods with a Rho4d2 antibody highlighting Rhodopsin (red) at 5 dpf (A) and 21 dpf (B). The nuclei were counterstained with DAPI (blue). Scale bar = 30 μm. (C,D) Quantification of the total area of rod outer segments normalized against the length of the retinal section, based on three independent measurements of larvae per group at 5 dpf (C) and 21 dpf (D). The number of animals is indicated within the columns. ∗p < 0.05, ∗∗p < 0.01.
Cone Photoreceptor Number Is Slightly Decreased in pde6aQ70X Mutants
Since RP is a rod-cone dystrophy, the degeneration of the rods is supposed to be followed by cone degeneration. To check this hypothesis, we analyzed cone presence using the cone specific antibody Zpr-1. At 5 dpf, the number of cones present in the retina of pde6aQ70X larvae (0.25 cone/μm of retina section ± 0.006) was unchanged as compared to pde6aWT (0.24 ± 0.009) (Figures 7A,C). However, at 21 dpf the number of cones of the pde6aQ70X larvae decreased significantly as compared to pde6aWT (0.20 Zpr-1 positive cell/μm ± 0.004 vs. 0.23 Zpr-1 positive cell/μm ± 0.006, p < 0.001) (Figures 7B,D).
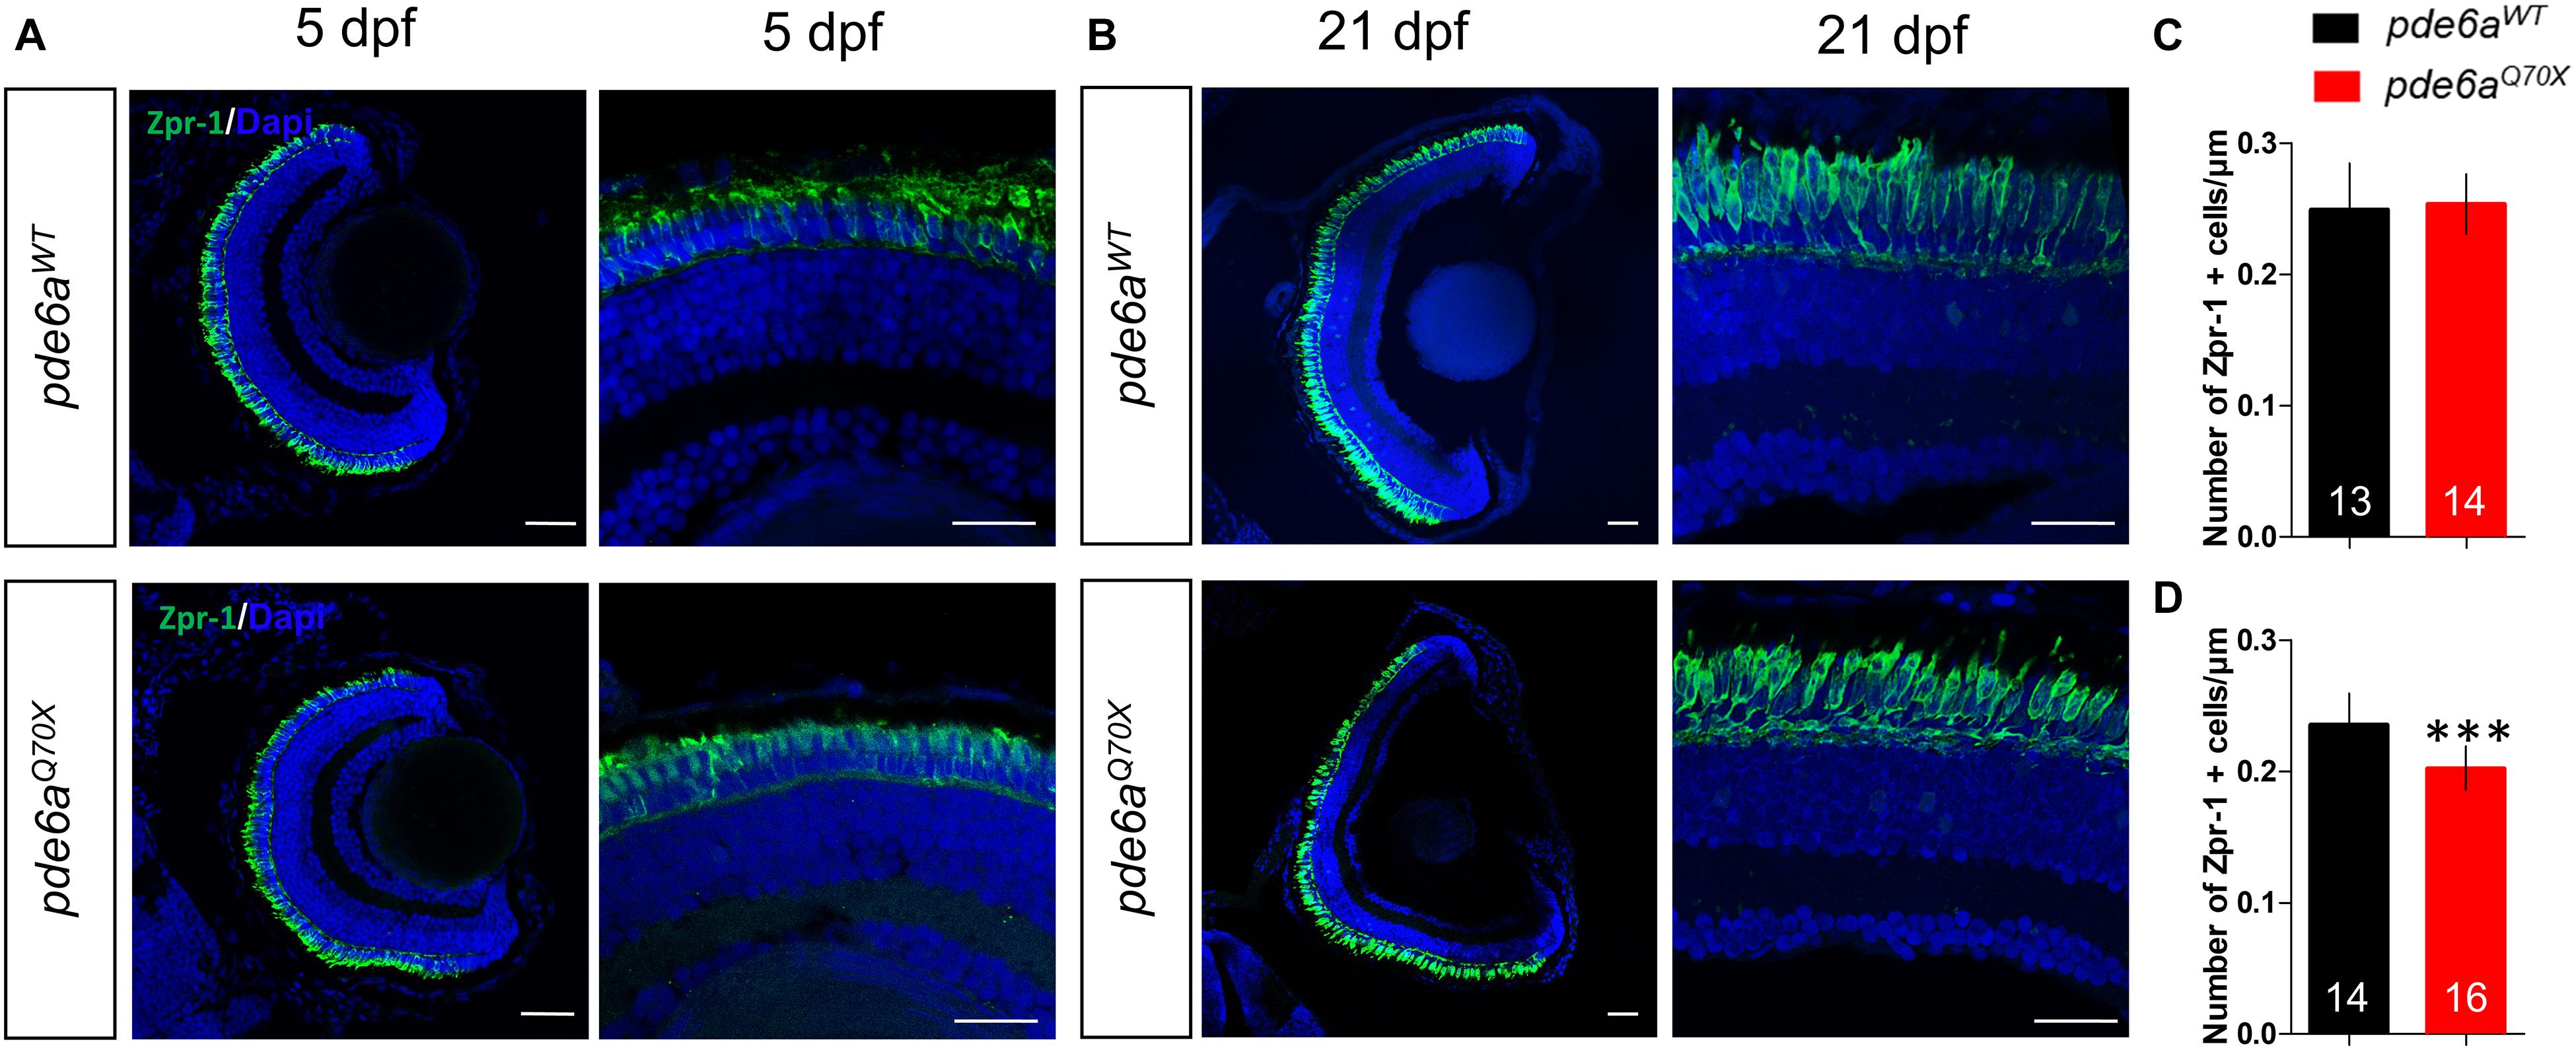
Figure 7. Analysis of cones in pde6aQ70X zebrafish during development. Representative confocal images of the retina of pde6aWT and pde6aQ70X zebrafish obtained after immunostaining of cones with a Zpr-1 antibody (green) at 5 dpf (A) and 21 dpf (B). Nuclei were highlighted with DAPI (blue). Scale bar = 30 μm. (C,D) Quantification of the number of cones normalized against the length of the retinal section, based on three independent measurements of larvae per group at 5 dpf (C) and 21 dpf (D). The number of animals is indicated within the columns. ∗∗∗p < 0.001.
Photoreceptors Degenerate by Apoptosis in pde6aQ70X Mutants
As photoreceptor degeneration is mainly due to apoptosis, we used a specific antibody that recognized activated Caspase-3 to evaluate the apoptotic cell death in the retina. Indeed, this protease enzyme is activated in the apoptotic cell by both extrinsic (death ligand) and intrinsic (mitochondrial) pathways (Salvesen, 2002). At 5 dpf, the number of cleaved-Caspase-3 positive cells present in the retina was higher in pde6Q70X (1.3 Caspase-3 positive cell/retinal section ± 0.15) compared to pde6aWT (0.67 ± 0.15 Caspase-3 positive cell/retinal section) (Figures 8A,C) in the outer nuclear layer (ONL). This number was accentuated with development and was much higher in pde6Q70X (1.8 Caspase-3 positive cell/retinal section ± 0.19) compared to pde6aWT (0.51 Caspase-3 positive cell/retinal section ± 0.14) at 21 dpf (Figures 8B,D) in the ONL.
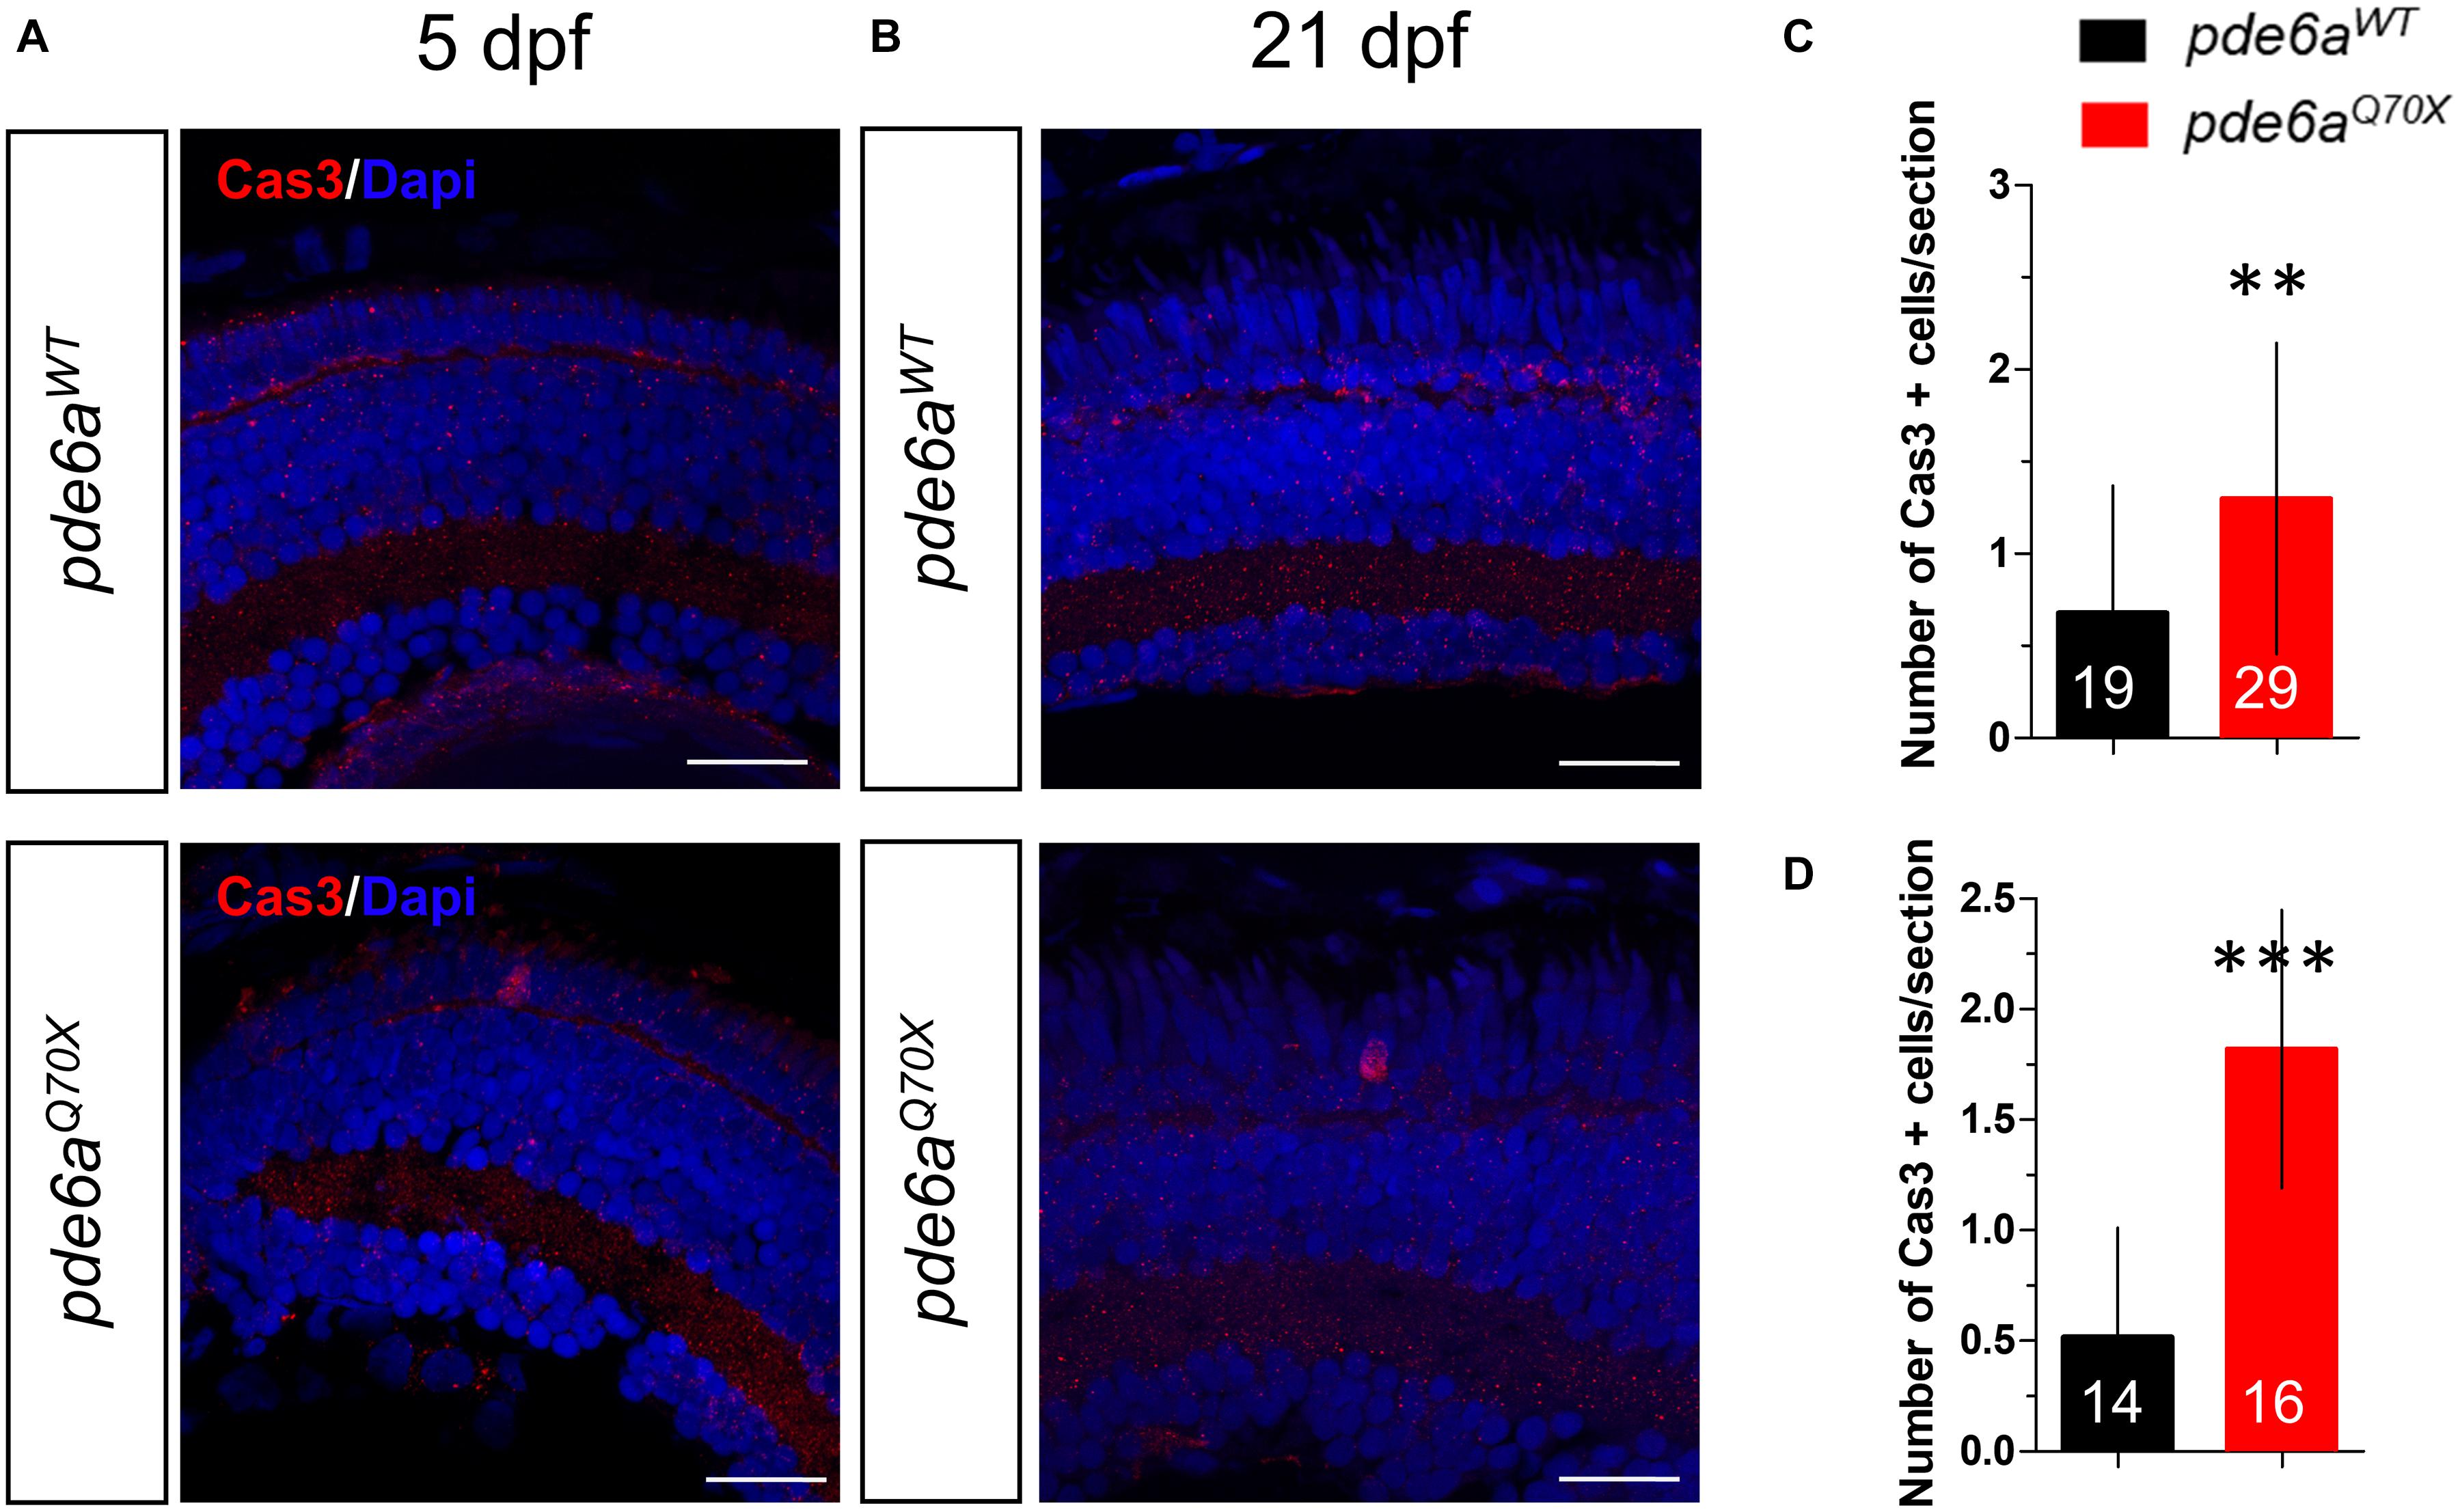
Figure 8. Analysis of activated Caspase-3 positive cells in pde6aQ70X zebrafish during development. (A,B) Representative confocal images of the retina of pde6aWT and pde6aQ70X zebrafish obtained after immunostaining of the retinal section with activated Caspase-3 antibody (red) at 5 dpf (A) and 21 dpf (B). Nuclei were highlighted with DAPI (blue). Scale bar = 30 μm. (C,D) Quantification of the number of activated Caspase-3 positive cells in the entire retina based on three independent measurements of larvae per group at 5 dpf (C) and 21 dpf (D). The number of animals is indicated within the columns. ** p < 0.01, ***p < 0.001.
Discussion
The aim of this study was to generate and characterize a new zebrafish model of RP, the pde6aQ70X line. pde6a gene, encoding the alpha subunit of cyclic phosphodiesterase 6-GMP (cGMP), is expressed in the retinal rods. Mutations in human induce RP (Dryja et al., 1995; Huang et al., 1995; Khan et al., 2015; Sothilingam et al., 2015; Ullah et al., 2016). This pathology, characterized by night blindness developing during childhood, is due to photoreceptor degeneration (Huang et al., 1995). In mice, mutation of Pde6a leads to a rapid degeneration of rod photoreceptors followed by cone degeneration (Sakamoto et al., 2009). Interestingly, two mouse models were analyzed with different mutations in Pde6a. The pace of the degeneration varied, depending on the mutation Pde6anmf282/nmf282 (V685M) or Pde6anmf363/nmf363 (D670G). Indeed, the V685M lead to an earlier and faster photoreceptor degeneration than the one observed in mice harboring the D670G mutation, suggesting that some amino acids are more important for the function of the protein. Since the majority of the patients present with compound heterozygous mutations, Sothilingam et al. (2015) compared the severity of the phenotypes between three disease-causing variants, R562W, D670G, and V685M. They concluded that the severity depends on the mutation, confirming previous observations (Sakamoto et al., 2009). Finally, a mutation of Pde6a was identified in dog (Petersen-Jones et al., 1999). The sequence of the canine genomic DNA showed a 1-bp deletion in codon 616 of Pde6a, resulting in a frame shift leading to a stretch of 28 altered amino acids followed by a premature stop codon (Petersen-Jones et al., 1999). The dogs developed a massive photoreceptors degeneration as early as 5 weeks-old (Tuntivanich et al., 2009). By the age of 9 weeks, few cone cells were present while all rods had degenerated. This degeneration is associated with a complete loss of rod function measured by white-light flicker response (Tuntivanich et al., 2009).
Up to now, there is no treatment available to block the progression of the photoreceptor degeneration. Ongoing preclinical studies focused on the use of gene therapy. This approach was tested in mouse (Schon et al., 2017) and dog (Mowat et al., 2017; Occelli et al., 2017) but some adverse effects were described (Mowat et al., 2017). Altogether, these trials suggested that gene therapy may be used to correct the deficits observed in patients. However, these data should be taken with caution since the positive effect seemed limited to the site of injection. Another way to block or delay the progression of the photoreceptor degeneration in Pde6a patients may be the use of active molecules. The identification of good candidate(s) necessitates to screen huge batches of molecules. This method needs a relevant model that allows high throughput screening. In addition, to improve the efficacy of the molecules, in vivo models should be prioritized. One model recapitulates these two prerequisites, the zebrafish. Indeed, in recent years, zebrafish has emerged as an excellent model system for chemical screening (MacRae and Peterson, 2015; Rennekamp and Peterson, 2015; Brady et al., 2016). Zebrafish has been used to identify novel drugs or repurpose already used drugs in the indications of epilepsy, hearing loss, and cardiovascular system disorders (MacRae and Peterson, 2015). Very interestingly, zebrafish has become an extremely popular and useful animal model in the visual field (Ganzen et al., 2017). Indeed, zebrafish eye shares important similarities with the human eye. Notably, zebrafish have a canonical vertebrate retina composed of three nuclear layers, two plexiform layers, five neuronal cell types (photoreceptors, horizontal, bipolar, amacrine, ganglion cells) and one major glial cell type (Müller glia). Moreover, their retina contains two types of photoreceptors, rods and cones. Contrary to mouse models, zebrafish are, like human, diurnal. Interestingly, there is an increasing number of transgenic zebrafish models of retinal disease (Link and Collery, 2015). Finally, novel device allows the analysis of zebrafish vision in high-throughput screening using the VMR. The VMR is a vision-mediated startle response, initiated by a drastic change in illumination (Emran et al., 2008). In a typical VMR assay, larvae of 5 dpf are individually placed in a 96 multi-well plate placed inside a lightproof machine to isolate them from external disturbances and environmental light (Ganzen et al., 2017). Recently, this methodological approach has led to the identification of ocular antiangiogenic drugs (Ohnesorge et al., 2019).
In our study, we characterized a novel mutant zebrafish: pde6aQ70X which developed visual impairment as soon as 5 dpf as evidenced by our modified VMR experiments. These defects aggravated with age and were correlated with photoreceptor alteration. The loss of Pde6a could lead to rod degeneration or an alteration of their outer segments only. The decreased size of the area labeled with rhodopsin is not sufficient to have a clear answer. Nevertheless, since the number of apoptotic cells in the outer nuclear layer was modest, the most plausible explanation is that Pde6a deficiency leads to a reduced outer segment area rather than a drastic loss of rods at 21 dpf.
This modification was also associated with a slight loss of cones. Since the number of photoreceptors labeled with activated capase-3 is limited, it is challenging to determine if the decreased number of cones at 21 dpf is mainly due to apoptotic cell death or a reduction of cell differentiation in the retinal ciliary marginal zone. Moreover, although statistically significant, this loss is probably not sufficient to have a physiological relevance. Zebrafish vision is more driven by cones than rods due to the higher proportion of cones (60%) (Fadool, 2003; Angueyra and Kindt, 2018). Consequently, as pde6aQ70X zebrafish kept their ability to feed and lived normally until adult stage, the slight cone loss might only have a weak impact on vision, if any. In addition, since rod degeneration is not always followed by cone degeneration as observed when Rhodospin is mutated (Zelinka et al., 2018; Santhanam et al., 2020), or missorted (Morris et al., 2005), Pde6a deficiency may lead to rod outer segment shrinkage without gross alteration of cones at 21 dpf. Moreover, studies involving other key proteins such as IFT88, a cilium protein (Nakao et al., 2012), or toxic agents (Montgomery et al., 2010) did not report this sequential degeneration neither. In mammals, rods represent 90% of the photoreceptors and secrete RdCVF, a rod-derived cone viability factor (Ait-Ali et al., 2015). In contrast, in the zebrafish, rods are present in a lower proportion and their loss should have a limited impact on cone survival as hypothesized by Jaroszynska et al. (2021).
Function of rod photoreceptors in zebrafish larvae is still under debate but our data strongly support the important function of the rods in larval visual physiology. Our results are in accordance with the recent work by Venkatraman et al. (2020) who demonstrated the role of rods in larval visual activity. Another study demonstrated that VMR and OKR were altered, at 5dpf, in slc7A14 knock-down zebrafish larvae, another model of RP (Zhuang et al., 2019). Interestingly, these deficits are supposed to be linked to an alteration of rods and retinal pigment epithelium (RPE), since no cone defects were observed. Nevertheless, we can’t exclude that the effect on OKR is due to defective RPE rather than defective rods. Finally, loss of Pde6a in our mutant zebrafish did not induce Pde6b overexpression, ruling out a potential rod preservation through a compensatory mechanism despite the recent demonstration that a pre-mature termination codon and a homologous sequence are required to elicit a gene compensation (Peng, 2019).
Conclusion
In conclusion, the aim of this work was to generate and characterize a novel zebrafish model for pde6a mutations. The pde6aQ70X mutant zebrafish developed a visual defect as early as 5 dpf, that worsen with development. Our model could be used to efficiently screen active molecules that will block the alteration of the photoreceptors. Very interestingly, all molecules that will block this degeneration might be relevant to treat other form of RP such as Usher syndrome.
Data Availability Statement
The raw data supporting the conclusions of this article will be made available by the authors, without undue reservation.
Ethics Statement
Ethical review and approval were not required for the animal study because experiments were designed and performed according to EU directive 2010/63/UE and French application decree 2013-118. In particular, most of the experiments were done with 5 dpf larvae which are out of the scope of the regulation. Regarding P21 zebrafish, Art. R. 214-88 stipulates that practices which are likely to cause pain, suffering, anguish or lasting damage less than those caused by the introduction of a needle carried out in accordance with good veterinary practice does not need ethical committee authorization. Experiments consisted only in the observation of the spontaneous behavior of the animals and thus also were out of the scope of the regulation.
Author Contributions
BD and TM conceived and designed experiments. LC, ER, CD, CB, TD and MR performed the experiments and analyzed the data. NC took care of the zebrafish. BD and LC wrote the manuscript. All authors contributed to the article and approved the submitted version.
Funding
We are indebted to the Institut National de la Santé et de la Recherche Médicale (INSERM), Université de Montpellier and Ecole Pratique des Hautes Etudes for providing institutional supports. This work was supported by grants from the association SOS Rétinite France for the funding of the ZebraSens platform and for supporting (LC).
Conflict of Interest
The authors declare that the research was conducted in the absence of any commercial or financial relationships that could be construed as a potential conflict of interest.
Acknowledgments
This work is a project of the ZebraSens phenotyping platform for zebrafish models (MMDN, Montpellier). We acknowledge the imaging facility MRI, member of the national infrastructure France-BioImaging supported by the French National Research Agency (ANR-10-INBS-04, ≪Investments for the future≫) and are indebted to the sequencing facility of the Institute of Neuroscience of Montpellier.
Footnotes
References
Ait-Ali, N., Fridlich, R., Millet-Puel, G., Clerin, E., Delalande, F., Jaillard, C., et al. (2015). Rod-derived cone viability factor promotes cone survival by stimulating aerobic glycolysis. Cell 161, 817–832. doi: 10.1016/j.cell.2015.03.023
Angueyra, J. M., and Kindt, K. S. (2018). Leveraging Zebrafish to study retinal degenerations. Front. Cell Dev. Biol. 6:110. doi: 10.3389/fcell.2018.00110
Aravind, L., and Ponting, C. P. (1997). The GAF domain: an evolutionary link between diverse phototransducing proteins. Trends Biochem. Sci. 22, 458–459. doi: 10.1016/s0968-0004(97)01148-1
Brady, C. A., Rennekamp, A. J., and Peterson, R. T. (2016). Chemical screening in zebrafish. Methods Mol. Biol. 1451, 3–16.
Corbin, J. D., Turko, I. V., Beasley, A., and Francis, S. H. (2000). Phosphorylation of phosphodiesterase-5 by cyclic nucleotide-dependent protein kinase alters its catalytic and allosteric cGMP-binding activities. Eur. J. Biochem. 267, 2760–2767. doi: 10.1046/j.1432-1327.2000.01297.x
Dryja, T. P., Finn, J. T., Peng, Y. W., Mcgee, T. L., Berson, E. L., and Yau, K. W. (1995). Mutations in the gene encoding the alpha subunit of the rod cGMP-gated channel in autosomal recessive retinitis pigmentosa. Proc. Natl. Acad. Sci. U.S.A. 92, 10177–10181.
Emran, F., Rihel, J., and Dowling, J. E. (2008). A behavioral assayto measure responsiveness of zebrafish to changes in light intensities. J. Vis. Exp. 20:923. doi: 10.3791/923
Fadool, J. M. (2003). Rod genesis in the teleost retina as a model of neural stem cells. Exp. Neurol. 184, 14–19. doi: 10.1016/s0014-4886(03)00309-1
Fu, Y. (1995). “Phototransduction in rods and cones,” in Webvision: The Organization of the Retina and Visual System, eds H. Kolb, E. Fernandez, and R. Nelson (Salt Lake City, UT: University of Utah Health Sciences Center).
Ganzen, L., Venkatraman, P., Pang, C. P., Leung, Y. F., and Zhang, M. (2017). Utilizing zebrafish visual behaviors in drug screening for retinal degeneration. Int. J. Mol. Sci. 18:1185. doi: 10.3390/ijms18061185
Gillespie, P. G., and Beavo, J. A. (1989). cGMP is tightly bound to bovine retinal rod phosphodiesterase. Proc. Natl. Acad. Sci. U.S.A. 86, 4311–4315.
Heikaus, C. C., Pandit, J., and Klevit, R. E. (2009). Cyclic nucleotide binding GAF domains from phosphodiesterases: structural and mechanistic insights. Structure 17, 1551–1557.
Howe, K., Clark, M. D., Torroja, C. F., Torrance, J., Berthelot, C., Muffato, M., et al. (2013). The zebrafish reference genome sequence and its relationship to the human genome. Nature 496, 498–503.
Huang, S. H., Pittler, S. J., Huang, X., Oliveira, L., Berson, E. L., and Dryja, T. P. (1995). Autosomal recessive retinitis pigmentosa caused by mutations in the alpha subunit of rod cGMP phosphodiesterase. Nat. Genet. 11, 468–471. doi: 10.1038/ng1295-468
Jaroszynska, N., Harding, P., and Moosajee, M. (2021). Metabolism in the zebrafish retina. J. Dev. Biol. 9:10.
Kawamura, S., and Tachibanaki, S. (2008). Rod and cone photoreceptors: molecular basis of the difference in their physiology. Comp. Biochem. Physiol. A Mol. Integr. Physiol. 150, 369–377.
Khan, S. Y., Ali, S., Naeem, M. A., Khan, S. N., Husnain, T., Butt, N. H., et al. (2015). Splice-site mutations identified in PDE6A responsible for retinitis pigmentosa in consanguineous Pakistani families. Mol. Vis. 21, 871–882.
Link, B. A., and Collery, R. F. (2015). Zebrafish models of retinal disease. Annu. Rev. Vis. Sci. 1, 125–153.
MacRae, C. A., and Peterson, R. T. (2015). Zebrafish as tools for drug discovery. Nat. Rev. Drug Discov. 14, 721–731.
Meeker, N. D., Hutchinson, S. A., Ho, L., and Trede, N. S. (2007). Method for isolation of PCR-ready genomic DNA from zebrafish tissues. Biotechniques 43, 610,612,614. doi: 10.2144/000112619
Montgomery, J. E., Parsons, M. J., and Hyde, D. R. (2010). A novel model of retinal ablation demonstrates that the extent of rod cell death regulates the origin of the regenerated zebrafish rod photoreceptors. J. Comp. Neurol. 518, 800–814. doi: 10.1002/cne.22243
Morris, A. C., Schroeter, E. H., Bilotta, J., Wong, R. O., and Fadool, J. M. (2005). Cone survival despite rod degeneration in XOPS-mCFP transgenic zebrafish. Invest. Ophthalmol. Vis. Sci. 46, 4762–4771. doi: 10.1167/iovs.05-0797
Mowat, F. M., Occelli, L. M., Bartoe, J. T., Gervais, K. J., Bruewer, A. R., Querubin, J., et al. (2017). Gene therapy in a large animal model of PDE6A-retinitis pigmentosa. Front. Neurosci. 11:342. doi: 10.3389/fnins.2017.00342
Nakao, T., Tsujikawa, M., Notomi, S., Ikeda, Y., and Nishida, K. (2012). The role of mislocalized phototransduction in photoreceptor cell death of retinitis pigmentosa. PLoS One 7:e32472. doi: 10.1371/journal.pone.0032472
Occelli, L. M., Schon, C., Seeliger, M. W., Biel, M., Michalakis, S., Petersen-Jones, S., et al. (2017). Gene supplementation rescues rod function and preserves photoreceptor and retinal morphology in dogs, leading the way towards treating human PDE6A-retinitis pigmentosa. Hum. Gene Ther. 28, 1189–1201. doi: 10.1089/hum.2017.155
Ohnesorge, N., Sasore, T., Hillary, D., Alvarez, Y., Carey, M., and Kennedy, B. N. (2019). Orthogonal drug pooling enhances phenotype-based discovery of ocular antiangiogenic drugs in zebrafish larvae. Front. Pharmacol. 10:508. doi: 10.3389/fphar.2019.00508
Peng, J. (2019). Gene redundancy and gene compensation: an updated view. J. Genet. Genomics 46, 329–333. doi: 10.1016/j.jgg.2019.07.001
Petersen-Jones, S. M., Entz, D. D., and Sargan, D. R. (1999). cGMP phosphodiesterase-alpha mutation causes progressive retinal atrophy in the Cardigan Welsh corgi dog. Invest. Ophthalmol. Vis. Sci. 40, 1637– 1644.
Rennekamp, A. J., and Peterson, R. T. (2015). 15 years of zebrafish chemical screening. Curr. Opin. Chem. Biol. 24, 58–70.
Sakamoto, K., Mccluskey, M., Wensel, T. G., Naggert, J. K., and Nishina, P. M. (2009). New mouse models for recessive retinitis pigmentosa caused by mutations in the Pde6a gene. Hum. Mol. Genet. 18, 178–192. doi: 10.1093/hmg/ddn327
Salvesen, G. S. (2002). Caspases: opening the boxes and interpreting the arrows. Cell Death Differ. 9, 3–5. doi: 10.1038/sj.cdd.4400963
Santhanam, A., Shihabeddin, E., Atkinson, J. A., Nguyen, D., Lin, Y. P., and O’brien, J. (2020). A zebrafish model of retinitis pigmentosa shows continuous degeneration and regeneration of rod photoreceptors. Cells 9:2242. doi: 10.3390/cells9102242
Schon, C., Sothilingam, V., Muhlfriedel, R., Garcia Garrido, M., Beck, S. C., Tanimoto, N., et al. (2017). Gene therapy successfully delays degeneration in a mouse model of PDE6A-linked retinitis pigmentosa (RP 43). Hum. Gene Ther. 28, 1180–1188. doi: 10.1089/hum.2017.156
Sothilingam, V., Garcia Garrido, M., Jiao, K., Buena-Atienza, E., Sahaboglu, A., Trifunovic, D., et al. (2015). Retinitis pigmentosa: impact of different Pde6a point mutations on the disease phenotype. Hum. Mol. Genet. 24, 5486–5499. doi: 10.1093/hmg/ddv275
Takahashi, V. K. L., Takiuti, J. T., Jauregui, R., Lima, L. H., and Tsang, S. H. (2018). Structural disease progression in PDE6-associated autosomal recessive retinitis pigmentosa. Ophthalmic Genet. 39, 610–614. doi: 10.1080/13816810.2018.1509354
Tsang, S. H., and Sharma, T. (2018a). Autosomal dominant retinitis pigmentosa. Adv. Exp. Med. Biol. 1085, 69–77.
Tsang, S. H., and Sharma, T. (2018b). Retinitis pigmentosa (Non-syndromic). Adv. Exp. Med. Biol. 1085, 125–130.
Tuntivanich, N., Pittler, S. J., Fischer, A. J., Omar, G., Kiupel, M., Weber, A., et al. (2009). Characterization of a canine model of autosomal recessive retinitis pigmentosa due to a PDE6A mutation. Invest. Ophthalmol. Vis. Sci. 50, 801–813. doi: 10.1167/iovs.08-2562
Ullah, I., Kabir, F., Gottsch, C. B., Naeem, M. A., Guru, A. A., Ayyagari, R., et al. (2016). Mutations in phosphodiesterase 6 identified in familial cases of retinitis pigmentosa. Hum. Genome Var. 3:16036.
Venkatraman, P., Mills-Henry, I., Padmanabhan, K. R., Pascuzzi, P., Hassan, M., Zhang, J., et al. (2020). Rods contribute to visual behavior in larval zebrafish. Invest. Ophthalmol. Vis. Sci. 61:11. doi: 10.1167/iovs.61.12.11
Verbakel, S. K., Van Huet, R. A. C., Boon, C. J. F., Den Hollander, A. I., Collin, R. W. J., Klaver, C. C. W., et al. (2018). Non-syndromic retinitis pigmentosa. Prog. Retin. Eye Res. 66, 157–186.
Zelinka, C. P., Sotolongo-Lopez, M., and Fadool, J. M. (2018). Targeted disruption of the endogenous zebrafish rhodopsin locus as models of rapid rod photoreceptor degeneration. Mol. Vis. 24, 587–602.
Keywords: PDE6A, retinitis pigmentosa, photoreceptors, rods, cones, zebrafish
Citation: Crouzier L, Diez C, Richard EM, Cubedo N, Barbereau C, Rossel M, Delaunay T, Maurice T and Delprat B (2021) Loss of Pde6a Induces Rod Outer Segment Shrinkage and Visual Alterations in pde6aQ70X Mutant Zebrafish, a Relevant Model of Retinal Dystrophy. Front. Cell Dev. Biol. 9:675517. doi: 10.3389/fcell.2021.675517
Received: 03 March 2021; Accepted: 26 April 2021;
Published: 20 May 2021.
Edited by:
Jeff S. Mumm, Johns Hopkins University, United StatesReviewed by:
Ann C. Morris, University of Kentucky, United StatesFrancois Paquet-Durand, University of Tübingen, Germany
Copyright © 2021 Crouzier, Diez, Richard, Cubedo, Barbereau, Rossel, Delaunay, Maurice and Delprat. This is an open-access article distributed under the terms of the Creative Commons Attribution License (CC BY). The use, distribution or reproduction in other forums is permitted, provided the original author(s) and the copyright owner(s) are credited and that the original publication in this journal is cited, in accordance with accepted academic practice. No use, distribution or reproduction is permitted which does not comply with these terms.
*Correspondence: Benjamin Delprat, YmVuamFtaW4uZGVscHJhdEBpbnNlcm0uZnI=