
95% of researchers rate our articles as excellent or good
Learn more about the work of our research integrity team to safeguard the quality of each article we publish.
Find out more
ORIGINAL RESEARCH article
Front. Cell Dev. Biol. , 21 April 2021
Sec. Molecular and Cellular Oncology
Volume 9 - 2021 | https://doi.org/10.3389/fcell.2021.670019
This article is part of the Research Topic Unveiling the Impact of Local or Systemic Therapeutic Strategies on the Tumor Microenvironment View all 19 articles
Novel therapy strategies are crucial for thyroid carcinoma treatment. It is increasingly important to clarify the mechanism of thyroid carcinoma progression. Several studies demonstrate that α-Enolase (ENO1) participates in cancer development; nevertheless, the role of ENO1 in thyroid carcinoma progression remains unclear. In the present study, we found that the expression of ENO1 was upregulated in thyroid carcinoma samples. Proliferation and migration of thyroid carcinoma cells were suppressed by depletion of ENO1; conversely, ENO1 overexpression promoted thyroid carcinoma cell growth and invasion. To elucidate the mechanisms, we found that the hypoxia-related mTOR/HIF1 pathway regulated ENO1 expression. ENO1 regulated the expression of CST1; knockdown of CST1 reversed the tumorigenicity enhanced by ENO1 overexpression. Taken together, our findings provide a theoretical foundation for thyroid carcinoma treatment.
The thyroid gland is the largest endocrine organ in humans; it regulates systemic metabolism (Kondo et al., 2006). Thyroid carcinoma (THCA) is the most frequent malignancy in endocrine organs (Hundahl et al., 1998; Parkin et al., 2005; Kondo et al., 2006; Sipos and Mazzaferri, 2010). More than 85% of thyroid carcinomas arise from follicular epithelial cells, most of which are indolent tumors that can be cured with surgical resection or a combination of radioactive-iodine ablation (Kondo et al., 2006; Paschke et al., 2015). Nevertheless, there is a subset of aggressive thyroid tumors that cannot be treated effectively with current therapies (Kondo et al., 2006). To more efficiently manage thyroid carcinomas, additional effective therapeutic strategies are needed.
A better understanding of thyroid carcinoma means better diagnosis and effective therapy; thus, thyroid carcinoma mortality will further decrease. Over recent decades, the increased incidence of thyroid carcinoma is most likely the result of a better understanding of the genetic pathogenesis and more efficient detection methods (Kondo et al., 2006; Sipos and Mazzaferri, 2010; La Vecchia et al., 2015; Davies, 2016). For example, the incidence increased 311% from 1975 to 2013 in the United States and 150% from 1998 to 2010 in Germany (Paschke et al., 2015; Lim et al., 2017). Meanwhile, thyroid carcinoma mortality has declined (Sipos and Mazzaferri, 2010; La Vecchia et al., 2015; Paschke et al., 2015), primarily due to more sensitive diagnostic tools and more effective therapies, especially rapidly emerging novel targeted strategies (Sipos and Mazzaferri, 2010; La Vecchia et al., 2015). Thus, there is a very high 5-year survival rate (93% for women and 88% for men) for well-differentiated thyroid carcinoma (Paschke et al., 2015).
Clarifying the mechanism of thyroid carcinoma progression is critical for targeted therapy strategy. To date, at least four thyroid carcinoma types have been reported: papillary thyroid carcinoma (PTC), follicular thyroid carcinoma (FTC), anaplastic thyroid carcinoma, and medullary thyroid carcinoma (Sipos and Mazzaferri, 2010; Saiselet et al., 2012). Various mutations causing increased cellular proliferation and dedifferentiation have been characterized for each thyroid carcinoma type (Catalano et al., 2010). BRAF point mutations and RET/PTC rearrangements account for 40–60% and 20% of PTC, respectively; these markers can be used to diagnose and treat the most aggressive PTC (Kondo et al., 2006; Xing, 2010). For FTC, the most frequent mutations are RAS point mutations (45% of cases) and PAX8/PPARγ rearrangements (35% of cases). For RAS mutations, MAPK and PI3K pathways could be therapeutic targets (Saavedra et al., 2000; Mitsutake et al., 2005; Knauf et al., 2006). Other mutations have also been described in FTC, including the tumor suppressor gene PTEN (10% of cases) and the PI3KCA oncogenes (10% of cases) (Saiselet et al., 2012). Nevertheless, these are insufficient; more targeted genes and pathways need to be identified.
Cancer cell prefers to metabolize glucose through glycolysis pathway even when oxygen is abundant, a phenomenon called “aerobic glycolysis” or “Warburg effect” (Koppenol et al., 2011). Aerobic glycolysis is driven by activation or upregulation of glycolytic enzymes, such as hexokinase (HK) isoforms, enolase (ENO), and pyruvate kinase (PK). It is well documented that HK2/PKM2 activation of glycolysis contributes to the development of thyroid carcinoma (Coelho et al., 2018). However, the significance of a-Enolase (ENO1) is less unknown in thyroid carcinogenesis. ENO1 is another critical enzyme of the glycolytic pathway expressed in nearly all kinds of tissues (Pancholi, 2001; Zakrzewicz et al., 2014). ENO1 plays critical and multifunctional roles in various physiological and pathological processes (Pancholi, 2001; Ejeskar et al., 2005; Diaz-Ramos et al., 2012; Principe et al., 2015; Capello et al., 2016), including tumorigenesis, cancer invasion, and metastasis (Hsiao et al., 2013; Song et al., 2014). Upregulation of ENO1 was detected in cancers of the stomach, breast, lung, colorectal, brain, kidney, liver, pancreas, and eye, as well as in non-Hodgkin’s lymphoma (Nakajima et al., 1986; Tu et al., 2010; Song et al., 2014; Fu et al., 2015; Liu et al., 2015; Principe et al., 2015; Zhu et al., 2015, 2018; Niccolai et al., 2016; Qian et al., 2017; Zhan et al., 2017). Ectopic ENO1 overexpression promoted tumor formation and tumor chemoresistance (Tu et al., 2010; Song et al., 2014; Fu et al., 2015; Principe et al., 2017; Qian et al., 2017; Zhan et al., 2017; Sun et al., 2019; Chen et al., 2020). Conversely, ENO1 silencing in tumor cells significantly decreased malignant biological behavior (Fu et al., 2015; Principe et al., 2015; Zhao et al., 2015; Capello et al., 2016; Cappello et al., 2017; Huang et al., 2019). Several lines of evidence suggest that ENO1 may be a therapeutic target for endometrial carcinoma (Principe et al., 2015; Zhao et al., 2015; Yin et al., 2018). Nevertheless, the role of ENO1 in human thyroid carcinoma and its putative targets have not been investigated. Therefore, exploring the upstream regulator, the downstream effector and the role of ENO1 in thyroid carcinoma can help the oncologists gain more insights into molecular events during the development of thyroid carcinoma.
mTOR (mechanistic target of rapamycin) is a master regulator of glucose metabolism whose action is mediated by activation of HIF1a (Majumder et al., 2004; Semenza, 2011; Chi, 2012; Cheng et al., 2014; Courtnay et al., 2015; Yang et al., 2015; Xiao et al., 2017). The hypoxia-related mTOR/HIF1α pathway also promotes cell proliferation and metastasis (Xiao et al., 2017; Wei et al., 2018; Pan et al., 2019; Zhang et al., 2019). Nevertheless, it is unclear whether the hypoxia-related mTOR/HIF1α pathway participates in thyroid carcinoma progression. CST1 (cystatin 1), a type 2 cystatin superfamily member, is a specific inhibitor of cysteine proteases (Dai et al., 2017; Oh et al., 2017; Jiang et al., 2018; Liu et al., 2019). Several studies demonstrated that CST1 was closely associated with cell proliferation and metastasis in various cancers, including cancer of the stomach, breast, colorectum, pancreas, and bile duct (Jiang et al., 2018; Cui et al., 2019; Liu et al., 2019; Wang et al., 2020). Wang et al. (2020) predicted that CST1 was a biomarker and therapeutic target for gastric cancer. Nevertheless, the role of CST1 in thyroid carcinoma has not yet been investigated.
In the present study, we demonstrated that ENO1 plays an oncogenic role in thyroid carcinoma progression. First, ENO1 was upregulated in thyroid carcinoma samples. Then, downregulation of ENO1 suppressed cell proliferation, invasion, and in vivo tumorigenicity by regulating the cell cycle and apoptosis. ENO1 overexpression promoted proliferation, invasion, and inhibited apoptosis. These findings suggested that ENO1 was an oncogene.
Regarding mechanism, we showed that ENO1 acted downstream of the hypoxia-related mTOR/HIF1a pathway. We demonstrated that ENO1 regulated CST1 expression and that these two proteins acted synergistically in thyroid carcinoma progression. In conclusion, we were the first to identify an oncogenic role of ENO1 in thyroid carcinoma; this will pave the way for a more efficient diagnosis and thyroid carcinoma therapy.
All clinical tissue samples from patients with PTC and normal adjacent tissues were obtained from populations in China and were collected at the Department of Head and Neck Surgical Oncology, Cancer Hospital, Chinese Academy of Medical Sciences and Peking Union Medical College between 2016 and 2019. The research was approved by the Ethics Committee of National Cancer Center/National Clinical Research Center for Cancer/Cancer Hospital, Chinese Academy of Medical Sciences and Peking Union Medical College and conducted under the guidance of the Declaration of Helsinki. Informed consent regarding the use of specimens was obtained from all patients.
TPC1 cells and BCPAP cells were cultured in DMEM/F-12 medium (Gibco, Thermo Fisher Scientific) supplemented with 2 mM glutamine, 10% fetal bovine serum (Gibco, Thermo Fisher Scientific), and 100 U/ml penicillin/streptomycin (Sigma, St. Louis, MO, United States). The cells were maintained at 37°C in a humidified atmosphere containing 5% CO2. Rapamycin (Sirolimus) was purchased from Selleck (Shanghai, China).
The siRNAs of ENO1 and CST1 were purchased from GenePharma. siCtrl: 5′-UUCUCCGAACGUGUCACGU-3′; siENO1#1: 5′-CGUACCGCUUCCUUAGAACUU-3′; siENO1 #2:5′-GAAUGUCAUCAAGGAGAAAUA-3′; siCST1#1:5′-CC ACCAAAGAUGACUACUA-3′; siCST1#2:5′-GCUCUUUCGAG AUCUACGA-3′; siCST4#1:5′-CUUUCGAGAUCUACGAAGU UCTT-3′; siCST1#2:5′-CCAUCAGCGAGUACAACAATT-3′. According to the manufacturer’s protocol, Lipofectamine RNAiMAX transfection reagent (Invitrogen; Thermo Fisher Scientific) was used for transfection of siRNA. Lipofectamine 3000 (Thermo Fisher Scientific) was used for plasmid overexpression.
CCK-8 reagent was purchased from Sigma. Cells seeded into a 96-well plate with a density of 2000 cells per well were maintained for the indicated days, followed by 10 μl CCK-8 reagent added to each well and incubated at 37°C for 3 h. The absorbance at 450 nm was measured using a microplate reader.
TPC1 and BCPAP cells were seeded into 6-well plates at 1,000 cells/well, and fresh culture medium was changed every 3 days. Colonies formed after culturing the cells for 14 days. After washing in phosphate-buffered saline (PBS) three times, colonies were fixed in 4% paraformaldehyde for 20 min and stained with GIEMSA staining solution for 20 min. Groups of more than 50 cells were identified as colonies.
TRIzol (Thermo Fisher Scientific) was used for the isolation of total RNAs from cells. The RNAs were reverse-transcribed using M-MLV-RTase (Promega) following the manufacturer’s protocol. The qRT-PCR analysis was performed using SYBR Master Mixture (TAKARA) on the Agilent MX3000p real-time PCR system. qRT-PCR primers were as follows: ENO1 forward, 5′-AAAGCTGGTGCCGTTGAGAA-3′ and reverse, 5′-GGTTGTGGTAAACCTCTGCTC-3′; CST1 forward 5′-GCCTGCGCCAAGAGACA-3′ and reverse, 5′-CCCTGC TGAGCAACAAAGGA-3′; CST4 forward 5′-CCTCTGTGTAC CCTGCTACTC-3′ and reverse, 5′-CTTCGGTGGCCTTG TTGTACT-3′; β-actin forward, 5′-GAGCTGCGTGTGGC TCCC-3′ and reverse, 5′-CCAGAGGCGTACAGGGAT AGCA-3′.
The eBioscienceTM Annexin V-FITC apoptosis detection kit (Thermo Fisher Scientific) was used to measure apoptosis. Suspending cells were incubated with 5 μL annexin V-FITC for 10–15 min. After incubation, cells were washed in 1× binding buffer, then resuspended in 1× binding buffer. Resuspended cells were incubated with propidium iodide (20 μg/mL). Finally, samples were subjected to flow cytometry.
FxCycle PI/RNase Staining Solution (Thermo Fisher Scientific) was used to analyze the cell cycle according to the manufacturer’s protocol. Briefly, cells were trypsinized and centrifuged at 13,000 rpm for 5 min. After washing in iced D-Hanks (pH = 7.2–7.4) buffer, cells were fixed with iced 75% ethanol for at least 1 h. Then, cells were centrifuged and washed in D-Hanks, followed by incubation in 0.5 mL of FxCycle PI/RNase staining solution for 15–30 min at room temperature. Finally, without washing, the analysis was performed using 488-nm excitation and 585/42-nm emission or the equivalent on the Guava easyCyte HT system (Millipore).
Cells were lysed with RIPA buffer with proteinase inhibitors. Protein concentrations were measured using the Bradford reagent (Sigma; Merck). Subsequently, 20 μg of total protein was subjected to 10% SDS-PAGE. Then proteins were transferred to nitrocellulose membranes and blocked with 5% non-fat milk at room temperature for 1 h. Membranes were incubated with antibodies against ENO1 (ABclonal, 1:2,000), HIF1a (Sigma, 1:2,000), β-actin (Sigma A5316, 1:5,000), and GAPDH (Proteintech, 1:5,000) at 4°C overnight, followed by secondary antibody (Thermo Fisher Scientific) at room temperature for 60 min.
We seeded 3.0 × 10⁴ cells/well into the upper chamber of 24-well Corning® FluoroBlok TM Cell Culture Inserts (NY, United States) to measure cell migration. The lower chambers were filled with DMEM/F-12 medium supplemented with 10% fetal bovine serum to serve as a chemoattractant. Finally, cells that migrated to the other side of the filter were stained with 0.5% crystal violet and counted under an inverted fluorescence microscope.
Cells were plated in 96-well plate and cultured overnight. Wounds were made in confluent monolayer cells using 96 Wounding Replicator (VP Scientific) and cells were cultured in medium supplemented with 1% FBS. Wound healing was detected at 0, 24 h or 0, 48 h for overexpression or knockdown, respectively. The representative fields at different time points were photographed.
The TargetScan database1 was used to predict potential targets of HIF1a (Jaiswal et al., 2019). The 3′ untranslated region (UTR) of the ENO1 sequence was amplified and cloned into a pGL4.10-report vector (Promega Corporation, Madison, WI, United States). Equal quantities of the pGL4.10-3UTR-ENO1 and Renilla expression vector pRL-TK (Promega Corporation) were co-transfected into 293T cells. The luciferase activity was measured at 48 h post-transfection using the Dual-Glo Luciferase Assay system (Promega Corporation).
We subcutaneously injected 2 × 10⁶ transfected TPC1 cells into the forelegs of immunodeficient nude mice (male BALB/c, 4-week-old). At the indicated times, thyroid tumors were isolated and weighed following international criteria. Animal studies were conducted in compliance with the regulations on management of animal welfare set by the Ethics Committee of National Cancer Center/National Clinical Research Center for Cancer/Cancer Hospital, Chinese Academy of Medical Sciences and Peking Union Medical College. The protocol for animal experiments was approved by the Ethics Committee of National Cancer Center/National Clinical Research Center for Cancer/Cancer Hospital, Chinese Academy of Medical Sciences and Peking Union Medical College.
Total RNA was extracted from TPC1 cells incubated with exosomes using TRIzol reagent (Invitrogen, Carlsbad, CA, United States). Agarose electrophoresis was used to determine the total RNA’s integrity, and a NanoDrop (Thermo Scientific NanoDrop 2000 Microvolume Spectrophotometer, RRID:SCR_018042) was used for quality control and quantification. A sequencing library was constructed using an RNA library construction kit (NEB, United States). Their sequences were analyzed using Illumina HiSeqTM 2000 (Wistar Genomics Facility, RRID:SCR_010205; Illumina Inc., San Diego, CA, United States).
TPC1 cells were fixed in 1% formaldehyde for 10 min at 4°C. Cells were then sonicated to shear genomic DNA, followed by incubating overnight with 5 μg of Rb IgG or HIF1α antibody (Sigma, 1:2,000). The resulting complexes were precipitated using Fastflow G-Sepharose beads (GE Healthcare, Little Chalfont, United Kingdom), eluted, purified, and analyzed using PCR.
According to their P-values, a GSEA algorithm was used to identify the enrichment of specific functions in the list of genes pre-ranked to test differences in expression between cell lines. The statistical significance of the enrichment score was calculated by permuting the genes 1,000 times as performed by the GSEA software. To collapse each probe set on the array to a single gene, we selected the probe with the highest variance among multiple probes corresponding to the same gene. Gene sets were derived from the REACTOME pathway database.
The StarBase V3.0 project2 was used to analyze expression levels of ENO1 and CST1. Correlation between ENO1 and CST1 was obtained from 510 samples in thyroid carcinoma.
The analysis was performed using GraphPad Prism 6.0 software. Differences were analyzed using the Student’s t-test or one-way ANOVA. Differences were statistically significant when P < 0.05.
To study the function of ENO1 in thyroid carcinoma, we first analyzed the THCA database to determine the relevance of ENO1 in thyroid carcinoma. We found upregulation of ENO1 in thyroid carcinoma compared with normal samples (Figure 1A). And we also found that the higher level of methylation of ENO1’s promoter in normal group than tumor group (Figure 1B). IHC staining showed that ENO1 was upregulated in thyroid carcinoma samples as compared with normal samples (Figure 1C and Table 1). The expression ENO1 was not associated with age, gender, T classification and lymph node metastasis (Table 2). qRT-PCR and western blotting were also performed to confirm these results; there were higher ENO1 mRNA and protein levels in thyroid carcinoma samples (Figures 1D,E). These findings suggest that ENO1 might be an oncogene.
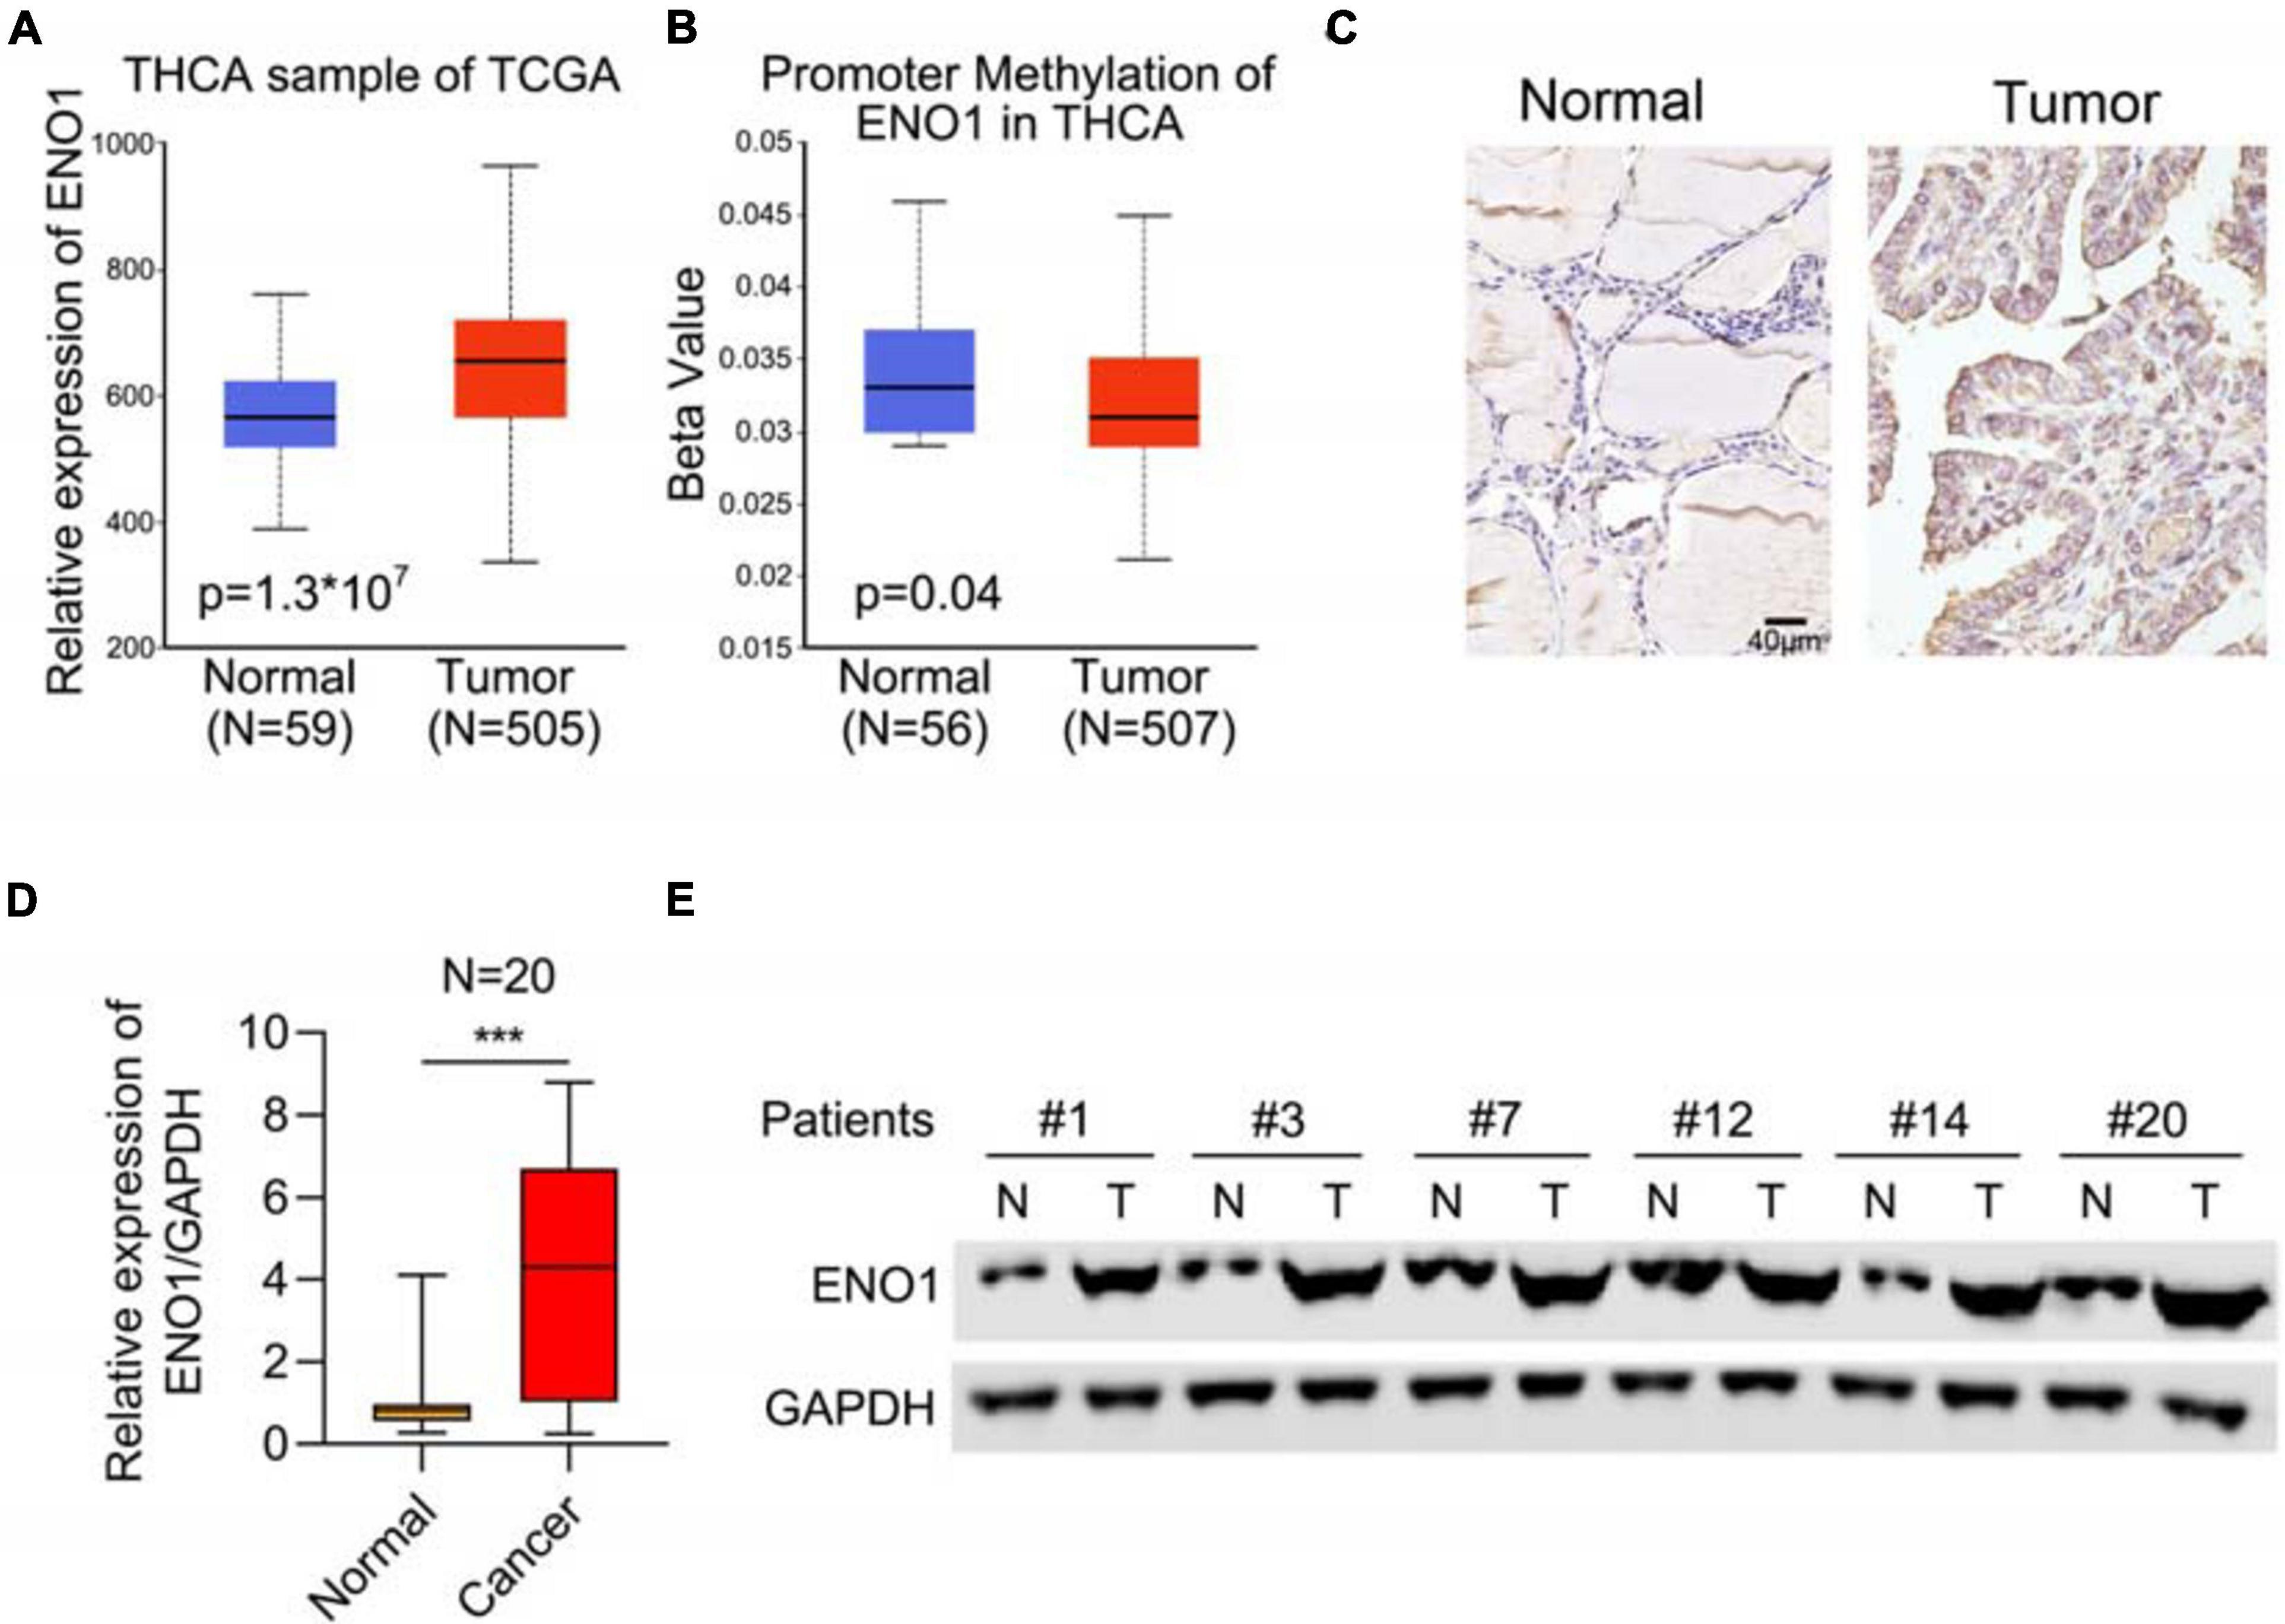
Figure 1. Upregulation of ENO1 in thyroid carcinoma. (A) Analysis of ENO1 expression in thyroid carcinoma (n = 505) and normal samples (n = 59) from THCA. (B) Analysis of promoter methylation of ENO1 in thyroid carcinoma (n = 507) and normal samples (n = 56) from THCA. (C) IHC analysis of ENO1 expression in normal and thyroid carcinoma tissues. (D) qRT-PCR analysis of ENO1 expression in normal and thyroid carcinoma tissues. (E) Western blotting analysis of ENO1 expression in normal and thyroid carcinoma tissues. GAPDH serves as a loading control. ***p < 0.001.
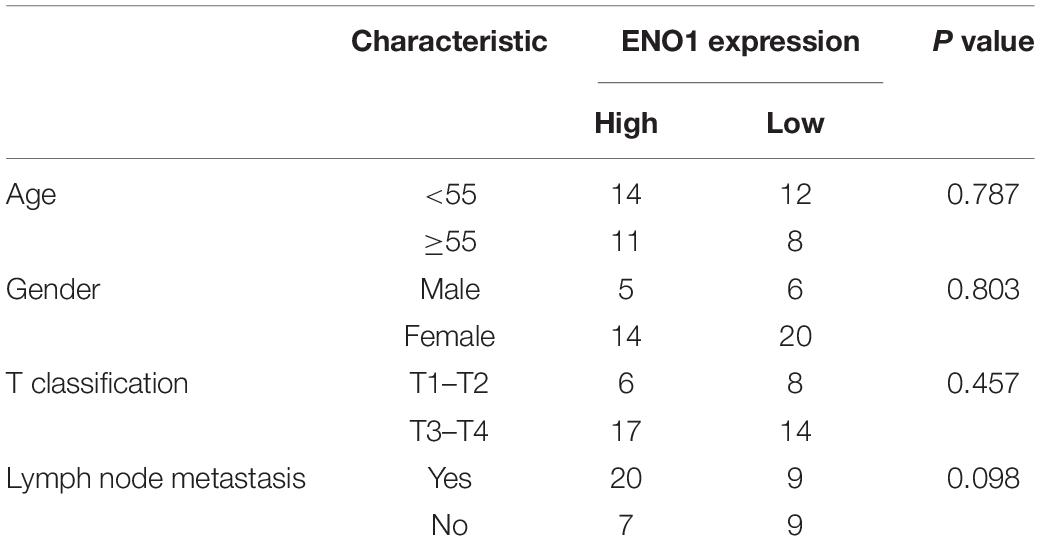
Table 2. Correlation of ENO1 expression with clinicopathological characteristics in 45 patients of thyroid carcinoma.
To elucidate the role of ENO1 in thyroid carcinoma progression, small interfering RNAs were identified to downregulate ENO1 expression in TPC1 and BCPAP cells. Western blotting showed high knockdown efficiency of siENO1 in both cell lines (Figure 2A). Then, a CCK8 assay was performed to measure cell proliferation. Depletion of ENO1 suppressed TPC1 and BCPAP thyroid carcinoma cells’ proliferation to nearly half that of control cells (Figure 2B). The colony formation assay demonstrated that fewer colonies were formed in siENO1 cells (Figures 2C,D).
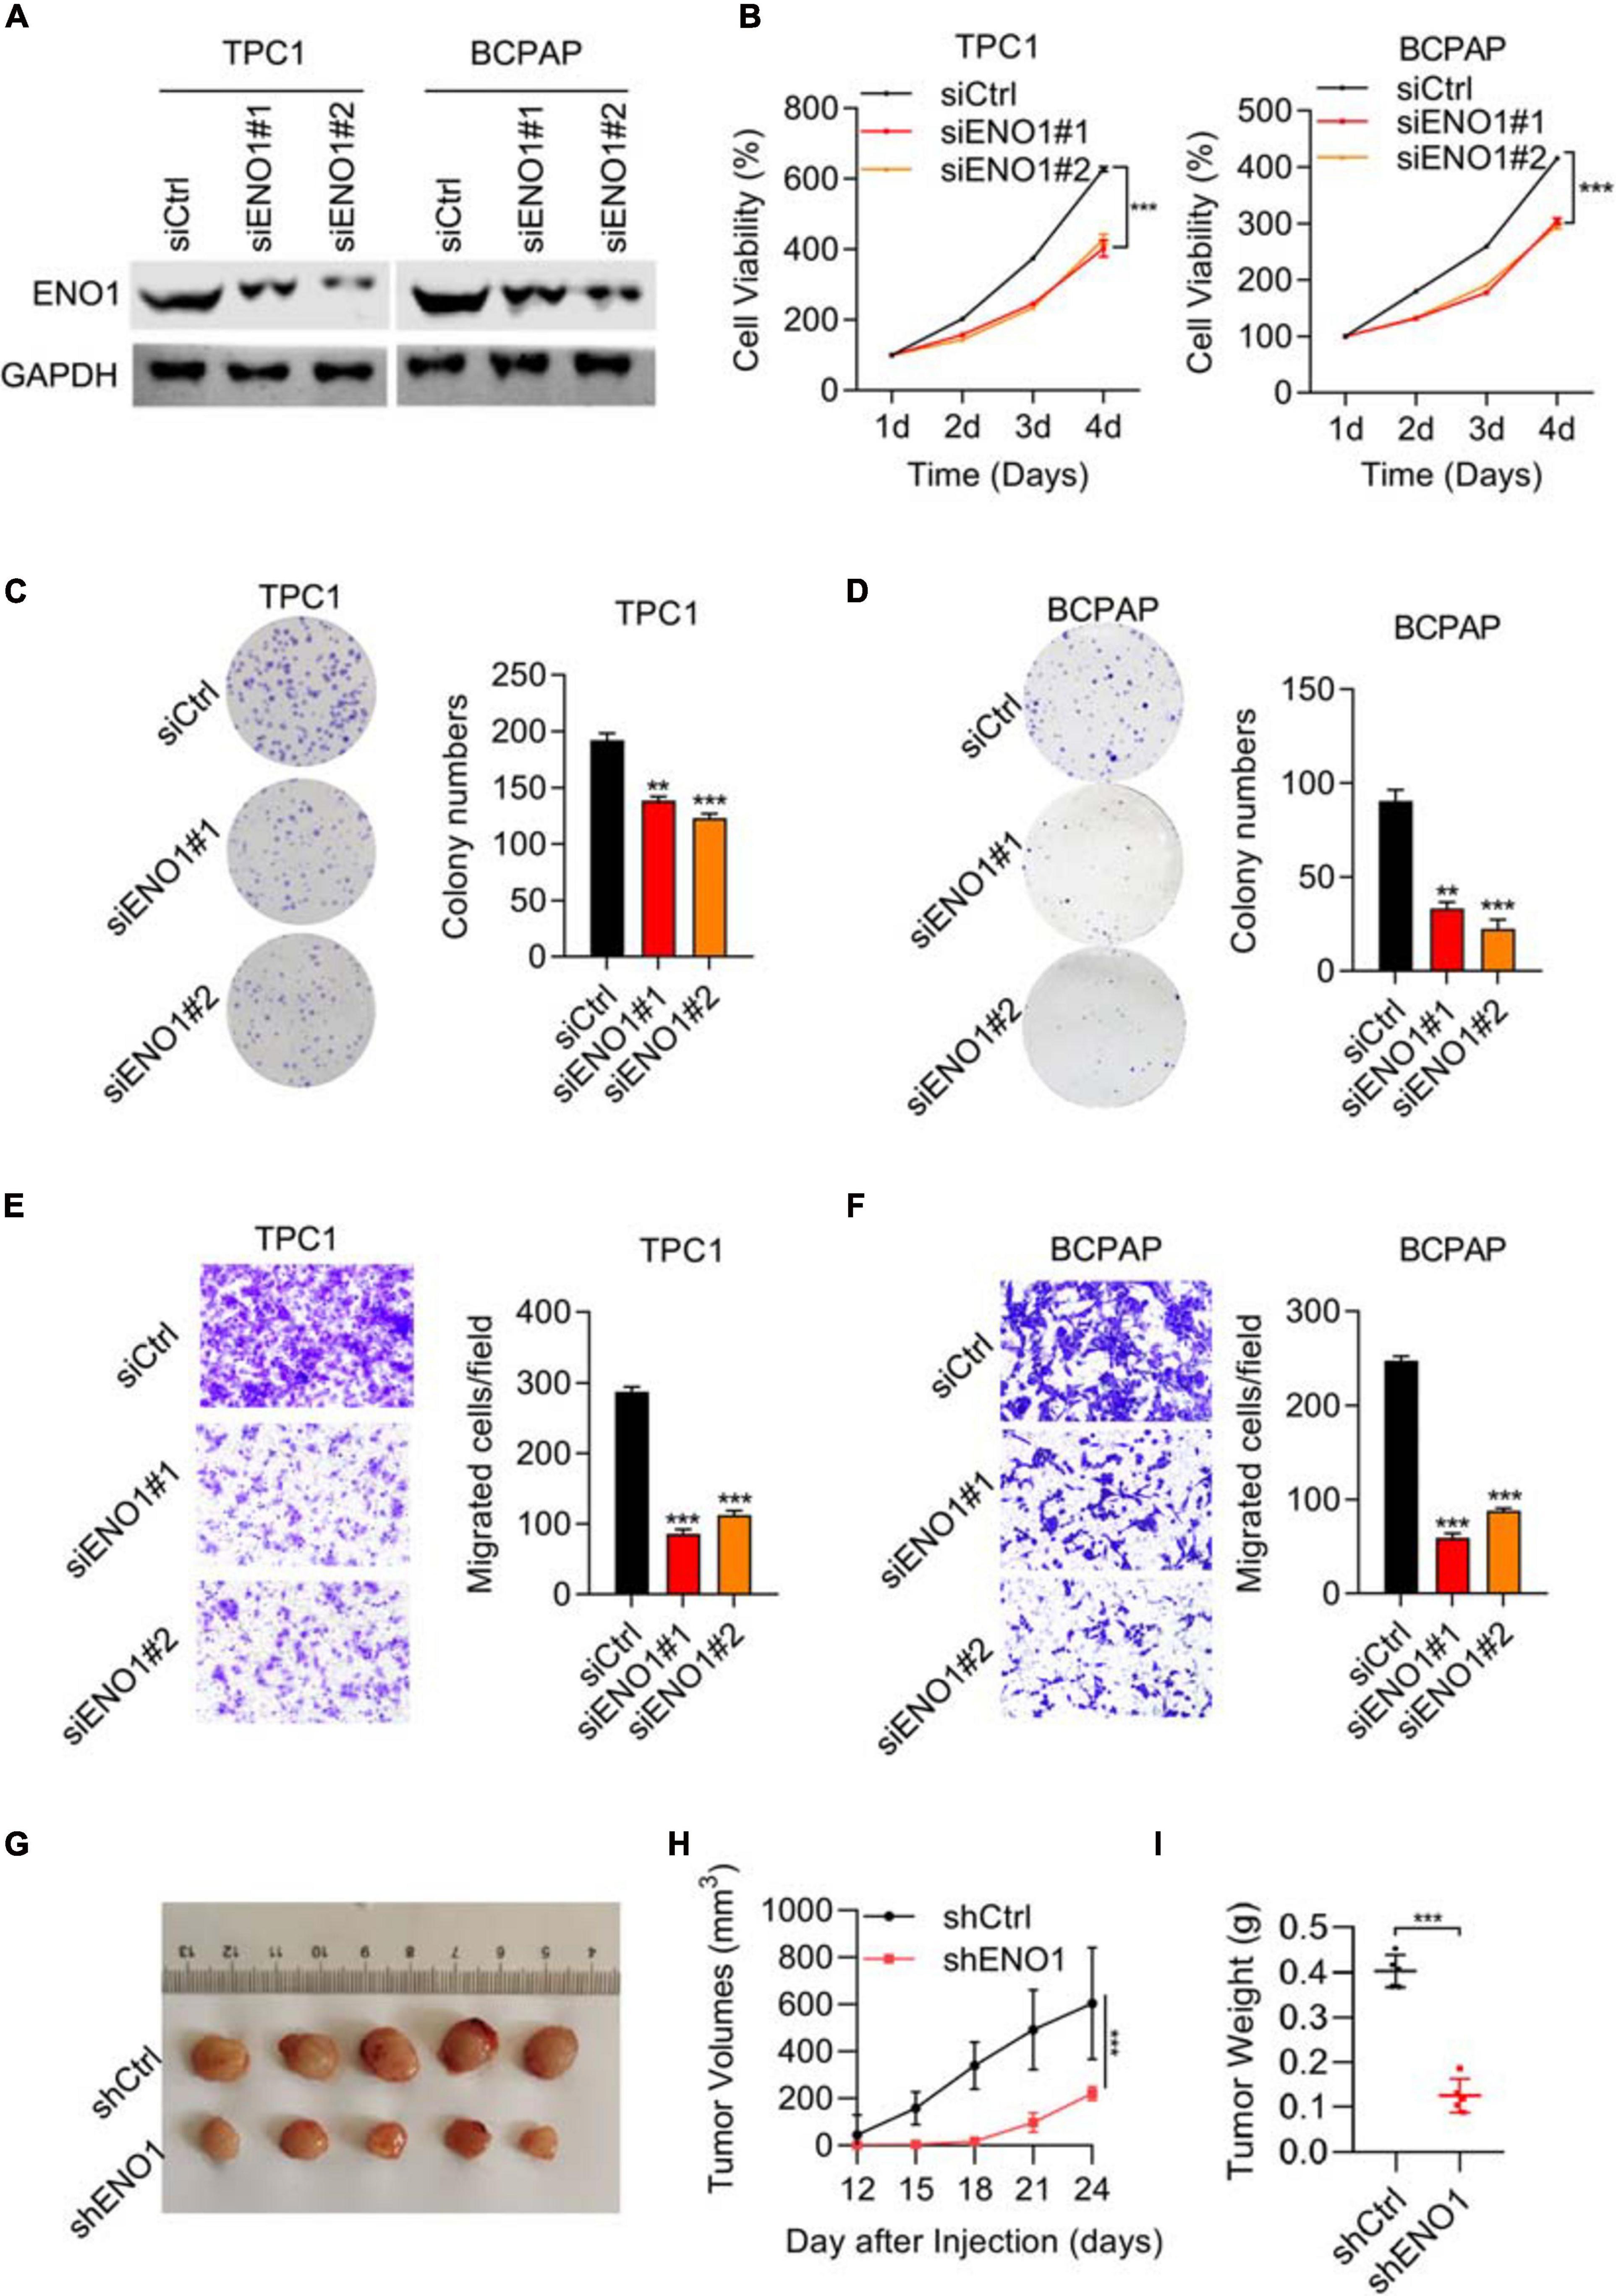
Figure 2. Downregulation of ENO1 suppresses cell proliferation, invasion, and in vivo tumorigenicity. (A) Western blotting analysis of ENO1 knockdown efficiency in TPC1 and BCPAP cells. GAPDH was used as a loading control. (B) CCK8 analysis of cell proliferation in TPC1 cells and BCPAP cells transfected with siCtrl, siENO1#1, and siENO1#2. (C,D) Colony formation assay in TPC1 (C) and BCPAP (D) cells transfected with siCtrl, siENO1#1, and siENO1#2. *P < 0.05, **P < 0.01, ***P < 0.001. (E,F) Transwell invasion analysis in TPC1 (E) and BCPAP (F) cells transfected with siCtrl, siENO1#1, and siENO1#2. ***P < 0.001. (G–I) Athymic nude mice (n = 5) injected with TPC1 cell lines expressing shCtrl or shENO1 were analyzed for tumor formation. Representative image (G), tumor growth curve (H) and weight (I) of xenografted tumors are shown.
Regarding migration ability, transwell results showed that the percentage of migration cells was decreased (greater than 50% in both cells) with ENO1 depletion compared to control cells (Figures 2E,F). In addition, wound healing assays demonstrated that ENO1 knockdown suppressed the migration capacity of TPC1 and BCPAP cells (Supplementary Figure 1A). To explore the function of ENO1 in vivo, a tumor formation assay was performed. We used ENO1 shRNA to downregulate the expression of ENO1, and the tumor was isolated for measurements at indicated times. Isolated tumors only weighed 0.1 g in shENO1 samples compared with 0.4 g in the control samples (Figures 2G–I). These findings further suggest an oncogenic role for ENO1.
Because the cell cycle is frequently disturbed by oncogenes, we performed flow cytometry. The depletion of ENO1 decreased the number of cells in the S phase, while the G0/G1 cells’ percentage increased (Figure 3A). Apoptotic cells significantly increased with ENO1 depletion. Compared with control cells, the percentage of apoptosis nearly doubled in siENO1 cells in bPC1 and BCPAP cells (Figure 3B). These findings suggest that cell cycle progression was severely impaired by ENO1 depletion.
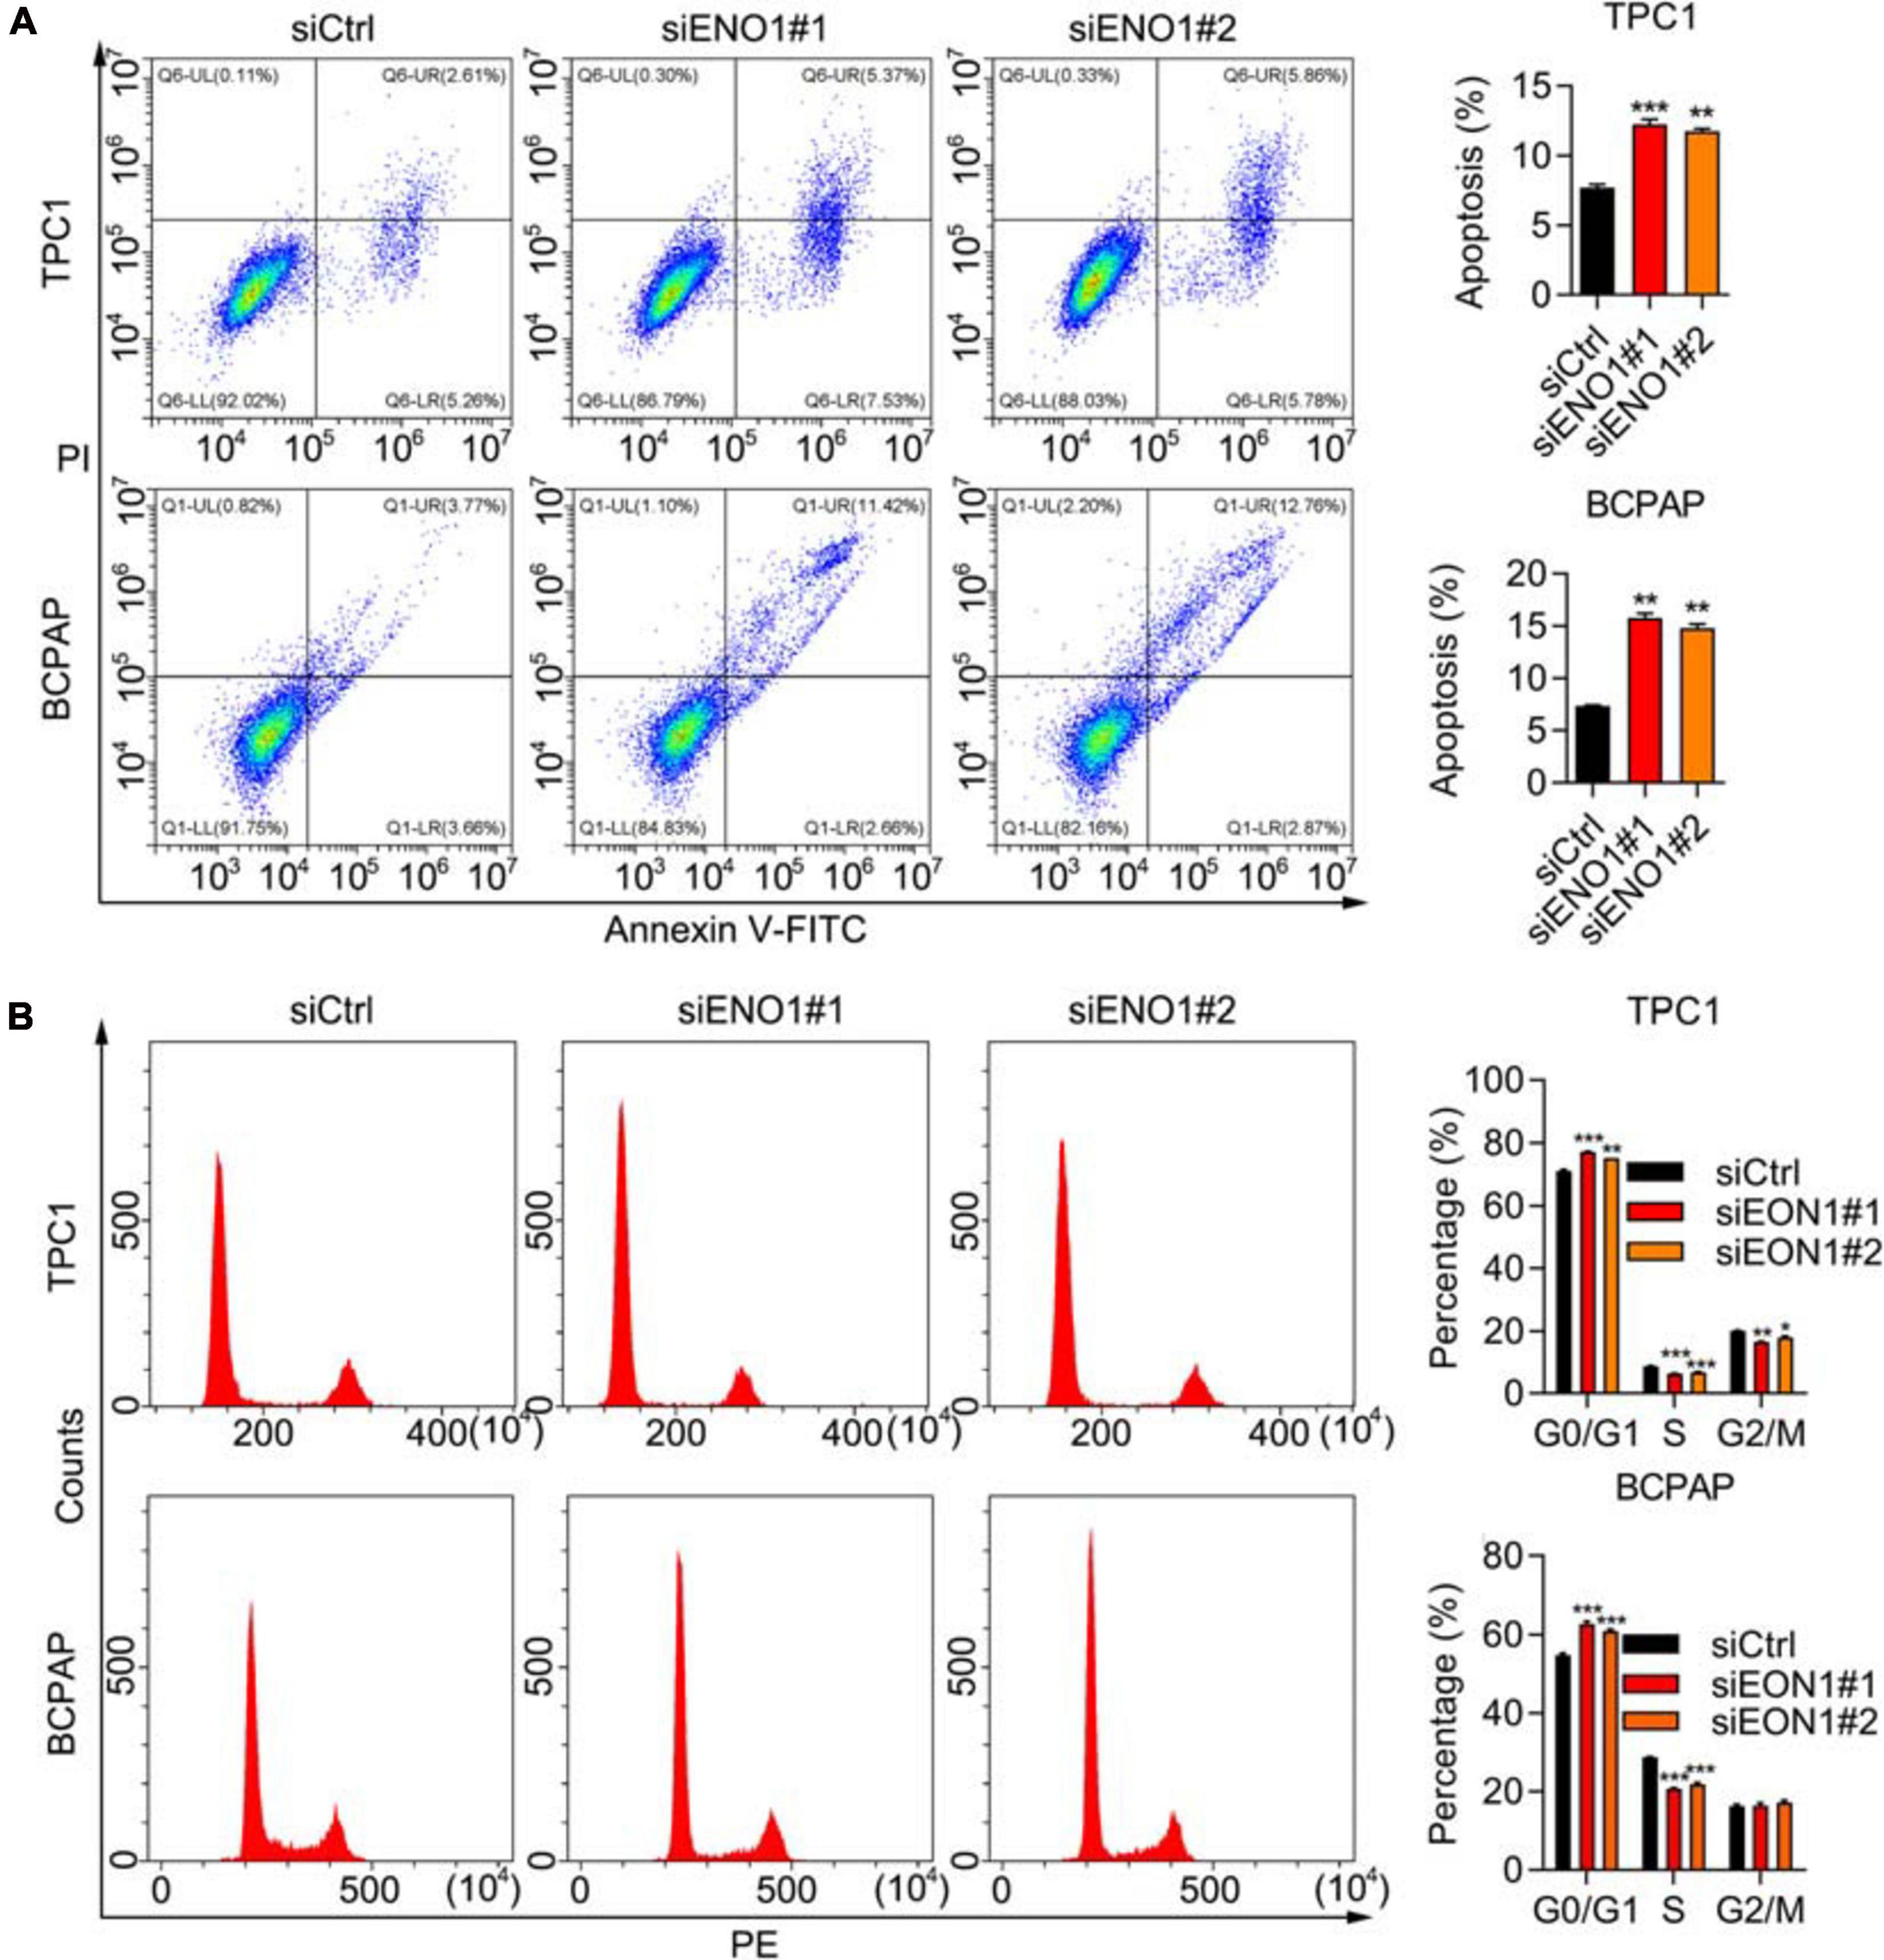
Figure 3. ENO1 regulates cell cycle and apoptosis. (A) Cell cycle analysis using PI staining and flow cytometry in siCtrl, siENO1#1, and siENO1#2 transfected into TPC1 and BCPAP cells. **P < 0.01, ***P < 0.001. (B) Flow cytometry analysis of apoptosis using annexin V-FITC and PI staining in TPC1 and BCPAP cells transfected with siCtrl, siENO1#1, and siENO1#2. ***P < 0.001, **P < 0.01, *p < 0.05.
To confirm the knockdown results, we performed overexpression experiments. We performed qRT-PCR and western blotting to demonstrate high overexpression levels of ENO1 in both TPC1 and BCPAP cells (Figures 4A–C). Next, the CCK8 assay demonstrated that ENO1 overexpression significantly improved cell viability compared with control cells from 1 to 4 days (Figures 4D,E). The ability of colony formation (Figures 4F,G) and Transwell migration (Figures 4H,I) in ENO1 overexpressing cells were consistent with the knockdown results (Figures 2D–F). Wound healing results also showed that ENO1 overexpression enhanced the migration capacity of TPC1 and BCPAP cells (Supplementary Figure 1B). We also performed flow cytometry analysis. Apoptosis was inhibited with ENO1 overexpression in both TPC1 and BCPCP cells (Figures 4J,K). Never the less, ENO1 accelerated cell cycle progression, with S stage cells increasing and G0/G1 stage cells decreasing (Figures 4L,M). These findings suggest that ENO1 regulates the cell cycle and apoptosis to promote cancer cell progression, functioning as an oncogene.
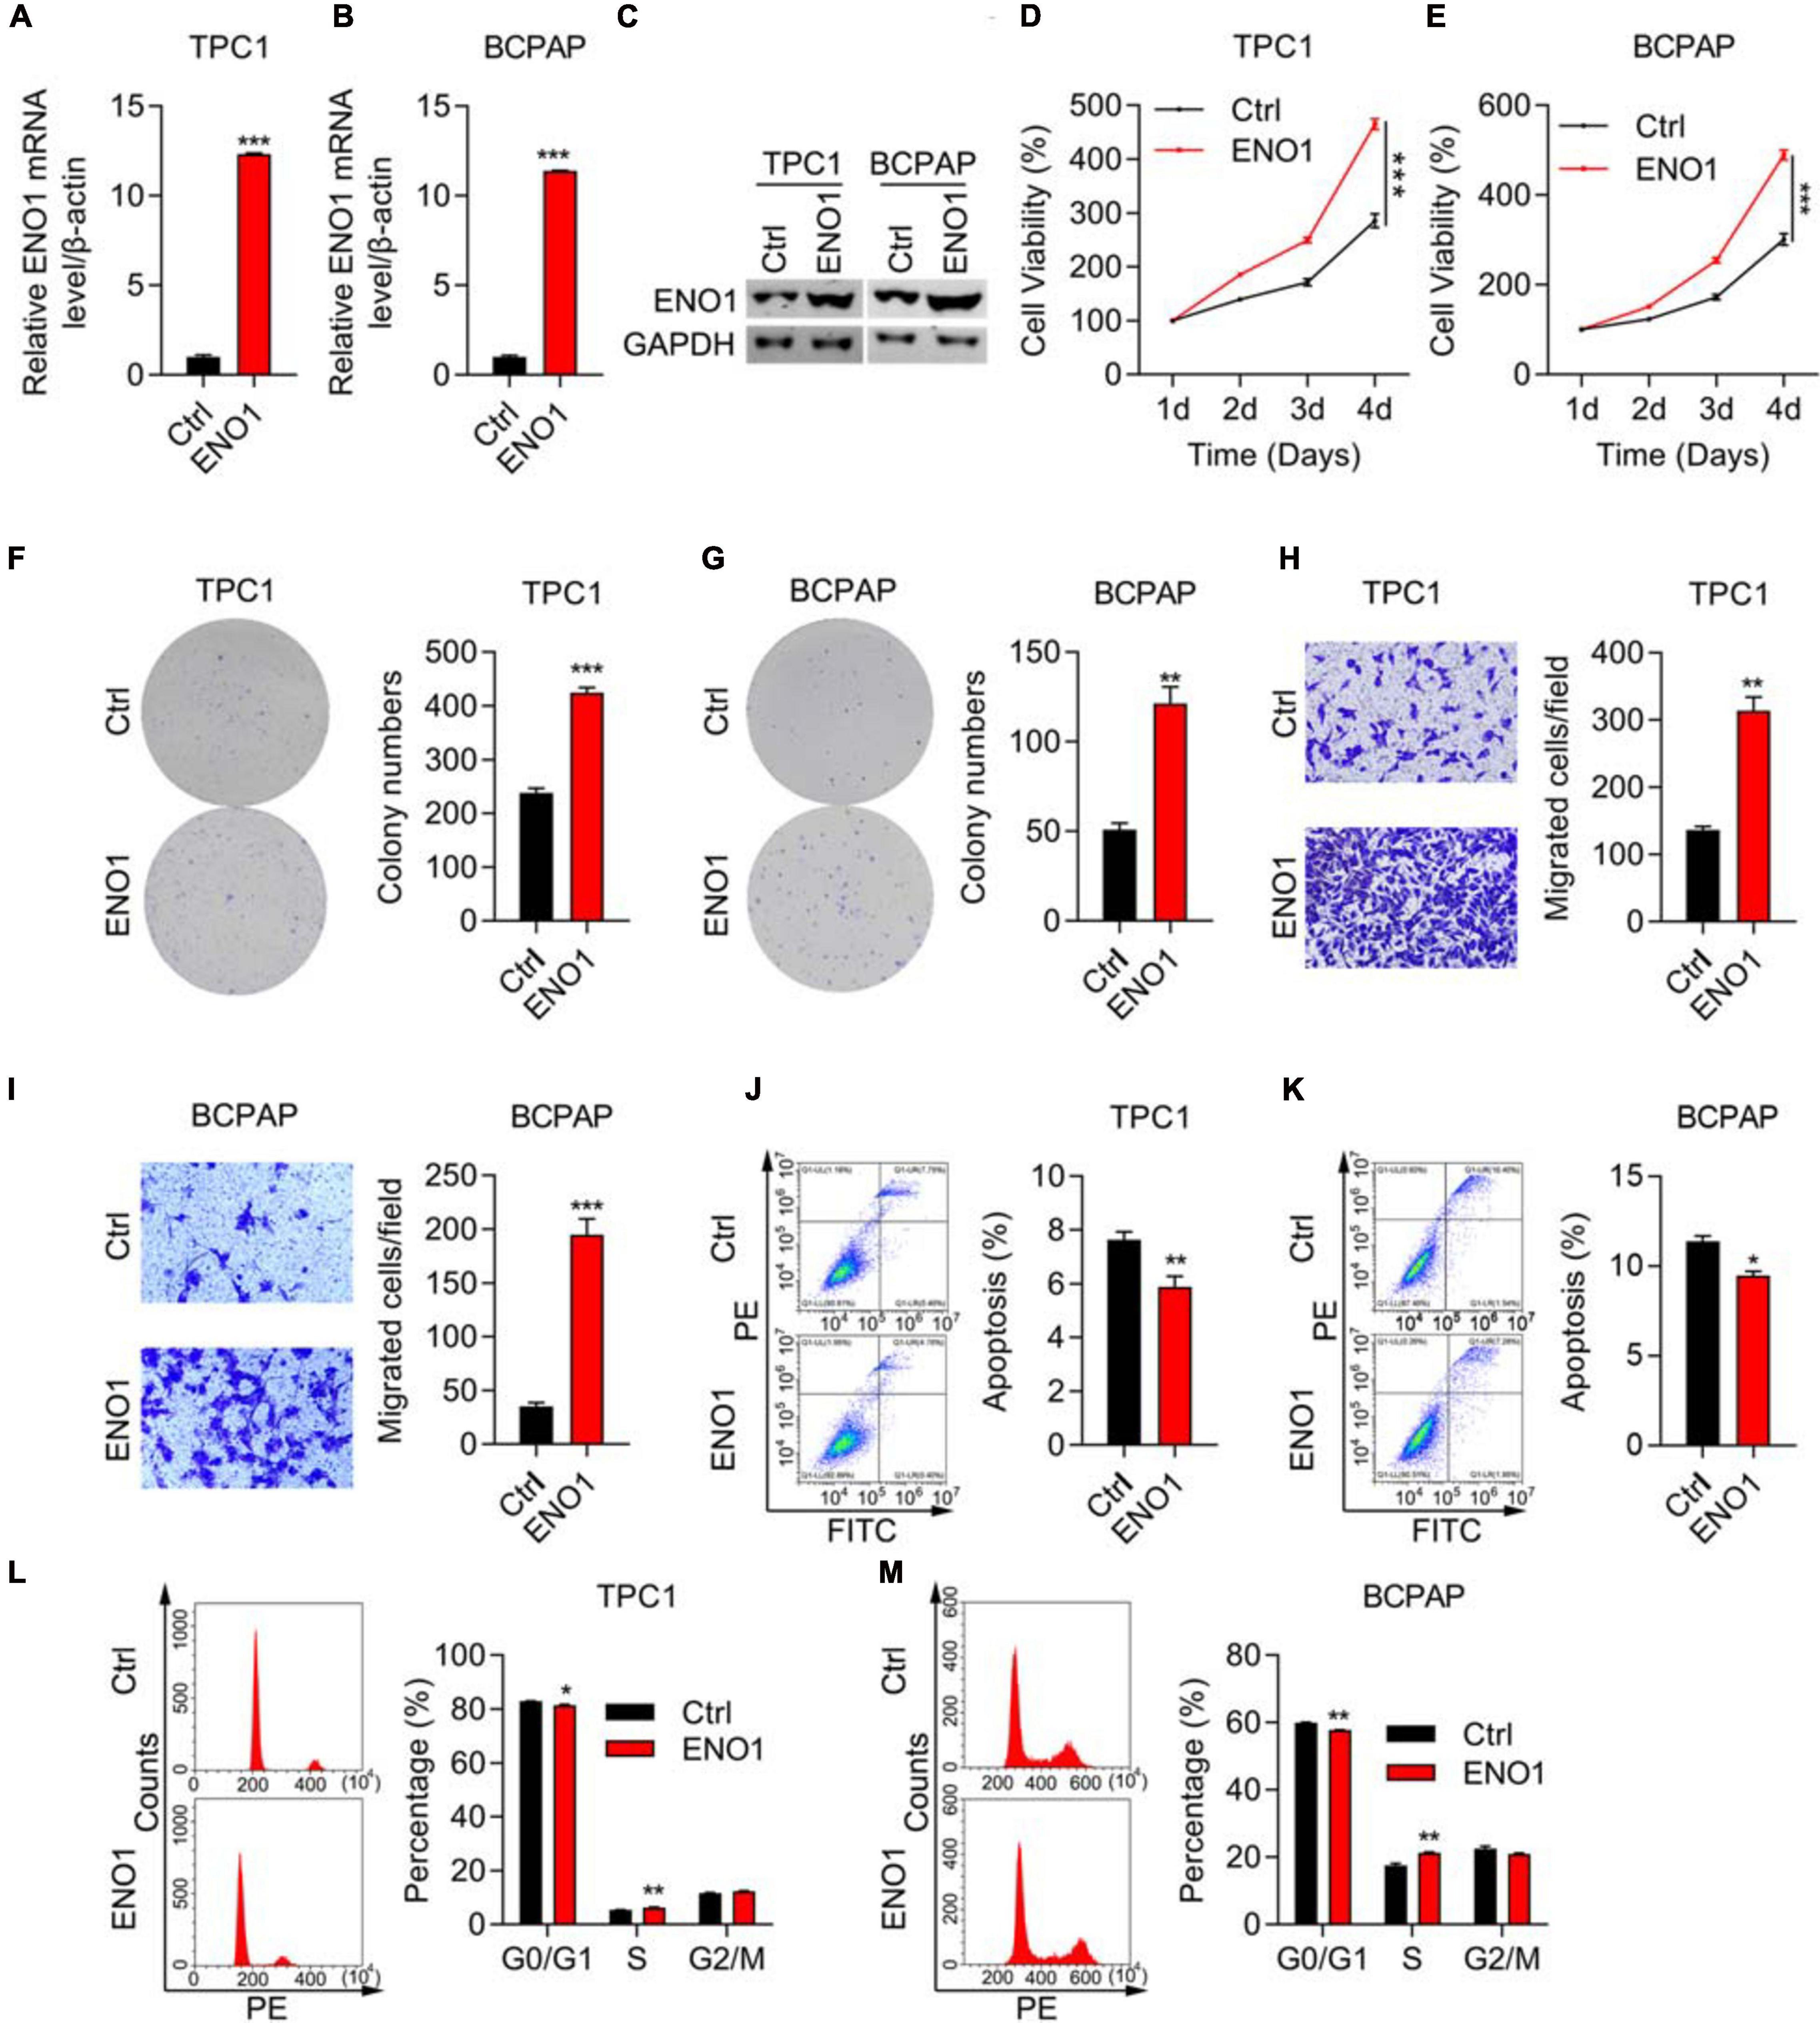
Figure 4. ENO1 overexpression promotes proliferation and invasion and inhibits apoptosis. (A,B) qRT-PCR analysis of ENO1 overexpression in TPC1 (A) and BCPAP (B) cells. β-actin was used for normalization, ***P < 0.001. (C) Western blotting analysis of ENO1 overexpression in TPC1 and BCPAP cells. GAPDH was used as a loading control. (D,E) CCK8 cell viability analysis of control or ENO1-overexpressed TPC1 (D) and BCPAP (E) cells, ***P < 0.001. (F,G) Colony formation assay of control or ENO1-overexpressed TPC1 (F) and BCPAP (G) cells. **P < 0.01, ***P < 0.001. (H,I) Transwell invasion analysis of control or ENO1-overexpressed TPC1 (H) and BCPAP (I) cells. ***P < 0.001, **P < 0.01. (J,K) Flow cytometry analysis of apoptosis using Annexin V-FITC and PI staining in control or ENO1-overexpressed TPC1 (J) and BCPAP (K) cells. *P < 0.05, **P < 0.01. (L,M) Cell cycle was measured using PI staining and flow cytometry in control or ENO1-overexpressed TPC1 (L) and BCPAP (M) cells, *P < 0.05, **P < 0.01.
Next, we elucidated the mechanism of ENO1’s oncogenic role. ENO1 is a glycolysis-associated enzyme that participates in various cancers (Nakajima et al., 1986; Tu et al., 2010; Song et al., 2014; Fu et al., 2015; Liu et al., 2015; Principe et al., 2015; Zhu et al., 2015, 2018; Niccolai et al., 2016; Qian et al., 2017; Zhan et al., 2017); therefore, we focused on glycolysis-associated pathways; the mTOR/HIF1α pathway is also involved in glycolysis (Majumder et al., 2004; Semenza, 2011; Chi, 2012; Cheng et al., 2014; Courtnay et al., 2015; Yang et al., 2015; Xiao et al., 2017). Therefore, we examined ENO1 expression in TSC1 knockout MEF cells and found that TSC1 depletion aberrantly activated the mTOR pathway (Cao et al., 2020). Western blotting showed that knockout of TSC1 upregulated ENO1 expression and the phosphorylation of S6, the downstream of mTOR pathway (Figure 5A), as did HIF1α, another downstream molecule of the mTOR/HIF1α pathway. To confirm these results, we used rapamycin to inhibit the mTOR pathway (Edwards and Wandless, 2007). ENO1 was downregulated upon rapamycin addition, more significantly in TSC1-depleted cells (Figure 5B).
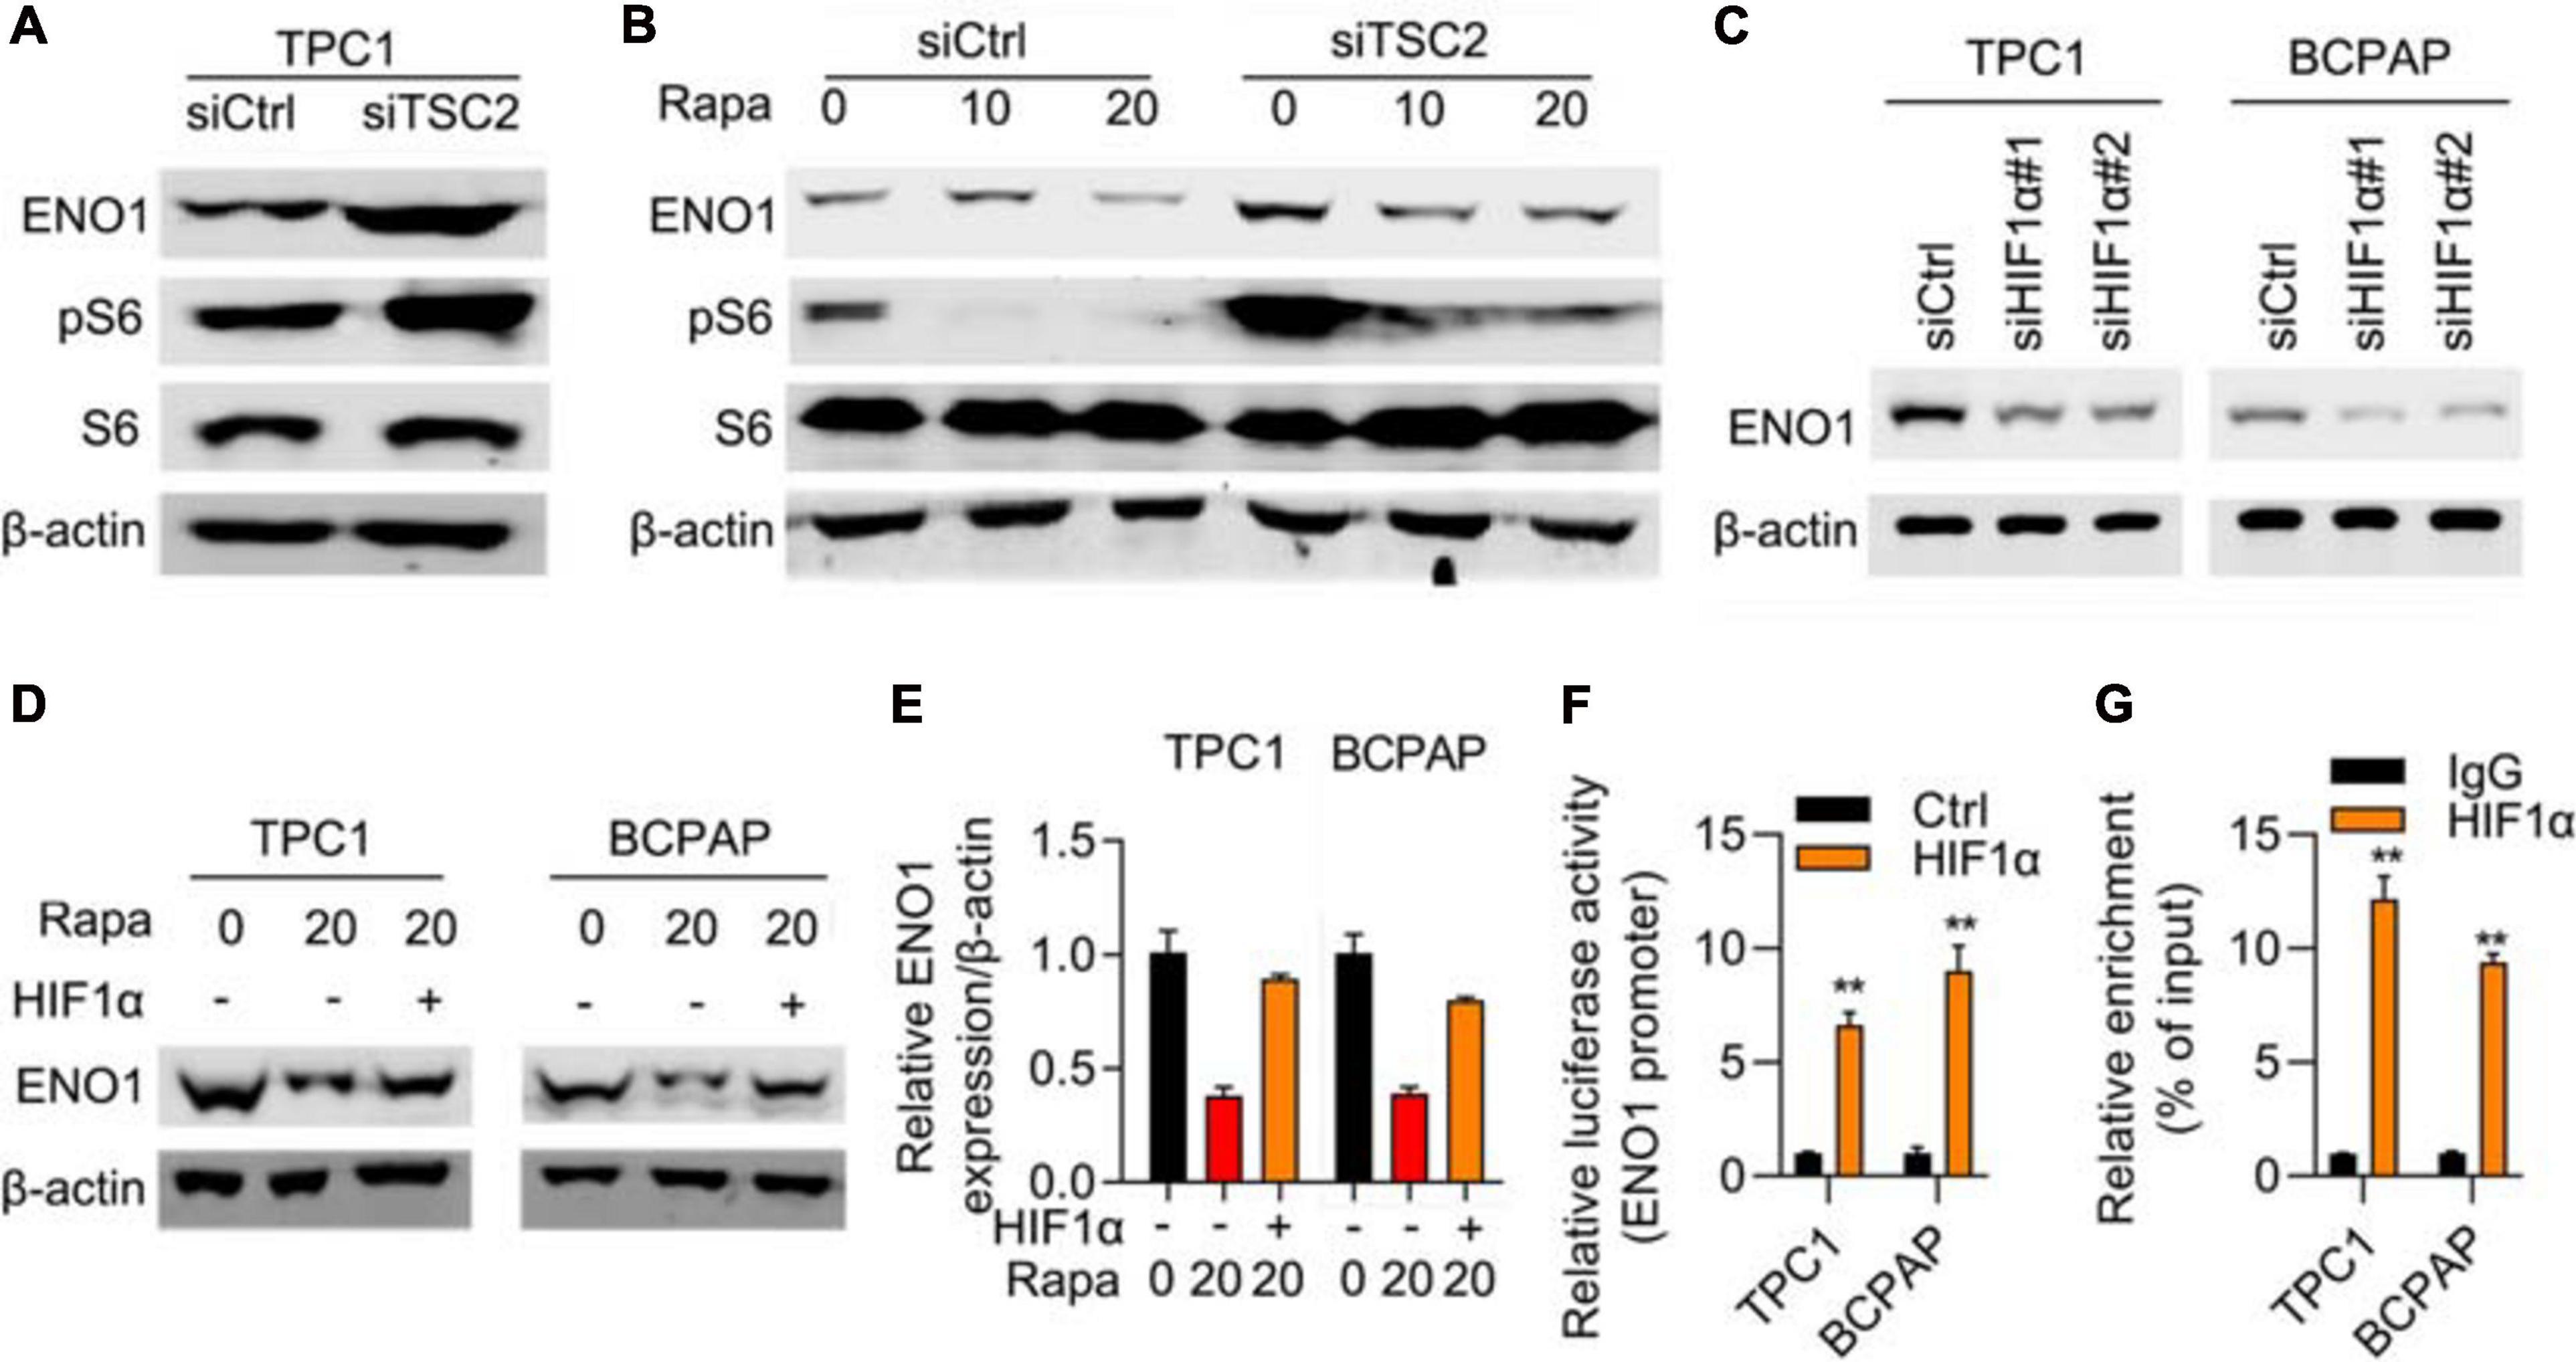
Figure 5. mTOR/HIF1α regulates expression of ENO1. (A) ENO1 and phosphorylated S6 was upregulated in TSC1 knockout TPC1 cells. β-actin was used as a loading control. (B) ENO1 was downregulated with rapamycin treatment. β-actin was used as a loading control. (C) Depletion of HIF1α downregulated expression of ENO1. β-actin was used as a loading control. (D–E) HIF1α rescued downregulation of ENO1 with rapamycin treatment. Western blotting (D) and qRT-PCR (E) were shown. **P < 0.01. (F) ENO1 luciferase assay in control and HIF1α transfected cells. **P < 0.01. (G) HIF1α targeted the promoter region of ENO1. ChIP-qPCR results are shown. **P < 0.01.
To explore the relationship between ENO1 and HIF1α, an RNA interference assay was performed. With HIF1α depletion, ENO1 was downregulated in both TPC1 and BCPAP cells (Figure 5C). The addition of rapamycin further reduced ENO1 expression. Overexpression of HIF1α rescued ENO1 expression both at the protein and mRNA levels (Figure 5D). We also performed a luciferase assay. The luciferase activity increased in HIF1α-transfected cells compared with control cells (Figure 5E). The ChIP-qPCR assay demonstrated that the HIF1α targeted the promoter region of ENO1 (Figures 5F,G). These findings suggest that ENO1 is located downstream of and is regulated by the mTOR/HIF1α pathway.
To further explore the mechanism, we performed differential expression analysis between ENO1-depleted cells and control cells. Variations of mRNA expression between the two groups were plotted, and CST1 and CST4 are the most decreased genes by ENO1 knockdown (Figure 6A). GESA analysis showed that ENO1 depletion altered downregulated including G2M checkpoints and glycolysis signaling pathways (Figure 6B). We chose the genes with a maximum difference for further analysis (Figure 6C). Correlation analysis of the THCA database showed that CST1 and CST4 expression were positively correlated with ENO1 expression (Figures 6D,E). qRT-PCR and immunoblotting confirmed that depletion of ENO1 downregulated CST1 and CST4 expression at the mRNA and protein levels (Figure 6F).
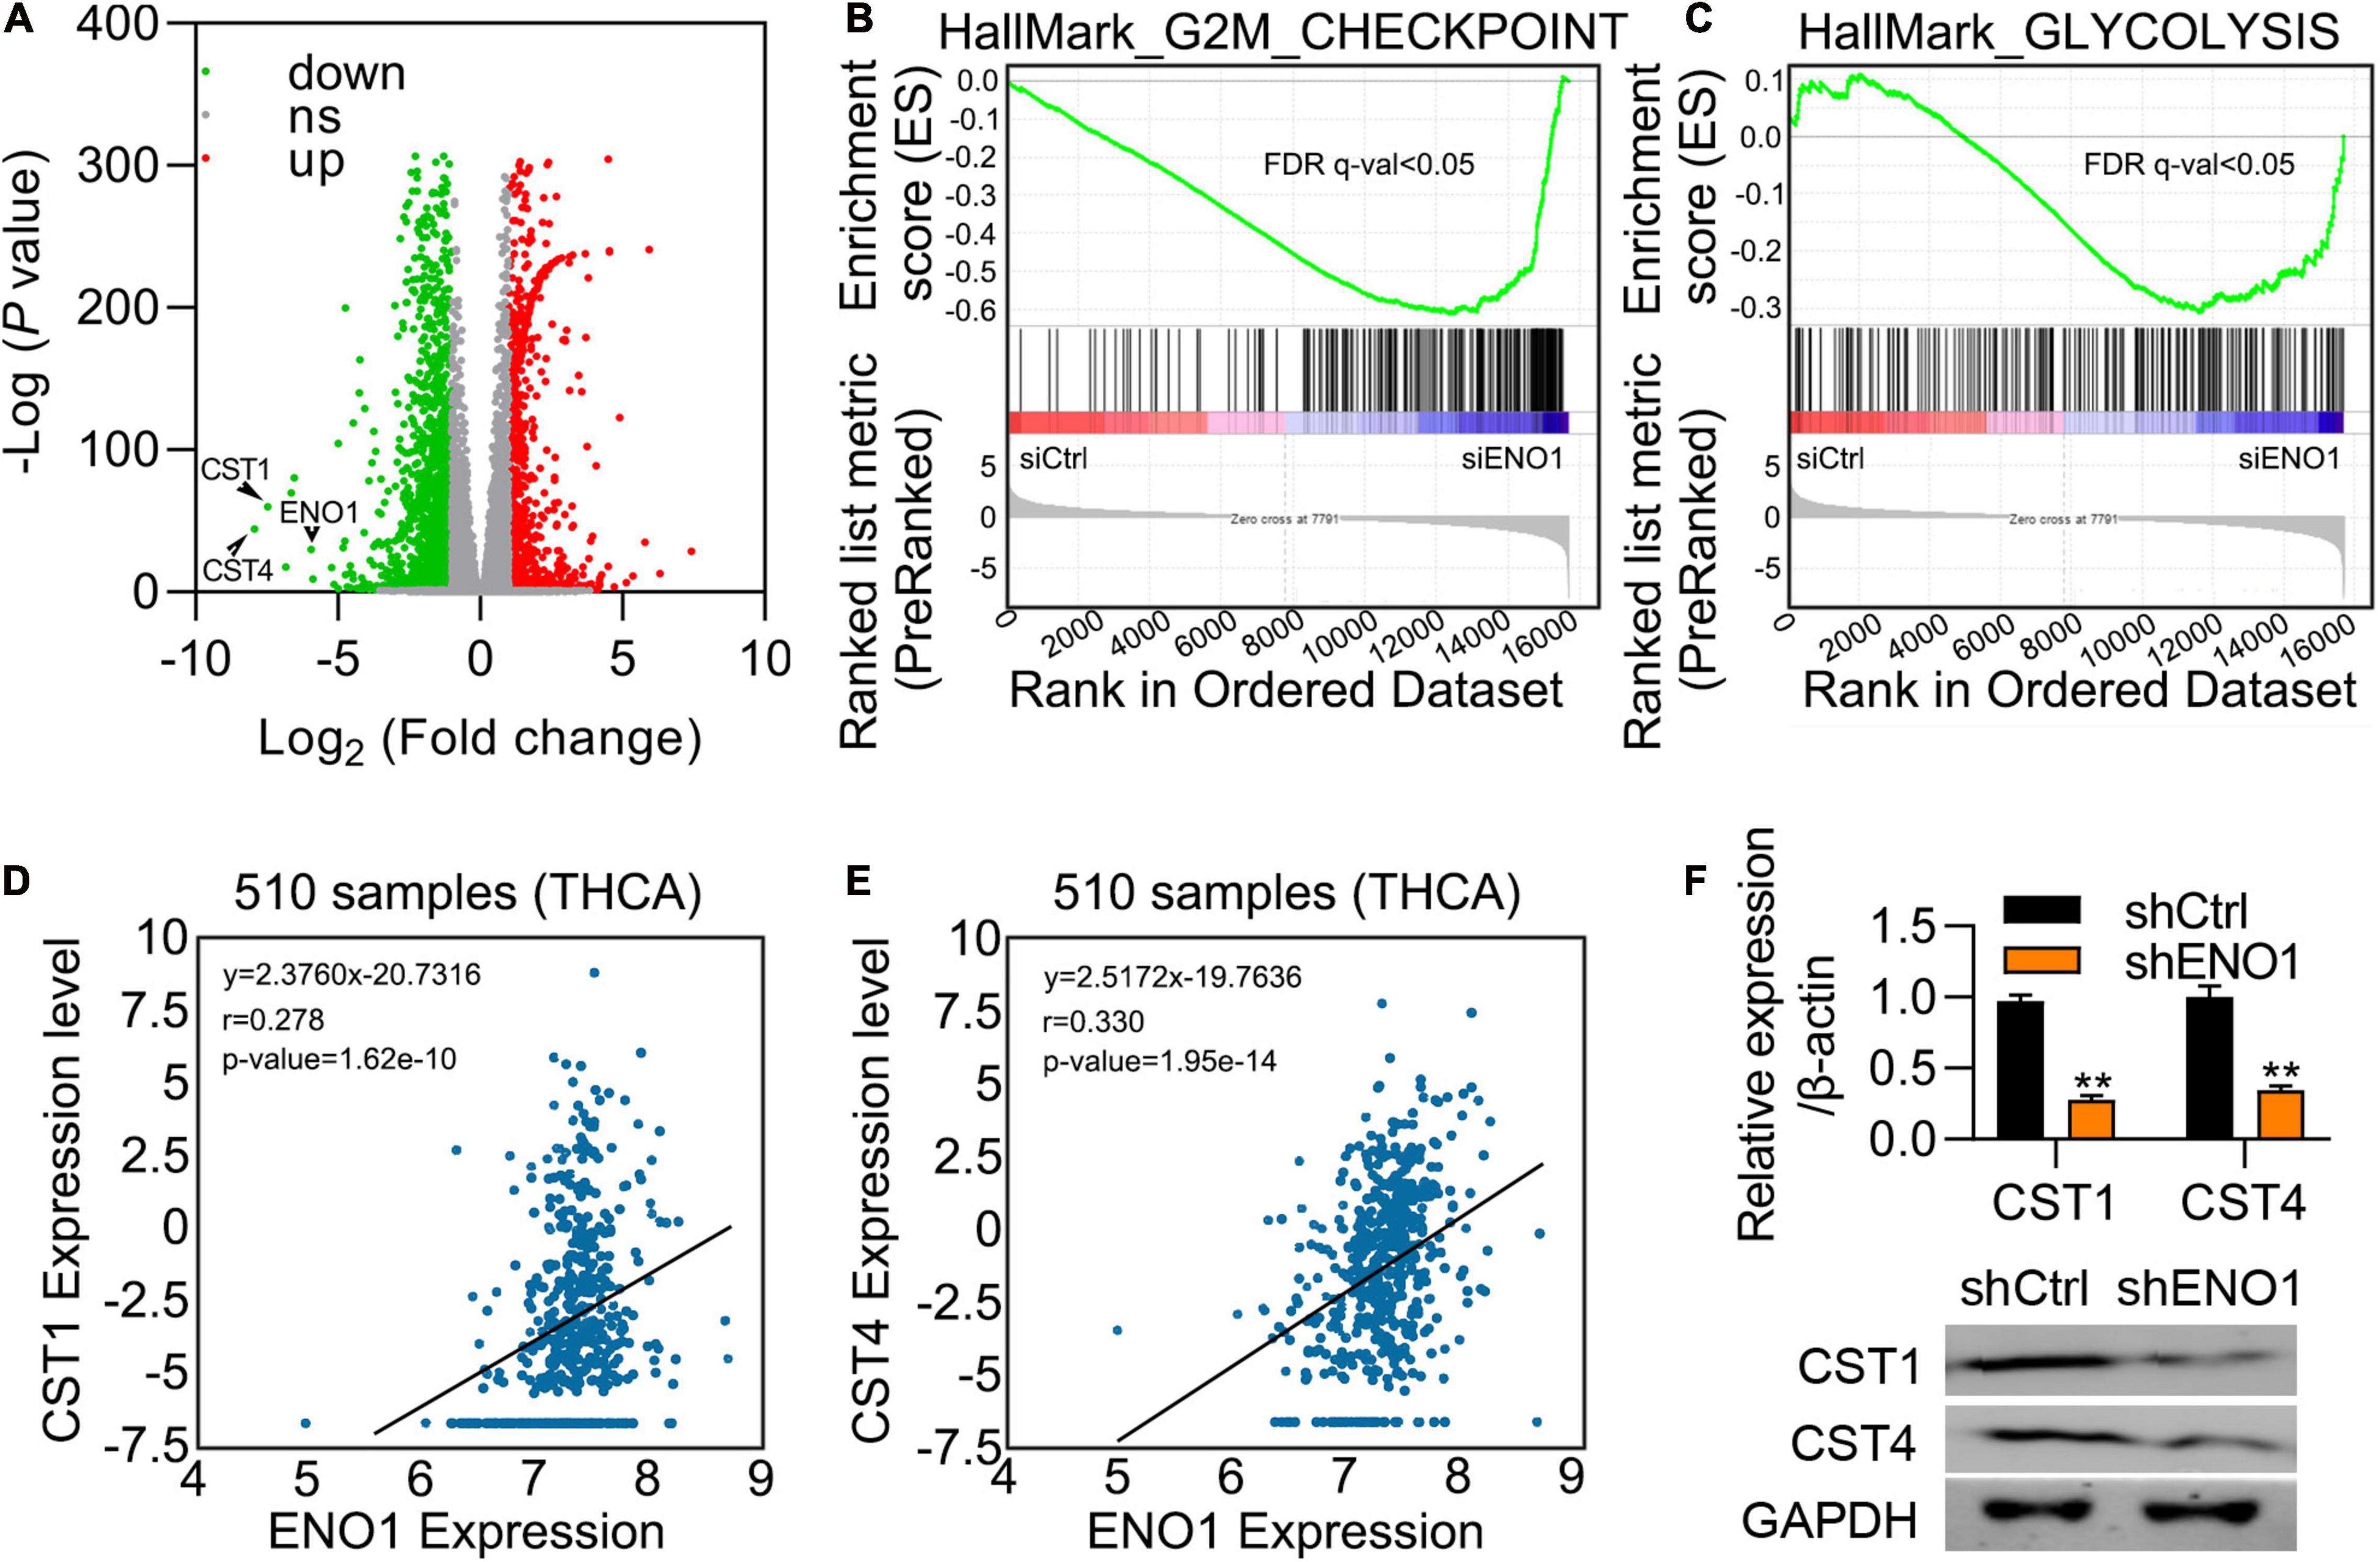
Figure 6. ENO1 regulates the expression of CST1. (A) Differential expression of mRNAs between control and siENO1 cells. The abscissa was log2, and the ordinate was -log10. The red and green dots represent upregulated and downregulated genes, respectively. The gray dots represent genes that were not differentially expressed between the two groups. (B,C) Selected enriched gene sets from the GSEA. The green tracing shows the enrichment score based on hits of genes in the ordered list of differentially regulated genes resulting from the comparison of control and ENO1 depletion cells. (D,E) Correlation between ENO1 and CST1 (D) and CST4 (E) expression (510 samples) in TCGA database. (F) Downregulation of CST1 and CST4 expression by ENO1 depletion. qRT-PCR are shown. β-actin was used for normalization. **P < 0.01.
CST1 and CST4 were previously reported to be oncogenes (Jiang et al., 2018; Cui et al., 2019; Liu et al., 2019; Wang et al., 2020). Next, we studied the role of CST1 and CST4 in thyroid carcinoma. Western blotting confirmed the high knockdown efficiency of siCST1 in both TPC1 and BCPAP cells (Figure 7A). Cell viability analysis with CCK8 assay showed that depletion of CST1 significantly reduced cell viability (Figure 7B). However, we found that knockdown of CST4 could not affect the proliferation of THCA cells (Supplementary Figure 2). Colony numbers also decreased in siCST1 cells (Figures 7C,D). Invasion ability was also inhibited with CST1 depletion, decreasing to nearly half of the control cell levels (Figures 7E,F). These findings suggest that CST1 is an oncogene in thyroid carcinoma.
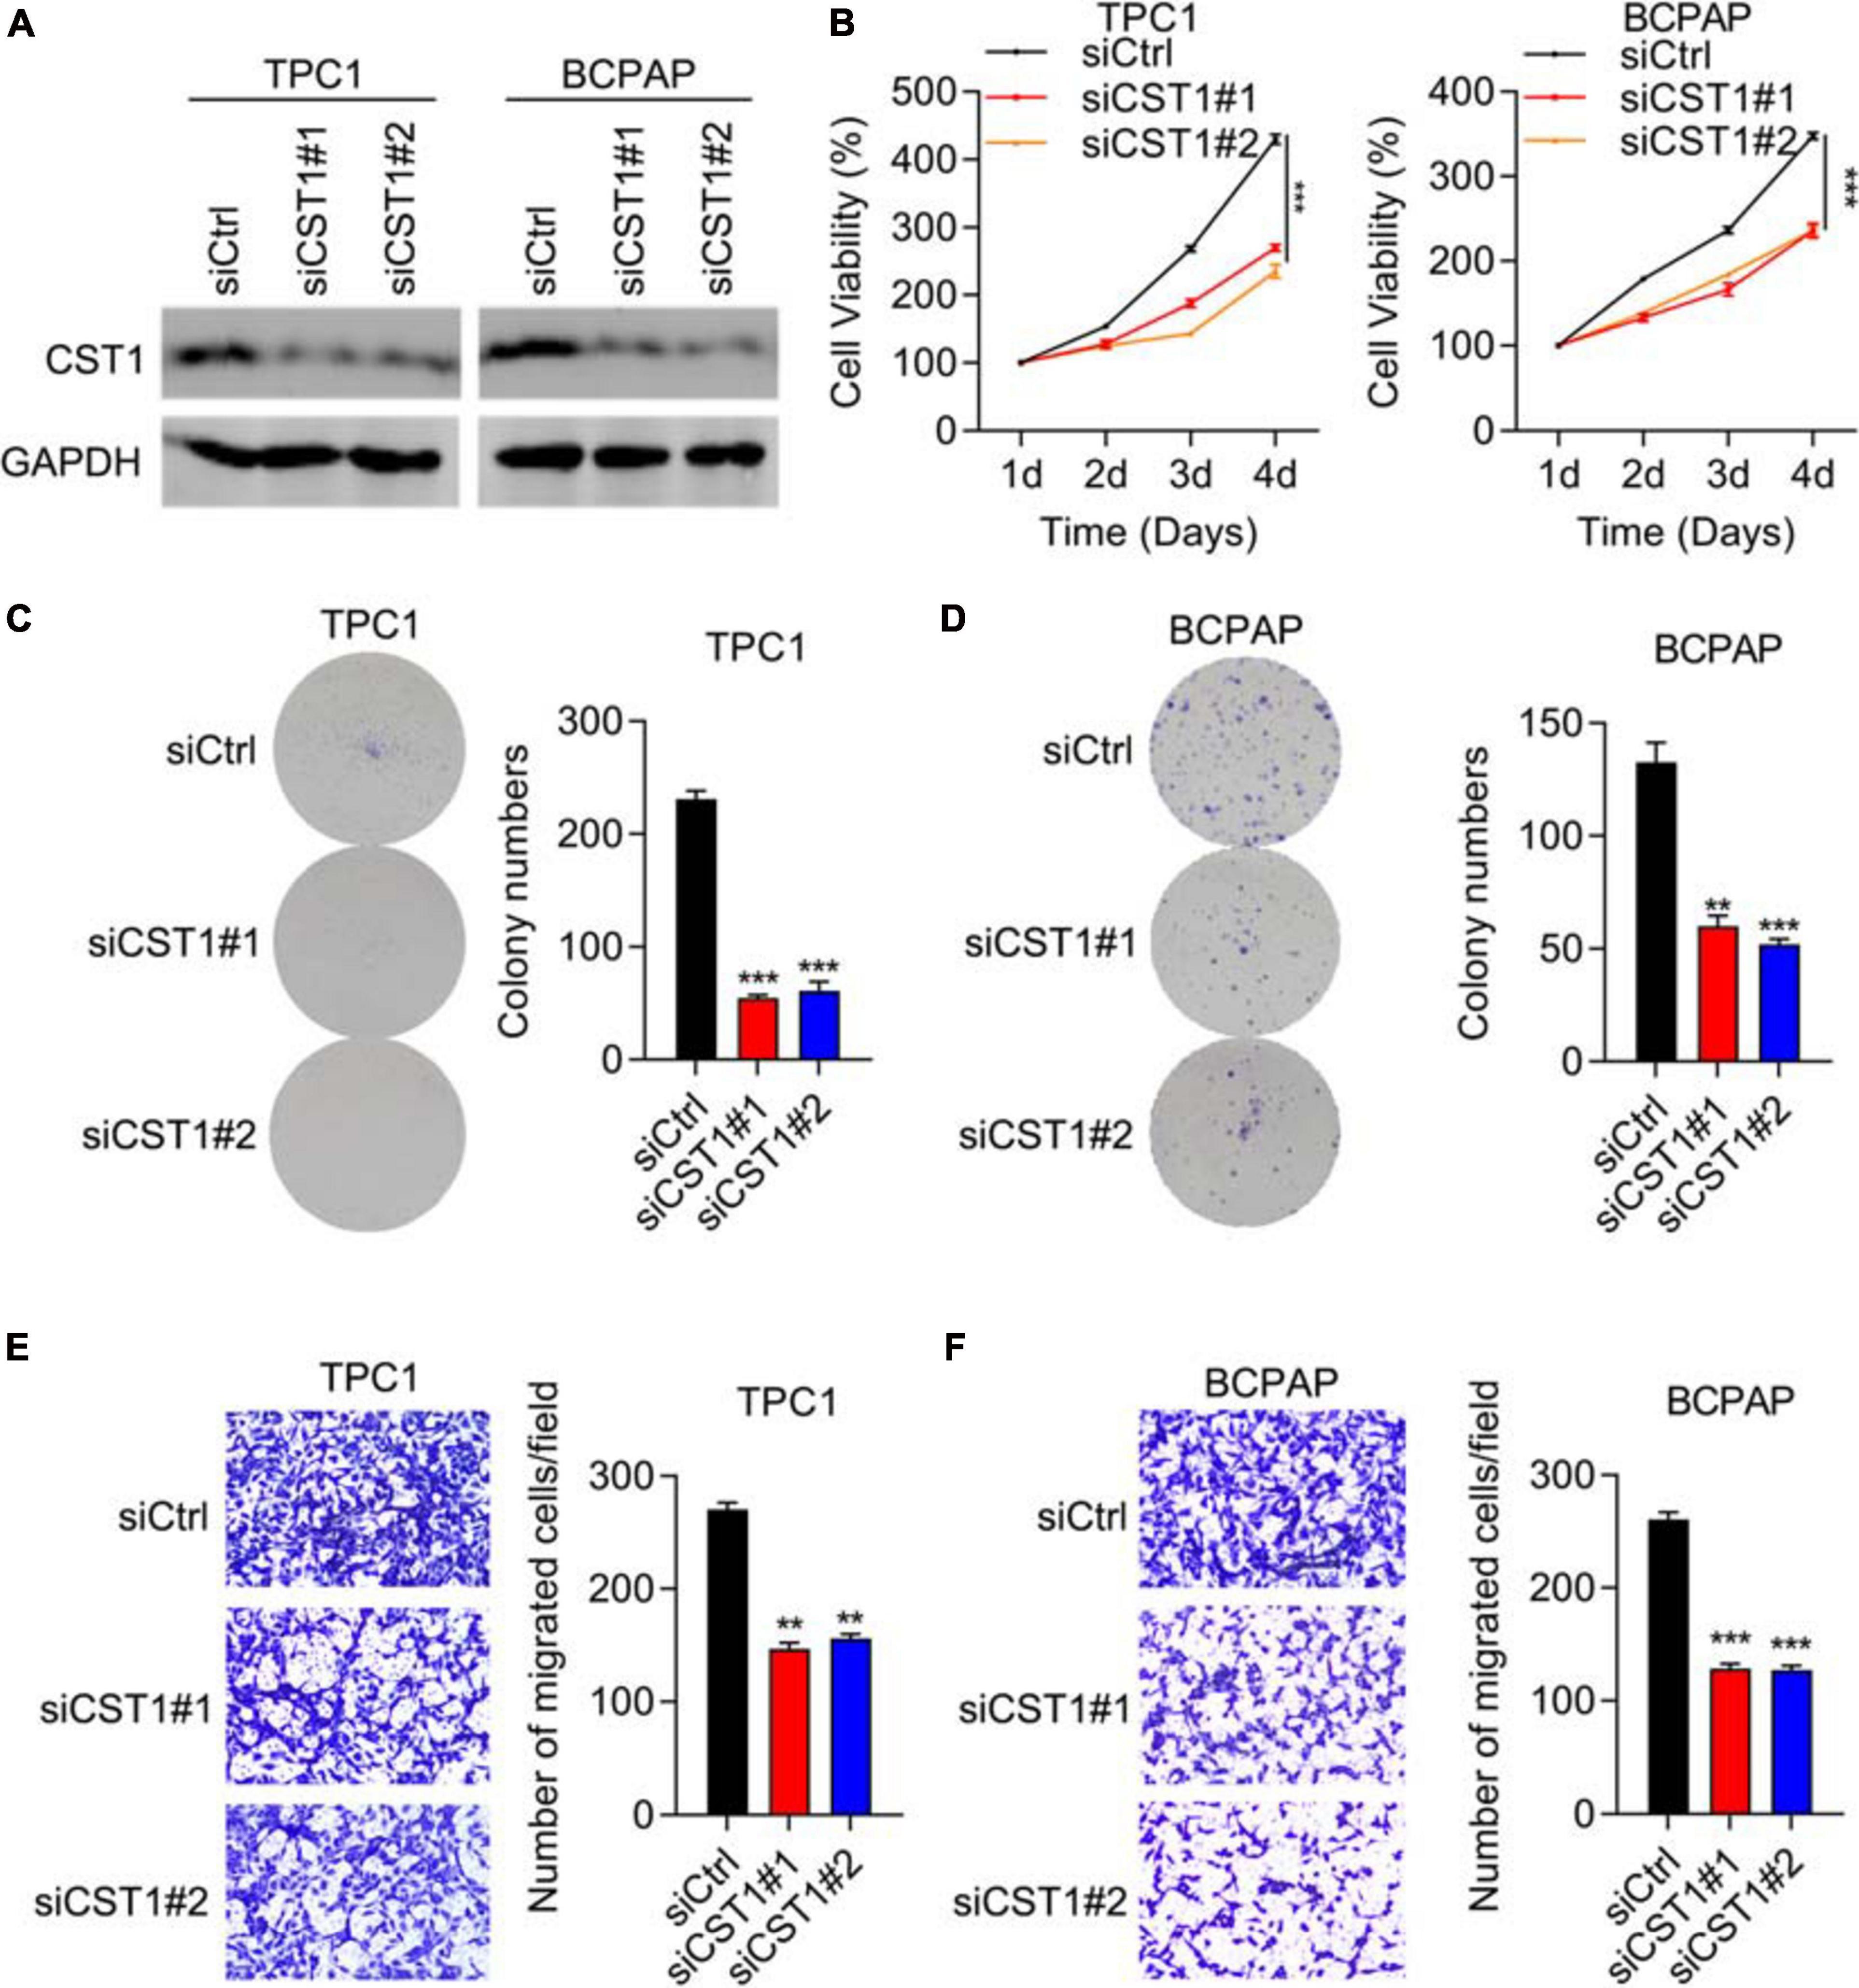
Figure 7. Depletion of CST1 inhibits proliferation and invasion and promotes apoptosis. (A) Effective knockdown of CST1 in TPC1 and BCPAP cells. Western blot of TPC1 and BCPAP cells transfected with siCtrl, siCST1#1, and siCST1#2. GAPDH served as a loading control. (B) Cell viability analysis of siCtrl, siCST1#1, and siCST1#2 transfected into TPC1 and BCPAP cells using the CCK8 assay. ***P < 0.001. (C,D) Colony formation analysis of siCtrl, siCST1#1, and siCST1#2 transfected into TPC1 (C) and BCPAP (D) cells. **P < 0.01; ***P < 0.001. (E,F) Invasion analysis of siCtrl, siCST1#1, and siCST1#2 transfected into TPC1 (E) and BCPAP (F) cells. **P < 0.01; ***P < 0.001.
To further clarify the relationship between ENO1 and CST1 in thyroid carcinoma, we combined overexpression and knockdown assays in TPC1 cells. Western blotting showed that ENO1 overexpression upregulated CST1 expression and reduced it after shCST1 treatment (Figure 8A). Next, cell viability and colony formation assays were performed. Knockdown of CST1 significantly reduced cell viability enhanced with ENO1 overexpression to control level (Figures 8B,C). Invasion ability was also attenuated by CST1 depletion (Figure 8D). Finally, in vivo tumorigenicity was measured. Following the previous result (Figure 2G), overexpression of ENO1 resulted in larger tumor sizes (Figures 8E–G), suggesting that ENO1 was an oncogene. As predicted, tumor size enlargement was reduced to control levels with shCST1 treatment (Figures 8E–G). These findings suggest a synergistic role between ENO1 and CST1 in thyroid carcinoma progression.
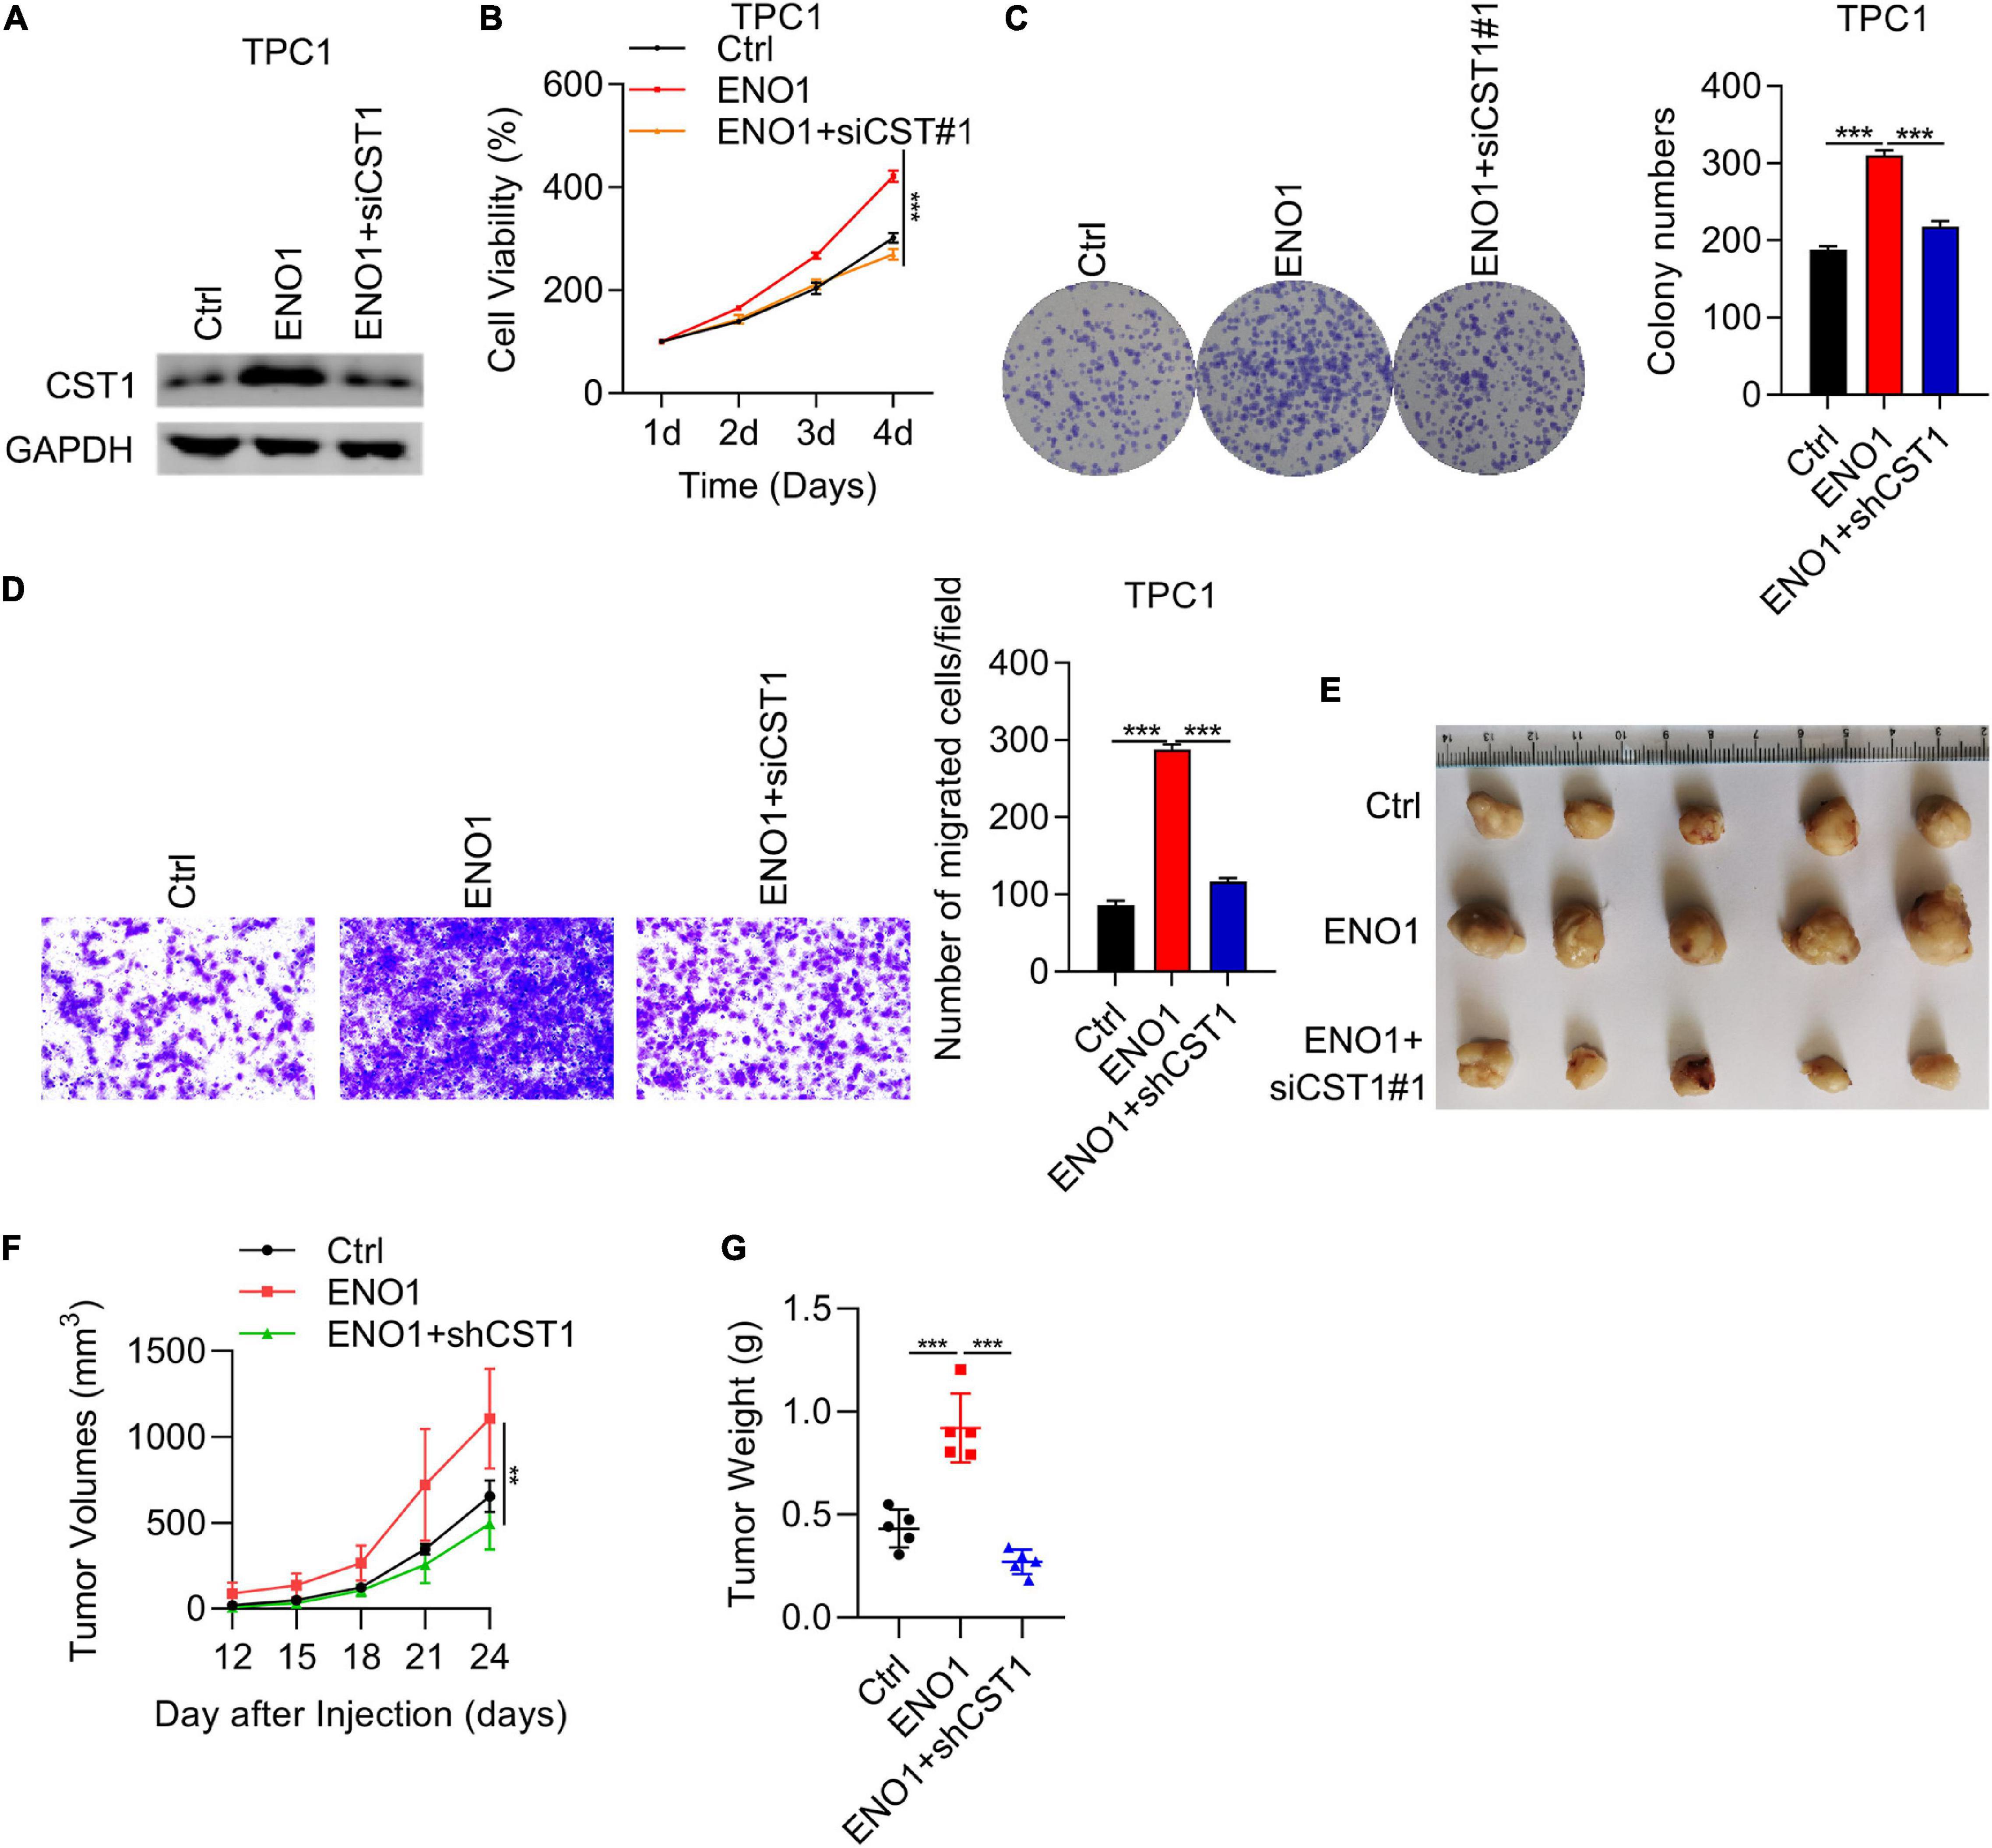
Figure 8. Proliferation, invasion, and tumorigenicity enhanced by ENO1 overexpression is attenuated by CST1 depletion. (A) Western blot analysis of CST1 in TPC1 cells transfected with control, ENO1, and ENO1+shCST1. GAPDH was used as a loading control. (B) CCK8 cell viability analysis of TPC1 cells transfected with control, ENO1, and ENO1+shCST1. ***P < 0.001. (C) Colony formation analysis of TPC1 cells transfected with control, ENO1, and ENO1+shCST1. ***P < 0.001. (D) Invasion ability analysis of TPC1 cells transfected with control, ENO1, and ENO1+shCST1. ***P < 0.001. (E–G) Tumor formation analysis in athymic nude mice (n = 5) injected with TPC1 cell lines expressing control, ENO1, and ENO1+shCST1. Representative image (E), tumor growth curve (F) and tumor (G) weight of xenografted tumors are shown. **P < 0.01; ***P < 0.001.
Traditional therapy strategies such as radioactive-iodine ablation and surgical resection are essential for thyroid carcinoma treatment. Currently, novel targeted strategies play increasingly essential roles in thyroid carcinoma treatment, especially for aggressive thyroid tumors (Kondo et al., 2006). Therefore, more potential targeted genes need to be identified, and their mechanisms need to be further clarified. Our study demonstrated that ENO1 was an oncogene in thyroid carcinoma that acted downstream of mTOR/HIF1α and accelerated thyroid carcinoma progression via regulating CST1. Because ENO1 has been identified as an oncogene in several cancers (Nakajima et al., 1986; Tu et al., 2010; Song et al., 2014; Fu et al., 2015; Liu et al., 2015; Principe et al., 2015; Zhu et al., 2015, 2018; Niccolai et al., 2016; Qian et al., 2017; Zhan et al., 2017), it could be a potential novel target for thyroid carcinoma. Our study paves the way for targeted strategies of thyroid carcinoma treatment.
Enolase has three isoforms in higher eukaryotes: ENO1 is widely expressed in nearly all tissues, whereas ENO2 and ENO3 are specifically expressed in neurons and muscles, respectively (Chen et al., 2020). Although there have been several reports of ENO1, the functions of ENO2 and ENO3 have been rarely reported. Whether ENO2 and ENO3 function as oncogenes in neurons and muscles needs to be clarified. We also need to understand whether the functions of the three ENOs are synergistic or antagonistic.
The localization of ENO1 varies depending on its function. In the cytoplasm, ENO1 maintains ATP levels and associates with the cytoskeleton. At the cell membrane, ENO1 activates the plasminogen system to accelerate tumor cell invasion. ENO1 also localizes in the nucleus to regulate c-myc expression and impede tumor growth (Cappello et al., 2017; Yin et al., 2018). To further explore the mechanism of ENO1 as an oncogene, the precise localization of ENO1 in thyroid carcinoma cells needs to be identified.
The Warburg effect occurs in most tumor cells (Warburg et al., 1927). In these cells, glycolysis is enhanced. The tricarboxylic acid cycle is inhibited even in abundant oxygen because enhanced glycolysis can provide more efficient glucose consumption to promote tumor cell growth (Lunt and Vander Heiden, 2011). As a glycolytic enzyme, ENO1 overexpression enhances the glycolytic pathway (Yin et al., 2018). There are also reports that PI3K/AKT/mTOR/HIF1α upregulates the expression of glucose transporters and glycolytic enzymes (Majumder et al., 2004; Semenza, 2011; Chi, 2012; Cheng et al., 2014; Courtnay et al., 2015; Yang et al., 2015; Xiao et al., 2017); HIF1α also targets ENO1 (Qian et al., 2017). Therefore, enhanced glycolysis may be the reason why mTOR/HIF1α/ENO1 promotes thyroid carcinoma progression. The mTOR/HIF1α/ENO1 pathway can also enhance glycolysis in other cancers. However, all these effects need to be further clarified.
Type 2 cystatin superfamily, consisting of CST1, CST2, CST3, CST4, and CST5, exerts cysteine proteases inhibitor effect and is widely expressed in multiple organs. Increasing evidences have demonstrated that dysregulation of CST1 contributes to the development of various cancers. For instance, CST1 expression was elevated in and conferred poor prognosis of breast cancer patients. CST1 also promoted the malignant function of breast cancer cells (Dai et al., 2017). Overexpression of CST1 also contributed colorectal cancer growth via reducing intracellular reactive oxygen species (ROS) production (Oh et al., 2017). In addition, upregulation of CST1 promoted hepatocellular carcinogenesis and predicted worse prognosis for the patients (Cui et al., 2019). Besides, elevation of CST1 is a promising diagnostic biomarker for other cancer types, including pancreatic cancer (Jiang et al., 2015), esophageal squamous cell carcinoma (Chen et al., 2013), and gastric cancer (Choi et al., 2009). Nevertheless, the significance of CST1 in thyroid carcinoma and the upstream regulator of CST1 remain to be determined. In this study, we presented the data that ENO1 positively regulated the expression of CST1 and CST4 in thyroid carcinoma cells. There was a positive correlation between ENO1 and CST1/CST4 in human thyroid carcinoma tissues. Functional experiments demonstrated that knockdown of CST1, but not CST4, suppressed the growth of growth of thyroid carcinoma cells. Furthermore, knockdown of CST1 reduced the migration capacity of thyroid carcinoma cells. Importantly, CST1 silencing reversed the oncogenic function of ENO1 on thyroid carcinoma cell growth, migration and tumorigenic capacity. These results suggested that ENO1 upregulation of CST1 contributed to thyroid carcinoma growth, migration and tumor development.
In summary, although many complicated questions have not been answered, our study was the first to identify the mTOR/HIF1α/ENO1 pathway in thyroid carcinoma progression and ENO1 as a regulator of CST1, thereby paving the way for early diagnosis and efficient therapy of thyroid carcinoma.
The data presented in the study are deposited in the NCBI Short Read Archive (SRA) repository, accession number is SUB9428898, and the BioProject ID is PRJNA719990.
The studies involving human participants were reviewed and approved by the Ethics Committee of National Cancer Center/National Clinical Research Center for Cancer/Cancer Hospital, Chinese Academy of Medical Sciences and Peking Union Medical College. The patients/participants provided their written informed consent to participate in this study. The animal study was reviewed and approved by the Ethics Committee of National Cancer Center/National Clinical Research Center for Cancer/Cancer Hospital, Chinese Academy of Medical Sciences and Peking Union Medical College.
SL, JL, and YL designed the original study. YL performed the most experiments. LL performed the in vivo assay. CA assisted with statistical analysis. XW, ZL, and ZX collected the clinical samples. YL wrote and revised the manuscript draft. All authors read and approved the final manuscript.
This study was funded by the National Natural Science Foundation of China (Grant No. 81902728).
The authors declare that the research was conducted in the absence of any commercial or financial relationships that could be construed as a potential conflict of interest.
The Supplementary Material for this article can be found online at: https://www.frontiersin.org/articles/10.3389/fcell.2021.670019/full#supplementary-material
Cao, H., Luo, J., Zhang, Y., Mao, X., Wen, P., Ding, H., et al. (2020). Tuberous sclerosis 1 (Tsc1) mediated mTORC1 activation promotes glycolysis in tubular epithelial cells in kidney fibrosis. Kidney Int. 98, 686–698. doi: 10.1016/j.kint.2020.03.035
Capello, M., Ferri-Borgogno, S., Riganti, C., Chattaragada, M. S., Principe, M., Roux, C., et al. (2016). Targeting the Warburg effect in cancer cells through ENO1 knockdown rescues oxidative phosphorylation and induces growth arrest. Oncotarget 7, 5598–5612. doi: 10.18632/oncotarget.6798
Cappello, P., Principe, M., Bulfamante, S., and Novelli, F. (2017). Alpha-Enolase (ENO1), a potential target in novel immunotherapies. Front. Biosci. 22:944–959. doi: 10.2741/4526
Catalano, M. G., Poli, R., Pugliese, M., Fortunati, N., and Boccuzzi, G. (2010). Emerging molecular therapies of advanced thyroid cancer. Mol. Aspects Med. 31, 215–226. doi: 10.1016/j.mam.2010.02.006
Chen, J. M., Chiu, S. C., Chen, K. C., Huang, Y. J., Liao, Y. A., and Yu, C. R. (2020). Enolase 1 differentially contributes to cell transformation in lung cancer but not in esophageal cancer. Oncol. Lett. 19, 3189–3196. doi: 10.3892/ol.2020.11427
Chen, Y., Ma, G., Cao, X., Luo, R., He, L., He, J., et al. (2013). Overexpression of cystatin SN positively affects survival of patients with surgically resected esophageal squamous cell carcinoma. BMC Surg. 13:15. doi: 10.1186/1471-2482-13-15
Cheng, S. C., Quintin, J., Cramer, R. A., Shepardson, K. M., Saeed, S., Kumar, V., et al. (2014). mTOR- and HIF-1alpha-mediated aerobic glycolysis as metabolic basis for trained immunity. Science 345:1250684. doi: 10.1126/science.1250684
Chi, H. (2012). Regulation and function of mTOR signalling in T cell fate decisions. Nat. Rev. Immunol. 12, 325–338. doi: 10.1038/nri3198
Choi, E., Kim, J., Kim, J., Kim, S., Song, E., Kim, J., et al. (2009). Upregulation of the cysteine protease inhibitor, cystatin SN, contributes to cell proliferation and cathepsin inhibition in gastric cancer. Clin. Chim. Acta 406, 45–51. doi: 10.1016/j.cca.2009.05.008
Coelho, R., Fortunato, R., and Carvalho, D. (2018). Metabolic reprogramming in thyroid carcinoma. Front. Oncol. 8:82. doi: 10.3389/fonc.2018.00082
Courtnay, R., Ngo, D. C., Malik, N., Ververis, K., Tortorella, S. M., and Karagiannis, T. C. (2015). Cancer metabolism and the Warburg effect: the role of HIF-1 and PI3K. Mol. Biol. Rep. 42, 841–851. doi: 10.1007/s11033-015-3858-x
Cui, Y., Sun, D., Song, R., Zhang, S., Liu, X., Wang, Y., et al. (2019). Upregulation of cystatin SN promotes hepatocellular carcinoma progression and predicts a poor prognosis. J. Cell. Physiol. 234, 22623–22634. doi: 10.1002/jcp.28828
Dai, D. N., Li, Y., Chen, B., Du, Y., Li, S. B., Lu, S. X., et al. (2017). Elevated expression of CST1 promotes breast cancer progression and predicts a poor prognosis. J. Mol. Med. 95, 873–886. doi: 10.1007/s00109-017-1537-1
Diaz-Ramos, A., Roig-Borrellas, A., Garcia-Melero, A., and Lopez-Alemany, R. (2012). alpha-Enolase, a multifunctional protein: its role on pathophysiological situations. J. Biomed. Biotechnol. 2012:56795. doi: 10.1155/2012/156795
Edwards, S. R., and Wandless, T. J. (2007). The rapamycin-binding domain of the protein kinase mammalian target of rapamycin is a destabilizing domain. J. Biol. Chem. 282, 13395–13401. doi: 10.1074/jbc.M700498200
Ejeskar, K., Krona, C., Caren, H., Zaibak, F., Li, L., Martinsson, T., et al. (2005). Introduction of in vitro transcribed ENO1 mRNA into neuroblastoma cells induces cell death. BMC Cancer 5:161. doi: 10.1186/1471-2407-5-161
Fu, Q. F., Liu, Y., Fan, Y., Hua, S. N., Qu, H. Y., Dong, S. W., et al. (2015). Alpha-enolase promotes cell glycolysis, growth, migration, and invasion in non-small cell lung cancer through FAK-mediated PI3K/AKT pathway. J. Hematol. Oncol. 8:22. doi: 10.1186/s13045-015-0117-5
Hsiao, K. C., Shih, N. Y., Fang, H. L., Huang, T. S., Kuo, C. C., Chu, P. Y., et al. (2013). Surface alpha-enolase promotes extracellular matrix degradation and tumor metastasis and represents a new therapeutic target. PLoS One 8:e69354. doi: 10.1371/journal.pone.0069354
Huang, Z., Lin, B., Pan, H., Du, J., He, R., Zhang, S., et al. (2019). Gene expression profile analysis of ENO1 knockdown in gastric cancer cell line MGC-803. Oncol. Lett. 17, 3881–3889. doi: 10.3892/ol.2019.10053
Hundahl, S. A., Fleming, I. D., Fremgen, A. M., and Menck, H. R. (1998). A National cancer data base report on 53,856 cases of thyroid carcinoma treated in the U.S., 1985-1995 [see commetns]. Cancer 83, 2638–2648. doi: 10.1002/(sici)1097-0142(19981215)83:12<2638::aid-cncr31<3.0.co;2-1
Jaiswal, P. K., Koul, S., Palanisamy, N., and Koul, H. K. (2019). Eukaryotic translation initiation factor 4 Gamma 1 (EIF4G1): a target for cancer therapeutic intervention? Cancer Cell Int. 19:224. doi: 10.1186/s12935-019-0947-2
Jiang, J., Liu, H., Liu, Z., Tan, S., and Wu, B. (2015). Identification of cystatin SN as a novel biomarker for pancreatic cancer. Tumour Biol. 36, 3903–3910. doi: 10.1007/s13277-014-3033-3
Jiang, J., Liu, H. L., Tao, L., Lin, X. Y., Yang, Y. D., Tan, S. W., et al. (2018). Let7d inhibits colorectal cancer cell proliferation through the CST1/p65 pathway. Int. J. Oncol. 53, 781–790. doi: 10.3892/ijo.2018.4419
Knauf, J. A., Ouyang, B., Knudsen, E. S., Fukasawa, K., Babcock, G., and Fagin, J. A. (2006). Oncogenic RAS induces accelerated transition through G2/M and promotes defects in the G2 DNA damage and mitotic spindle checkpoints. J. Biol. Chem. 281, 3800–3809. doi: 10.1074/jbc.M511690200
Kondo, T., Ezzat, S., and Asa, S. L. (2006). Pathogenetic mechanisms in thyroid follicular-cell neoplasia. Nat. Rev. Cancer 6, 292–306. doi: 10.1038/nrc1836
Koppenol, W., Bounds, P., and Dang, C. (2011). Otto Warburg’s contributions to current concepts of cancer metabolism. Nat. Rev. Cancer 11, 325–337. doi: 10.1038/nrc3038
La Vecchia, C., Malvezzi, M., Bosetti, C., Garavello, W., Bertuccio, P., Levi, F., et al. (2015). Thyroid cancer mortality and incidence: a global overview. Int. J. Cancer 136, 2187–2195. doi: 10.1002/ijc.29251
Lim, H., Devesa, S. S., Sosa, J. A., Check, D., and Kitahara, C. M. (2017). Trends in thyroid cancer incidence and mortality in the United States, 1974-2013. JAMA 317, 1338–1348. doi: 10.1001/jama.2017.2719
Liu, Y., Ma, H., Wang, Y., Du, X., and Yao, J. (2019). Cystatin SN affects cell proliferation by regulating the ERalpha/PI3K/AKT/ERalpha loopback pathway in breast cancer. Onco Targets Ther. 12, 11359–11369. doi: 10.2147/OTT.S234328
Liu, Y. Q., Huang, Z. G., Li, G. N., Du, J. L., Ou, Y. P., Zhang, X. N., et al. (2015). Effects of alpha-enolase (ENO1) over-expression on malignant biological behaviors of AGS cells. Int. J. Clin. Exp. Med. 8, 231–239.
Lunt, S. Y., and Vander Heiden, M. G. (2011). Aerobic glycolysis: meeting the metabolic requirements of cell proliferation. Annu. Rev. Cell Dev. Biol. 27, 441–464. doi: 10.1146/annurev-cellbio-092910-154237
Majumder, P. K., Febbo, P. G., Bikoff, R., Berger, R., Xue, Q., Mcmahon, L. M., et al. (2004). mTOR inhibition reverses Akt-dependent prostate intraepithelial neoplasia through regulation of apoptotic and HIF-1-dependent pathways. Nat. Med. 10, 594–601. doi: 10.1038/nm1052
Mitsutake, N., Knauf, J. A., Mitsutake, S., Mesa, C. Jr., Zhang, L., and Fagin, J. A. (2005). Conditional BRAFV600E expression induces DNA synthesis, apoptosis, dedifferentiation, and chromosomal instability in thyroid PCCL3 cells. Cancer Res. 65, 2465–2473. doi: 10.1158/0008-5472.CAN-04-3314
Nakajima, T., Kato, K., Kaneko, A., Tsumuraya, M., Morinaga, S., and Shimosato, Y. (1986). High concentrations of enolase, alpha- and gamma-subunits, in the aqueous humor in cases of retinoblastoma. Am. J. Ophthalmol. 101, 102–106. doi: 10.1016/0002-9394(86)90471-x
Niccolai, E., Cappello, P., Taddei, A., Ricci, F., D’elios, M. M., Benagiano, M., et al. (2016). Peripheral ENO1-specific T cells mirror the intratumoral immune response and their presence is a potential prognostic factor for pancreatic adenocarcinoma. Int. J. Oncol. 49, 393–401. doi: 10.3892/ijo.2016.3524
Oh, B. M., Lee, S. J., Cho, H. J., Park, Y. S., Kim, J. T., Yoon, S. R., et al. (2017). Cystatin SN inhibits auranofin-induced cell death by autophagic induction and ROS regulation via glutathione reductase activity in colorectal cancer. Cell Death Dis. 8:e2682. doi: 10.1038/cddis.2017.100
Pan, C., Liu, Q., and Wu, X. (2019). HIF1alpha/miR-520a-3p/AKT1/mTOR feedback promotes the proliferation and glycolysis of gastric cancer cells. Cancer Manag. Res. 11, 10145–10156. doi: 10.2147/CMAR.S223473
Pancholi, V. (2001). Multifunctional alpha-enolase: its role in diseases. Cell. Mol. Life Sci. 58, 902–920. doi: 10.1007/pl00000910
Parkin, D. M., Bray, F., Ferlay, J., and Pisani, P. (2005). Global cancer statistics, 2002. CA Cancer J. Clin. 55, 74–108. doi: 10.3322/canjclin.55.2.74
Paschke, R., Lincke, T., Muller, S. P., Kreissl, M. C., Dralle, H., and Fassnacht, M. (2015). The treatment of well-differentiated thyroid carcinoma. Dtsch. Arztebl. Int. 112, 452–458. doi: 10.3238/arztebl.2015.0452
Principe, M., Borgoni, S., Cascione, M., Chattaragada, M. S., Ferri-Borgogno, S., Capello, M., et al. (2017). Alpha-enolase (ENO1) controls alpha v/beta 3 integrin expression and regulates pancreatic cancer adhesion, invasion, and metastasis. J. Hematol. Oncol. 10:16. doi: 10.1186/s13045-016-0385-8
Principe, M., Ceruti, P., Shih, N. Y., Chattaragada, M. S., Rolla, S., Conti, L., et al. (2015). Targeting of surface alpha-enolase inhibits the invasiveness of pancreatic cancer cells. Oncotarget 6, 11098–11113. doi: 10.18632/oncotarget.3572
Qian, X., Xu, W., Xu, J., Shi, Q., Li, J., Weng, Y., et al. (2017). Enolase 1 stimulates glycolysis to promote chemoresistance in gastric cancer. Oncotarget 8, 47691–47708. doi: 10.18632/oncotarget.17868
Saavedra, H. I., Knauf, J. A., Shirokawa, J. M., Wang, J., Ouyang, B., Elisei, R., et al. (2000). The RAS oncogene induces genomic instability in thyroid PCCL3 cells via the MAPK pathway. Oncogene 19, 3948–3954. doi: 10.1038/sj.onc.1203723
Saiselet, M., Floor, S., Tarabichi, M., Dom, G., Hebrant, A., van Staveren, W. C., et al. (2012). Thyroid cancer cell lines: an overview. Front. Endocrinol. 3:133. doi: 10.3389/fendo.2012.00133
Semenza, G. L. (2011). Hypoxia-inducible factor 1: regulator of mitochondrial metabolism and mediator of ischemic preconditioning. Biochim. Biophys. Acta 1813, 1263–1268. doi: 10.1016/j.bbamcr.2010.08.006
Sipos, J. A., and Mazzaferri, E. L. (2010). Thyroid cancer epidemiology and prognostic variables. Clin. Oncol. (R. Coll. Radiol.) 22, 395–404. doi: 10.1016/j.clon.2010.05.004
Song, Y., Luo, Q., Long, H., Hu, Z., Que, T., Zhang, X., et al. (2014). Alpha-enolase as a potential cancer prognostic marker promotes cell growth, migration, and invasion in glioma. Mol. Cancer 13:65. doi: 10.1186/1476-4598-13-65
Sun, L., Lu, T., Tian, K., Zhou, D., Yuan, J., Wang, X., et al. (2019). Alpha-enolase promotes gastric cancer cell proliferation and metastasis via regulating AKT signaling pathway. Eur. J. Pharmacol. 845, 8–15. doi: 10.1016/j.ejphar.2018.12.035
Tu, S. H., Chang, C. C., Chen, C. S., Tam, K. W., Wang, Y. J., Lee, C. H., et al. (2010). Increased expression of enolase alpha in human breast cancer confers tamoxifen resistance in human breast cancer cells. Breast Cancer Res. Treat. 121, 539–553. doi: 10.1007/s10549-009-0492-0
Wang, W., He, Y., Zhao, Q., Zhao, X., and Li, Z. (2020). Identification of potential key genes in gastric cancer using bioinformatics analysis. Biomed. Rep. 12, 178–192. doi: 10.3892/br.2020.1281
Warburg, O., Wind, F., and Negelein, E. (1927). The metabolism of tumors in the body. J. Gen. Physiol. 8, 519–530. doi: 10.1085/jgp.8.6.519
Wei, J., Wu, J., Xu, W., Nie, H., Zhou, R., Wang, R., et al. (2018). Salvianolic acid B inhibits glycolysis in oral squamous cell carcinoma via targeting PI3K/AKT/HIF-1alpha signaling pathway. Cell Death Dis. 9:599. doi: 10.1038/s41419-018-0623-9
Xiao, Y., Peng, H., Hong, C., Chen, Z., Deng, X., Wang, A., et al. (2017). PDGF promotes the Warburg effect in pulmonary arterial smooth muscle cells via activation of the PI3K/AKT/mTOR/HIF-1alpha signaling pathway. Cell. Physiol. Biochem. 42, 1603–1613. doi: 10.1159/000479401
Xing, M. (2010). Prognostic utility of BRAF mutation in papillary thyroid cancer. Mol. Cell. Endocrinol. 321, 86–93. doi: 10.1016/j.mce.2009.10.012
Yang, X., Cheng, Y., Li, P., Tao, J., Deng, X., Zhang, X., et al. (2015). A lentiviral sponge for miRNA-21 diminishes aerobic glycolysis in bladder cancer T24 cells via the PTEN/PI3K/AKT/mTOR axis. Tumour Biol. 36, 383–391. doi: 10.1007/s13277-014-2617-2
Yin, H., Wang, L., and Liu, H. L. (2018). ENO1 overexpression in pancreatic cancer patients and its clinical and diagnostic significance. Gastroenterol. Res. Pract. 2018:3842198. doi: 10.1155/2018/3842198
Zakrzewicz, D., Didiasova, M., Zakrzewicz, A., Hocke, A. C., Uhle, F., Markart, P., et al. (2014). The interaction of enolase-1 with caveolae-associated proteins regulates its subcellular localization. Biochem. J. 460, 295–307. doi: 10.1042/BJ20130945
Zhan, P., Zhao, S., Yan, H., Yin, C., Xiao, Y., Wang, Y., et al. (2017). alpha-enolase promotes tumorigenesis and metastasis via regulating AMPK/mTOR pathway in colorectal cancer. Mol. Carcinog. 56, 1427–1437. doi: 10.1002/mc.22603
Zhang, X., Wang, S., Wang, H., Cao, J., Huang, X., Chen, Z., et al. (2019). Circular RNA circNRIP1 acts as a microRNA-149-5p sponge to promote gastric cancer progression via the AKT1/mTOR pathway. Mol. Cancer 18:20. doi: 10.1186/s12943-018-0935-5
Zhao, M., Fang, W., Wang, Y., Guo, S., Shu, L., Wang, L., et al. (2015). Enolase-1 is a therapeutic target in endometrial carcinoma. Oncotarget 6, 15610–15627. doi: 10.18632/oncotarget.3639
Zhu, W., Li, H., Yu, Y., Chen, J., Chen, X., Ren, F., et al. (2018). Enolase-1 serves as a biomarker of diagnosis and prognosis in hepatocellular carcinoma patients. Cancer Manag. Res. 10, 5735–5745. doi: 10.2147/CMAR.S182183
Keywords: ENO1, thyroid carcinoma, CST1, mTOR, HIF1α
Citation: Liu Y, Liao L, An C, Wang X, Li Z, Xu Z, Liu J and Liu S (2021) α-Enolase Lies Downstream of mTOR/HIF1α and Promotes Thyroid Carcinoma Progression by Regulating CST1. Front. Cell Dev. Biol. 9:670019. doi: 10.3389/fcell.2021.670019
Received: 19 February 2021; Accepted: 29 March 2021;
Published: 21 April 2021.
Edited by:
Kevin J. Ni, St. George Hospital, AustraliaReviewed by:
Xiaofang Xing, Peking University Cancer Hospital, ChinaCopyright © 2021 Liu, Liao, An, Wang, Li, Xu, Liu and Liu. This is an open-access article distributed under the terms of the Creative Commons Attribution License (CC BY). The use, distribution or reproduction in other forums is permitted, provided the original author(s) and the copyright owner(s) are credited and that the original publication in this journal is cited, in accordance with accepted academic practice. No use, distribution or reproduction is permitted which does not comply with these terms.
*Correspondence: Shaoyan Liu, bmNjbHN5QDEyNi5jb20=; Jie Liu, bGl1akBjaWNhbXMuYWMuY24=
Disclaimer: All claims expressed in this article are solely those of the authors and do not necessarily represent those of their affiliated organizations, or those of the publisher, the editors and the reviewers. Any product that may be evaluated in this article or claim that may be made by its manufacturer is not guaranteed or endorsed by the publisher.
Research integrity at Frontiers

Learn more about the work of our research integrity team to safeguard the quality of each article we publish.