
94% of researchers rate our articles as excellent or good
Learn more about the work of our research integrity team to safeguard the quality of each article we publish.
Find out more
ORIGINAL RESEARCH article
Front. Cell Dev. Biol., 18 February 2021
Sec. Signaling
Volume 9 - 2021 | https://doi.org/10.3389/fcell.2021.638037
This article is part of the Research TopicExtracellular Nucleotides on Lymphocyte FunctionView all 7 articles
 Pedro Briceño1†
 Elizabeth Rivas-Yañez1,2†
 Mariana V. Rosemblatt1,2Brian Parra-Tello1Paula Farías3Leonardo Vargas1
 Valeska Simon1
 César Cárdenas3
 Alvaro Lladser2,4Flavio Salazar-Onfray5,6
 Alvaro A. Elorza6,7
 Mario Rosemblatt1,2,4
 María Rosa Bono1*
 Daniela Sauma1*
CD39 and CD73 are ectoenzymes that dephosphorylate ATP into its metabolites; ADP, AMP, and adenosine, and thus are considered instrumental in the development of immunosuppressive microenvironments. We have previously shown that within the CD8+ T cell population, naïve and memory cells express the CD73 ectonucleotidase, while terminally differentiated effector cells are devoid of this enzyme. This evidence suggests that adenosine might exert an autocrine effect on CD8+ T cells during T cell differentiation. To study the possible role of CD73 and adenosine during this process, we compared the expression of the adenosinergic signaling components, the phenotype, and the functional properties between CD73-deficient and WT CD8+ T cells. Upon activation, we observed an upregulation of CD73 expression in CD8+ T cells along with an upregulation of the adenosine A2A receptor. Interestingly, when we differentiated CD8+ T cells to Tc1 cells in vitro, we observed that these cells produce adenosine and that CD73-deficient cells present a higher cytotoxic potential evidenced by an increase in IFN-γ, TNF-α, and granzyme B production. Moreover, CD73-deficient cells presented a increased glucose uptake and higher mitochondrial respiration, indicating that this ectonucleotidase restrict the mitochondrial capacity in CD8+ T cells. In agreement, when adoptively transferred, antigen-specific CD73-deficient CD8+ T cells were more effective in reducing the tumor burden in B16.OVA melanoma-bearing mice and presented lower levels of exhaustion markers than wild type cells. All these data suggest an autocrine effect of CD73-mediated adenosine production, limiting differentiation and cytotoxic T cells’ metabolic fitness.
Type 1 Cytotoxic CD8+ T (Tc1) cells are pivotal in the elimination of infected and transformed cells. The differentiation process that culminates in the generation of effector T CD8+ lymphocytes is not homogeneous, and during the immune response, there are T cell subsets with varying proliferative and cytotoxic capacities (Williams and Bevan, 2007; Gattinoni et al., 2012). Two populations can be distinguished following CD8+ T cell activation and clonal expansion: short-lived effector cells and memory effector cells (Kaech et al., 2003; Badovinac et al., 2004; Joshi et al., 2007). Short-lived CD8+ effector cells are characterized by a more significant commitment to the effector profile and a lower survival and self-renewal capacity than memory effector cells. Circulating memory cells are divided into two compartments: central memory lymphocytes (TCM) and effector memory T cells (TEM) (Sallusto et al., 1999; Sallusto et al., 2004). TCM cells are characterized by a lower commitment to effector differentiation and the expression of receptors for migration to secondary lymphoid organs, such as CD62L and CCR7. TEM cells, on the other side, present a higher commitment to an effector program and are capable of migrating and entering into non-lymphoid peripheral tissues. During T cell effector differentiation, the cells gradually upregulate transcription factors related to effector differentiation, such as T-bet, Blimp-1, and reduce transcription factors related to a less differentiated state such as TCF-7, Lef-1, Bcl-6, among others (Zhang and Bevan, 2011; Kaech and Cui, 2012).
The process of effector differentiation is characterized by a metabolic switch necessary to initiate the effector program and functions of cytotoxic T cells (van der Windt and Pearce, 2012; Cammann et al., 2016; Menk et al., 2018). Previous reports indicate that naive lymphocytes have a low energy demand, which they supply through oxidative phosphorylation, mainly through fatty acid oxidation (FAO) and small amounts of glucose to generate ATP (Jones and Thompson, 2007; MacIver et al., 2013). The acquisition of effector features by cytotoxic T cells results from a shift to a predominating glycolytic metabolism in detriment of FAO (Wang et al., 2011; van der Windt and Pearce, 2012; Hukelmann et al., 2016). This increase in energy demand results in increased glucose absorption, which contributes to the promotion of anabolic processes that enables cell growth, proliferation, and the production of effector molecules (Lunt and Vander Heiden, 2011; Chang et al., 2013; Pearce et al., 2013; Peng et al., 2016).
Following tissue damage, ATP is released to the extracellular space where it is rapidly hydrolyzed to adenosine by the tandem action of extracellular ectonucleotidases such as CD39 and CD73. The first step in ATP hydrolysis is catalyzed by CD39, which generates ADP and AMP (Robson et al., 2006). The second step involves the action of CD73, which hydrolyzes AMP into adenosine (Regateiro et al., 2013). It has been demonstrated that CD39 and CD73 are highly upregulated in the tumor microenvironment, which causes an increase in the intratumoral concentration of adenosine (reaching the micromolar range). Extracellular adenosine dampens the antitumor response by preventing the activation, proliferation, cytotoxicity, and cytokine production by activating A2A receptor on T cells (Huang et al., 1997; Deaglio et al., 2007; Linnemann et al., 2009; Ohta et al., 2009; Mastelic-Gavillet et al., 2019).
The expression of CD39 and CD73 ectonucleotidases was initially described in tumor cells, regulatory T cells (Tregs), and myeloid-derived suppressor cells (MDSCs), where they enhance their immunosuppressive function through the production of adenosine (Kobie et al., 2006; Borsellino et al., 2007; Deaglio et al., 2007; Li et al., 2017). However, human and murine CD8+ T cells also express these ectonucleotidases. In humans, naive CD8+ T cells express higher levels of CD73 than CD8+ memory T cells (Dianzani et al., 1993), and in vitro activation of PBMC has been reported to induce CD73 and CD39 expression (Dianzani et al., 1993; Raczkowski et al., 2018). In mice, we and others have demonstrated that CD73 is expressed on some T cell subsets, such as naïve and memory CD8+ T cells, and regulated during terminal effector differentiation (Heng et al., 2008; Flores-Santibanez et al., 2015). Despite this, the role of CD73 and CD73-generated adenosine in the differentiation of CD8+ T lymphocytes is currently unknown.
Here we report that CD73 restrains CD8+ T cell differentiation to Tc1 cells leading to reduced cytokine and granzyme B production. In agreement, CD73-deficient cells presented a higher commitment to the effector program with an increased glucose and oxygen consumption rate, indicating that this ectonucleotidase reduces the metabolic fitness in CD8+ T cells. In agreement, when adoptively transferred, antigen-specific CD73-deficient CD8+ T cells were more efficient in reducing the tumor burden in B16.OVA melanoma-bearing mice and presented a lower expression of exhaustion markers than wild type (WT) cells. All these data suggest an immunosuppressive autocrine effect of CD73-mediated adenosine production in restraining effector CD8+ T cell fitness and function.
CD73KO (B6.129S1-Nt5etm1Lft/J), C57BL/6 (CD45.2+), CD45.1+ (B6.SJL-Ptprca Pepcb/BoyJ), and OT-I mice were purchased from Jackson Laboratory. OT-I/CD73KO mice were obtained by backcrossing the F1(OT-I x CD73KO) with OT-I mice and testing for Vα2Vβ5 transgenic TCR and CD73 expression by FACS. All mice were kept in the animal facility at Fundacion Ciencia & Vida. Animal work was carried out under institutional regulations of Fundacion Ciencia & Vida and Facultad de Ciencias, Universidad de Chile, and was approved by the local ethics review committees.
Naive CD8+ T cells were purified from spleens and lymph nodes of WT or CD73KO mice. Briefly, spleens were perfused with RPMI 1640 supplemented with 10% FBS, and lymph nodes were mechanically disgregated with scissors. The cell suspension was filtered through a metal mesh and CD8+ T cells were enriched by negative selection using MACS magnetic beads (Miltenyi Biotec) following the manufacturer’s instructions. Following enrichment of CD8+ T cells, naive CD8+ T cells (CD8+/CD44low/CD62Lhigh/CD25-) were obtained by cell sorting using a FACS Aria III cell sorter (Biosciences). Naive CD8+ T cells were cultured in 96-well round-bottom microplates (105 cells/well) and were activated with soluble α-CD3 (1 μg/ml; clone 145-2C11, Biolegend) and α-CD28 (1 μg/ml; clone 37.51, Biolegend) for 3 days in the presence of 10 ng/ml of recombinant mouse IL-2 (eBioscience) to generate Tc1 cells.
Naive CD8+ T cells were purified as described above from OT-I or OT-I/CD73KO mice. These cells were intravenously injected (i.v.) into CD45.1+ mice and 24 h later, the recipient mice received an intraperitoneal (i.p.) injection of OVA protein (500 μg, Sigma-Aldrich) plus LPS (25 μg, Sigma-Aldrich). On days 4, 7, 12, and 28 mice were euthanized and blood was drawn through cardiac puncture. Red blood cells were lysed using a RBC Lysis Buffer (eBioscience) for 5 min in ice. The cell suspension was then centrifuged, stained, and resuspended in PBS+ 2% FBS for FACS analysis.
Cellular suspensions were incubated with antibodies against CD16/CD32 (Fc block, Biolegend) for 15 min at 4°C in the dark to block Fc receptors. Subsequently, the cells were incubated for 30 min at 4°C in the dark with a mixture of antibodies conjugated with different fluorochromes in the presence of a viability dye (Fixable Viability Dye eFluor 780, eBiosciencies) to discard dead cells. The cells were then centrifuged at 600 × g for 7 min at 4°C and resuspended in PBS + 2% FBS for FACS analysis.
To assess cytokine production by in vitro-generated Tc1 cells, the cells were harvested at day 3 and restimulated with 0.25 μM PMA (Sigma-Aldrich) and 1 μg/ml ionomycin (Sigma-Aldrich) in the presence of GolgiPlug (BD Biosciences) for 4 h. Cells were stained with antibodies against cell surface markers and then resuspended in a fixation/permeabilization solution (Cytofix/Cytoperm; BD Pharmingen). Following fixation and permeabilization, the cells were incubated with antibodies against IFN-γ, IL-2, and TNF-α for 30 min at 4°C. The cells were then washed with permeabilization buffer and resuspended in PBS + 2% FBS for FACS analysis.
For intracellular granzyme B staining, following cell-surface staining, the cells were resuspended in a fixation/permeabilization solution (Foxp3 transcription factor fixation and permeabilization buffer, eBioscience) for 45 min at 4°C in the dark. Cells were washed with a permeabilization buffer (Foxp3 transcription factor buffer, eBioscience) and centrifuged at 700 × g for 7 min at 4°C. The cells were then incubated with anti-granzyme B antibody diluted in the same buffer for 30 min at 4°C in the dark. After intracellular staining, the cells were washed with the permeabilization buffer, centrifuged at 700 × g for 7 min at 4°C and resuspended in PBS+ 2% FBS to be analyzed by FACS. The cells were analyzed in a FACSCanto II flow cytometer (BD Bioscience).
For A2AR staining, the cells were harvested and resuspended in a fixation/permeabilization solution (Cytofix/Cytoperm; BD Pharmingen). After fixation and permeabilization, cells were incubated with anti-A2AR antibody (clone 7F6-G5-A2) from Novus Biologicals for 30 min at 4°C. Cells were then washed with permeabilization buffer (PermWash Buffer) and resuspended in PBS + 2% FBS for FACS analysis.
Tc1 cells were resuspended in glucose-free RPMI medium at a concentration of 0.5 × 10⁶ cells/mL and incubated with the fluorescent glucose analog 2-NBDG (100 μM, ThermoFisher) for 20 min at 37°C and 5% CO2 in the dark. After this incubation, the cells were washed twice with PBS and centrifuged at 600 × g for 7 min at 4°C. Finally, the pellet was resuspended in PBS + 2% FBS for FACS analysis.
Oxygen consumption rates (OCRs) and extracellular acidification rates (ECARs) from in vitro-generated Tc1 cells (0.5 × 10⁶ cells/well) were measured in non-buffered DMEM without phenol red (2 mM L-glutamine and 1 mM sodium pyruvate) under basal conditions and in response to 10 μM glucose, 1 μM oligomycin, 0.5 fluoro-carbonyl cyanide phenylhydrazone and 1 μM rotenone + 1 μM antimycin A + and 50 μM 2-DG (Sigma). The cells were analyzed with the XF24-3 Extracellular Flux Analyzer (Seahorse Bioscience).
The production of adenosine was measured directly in the supernatants obtained during CD8+ T cell activation. For this, naive CD8+ T cells were cultured in 96-well plates at 105 cells/well in the presence of soluble α-CD3 (1 μg/mL) and α -CD28 antibodies (1 μg/mL) and IL-2 (10 ng/mL). The culture medium was harvested on days 2 and 4 of activation, then centrifuged at 1000 × g for 10 min to discard cells and stored at –20°C for further analysis.
To evaluate adenosine production by Tc1 cells in the presence of AMP, Tc1 cells were differentiated for 3 days, harvested and diluted in Hanks’ balanced salt solution (HBSS). Cells were then incubated in 96-well flat-bottom plates at 0.5 × 10⁵ cells/well with AMP (10 μM, Sigma-Aldrich) in the presence or absence of the CD73 inhibitor APCP [Adenosine 5′-(a,b-methylene) diphosphate] (50 μM, Sigma-Aldrich). After 1 h, the cells were harvested, placed on ice for 15 min, and then centrifuged at 1000 × g for 10 min. Supernatants were collected and stored at –20°C until further analysis. Adenosine production was measured using the Adenosine Assay Kit (Cell Biolabs Inc.) following the manufacturer’s instructions.
Total RNA was extracted from in vitro differentiated CD73KO and wild type Tc1 cells. Naive CD8+ T cells were isolated by cell sorting (CD8+/CD44low/CD62Lhigh/CD25-) before RNA extraction. Total RNA was obtained using EZNA Total RNA Kit I (Ω Bio-Tek). RNA (1 μg) was reverse-transcribed using M-MLV reverse transcriptase (Promega). The PCR reaction was performed using Brilliant II SYBR Green QPCR Master Mix (Agilent Technologies) in a Stratagene Mx3000P real-time PCR machine. Fold change of gene expression was determined using the 2–ΔΔCt method, which compares the expression level of each sample with WT naive CD8+ T cells. The following primers were used:
prdm1 forward 5′-GACGGGGGTACTTCTGTTCA-3′, reverse 5′-GGCATTCTTGGGAACTGTGT-3′
tbx21 forward 5′-AGCAAGGACGGCGAATGTT-3′, reverse 5′-GGGTGGACATATAAGCGGTTC-3′
hk-II forward 5′-TGATCGCCTGCTTATTCACGG-3′, reverse 5′-AACCGCCTAGAAATCTCCAGA-3′
cpt-1a forward 5′-CTCCGCCTGAGCCATGAAG-3′, reverse 5′-CACCAGTGATGATGCCATTCT-3′
hprt forward 5′-CTCCTCAGACCGCTTTTTGC-3′, reverse 5′-TAACCTGGTTCATCATCGCTAATC-3′.
B16.OVA cells were kindly provided by Dr. Randolph Noelle (Dartmouth Medical School, Hanover, NH). B16.OVA cells (0.5 × 10⁶ cells) were injected into the intradermal layer of the right flank of mice. When tumors became visible at day 7, mice were injected i.v. with 106 naive CD8 + T cells from OT-I or OT-I/CD73KO mice. The tumor size was measured every day. Two perpendicular measurements were made with a caliper, and the tumor area was calculated as the product of both measurements.
Tumors were dissected and disaggregated mechanically. Minced tissues were resuspended in 5 ml Hanks’ balanced salt solution + 5% FBS and digested in the presence of 1 mg/ml collagenase D (Roche, Mannheim, Germany) and 25 mg/ml DNase I (Roche) for 30 min at 37°C with constant agitation. The cell suspension was filtered with a 70-μm cell strainer (BD Falcon, Franklin Lakes, NJ, United States). Red blood cells were lysed using a RBC lysing solution (Biolegend), centrifuged at 600 × g for 7 min, and stained for FACS analysis.
Data are presented as mean ± SEM. Differences between two groups were determined using the two-tailed Mann–Whitney test. Differences between more than two groups were determined using one-way ANOVA with Kruskal–Wallis Test. A two-way ANOVA with Bonferroni post-test was used to compare tumor growth. Statistical analysis and graphs were obtained with GraphPad PRISM (GraphPad Software Inc).
To understand the role of CD73 ectonucleotidase and adenosine during CD8+ effector cell differentiation, we first evaluated the kinetics of expression of CD73 and CD39 on in vitro-activated CD8+ T lymphocytes. As shown in Figure 1A, naïve CD8+ T cells express high levels of the CD73 ectonucleotidase but do not express CD39. Upon activation, CD73 is further upregulated, reaching a peak of expression by day 3 (Figure 1B). Interestingly, CD39 also becomes upregulated 3 days following activation (Figures 1A,C), suggesting that activated T cells express all the enzymes needed to hydrolyze ATP to adenosine. Next, we sought to evaluate whether activated CD8+ T cells produce adenosine upon activation. As shown in Figure 1D, CD8+ T cells produce adenosine, and the concentration of this nucleoside is maintained following in vitro activation. However, when the cells were pre-incubated with AMP (the substrate of CD73), activated T cells produced higher levels of adenosine that naïve T cells and this was reversed by the addition of the CD73 enzymatic activity inhibitor APCP (Figure 1E). In conclusion, these results suggest that CD8+ T cells express CD39 and CD73 enzymes and produce adenosine upon in vitro activation.
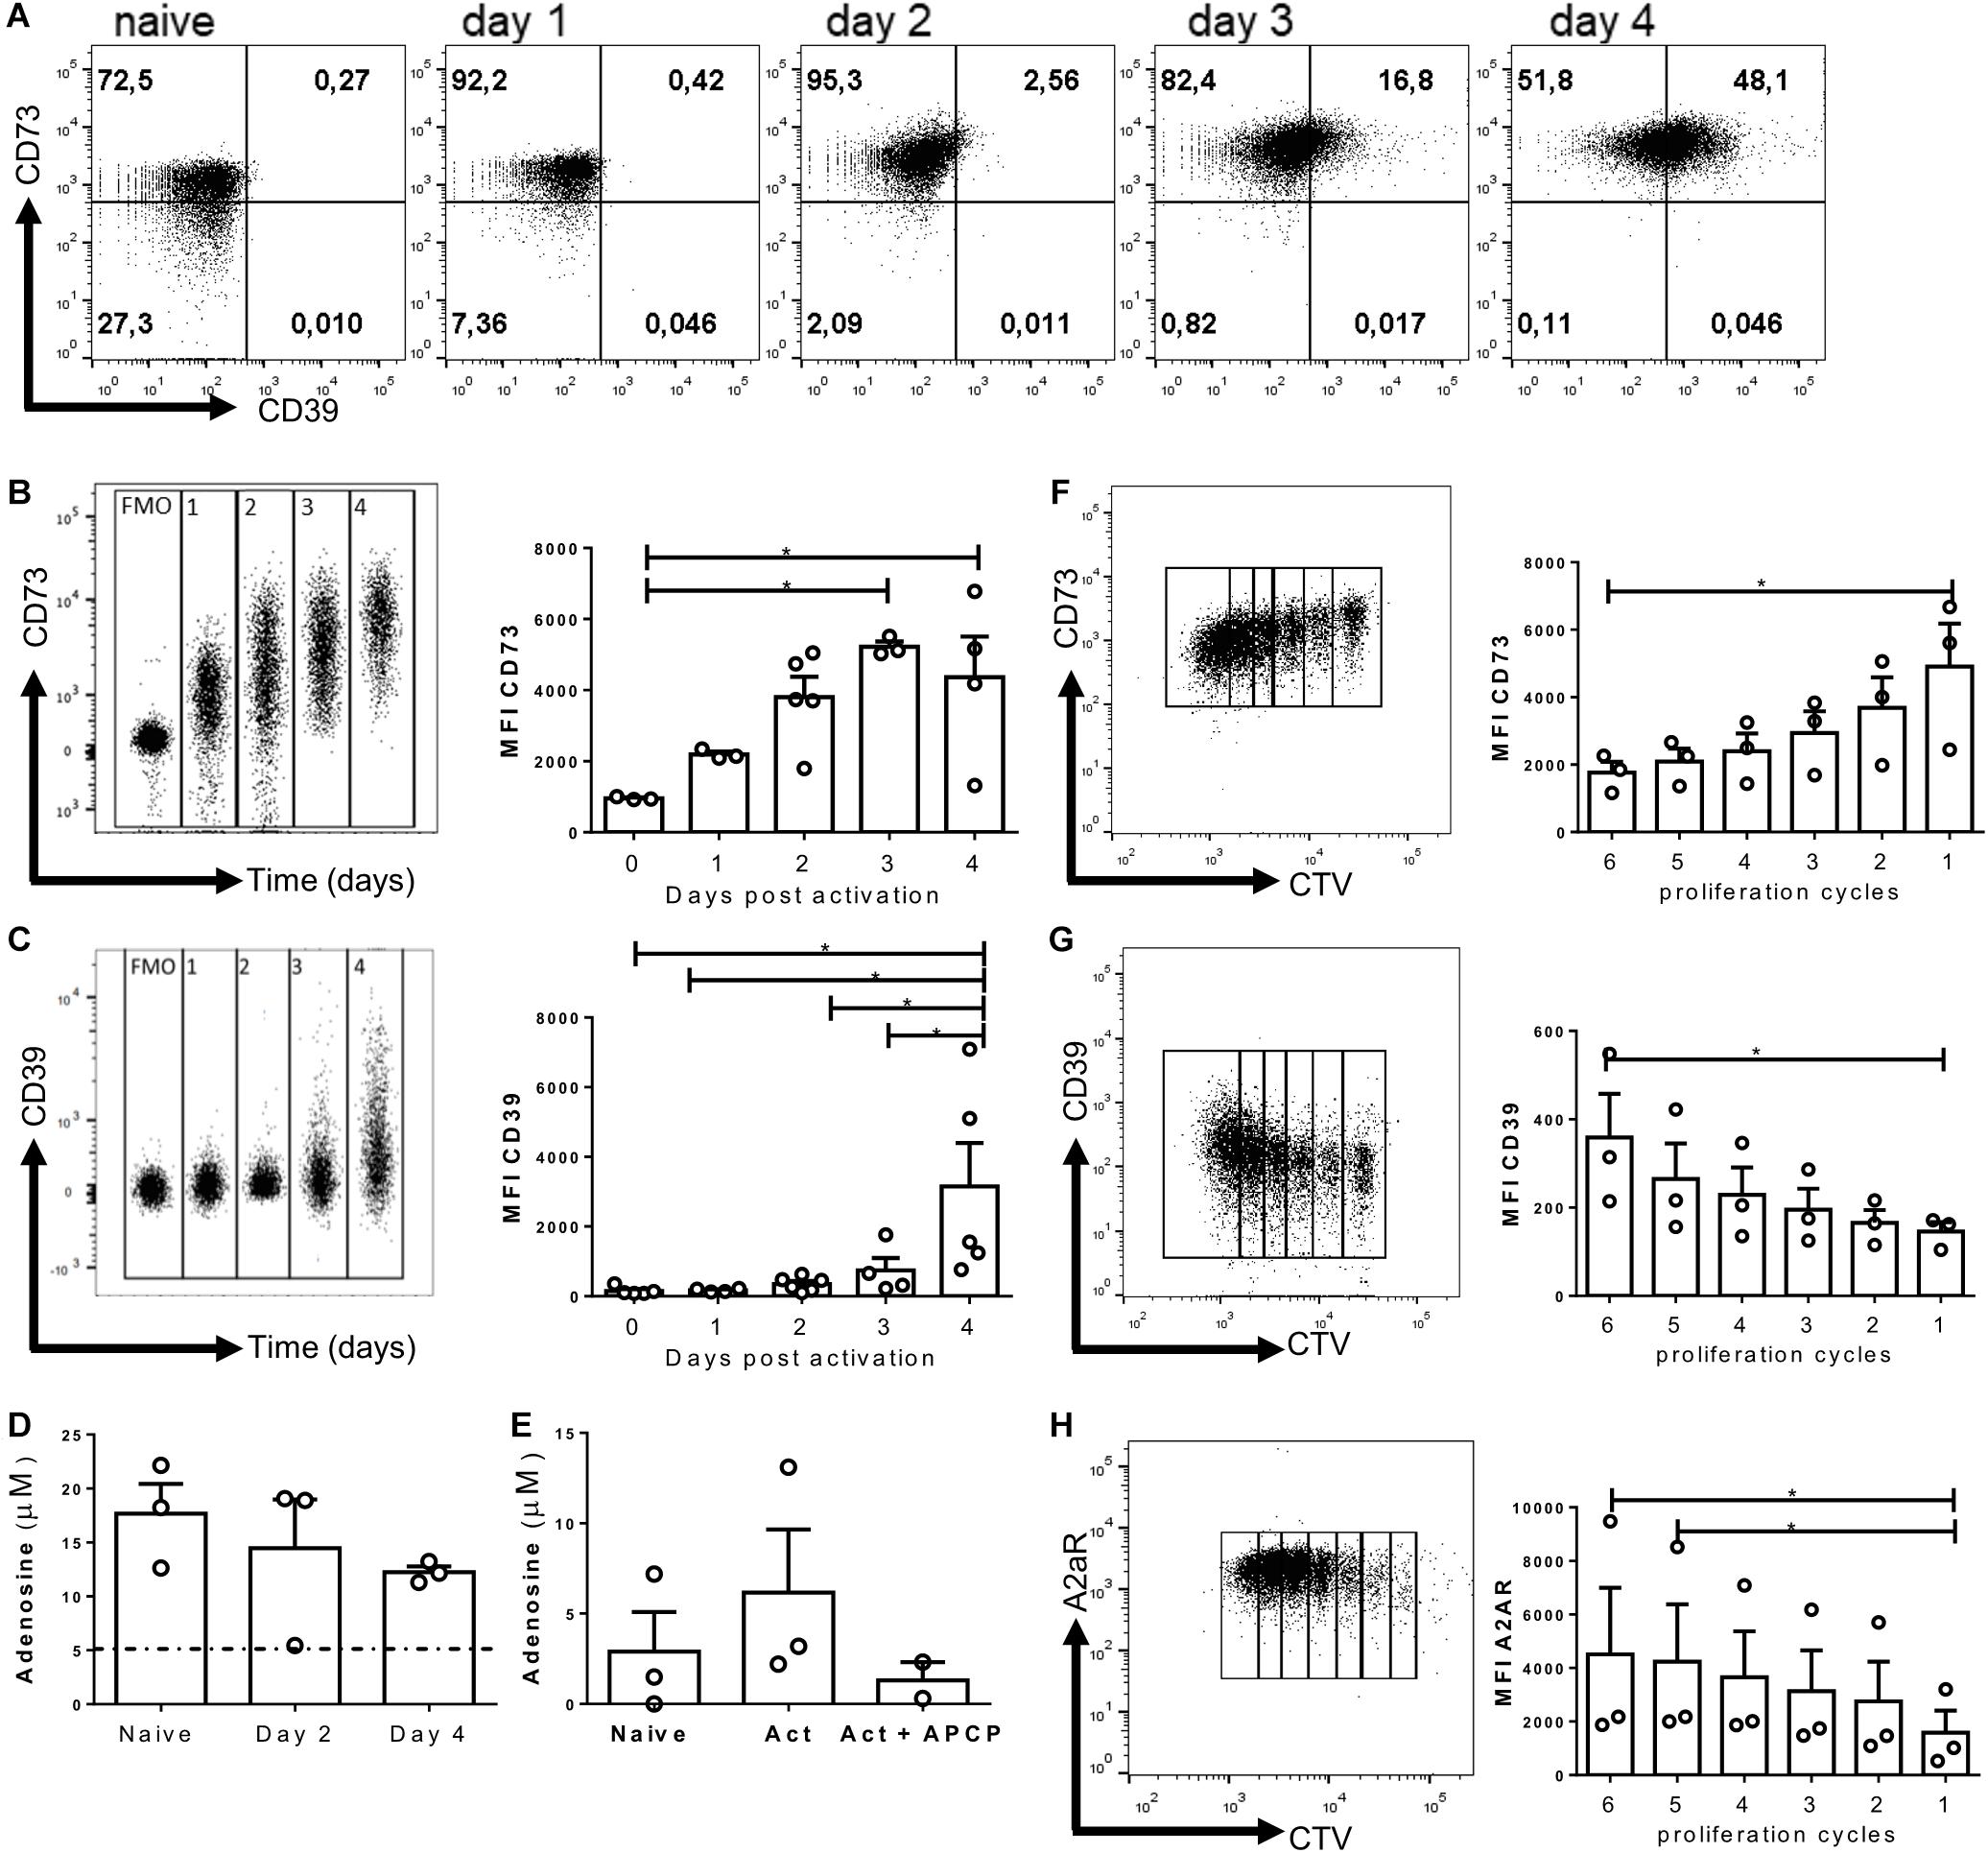
Figure 1. Purinergic components are upregulated during in vitro activation. Naive CD8+ T cells from WT mice were isolated and activated with soluble α-CD3/CD28 antibodies for 4 days in vitro in the presence of IL-2 (10 ng/ml) for the generation of Tc1 lymphocytes. (A) Representative dot plots of CD39 and CD73 expression by in vitro-generated Tc1 cells at different time points. (B,C) Representative graph showing the concatenation and MFI of CD73 (B) and CD39 (C) on T cells at different days following activation. (D) Adenosine concentration obtained from naïve cells and in vitro Tc1 cultures at days 2 and 4 following activation. (E) Adenosine production by Tc1 cells cultured for 1 h in the presence of AMP (10 μM) and APCP (50 μM). (F–H) Representative dot plots and MFI graphs showing CD73 (F), CD39 (G), and A2AR (H) expression as a function of Tc1 proliferation cycles (at day 3) as assessed by cell trace violet dilution by FACS. Kruskal–Wallis Test, *p < 0.05, n = 3, Data is presented as the mean ± SEM.
Next, we analyzed the expression of purinergic signaling components in dividing cells 3 days post-activation. To this end, naive T cells were labeled with Cell Trace Violet, and at day three post-activation, we evaluated the expression of CD73, CD39, and A2AR at each round of proliferation. We observed that the expression of CD73 is down-regulated as a function of the proliferation cycles (Figure 1F), whereas CD39 and A2AR expression is upregulated as cells proliferate (Figures 1G,H). Despite the evident reduction in CD73 expression between the different proliferation rounds on day 3, we consistently observed an increase in the mean fluorescence intensity of CD73 in CD8+ T cells between days 1 and 4 after in vitro activation (Figures 1A,B). These results indicate that the expression of purinergic signaling components is positively regulated on CD8+ T cells under conditions that induce their differentiation to effector cells.
Our results presented so far indicate that purinergic components are upregulated on CD8+ T cells during in vitro activation. In light of these results, we decided to evaluate the expression of CD73 and CD39 ectonucleotidases during an in vivo immune response at the effector (12 days) and memory phase (28 days). For this, we adoptively transferred naive CD45.2+ OT-I lymphocytes into CD45.1+ recipient mice, and 24 h later, all mice received an i.p. injection of OVA protein.
When analyzing transferred antigen-specific CD8+ T cells (Figures 2A–D), we first assessed the CD62L– population that has been identified as having a greater commitment to effector differentiation (Gattinoni et al., 2012). In agreement with our in vitro assays, we observed a change in the expression levels of both CD73 and CD39 as a function of T cell activation (Figure 2A). We observed a transient down-regulation on CD73 expression by day four, followed by a gradual increase in its expression during the memory phase (Figure 2B). On the other hand, the transferred cells acquired CD39 expression during the effector phase (peaking at day 12), followed by a gradual reduction in expression in the memory phase (Figure 2C). Interestingly, the frequency of CD8+ T cells expressing both CD39 and CD73 ectonucleotidases peaked during the effector phase on day 12 (Figure 2D).
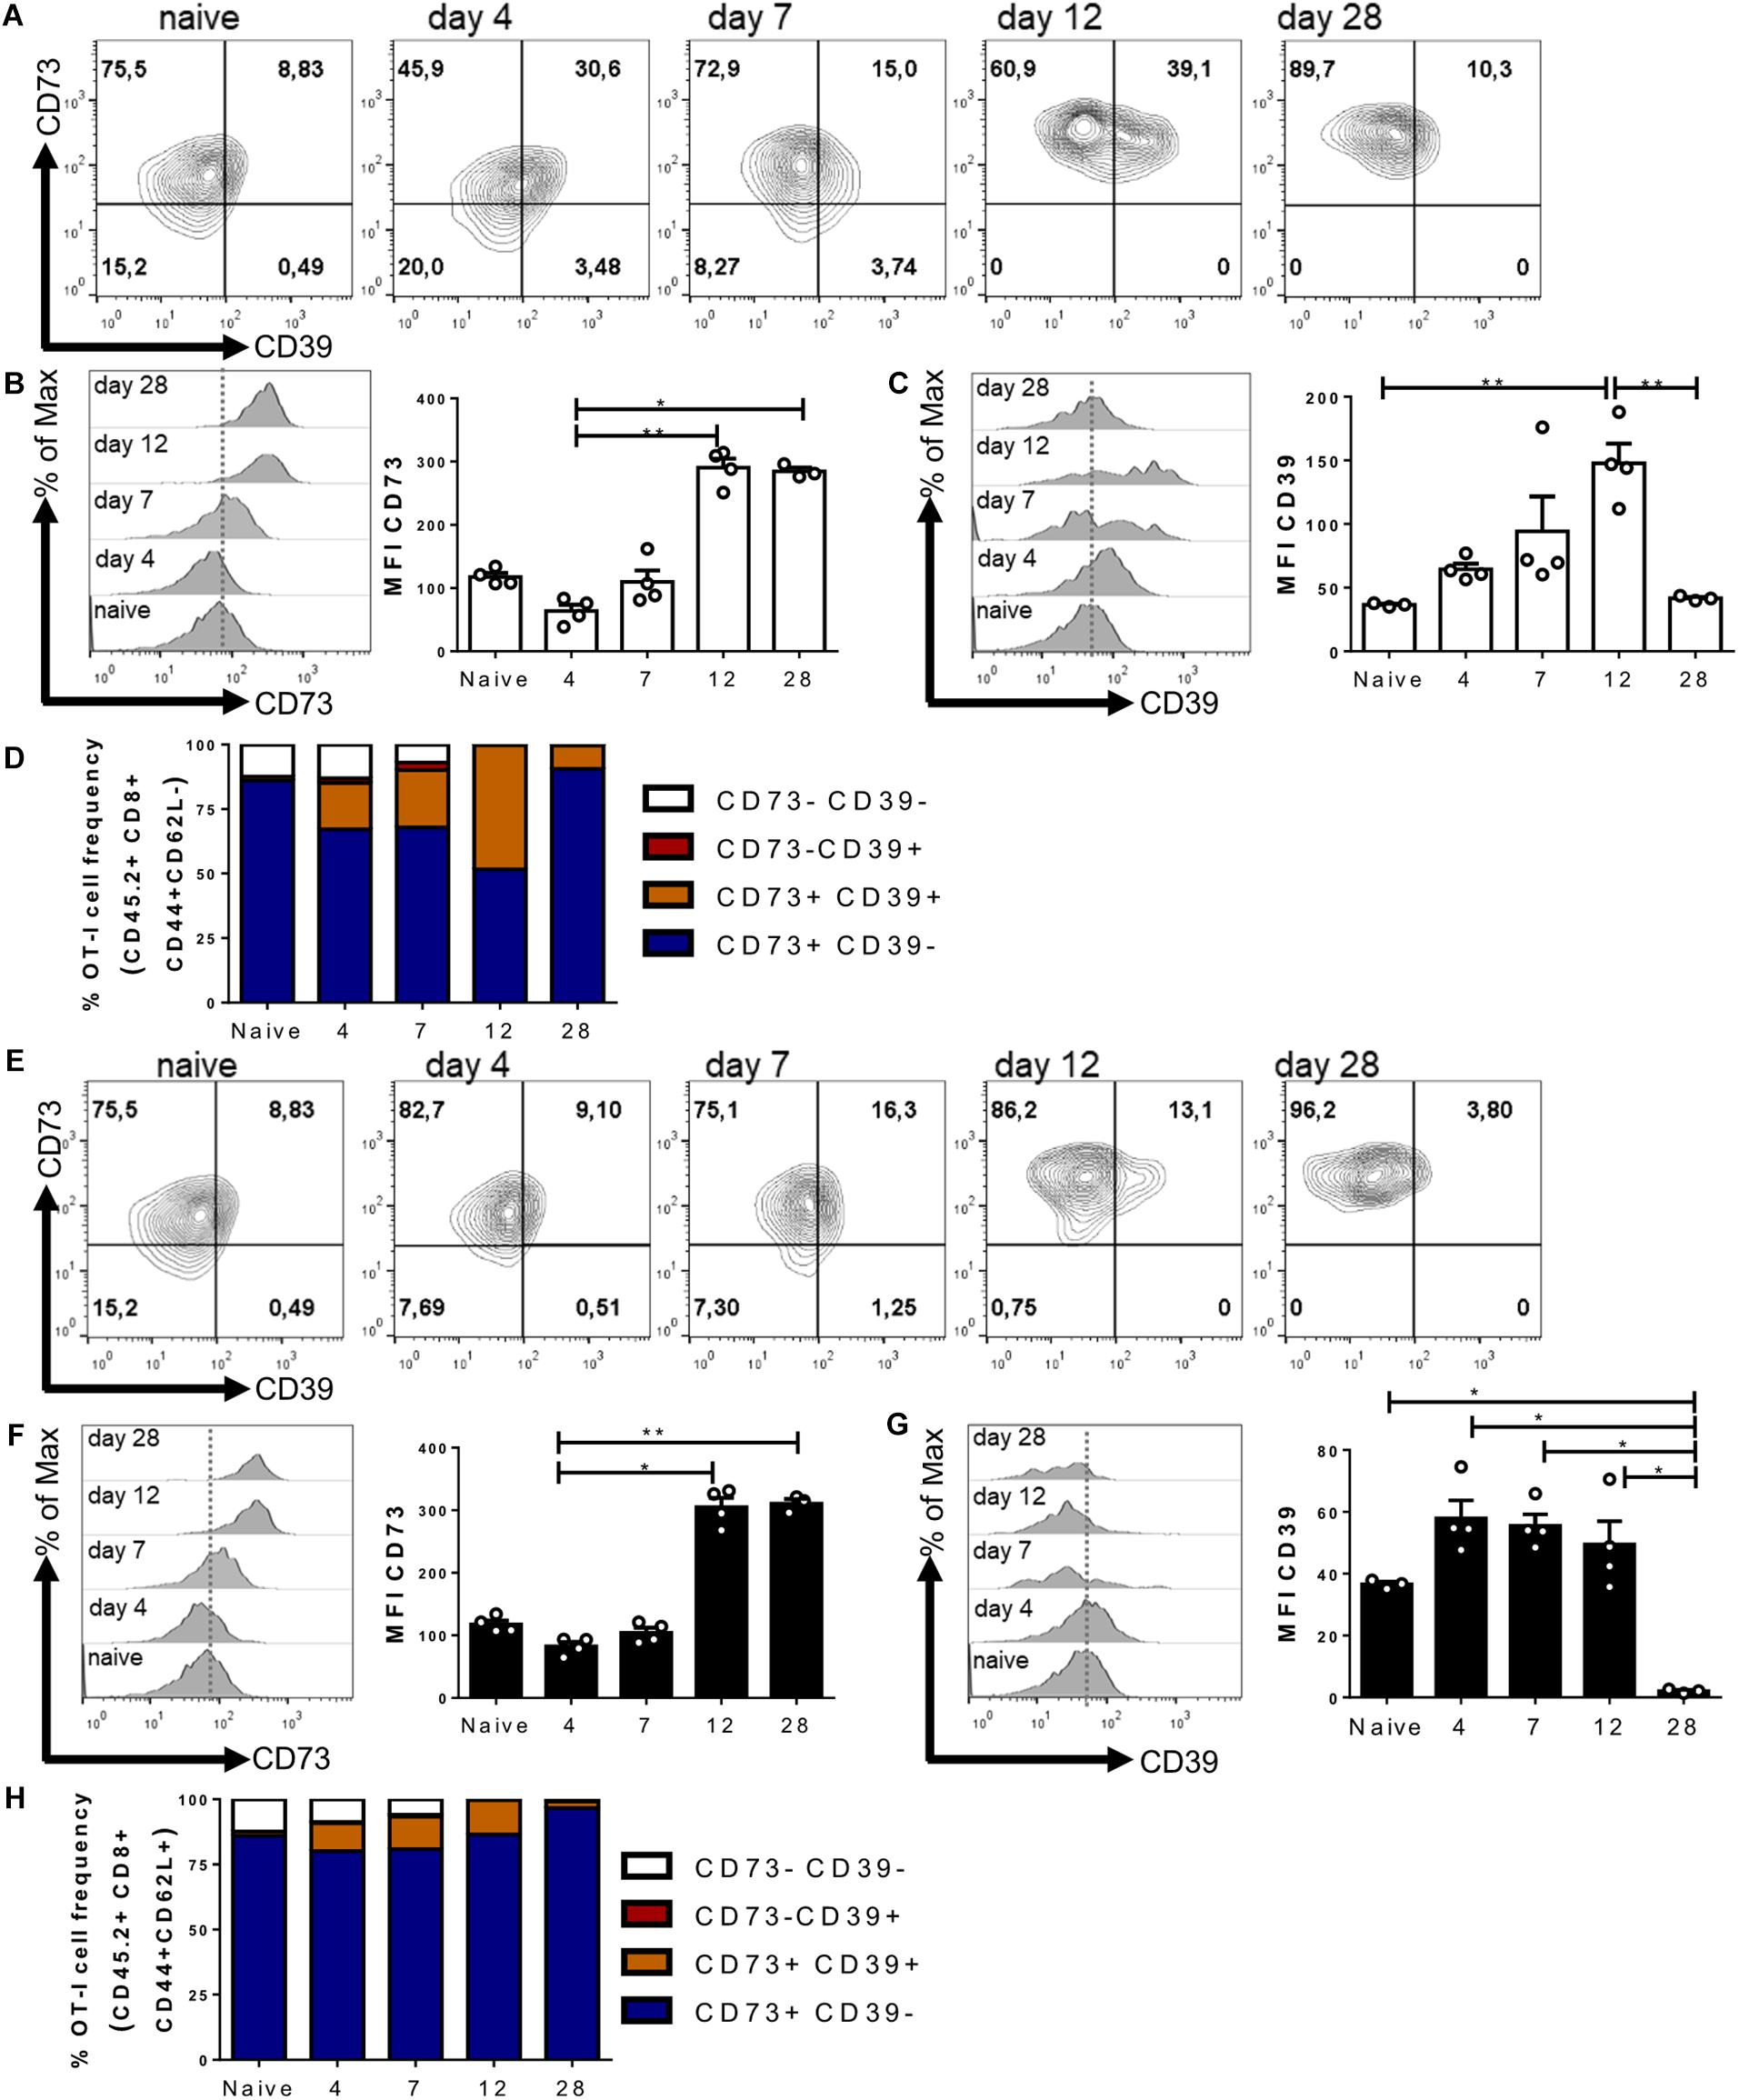
Figure 2. CD39 and CD73 ectonucleotidases are upregulated during an in vivo immune response. Naive OT-I cells (106 cells) were injected into CD45.1+ recipient mice. 24 h later, the recipient mice were immunized i.p with OVA protein (500 μg) + LPS (25 μg). Transferred cells were analyzed in blood samples on days 4, 7, 12, 21, and 28 after the immunization. (A–D) CD39 and CD73 expression was analyzed in the effector memory precursors (CD45.2+/CD8+/CD44+/CD62L–) or central memory precursors (CD45.2+/CD8+/CD44+/CD62L+) (E–H) at different time points. n = 4, Kruskal–Wallis Test, *p < 0.05; **p < 0.01.
Next, we analyzed the population of cells that maintains the expression of CD62L and thus is less committed to an effector differentiation (Figures 2E–H) (Sallusto et al., 2004). In these cells, we also observed a transient reduction in CD73 expression on day four and a gradual increase at later time points during the memory phase (Figures 2E,F). On the other hand, CD39 expression is only expressed by a small fraction of these cells during the effector phase on day 12 (Figures 2E,G,H). The frequency of CD8+ T cells that express only CD73 is maintained throughout the immune response (Figure 2H). These results are in agreement with our in vitro experiments and indicate that the expression of ectonucleotidases is positively regulated during the activation phase of the immune response, with CD39 and CD73 being concomitantly expressed mainly by effector cells.
Our results confirm the presence of a population of effector cells that express both ectonucleotidases, which enables adenosine production. Next, we analyzed whether this could represent a physiological mechanism to avoid an excessive effector response on CD8+ T cells. Therefore we analyzed some hallmarks of the effector program of Tc1 cells such as transcription factors, granzyme B, and cytokines produced by in vitro-differentiated WT and CD73KO CD8+ T cells. As shown in Figure 3A, our results demonstrate that the expression of transcription factors related to the acquisition of the effector program, such as tbx21 (T-bet), prdm1 (Blimp-1) are upregulated in both WT and CD73KO CD8+ T cells, but the expression of tbx21 is higher in CD73KO compared to WT CD8+ T cells.
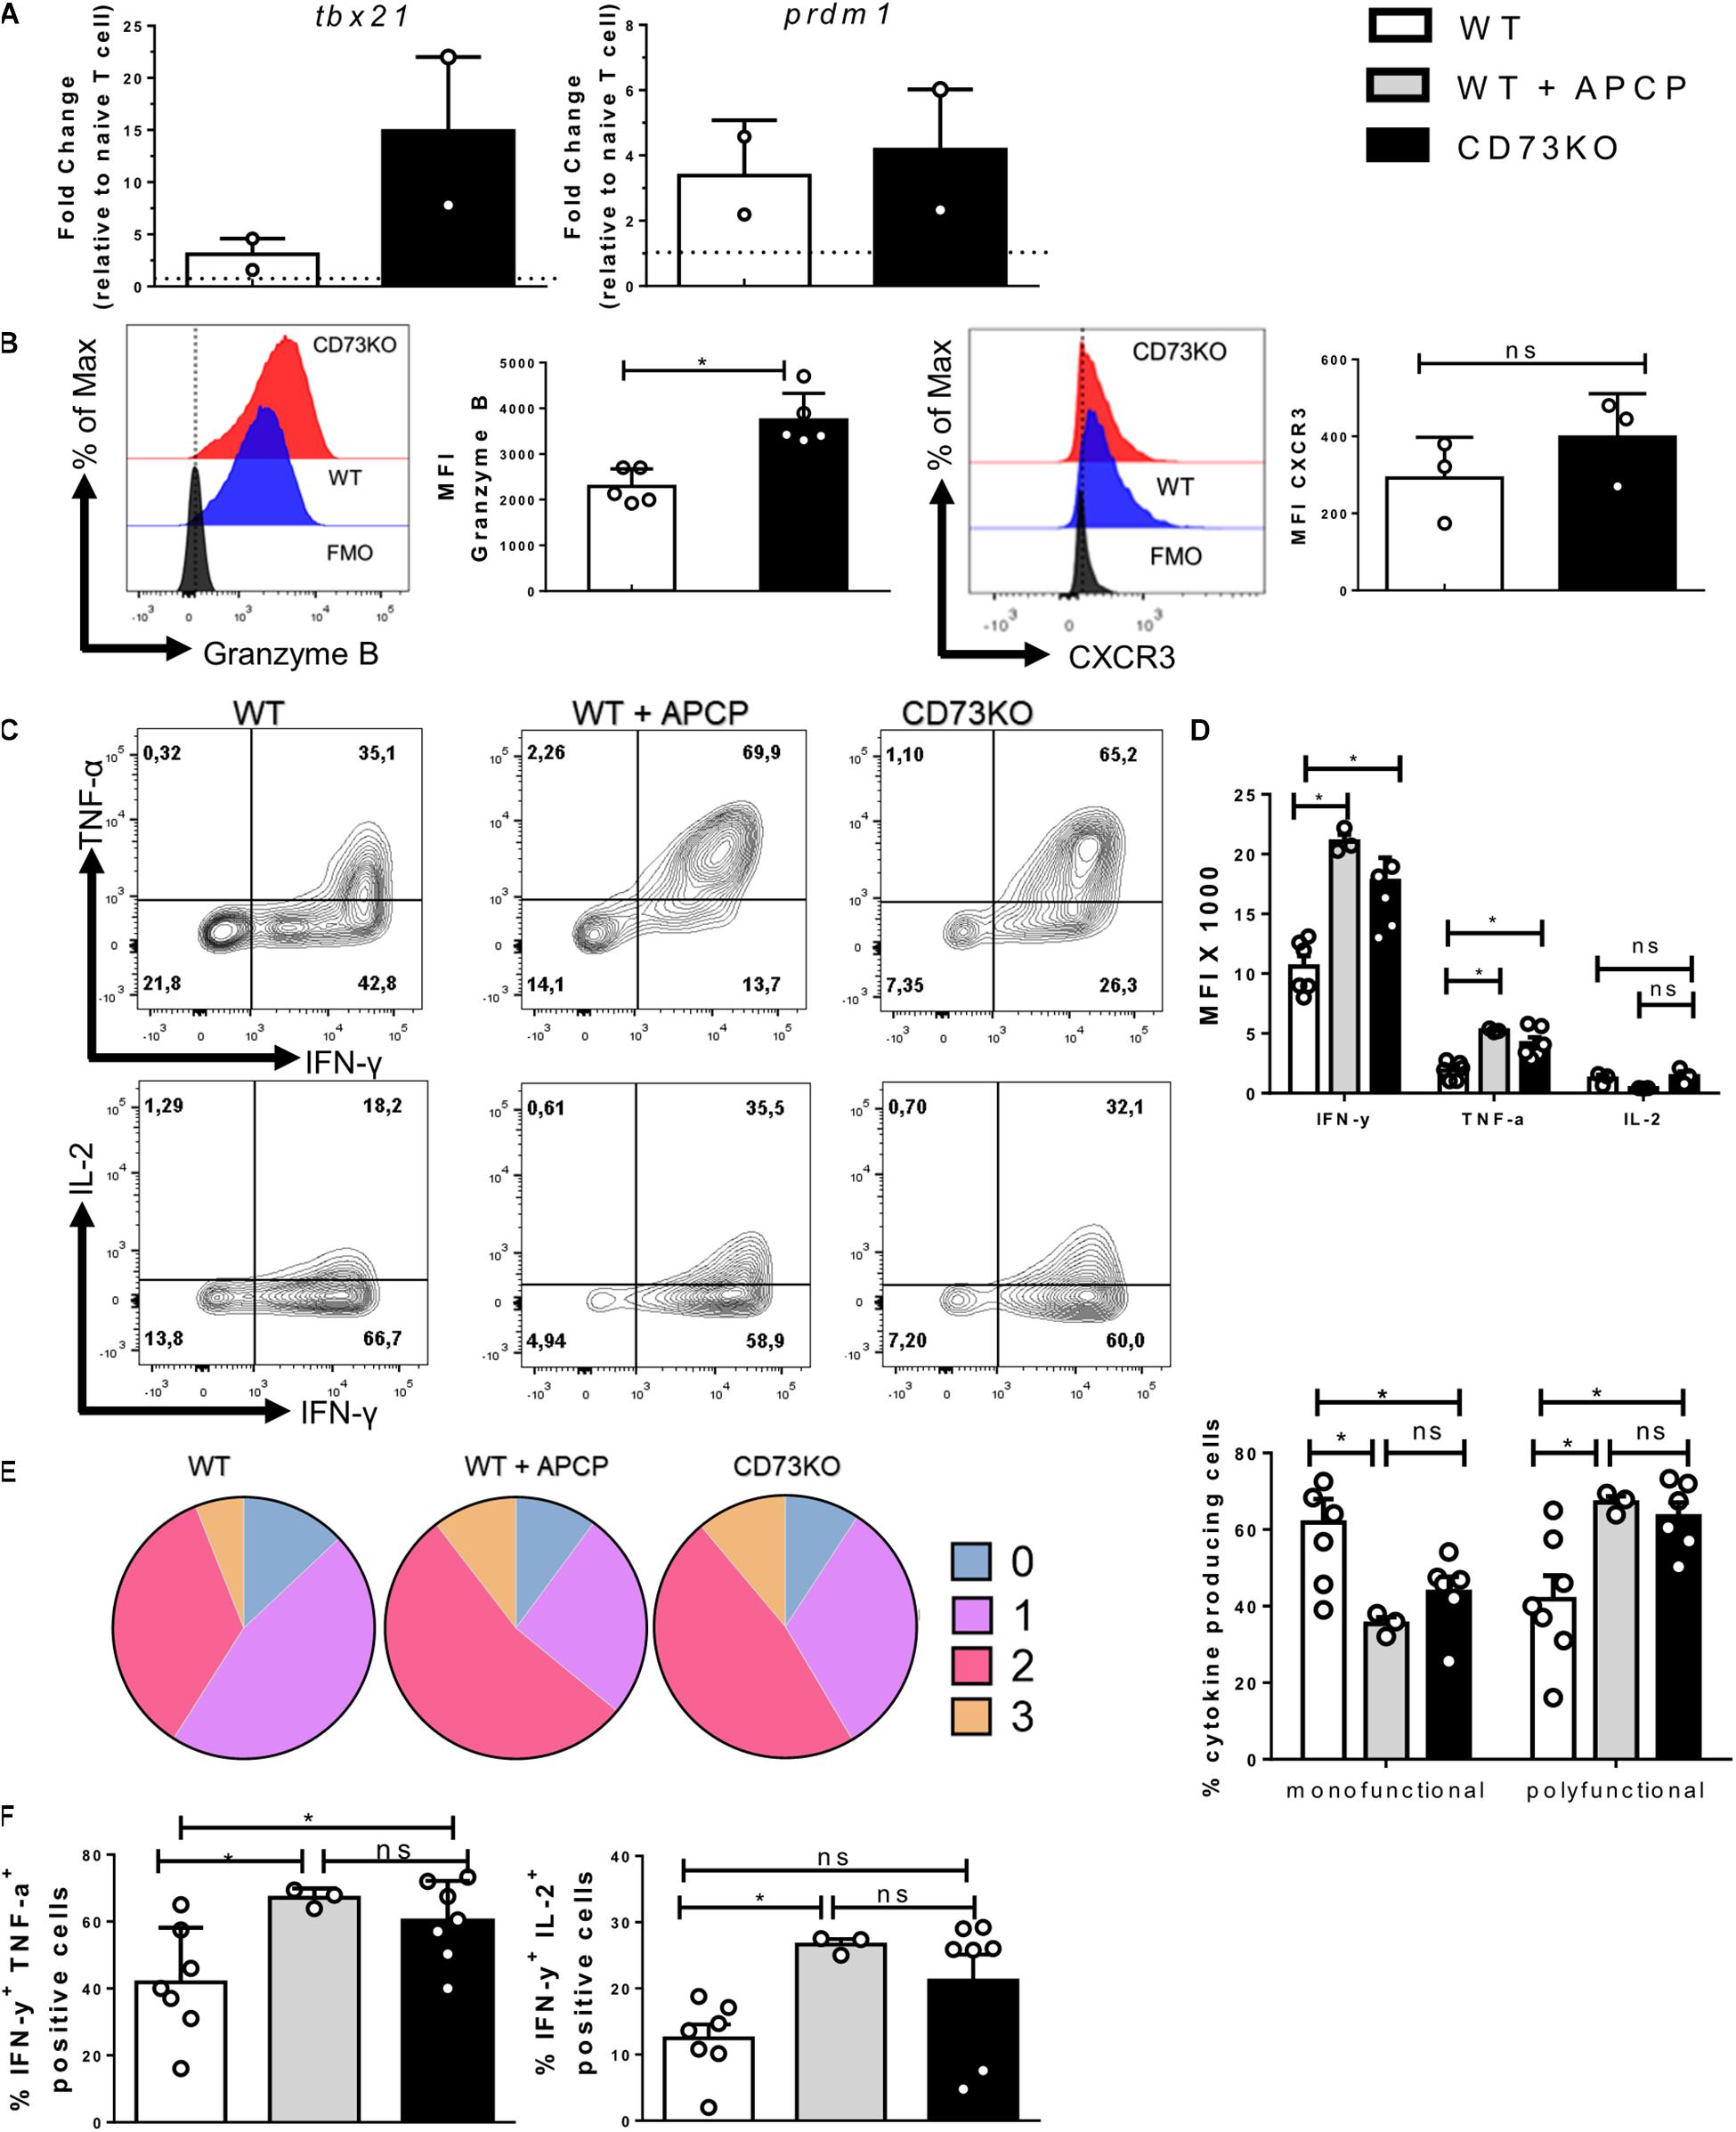
Figure 3. CD73 limits the acquisition of the Tc1 effector program. Naive CD8+ T cells from WT mice were isolated and activated with soluble α-CD3/CD28 antibodies for 3 days in vitro in the presence of IL-2 (10 ng/ml) for the generation of Tc1 lymphocytes. Transcription factors, cytotoxic proteins, and cytokine production by Tc1 cells were evaluated by real-time PCR and FACS. (A) Expression of prdm1 and tbx21 was measured by real-time PCR (n = 2). (B) Left, Representative histogram showing granzyme B production (n = 5). Right, histogram depicting CXCR3 expression (n = 3). (C) Representative dot plots showing TNF-α, IFN-γ, and IL-2 production by CD73KO and WT CD8+ T cells in the presence and absence of CD73 enzymatic activity inhibitor APCP (50 μM) (n = 3–7). (D) Bar graph showing the MFI for IFN-γ, TNF-α, and IL-2. (E) Left, graph showing the frequency of Tc1 cells that produce 0, 1, 2, and 3 cytokines. Right, frequencies of Tc1 cells producing up to one cytokine (mono-functional) or more than two cytokines (poly-functional). (F) Bar graphs showing the percentage of cells that produce IFN-γ and TNF-α or IFN-γ and IL-2. Two-tailed Mann–Whitney test and Kruskal–Wallis Test, *p < 0.05. Data is presented as the mean ± SEM.
Accordingly, CD73KO CD8+ T cells presented higher expression of granzyme B compared to WT cells (Figure 3B), suggesting that CD73 reduces the cytotoxic potential of CD8+ T lymphocytes. On the other hand, we evaluated the expression of CXCR3, a chemokine receptor that is required for rapid migration to inflamed tissues (Maurice et al., 2019). Our results indicate that the absence of CD73 does not affect the expression of this receptor (Figure 3B).
Finally, we observed a higher production of pro-inflammatory cytokines such as IFN-γ and TNF-α in CD73-deficient lymphocytes compared to WT CD8+ T cells (Figures 3C,D). The same result was obtained when CD73 enzymatic activity was ablated using the CD73 specific inhibitor APCP. When assessing CD8+ T cells’ ability to produce multiple cytokines simultaneously, our results indicate that CD73KO CD8+ T cells and APCP treated WT cells show an expanded polyfunctionality when compared to WT lymphocytes (Figures 3E,F). These results suggest that CD73 expression and adenosine production reduces the polyfunctionality and the cytotoxic potential of CD8+ T cells.
Cytotoxic lymphocytes present a glycolytic metabolism that allows the generation of precursor metabolites for biosynthesis and energy generation processes (Vander Heiden et al., 2009; MacIver et al., 2013). Due to our previous results showing that CD73 reduces the effector program of Tc1 cells, we asked whether this is related to their bioenergetic capacity. As a first approach, we evaluated the mRNA expression of two critical metabolic pathway regulators, hexokinase II for the glycolytic pathway (Tanner et al., 2018) and cpt1-a for the FAO pathway (van der Windt and Pearce, 2012) in WT and CD73 deficient CD8+ T cells following activation. The results indicate that the absence of CD73 promotes hexokinase II and cpt-1 mRNA expression (Figure 4A).
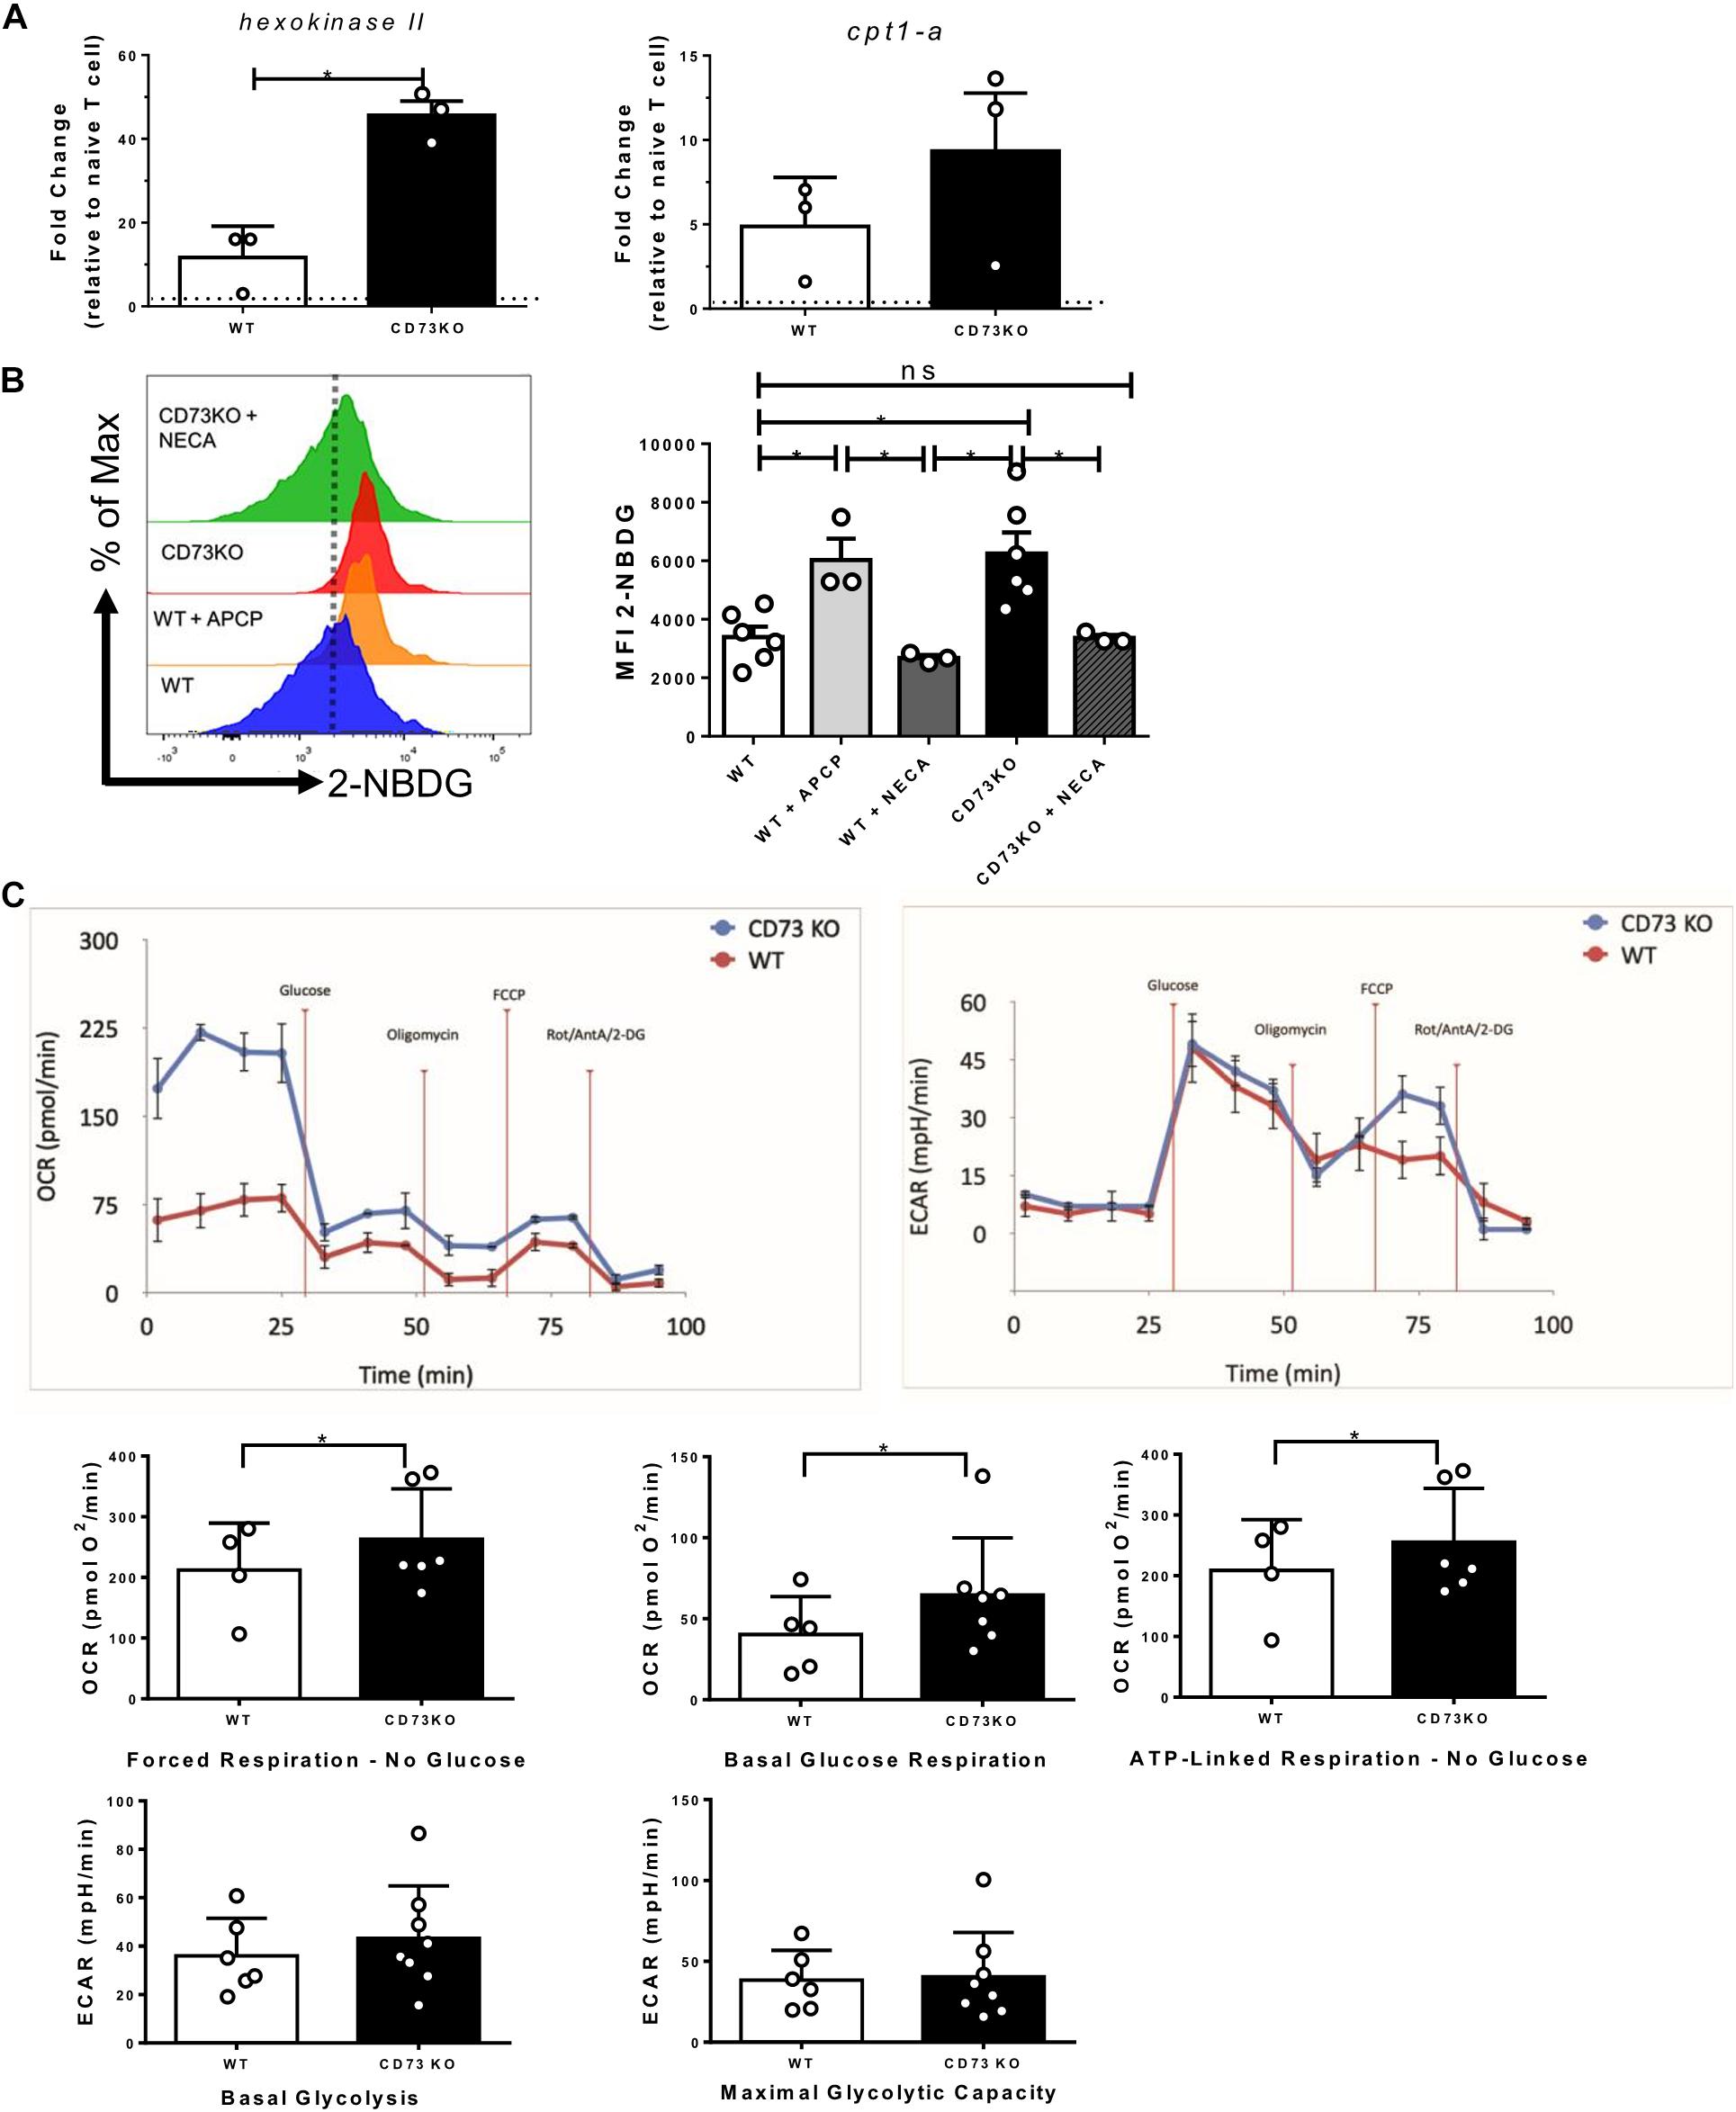
Figure 4. CD73 restricts the mitochondrial capacity of Tc1 cells. Naive CD8+ T cells from WT mice were isolated and activated with soluble α-CD3/CD28 antibodies for 3 days in vitro in the presence of IL-2 (10 ng/ml) for the generation of Tc1 lymphocytes. (A) Expression of hexokinase II and cpt-1 mRNAs was analyzed by real-time PCR in CD73 and WT Tc1 cells (n = 3). (B) Glucose uptake of WT and CD73KO Tc1 cells treated with APCP (50 μM) or NECA (10 μM) was measured by FACS using the fluorescent glucose analog 2-NBDG (n = 3–6). (C) Left panel: Oxygen consumption rates (OCRs) and Right panel: extracellular acidification rates (ECARs) from CD73KO and WT Tc1 cells were measured under no glucose (forced mitochondrial respiration), basal glucose respiration and ATP-linked respiration for OCR and basal glycolysis and oligomycin stimulated glycolysis (maximal glycolytic capacity) for ECAR (n = 4;6 Tc1 WT and 8 CD73KO Tc1) Kruskal–Wallis Test, Paired T-test and Two-tailed Mann–Whitney test, *p < 0.05. Data is presented as the mean ± SEM.
Given these results, we used 2-NBDG, a fluorescent glucose analog to evaluate glucose uptake. As seen in Figure 4B, the absence of CD73 in CD8+ T lymphocytes significantly improves the ability to uptake glucose compared to WT lymphocytes. Similar results were obtained when CD73 enzymatic activity was inhibited with APCP (Figure 4B). Moreover, when CD73KO CD8+ T cells are incubated with the A2A receptor agonist NECA, the ability of the cells to uptake glucose is significantly reduced to a level similar to WT cells (Figure 4B).
To elucidate which metabolic pathway, glycolysis or OXPHOS, is affected in CD73KO cells, we run a seahorse assay to determine the OCR and ECAR with a media containing glutamine and pyruvate as respiratory substrates but no glucose. With this media, cells are forced to use mitochondria and then OXPHOS to drive ATP synthesis (forced respiration). Under these conditions, our results showed that CD73KO cells have a much higher OCR than WT cells, meaning a higher bioenergetic mitochondrial capacity. CD73KO cells also exhibited a significantly higher mitochondrial respiration in the presence of glucose than WT cells (basal glucose respiration). In addition, ATP-linked respiration in the absence of glucose was also higher in CD73KO cells. No significant differences were found in oligomycin insensitive respiration nor FCCP induced respiration. Of note, forced mitochondrial respiration in the absence of glucose represents the maximal respiratory capacity in these cells.
On the other hand, no significant differences were found regarding the basal glycolysis (after glucose injection) and maximal glycolytic capacity between CD73KO and WT cells (Figure 4C). These results suggest that the increased glucose uptake shown by CD73KO cells is used for mitochondrial metabolism.
Since our results suggest that CD73 expressed by activated CD8+ T cells has a role in reducing the effector phenotype of these cells we compared the anti-tumoral activity of WT and CD73KO CD8+ T cells. To this end, we challenged CD45.1+ mice with an intradermal injection of B16.OVA cells. When tumors became visible, we transferred 1 × 10⁶ WT-OT-I or CD73-deficient OT-I naïve T cells (OT-I/CD73KO) (Figure 5A). Our results confirm that tumor growth was significantly reduced in mice that were adoptively transferred with either OT-I or OT-I/CD73KO CD8+ T cells compared with control mice (PBS); however, the transfer of OT-I/CD73KO CD8+ T cells had a more dramatic effect on tumor growth than the transfer of OT-I CD8+ T cells (Figure 5B). Moreover, we observed an increase in the percentage and numbers of OVA-specific CD8+ T cells per gram of tumor in mice that were transferred with OT-I/CD73KO CD8+ T cells compared with mice transferred with OT-I cells (Figures 5C,D).
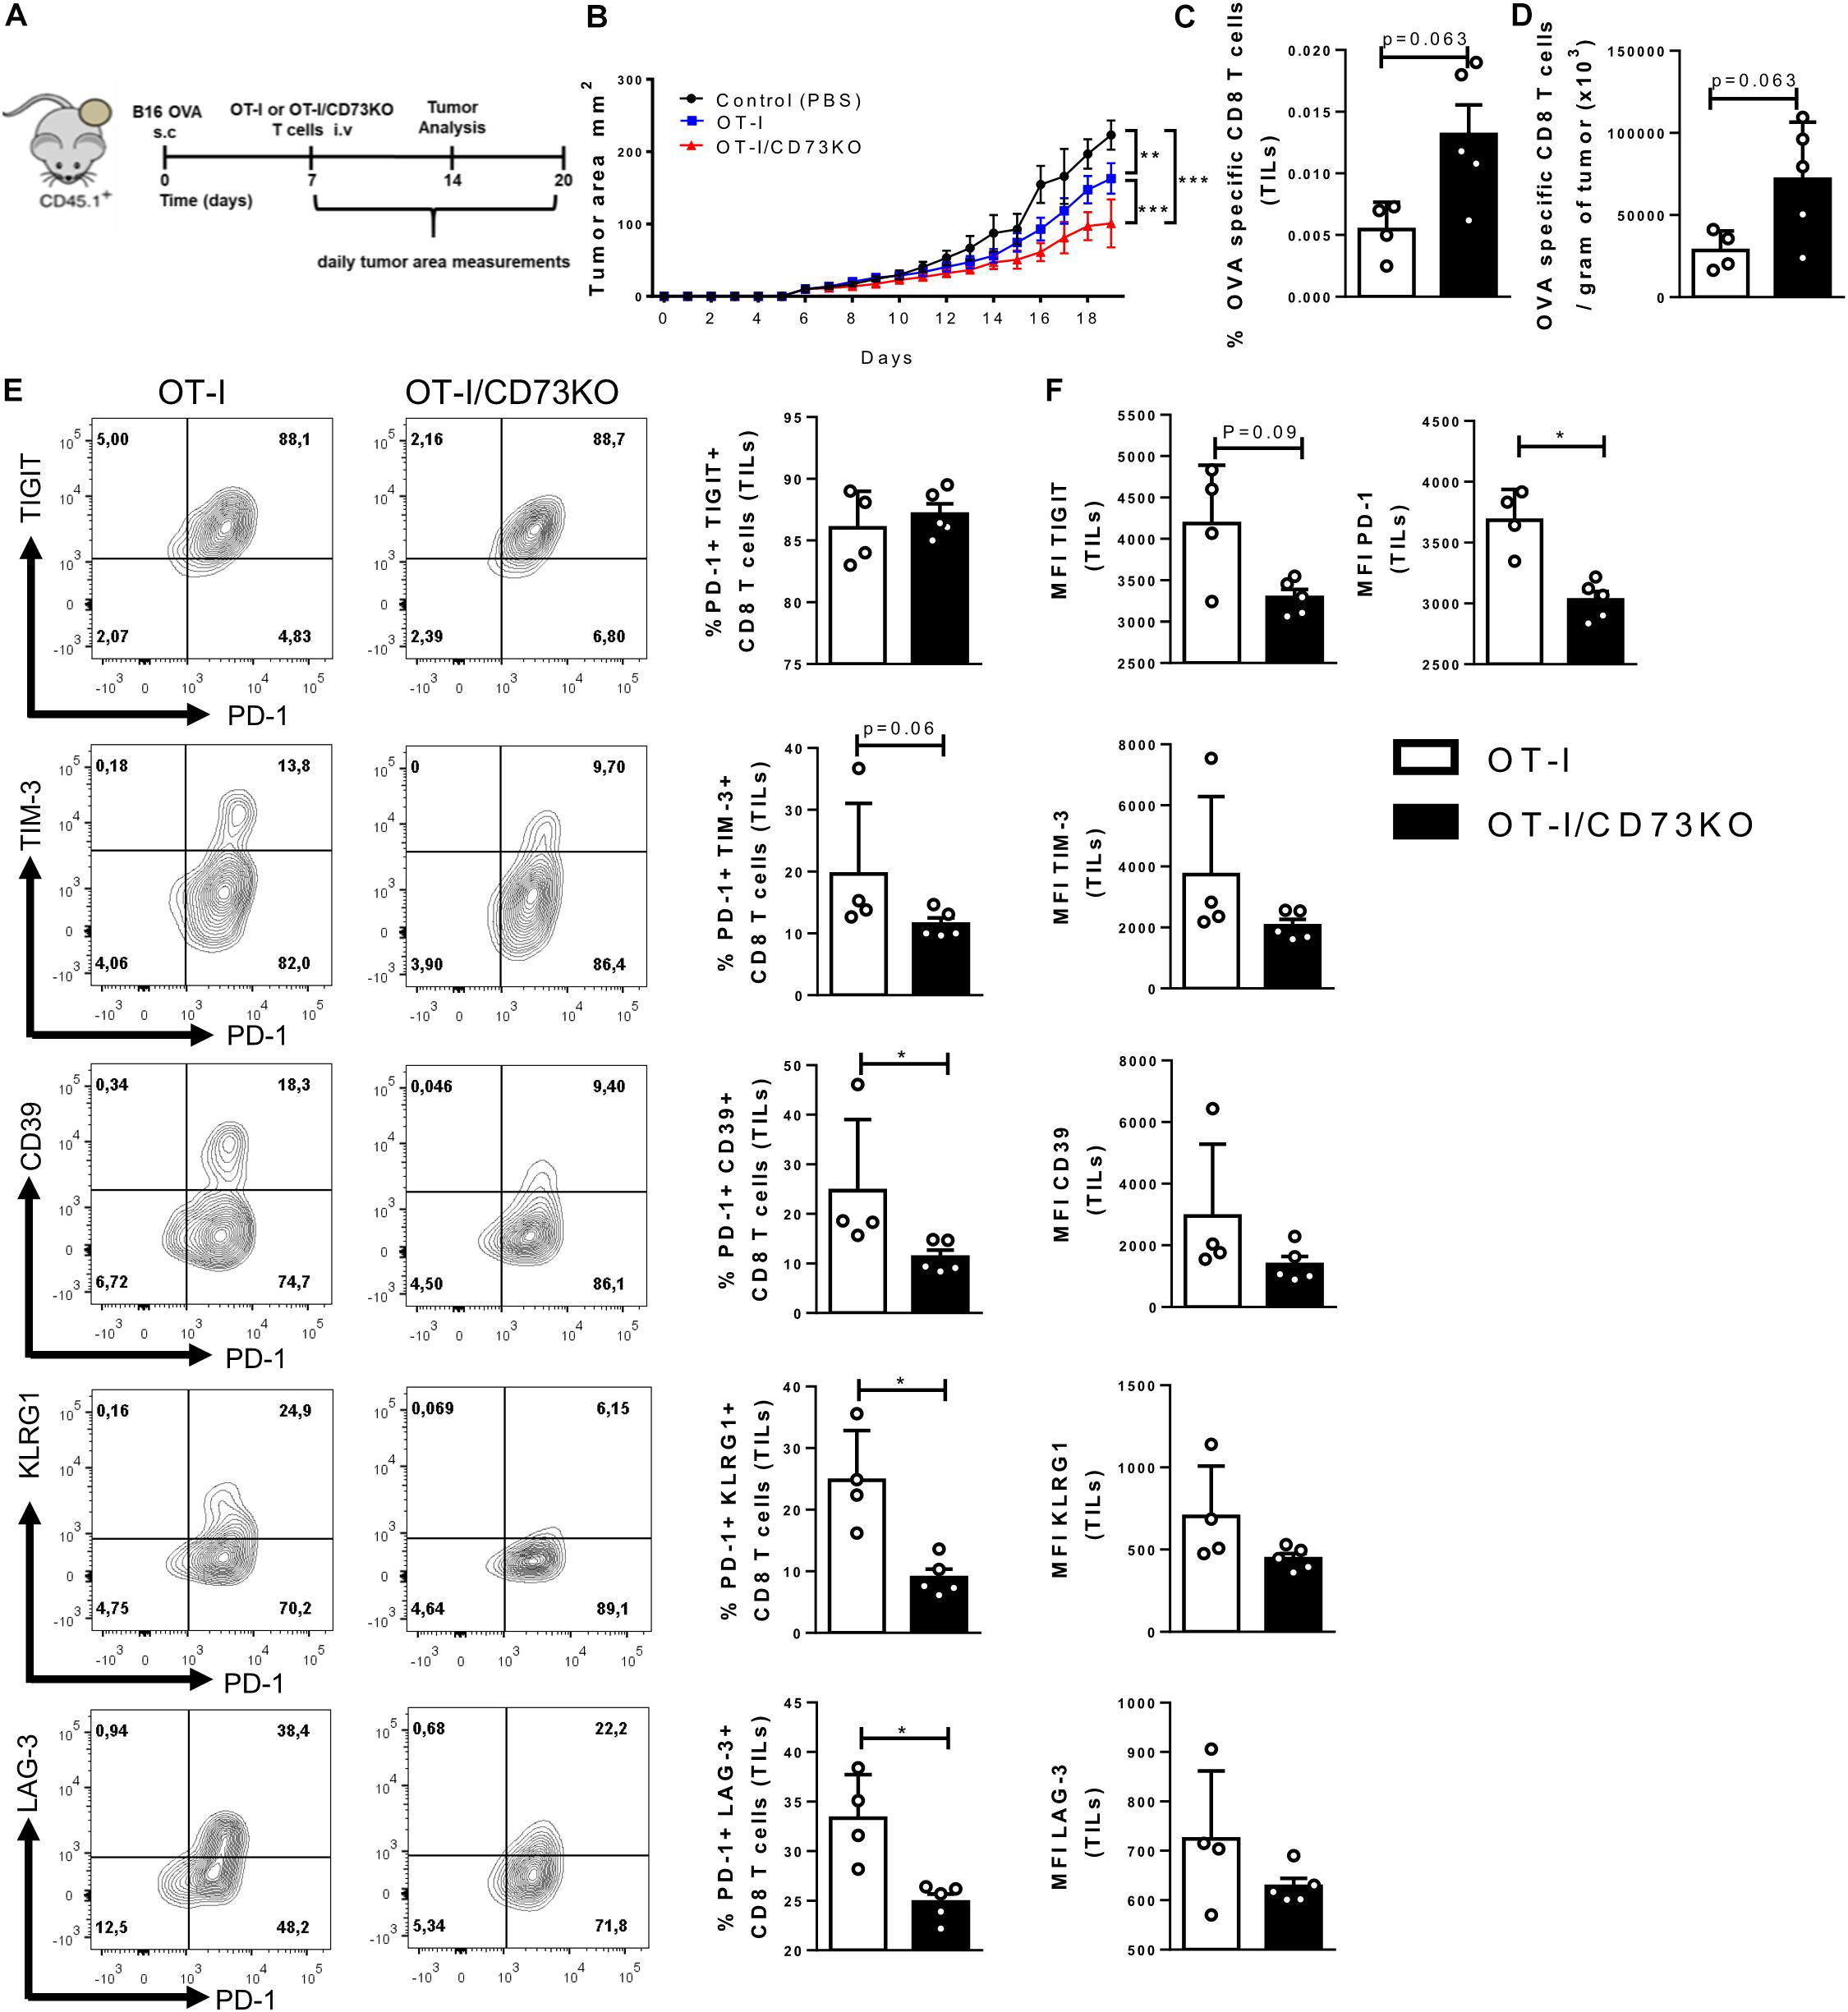
Figure 5. CD73-deficient CD8+ T cells are more effective in controlling tumor growth than WT cells. (A) Diagram showing the experimental setup: B16.OVA melanoma cells were intradermally injected in the back right flank of CD45.1+ mice. Seven days after the tumor challenge, OT-I or OT-I/CD73KO CD8+ naïve T cells (1 × 10⁶ cells) were adoptively transferred. Tumor area and tumor-infiltrating T cells were analyzed. (B) Tumor growth curves of CD45.1+ mice that were injected with OT-I or OT-I/CD73KO CD8+ naïve T cells or control (PBS) (n = 5). Tumor area was calculated by measuring and multiplying perpendicular axes, the results were plotted as the mean ± SEM for each day. (C) The absolute number of OVA-specific CD8+ T cells per gram of tumor (n = 5). (D) Frequency of OVA-specific CD8+ T cells in the tumor (TILs) (n = 5), (E) Dot plots, and bar graphs depicting the expression and frequency of positive cells within the adoptively transferred cells (CD45.2+/CD8+ gate) for the different inhibitory receptors. (F) MFI of inhibitory receptors in the adoptively transferred cells (CD45.2+/CD8+ gate). Data is presented as the mean ± SEM. Significance was determined using two-way repeated measured ANOVA with Bonferroni’s correction post hoc at day 19 (B), and unpaired two-tailed Mann–Whitney test (C–E). *p < 0.05, **p < 0.01, ***p < 0.001, ****p < 0.0001 (B, Two-Ways ANOVA), (C–E, Two-tailed Mann–Whitney Test).
Given these results, we asked whether the ability of CD8+ T cells to produce adenosine constitutes a regulatory signal for the expression of inhibitory checkpoint receptors such as PD-1, TIGIT, TIM-3, CD39, KLRG1, and LAG-3. In agreement, the co-expression of inhibitory receptors was higher in tumor-infiltrating OT-I lymphocytes compared to OT-I/CD73KO cells (Figure 5E). Although there are no differences in the relative percentages of PD-1 and TIGIT co-expression, OT-I lymphocytes have a higher degree of TIM-3, LAG3, KLRG1, and CD39 expression compared to CD73KO (Figure 5E). Additionally, OT-I lymphocytes have a higher mean PD-1 fluorescence intensity than OT-I/CD73KO lymphocytes (Figure 5F). These results indicate that CD73 expression by CD8+ T lymphocytes reduces the anti-tumoral capacity of CD8+ cells and increases the degree of CD8+ T cell exhaustion.
CD73 has been proposed as a novel immune checkpoint, and thus several strategies to block adenosine production by this enzyme have been suggested (Beavis et al., 2012; Vigano et al., 2019). However, the impact of these strategies on CD8+ T cell effector function has not been previously addressed. Here we report on the role of CD73 ectonucleotidase on CD8+ T cell differentiation and its effector program. Our results provide evidence that adoptive transfer of CD73-deficient CD8+ T cells into tumor bearing mice show a higher frequency and number of tumor-infiltrating lymphocytes and are more effective in controlling tumor growth than WT cells. These results are supported by our data showing that during in vitro differentiation, CD8+ T cells upregulate the expression of CD73 and CD39 ectonucleotidases, A2A receptor, and produce adenosine. Accordingly, CD73 deficiency promoted effector functions by increasing cytokine and granzyme B production, metabolic fitness, and the anti-tumoral activity of CD8+ T cells. All these results suggest that CD73 ectonucleotidase restrains the effector program of CD8+ T cells through adenosine production.
Different reports have described the expression of CD39 and CD73 ectonucleotidases in an inflammatory context (Antonioli et al., 2013; Allard et al., 2017), but most of these reports focus on the presence of these molecules in tumor cells or regulatory cells, overlooking other populations such as CD8+ T cells. Our results from in vitro and in vivo experiments show that naive CD8+ cells express CD73, and this enzyme is upregulated following T cell activation during the effector and memory phases. On the other hand, CD39 expression becomes relevant during the effector phase, peaking at day 12. In memory precursor cells (CD44hi/CD62L+), CD73 expression increases during the effector and memory phases, but CD39 expression in this cell subset always remains very low. These results indicate that CD39 is expressed in cells with a higher degree of commitment to the effector program and are therefore more prone to apoptosis (Fang et al., 2016) or cellular exhaustion (Gupta et al., 2015). Taken together, these data suggest that the concomitant expression of CD39 and CD73 during the effector phase enables CD8+ T cells to produce adenosine from extracellular ATP. Our results do not discard the possibility that at early phases during activation, CD8+ T cells, and even naïve T cells may produce adenosine from AMP as they express CD73.
The A2AR is the primary receptor mediating adenosine signaling in T cells, and our results confirm that CD8+ T cells rapidly upregulate this receptor following activation. Stimulation of A2AR increases cAMP production and activation of protein kinase A, signals that have been described to weaken TCR-mediated signaling (Vang et al., 2001; Linnemann et al., 2009; Linden and Cekic, 2012; Rodriguez et al., 2013; Newick et al., 2016). Our results with APCP, a specific inhibitor of CD73 enzymatic activity, recapitulate some of the characteristics we observed in CD73 deficient CD8+ T cells, including the increase in cytokine production, and glucose uptake, suggesting that at least these features may depend on CD73-mediated adenosine production and A2AR signaling. In agreement with these results, the disruption of A2AR signaling improved the production of type 1 cytokines such as TNF-α and IFN-γ by CD4+ and CD8+ T cells (Munoz et al., 1990; Erdmann et al., 2005; Raskovalova et al., 2007; Mastelic-Gavillet et al., 2019). Additional experiments designed to analyze other effector functions on WT CD8+ T cells incubated with A2AR antagonists or CD73KO CD8+ T cells cultured in the presence of adenosine receptor agonists could further support our hypothesis that CD73 may be promoting autocrine adenosine signaling in CD8+ T cells.
The ability to uptake glucose has been related to IFN-γ production, as glycolysis has been shown to regulate its expression by epigenetic and post-translational mechanisms (Chang et al., 2013; Peng et al., 2016). Similarly, it has been described that an increase in aerobic glycolysis promotes the production of other effector molecules, such as granzyme B (Cham and Gajewski, 2005; Cham et al., 2008). Interestingly, it has been suggested that aerobic glycolysis promotes the accumulation of cytoplasmic calcium, leading to the maintenance of the NFAT transcription factor needed to fulfill the effector function of T cells (Ho et al., 2015; Klein-Hessling et al., 2017; Gemta et al., 2019). All together, our results suggest that CD73-mediated adenosine production by CD8+ T cells may restrain their effector function by restricting the ability of CD8+ T cells to uptake glucose.
Here we show that CD73 deficient Tc1 cells express higher levels of the hexokinase II mRNA, a “metabolic checkpoint” and a key player in the glycolytic flow, catalyzing the first step of glycolysis (Marin-Hernandez et al., 2006; Tanner et al., 2018). However, our results showed that the loss of CD73 has no effect on the glycolytic capacity of Tc1 cells, but rather on mitochondrial metabolism. It has been described that the subcellular location of hexokinase near the outer membrane of mitochondria facilitates the coupling between glycolysis and OXPHOS (Fiek et al., 1982; Linden et al., 1982; Arora and Pedersen, 1988; Roberts and Miyamoto, 2015) which may explain why the increased hexokinase II expression in CD73KO cells is associated with higher OCR levels. Although the expression of cpt1-a is associated with memory T lymphocytes (van der Windt et al., 2012), our results are consistent with reports describing an increase in its expression after activation in effector lymphocytes (Byersdorfer et al., 2013; Klein Geltink et al., 2017). Further, it has been associated with the fact that extracellular lipids play a key role in anabolic processes, and that a reduction in their availability reduces metabolic activity (O’Sullivan et al., 2014). However, further studies are needed to evaluate the degree of use of FAO through the use of cpt-1 inhibitors (such as etomoxir) and exogenously added fatty acids such as palmitate.
Recent evidence demonstrated that there is a metabolic competition between cancer and T cells for glucose uptake (Chang et al., 2015) where the increased glycolytic rate in tumors can inhibit the antitumor function of T cells by deprivation of glucose (Chang et al., 2015; Ho et al., 2015). Our data indicate that CD73 through adenosine production may control glucose uptake in CD8+ T cells, resulting in a reduced efficiency of T cells to control tumor burden. Moreover, when mice were adoptively transferred with CD73 deficient naïve OT-I cells, we observed a higher frequency and number of tumor-infiltrating lymphocytes (TILs) compared with mice transferred with OT-I cells. In addition, CD73 deficient cells presented a reduction in the expression of exhaustion markers such as PD1, CD39, TIM-3, and TIGIT, compared to WT cells, suggesting that CD73 expression may favor an exhausted phenotype on CD8+ T cells. In this line, it has been demonstrated that PD-1 signaling leads to a reduction in glycolysis, which may in turn promote the exhaustion of T cells (Bengsch et al., 2016). Furthermore, other studies have shown that mitochondrial function is needed to maintain optimal effector functions within the tumor microenvironment and that metabolic stress generated by nutrient deprivation leads to an impaired mitochondrial function (Scharping et al., 2016; Siska et al., 2017; Yu et al., 2020). In summary, our results suggest that CD73-mediated adenosine production alters glucose uptake by CD8+ T lymphocytes, which causes the cells to be less functional by reducing their energy generation capacity, which leads to exhaustion.
Bulk evidence from the literature demonstrates that CD73 expression in human CD8+ T cells is somehow comparable to murine CD8+ T cells. It has been described that human and murine CD8+ naïve T cells present the highest expression of CD73 among CD8+ T cells (Tóth et al., 2013; Raczkowski et al., 2018). Interestingly, Raczkowski et al. (2018) demonstrate that human CD8+ T cells experience a transient upregulation on CD73 expression following in vitro T cell activation (Tóth et al., 2013; Raczkowski et al., 2018), which is similar to what is observed in murine cells. Finally, several reports in humans and mice have shown that CD8+ T cells which are chronically stimulated or present in inflamed sites or tumors are mostly CD73–CD39+ cells which express exhaustion markers (Moncrieffe et al., 2010; Botta Gordon-Smith et al., 2015; Gourdin et al., 2018; Kong et al., 2019). In agreement, we have previously demonstrated that a subpopulation of murine CD8+ T cells presenting an effector memory phenotype and CD8+ T cells that infiltrate tumors express high levels of CD39 and lack CD73 expression (Flores-Santibanez et al., 2015). Thus, as for murine CD8+ T cells, CD73 expression in human CD8+ T cells is mostly ascribed to naïve cells and downregulated in exhausted cells.
Our results provide compelling evidence with clinical significance since the use of blocking antibodies against CD73 could promote the effector cytotoxic capacity in CD8+ T cells leading to control tumor development. Different reports have described, in preclinical models, that CD73 blockade improves antitumor capacity (Stagg et al., 2010; Hay et al., 2016; Allard et al., 2017). In view of these results, interventions that target the generation of adenosine may not only prevent tumor-derived immunosuppression but also intrinsically enhance the metabolic fitness and cytotoxic activity of CD8 T+ lymphocytes.
The raw data supporting the conclusions of this article will be made available by the authors, without undue reservation.
The animal study was reviewed and approved by Comité Institucional de Cuidado y Uso de Animales (CICUA) – Universidad de Chile.
PB and ER-Y performed the experiments, analyzed the data, and wrote the manuscript. MVR, BP-T, PF, LV, and VS performed the experiments and analyzed the data. AE, FS-O, AL, and CC analyzed the data and wrote the manuscript. DS, MB, and MR designed the study and wrote the manuscript. All the authors critically read the manuscript.
This work was supported by FONDECYT 1180385 (DS), FONDECYT 1191438 (MB), FONDEQUIP/EQM 140016 (MB), FONDECYT 1180983 (AE), CONICYT AFB 170004 (MR and AL), CONICYT 21151511 (ER-Y), FONDECYT 1200255 (CC), and CONICYT/FONDAP 15150012 (CC).
The authors declare that the research was conducted in the absence of any commercial or financial relationships that could be construed as a potential conflict of interest.
Allard, B., Longhi, M. S., Robson, S. C., and Stagg, J. (2017). The ectonucleotidases CD39 and CD73: novel checkpoint inhibitor targets. Immunol. Rev. 276, 121–144. doi: 10.1111/imr.12528
Antonioli, L., Pacher, P., Vizi, E. S., and Hasko, G. (2013). CD39 and CD73 in immunity and inflammation. Trends Mol. Med. 19, 355–367. doi: 10.1016/j.molmed.2013.03.005
Arora, K. K., and Pedersen, P. L. (1988). Functional significance of mitochondrial bound hexokinase in tumor cell metabolism. Evidence for preferential phosphorylation of glucose by intramitochondrially generated ATP. J. Biol. Chem. 263, 17422–17428.
Badovinac, V. P., Porter, B. B., and Harty, J. T. (2004). CD8+ T cell contraction is controlled by early inflammation. Nat. Immunol. 5, 809–817. doi: 10.1038/ni1098
Beavis, P. A., Stagg, J., Darcy, P. K., and Smyth, M. J. (2012). CD73: a potent suppressor of antitumor immune responses. Trends Immunol. 33, 231–237. doi: 10.1016/j.it.2012.02.009
Bengsch, B., Johnson, A. L., Kurachi, M., Odorizzi, P. M., Pauken, K. E., Attanasio, J., et al. (2016). Bioenergetic insufficiencies due to metabolic alterations regulated by the inhibitory receptor PD-1 are an early driver of CD8(+) T cell exhaustion. Immunity 45, 358–373. doi: 10.1016/j.immuni.2016.07.008
Borsellino, G., Kleinewietfeld, M., Di Mitri, D., Sternjak, A., Diamantini, A., Giometto, R., et al. (2007). Expression of ectonucleotidase CD39 by Foxp3+ Treg cells: hydrolysis of extracellular ATP and immune suppression. Blood 110, 1225–1232. doi: 10.1182/blood-2006-12-064527
Botta Gordon-Smith, S., Ursu, S., Eaton, S., Moncrieffe, H., and Wedderburn, L. R. (2015). Correlation of low CD73 expression on synovial lymphocytes with reduced adenosine generation and higher disease severity in juvenile idiopathic arthritis. Arthritis Rheumatol. 67, 545–554. doi: 10.1002/art.38959
Byersdorfer, C. A., Tkachev, V., Opipari, A. W., Goodell, S., Swanson, J., Sandquist, S., et al. (2013). Effector T cells require fatty acid metabolism during murine graft-versus-host disease. Blood 122, 3230–3237. doi: 10.1182/blood-2013-04-495515
Cammann, C., Rath, A., Reichl, U., Lingel, H., Brunner-Weinzierl, M., Simeoni, L., et al. (2016). Early changes in the metabolic profile of activated CD8(+) T cells. BMC Cell. Biol. 17:28. doi: 10.1186/s12860-016-0104-x
Cham, C. M., Driessens, G., O’Keefe, J. P., and Gajewski, T. F. (2008). Glucose deprivation inhibits multiple key gene expression events and effector functions in CD8+ T cells. Eur. J. Immunol. 38, 2438–2450. doi: 10.1002/eji.200838289
Cham, C. M., and Gajewski, T. F. (2005). Glucose availability regulates IFN-gamma production and p70S6 kinase activation in CD8+ effector T cells. J. Immunol. 174, 4670–4677. doi: 10.4049/jimmunol.174.8.4670
Chang, C. H., Curtis, J. D., Maggi, L. B. Jr., Faubert, B., Villarino, A. V., O’Sullivan, D., et al. (2013). Posttranscriptional control of T cell effector function by aerobic glycolysis. Cell 153, 1239–1251. doi: 10.1016/j.cell.2013.05.016
Chang, C. H., Qiu, J., O’Sullivan, D., Buck, M. D., Noguchi, T., Curtis, J. D., Buck, M. D., Noguchi, T., Curtis, J. D., et al. (2015). Metabolic competition in the tumor microenvironment is a driver of cancer progression. Cell 162, 1229–1241. doi: 10.1016/j.cell.2015.08.016
Deaglio, S., Dwyer, K. M., Gao, W., Friedman, D., Usheva, A., Erat, A., et al. (2007). Adenosine generation catalyzed by CD39 and CD73 expressed on regulatory T cells mediates immune suppression. J. Exp. Med. 204, 1257–1265. doi: 10.1084/jem.20062512
Dianzani, U., Redoglia, V., Bragardo, M., Attisano, C., Bianchi, A., Di Franco, D., et al. (1993). Co-stimulatory signal delivered by CD73 molecule to human CD45RAhiCD45ROlo (naive) CD8+ T lymphocytes. J. Immunol. 151, 3961–3970.
Erdmann, A. A., Gao, Z. G., Jung, U., Foley, J., Borenstein, T., Jacobson, K. A., et al. (2005). Activation of Th1 and Tc1 cell adenosine A2A receptors directly inhibits IL-2 secretion in vitro and IL-2-driven expansion in vivo. Blood 105, 4707–4714. doi: 10.1182/blood-2004-04-1407
Fang, F., Yu, M., Cavanagh, M. M., Hutter Saunders, J., Qi, Q., Ye, Z., et al. (2016). Expression of CD39 on activated T cells impairs their survival in older individuals. Cell. Rep. 14, 1218–1231. doi: 10.1016/j.celrep.2016.01.002
Fiek, C., Benz, R., Roos, N., and Brdiczka, D. (1982). Evidence for identity between the hexokinase-binding protein and the mitochondrial porin in the outer membrane of rat liver mitochondria. Biochim. Biophys. Acta 688, 429–440. doi: 10.1016/0005-2736(82)90354-6
Flores-Santibanez, F., Fernandez, D., Meza, D., Tejon, G., Vargas, L., Varela-Nallar, L., et al. (2015). CD73-mediated adenosine production promotes stem cell-like properties in mouse Tc17 cells. Immunology 146, 582–594. doi: 10.1111/imm.12529
Gattinoni, L., Klebanoff, C. A., and Restifo, N. P. (2012). Paths to stemness: building the ultimate antitumour T cell. Nat. Rev. Cancer 12, 671–684. doi: 10.1038/nrc3322
Gemta, L. F., Siska, P. J., Nelson, M. E., Gao, X., Liu, X., Locasale, J. W., et al. (2019). Impaired enolase 1 glycolytic activity restrains effector functions of tumor-infiltrating CD8(+) T cells. Sci. Immunol. 4:eaa9520. doi: 10.1126/sciimmunol.aap9520
Gourdin, N., Bossennec, M., Rodriguez, C., Vigano, S., Machon, C., Jandus, C., et al. (2018). Autocrine adenosine regulates tumor polyfunctional CD73(+)CD4(+) effector T cells devoid of immune checkpoints. Cancer Res. 78, 3604–3618. doi: 10.1158/0008-5472.CAN-17-2405
Gupta, P. K., Godec, J., Wolski, D., Adland, E., Yates, K., Pauken, K. E., et al. (2015). CD39 Expression identifies terminally exhausted CD8+ T Cells. PLoS Pathog. 11:e1005177. doi: 10.1371/journal.ppat.1005177
Hay, C. M., Sult, E., Huang, Q., Mulgrew, K., Fuhrmann, S. R., McGlinchey, K. A., et al. (2016). Targeting CD73 in the tumor microenvironment with MEDI9447. Oncoimmunology 5:e1208875. doi: 10.1080/2162402X.2016.1208875
Heng, T. S., Painter, M. W., and Immunological Genome Project Consortium. (2008). The immunological genome project: networks of gene expression in immune cells. Nat. Immunol. 9, 1091–1094. doi: 10.1038/ni1008-1091
Ho, P. C., Bihuniak, J. D., Macintyre, A. N., Staron, M., Liu, X., Amezquita, R., et al. (2015). Phosphoenolpyruvate is a metabolic checkpoint of anti-tumor T cell responses. Cell 162, 1217–1228. doi: 10.1016/j.cell.2015.08.012
Huang, S., Apasov, S., Koshiba, M., and Sitkovsky, M. (1997). Role of A2a extracellular adenosine receptor-mediated signaling in adenosine-mediated inhibition of T-cell activation and expansion. Blood 90, 1600–1610.
Hukelmann, J. L., Anderson, K. E., Sinclair, L. V., Grzes, K. M., Murillo, A. B., Hawkins, P. T., et al. (2016). The cytotoxic T cell proteome and its shaping by the kinase mTOR. Nat. Immunol. 17, 104–112. doi: 10.1038/ni.3314
Jones, R. G., and Thompson, C. B. (2007). Revving the engine: signal transduction fuels T cell activation. Immunity 27, 173–178. doi: 10.1016/j.immuni.2007.07.008
Joshi, N. S., Cui, W., Chandele, A., Lee, H. K., Urso, D. R., Hagman, J., et al. (2007). Inflammation directs memory precursor and short-lived effector CD8(+) T cell fates via the graded expression of T-bet transcription factor. Immunity 27, 281–295. doi: 10.1016/j.immuni.2007.07.010
Kaech, S. M., and Cui, W. (2012). Transcriptional control of effector and memory CD8+ T cell differentiation. Nat. Rev. Immunol. 12, 749–761. doi: 10.1038/nri3307
Kaech, S. M., Tan, J. T., Wherry, E. J., Konieczny, B. T., Surh, C. D., Ahmed, R., et al. (2003). Selective expression of the interleukin 7 receptor identifies effector CD8 T cells that give rise to long-lived memory cells. Nat. Immunol. 4, 1191–1198. doi: 10.1038/ni1009
Klein Geltink, R. I., O’Sullivan, D., Corrado, M., Bremser, A., Buck, M. D., Buescher, J. M., et al. (2017). Mitochondrial priming by CD28. Cell 171, 385–397. doi: 10.1016/j.cell.2017.08.018
Klein-Hessling, S., Muhammad, K., Klein, M., Pusch, T., Rudolf, R., Floter, J., et al. (2017). NFATc1 controls the cytotoxicity of CD8(+) T cells. Nat. Commun. 8:511. doi: 10.1038/s41467-017-00612-6
Kobie, J. J., Shah, P. R., Yang, L., Rebhahn, J. A., Fowell, D. J., and Mosmann, T. R. (2006). T regulatory and primed uncommitted CD4 T cells express CD73, which suppresses effector CD4 T cells by converting 5’-adenosine monophosphate to adenosine. J. Immunol. 177, 6780–6786. doi: 10.4049/jimmunol.177.10.6780
Kong, Y., Jia, B., Zhao, C., Claxton, D. F., Sharma, A., Annageldiyev, C., et al. (2019). Downregulation of CD73 associates with T cell exhaustion in AML patients. J. Hematol. Oncol. 12:40. doi: 10.1186/s13045-019-0728-3
Li, J., Wang, L., Chen, X., Li, L., Li, Y., Ping, Y., et al. (2017). CD39/CD73 upregulation on myeloid-derived suppressor cells via TGF-beta-mTOR-HIF-1 signaling in patients with non-small cell lung cancer. Oncoimmunology 6:e1320011. doi: 10.1080/2162402X.2017.1320011
Linden, J., and Cekic, C. (2012). Regulation of lymphocyte function by adenosine. Arterioscler. Thromb. Vasc. Biol. 32, 2097–2103. doi: 10.1161/ATVBAHA.111.226837
Linden, M., Gellerfors, P., and Nelson, B. D. (1982). Pore protein and the hexokinase-binding protein from the outer membrane of rat liver mitochondria are identical. FEBS Lett. 141, 189–192. doi: 10.1016/0014-5793(82)80044-6
Linnemann, C., Schildberg, F. A., Schurich, A., Diehl, L., Hegenbarth, S. I., Endl, E., et al. (2009). Adenosine regulates CD8 T-cell priming by inhibition of membrane-proximal T-cell receptor signalling. Immunology 128, e728–e737. doi: 10.1111/j.1365-2567.2009.03075.x
Lunt, S. Y., and Vander Heiden, M. G. (2011). Aerobic glycolysis: meeting the metabolic requirements of cell proliferation. Annu. Rev. Cell. Dev. Biol. 27, 441–464. doi: 10.1146/annurev-cellbio-092910-154237
MacIver, N. J., Michalek, R. D., and Rathmell, J. C. (2013). Metabolic regulation of T lymphocytes. Annu. Rev. Immunol. 31, 259–283. doi: 10.1146/annurev-immunol-032712-095956
Marin-Hernandez, A., Rodriguez-Enriquez, S., Vital-Gonzalez, P. A., Flores-Rodriguez, F. L., Macias-Silva, M., Sosa-Garrocho, M., et al. (2006). Determining and understanding the control of glycolysis in fast-growth tumor cells. Flux control by an over-expressed but strongly product-inhibited hexokinase. FEBS J. 273, 1975–1988. doi: 10.1111/j.1742-4658.2006.05214.x
Mastelic-Gavillet, B., Navarro Rodrigo, B., Decombaz, L., Wang, H., Ercolano, G., Ahmed, R., et al. (2019). Adenosine mediates functional and metabolic suppression of peripheral and tumor-infiltrating CD8(+) T cells. J. Immunother. Cancer 7:257. doi: 10.1186/s40425-019-0719-5
Maurice, N. J., McElrath, M. J., Andersen-Nissen, E., Frahm, N., and Prlic, M. (2019). CXCR3 enables recruitment and site-specific bystander activation of memory CD8(+) T cells. Nat. Commun. 10:4987. doi: 10.1038/s41467-019-12980-2
Menk, A. V., Scharping, N. E., Moreci, R. S., Zeng, X., Guy, C., Salvatore, S., et al. (2018). Early TCR signaling induces rapid aerobic glycolysis enabling distinct acute T cell effector functions. Cell. Rep. 22, 1509–1521. doi: 10.1016/j.celrep.2018.01.040
Moncrieffe, H., Nistala, K., Kamhieh, Y., Evans, J., Eddaoudi, A., Eaton, S., et al. (2010). High expression of the ectonucleotidase CD39 on T cells from the inflamed site identifies two distinct populations, one regulatory and one memory T cell population. J. Immunol. 185, 134–143. doi: 10.4049/jimmunol.0803474
Munoz, E., Zubiaga, A. M., Merrow, M., Sauter, N. P., and Huber, B. T. (1990). Cholera toxin discriminates between T helper 1 and 2 cells in T cell receptor-mediated activation: role of cAMP in T cell proliferation. J. Exp. Med. 172, 95–103. doi: 10.1084/jem.172.1.95
Newick, K., O’Brien, S., Sun, J., Kapoor, V., Maceyko, S., Lo, A., et al. (2016). Augmentation of Car T-cell trafficking and antitumor efficacy by blocking protein kinase a localization. Cancer Immunol. Res. 4, 541–551. doi: 10.1158/2326-6066.CIR-15-0263
Ohta, A., Ohta, A., Madasu, M., Kini, R., Subramanian, M., Goel, N., et al. (2009). A2A adenosine receptor may allow expansion of T cells lacking effector functions in extracellular adenosine-rich microenvironments. J. Immunol. 183, 5487–5493. doi: 10.4049/jimmunol.0901247
O’Sullivan, D., van der Windt, G. J., Huang, S. C., Curtis, J. D., Chang, C. H., Buck, M. D., et al. (2014). Memory CD8(+) T cells use cell-intrinsic lipolysis to support the metabolic programming necessary for development. Immunity 41, 75–88. doi: 10.1016/j.immuni.2014.06.005
Pearce, E. L., Poffenberger, M. C., Chang, C. H., and Jones, R. G. (2013). Fueling immunity: insights into metabolism and lymphocyte function. Science 342:1242454. doi: 10.1126/science.1242454
Peng, M., Yin, N., Chhangawala, S., Xu, K., Leslie, C. S., and Li, M. O. (2016). Aerobic glycolysis promotes T helper 1 cell differentiation through an epigenetic mechanism. Science 354, 481–484. doi: 10.1126/science.aaf6284
Raczkowski, F., Rissiek, A., Ricklefs, I., Heiss, K., Schumacher, V., Wundenberg, K., et al. (2018). CD39 is upregulated during activation of mouse and human T cells and attenuates the immune response to Listeria monocytogenes. PLoS One 13:e0197151. doi: 10.1371/journal.pone.0197151
Raskovalova, T., Lokshin, A., Huang, X., Su, Y., Mandic, M., Zarour, H. M., et al. (2007). Inhibition of cytokine production and cytotoxic activity of human antimelanoma specific CD8+ and CD4+ T lymphocytes by adenosine-protein kinase A type I signaling. Cancer Res. 67, 5949–5956. doi: 10.1158/0008-5472.CAN-06-4249
Regateiro, F. S., Cobbold, S. P., and Waldmann, H. (2013). CD73 and adenosine generation in the creation of regulatory microenvironments. Clin. Exp. Immunol. 171, 1–7. doi: 10.1111/j.1365-2249.2012.04623.x
Roberts, D. J., and Miyamoto, S. (2015). Hexokinase II integrates energy metabolism and cellular protection: akting on mitochondria and TORCing to autophagy. Cell. Death Differ. 22, 248–257. doi: 10.1038/cdd.2014.173
Robson, S. C., Sevigny, J., and Zimmermann, H. (2006). The E-NTPDase family of ectonucleotidases: structure function relationships and pathophysiological significance. Purinergic. Signal 2, 409–430. doi: 10.1007/s11302-006-9003-5
Rodriguez, G., Ross, J. A., Nagy, Z. S., and Kirken, R. A. (2013). Forskolin-inducible cAMP pathway negatively regulates T-cell proliferation by uncoupling the interleukin-2 receptor complex. J. Biol. Chem. 288, 7137–7146. doi: 10.1074/jbc.M112.408765
Sallusto, F., Geginat, J., and Lanzavecchia, A. (2004). Central memory and effector memory T cell subsets: function, generation, and maintenance. Annu. Rev. Immunol. 22, 745–763. doi: 10.1146/annurev.immunol.22.012703.104702
Sallusto, F., Lenig, D., Forster, R., Lipp, M., and Lanzavecchia, A. (1999). Two subsets of memory T lymphocytes with distinct homing potentials and effector functions. Nature 401, 708–712. doi: 10.1038/44385
Scharping, N. E., Menk, A. V., Moreci, R. S., Whetstone, R. D., Dadey, R. E., Watkins, S. C., et al. (2016). The tumor microenvironment represses T cell mitochondrial biogenesis to drive intratumoral T cell metabolic insufficiency and dysfunction. Immunity 45, 374–388. doi: 10.1016/j.immuni.2016.07.009
Siska, P. J., Beckermann, K. E., Mason, F. M., Andrejeva, G., Greenplate, A. R., Sendor, A. B., et al. (2017). Mitochondrial dysregulation and glycolytic insufficiency functionally impair CD8 T cells infiltrating human renal cell carcinoma. JCI Insight 2:e93411. doi: 10.1172/jci.insight.93411
Stagg, J., Divisekera, U., McLaughlin, N., Sharkey, J., Pommey, S., Denoyer, D., et al. (2010). Anti-CD73 antibody therapy inhibits breast tumor growth and metastasis. Proc. Natl. Acad. Sci. U S A. 107, 1547–1552. doi: 10.1073/pnas.0908801107
Tanner, L. B., Goglia, A. G., Wei, M. H., Sehgal, T., Parsons, L. R., Park, J. O., et al. (2018). Four key steps control glycolytic flux in mammalian cells. Cell. Syst. 7, 49–62. doi: 10.1016/j.cels.2018.06.003
Tóth, I., Le, A. Q., Hartjen, P., Thomssen, A., Matzat, V., Lehmann, C., et al. (2013). Decreased frequency of CD73+CD8+ T cells of HIV-infected patients correlates with immune activation and T cell exhaustion. J. Leukoc. Biol. 94, 551–561. doi: 10.1189/jlb.0113018
van der Windt, G. J., Everts, B., Chang, C. H., Curtis, J. D., Freitas, T. C., Amiel, E., et al. (2012). Mitochondrial respiratory capacity is a critical regulator of CD8+ T cell memory development. Immunity 36, 68–78. doi: 10.1016/j.immuni.2011.12.007
van der Windt, G. J., and Pearce, E. L. (2012). Metabolic switching and fuel choice during T-cell differentiation and memory development. Immunol. Rev. 249, 27–42. doi: 10.1111/j.1600-065X.2012.01150.x
Vander Heiden, M. G., Cantley, L. C., and Thompson, C. B. (2009). Understanding the warburg effect: the metabolic requirements of cell proliferation. Science 324, 1029–1033. doi: 10.1126/science.1160809
Vang, T., Torgersen, K. M., Sundvold, V., Saxena, M., Levy, F. O., Skalhegg, B. S., et al. (2001). Activation of the COOH-terminal Src kinase (Csk) by cAMP-dependent protein kinase inhibits signaling through the T cell receptor. J. Exp. Med. 193, 497–507. doi: 10.1084/jem.193.4.497
Vigano, S., Alatzoglou, D., Irving, M., Menetrier-Caux, C., Caux, C., Romero, P., et al. (2019). Targeting adenosine in cancer immunotherapy to enhance T-cell function. Front. Immunol. 10:925. doi: 10.3389/fimmu.2019.00925
Wang, R., Dillon, C. P., Shi, L. Z., Milasta, S., Carter, R., Finkelstein, D., et al. (2011). The transcription factor Myc controls metabolic reprogramming upon T lymphocyte activation. Immunity 35, 871–882. doi: 10.1016/j.immuni.2011.09.021
Williams, M. A., and Bevan, M. J. (2007). Effector and memory CTL differentiation. Annu. Rev. Immunol. 25, 171–192. doi: 10.1146/annurev.immunol.25.022106.141548
Yu, Y. R., Imrichova, H., Wang, H., Chao, T., Xiao, Z., Gao, M., et al. (2020). Disturbed mitochondrial dynamics in CD8(+) TILs reinforce T cell exhaustion. Nat. Immunol. 21, 1540–1551. doi: 10.1038/s41590-020-0793-3
Keywords: CD73/NT5E, CD8 T cell, metabolism, cytotoxic, antitumor activity
Citation: Briceño P, Rivas-Yañez E, Rosemblatt MV, Parra-Tello B, Farías P, Vargas L, Simon V, Cárdenas C, Lladser A, Salazar-Onfray F, Elorza AA, Rosemblatt M, Bono MR and Sauma D (2021) CD73 Ectonucleotidase Restrains CD8+ T Cell Metabolic Fitness and Anti-tumoral Activity. Front. Cell Dev. Biol. 9:638037. doi: 10.3389/fcell.2021.638037
Received: 04 December 2020; Accepted: 20 January 2021;
Published: 18 February 2021.
Edited by:
Luiz Eduardo Baggio Savio, Federal University of Rio de Janeiro, BrazilReviewed by:
Silvia Deaglio, University of Turin, ItalyCopyright © 2021 Briceño, Rivas-Yañez, Rosemblatt, Parra-Tello, Farías, Vargas, Simon, Cárdenas, Lladser, Salazar-Onfray, Elorza, Rosemblatt, Bono and Sauma. This is an open-access article distributed under the terms of the Creative Commons Attribution License (CC BY). The use, distribution or reproduction in other forums is permitted, provided the original author(s) and the copyright owner(s) are credited and that the original publication in this journal is cited, in accordance with accepted academic practice. No use, distribution or reproduction is permitted which does not comply with these terms.
*Correspondence: María Rosa Bono, bXJib25vQHVjaGlsZS5jbA==; Daniela Sauma, ZHNhdW1hQHVjaGlsZS5jbA==
†These authors have contributed equally to this work
Disclaimer: All claims expressed in this article are solely those of the authors and do not necessarily represent those of their affiliated organizations, or those of the publisher, the editors and the reviewers. Any product that may be evaluated in this article or claim that may be made by its manufacturer is not guaranteed or endorsed by the publisher.
Research integrity at Frontiers
Learn more about the work of our research integrity team to safeguard the quality of each article we publish.