 Wangren Qiu
 Zhe Lv1
 Xuan Xiao
- 1School of Information Engineering, Jingdezhen Ceramic Institute, Jingdezhen, China
- 2School of Information Engineering, Jingdezhen University, Jingdezhen, China
Background: As a class of membrane protein receptors, G protein-coupled receptors (GPCRs) are very important for cells to complete normal life function and have been proven to be a major drug target for widespread clinical application. Hence, it is of great significance to find GPCR targets that interact with drugs in the process of drug development. However, identifying the interaction of the GPCR–drug pairs by experimental methods is very expensive and time-consuming on a large scale. As more and more database about GPCR–drug pairs are opened, it is viable to develop machine learning models to accurately predict whether there is an interaction existing in a GPCR–drug pair.
Methods: In this paper, the proposed model aims to improve the accuracy of predicting the interactions of GPCR–drug pairs. For GPCRs, the work extracts protein sequence features based on a novel bag-of-words (BOW) model improved with weighted Silhouette Coefficient and has been confirmed that it can extract more pattern information and limit the dimension of feature. For drug molecules, discrete wavelet transform (DWT) is used to extract features from the original molecular fingerprints. Subsequently, the above-mentioned two types of features are contacted, and SMOTE algorithm is selected to balance the training dataset. Then, artificial neural network is used to extract features further. Finally, a gradient boosting decision tree (GBDT) model is trained with the selected features. In this paper, the proposed model is named as BOW-GBDT.
Results: D92M and Check390 are selected for testing BOW-GBDT. D92M is used for a cross-validation dataset which contains 635 interactive GPCR–drug pairs and 1,225 non-interactive pairs. Check390 is used for an independent test dataset which consists of 130 interactive GPCR–drug pairs and 260 non-interactive GPCR–drug pairs, and each element in Check390 cannot be found in D92M. According to the results, the proposed model has a better performance in generation ability compared with the existing machine learning models.
Conclusion: The proposed predictor improves the accuracy of the interactions of GPCR–drug pairs. In order to facilitate more researchers to use the BOW-GBDT, the predictor has been settled into a brand-new server, which is available at http://www.jci-bioinfo.cn/bowgbdt.
Background
As a special membrane protein, G protein-coupled receptors (GPCRs) play a significant role in the normal life function of cells (Jacoby et al., 2006) and can be used as important drug targets because of its structural characteristics and important role in signal transduction (Agrawal et al., 2016). Among the most popular drugs in the market, nearly half of them work through GPCRs directly or indirectly (Alexander et al., 2011). Therefore, it is of much significance to find GPCRs that interact with drugs in the process of drug development (Alberts et al., 2003; Alexander et al., 2011).
High-throughput experimental methods such as scintillation proximity assay and time-resolved fluorescence resonance energy transfer technology are the key in GPCR-related drug discovery (Zhang and Xie, 2012). However, experimental methods are inevitably costly, labor-exhausting, and time-consuming. As predicting the interaction of GPCR–drug pairs will help to avoid wasting a lot of time and money in synthetic drug research, prediction approaches in silico are widely utilized to assist the experimental methods with the rapid development of prediction algorithms and datasets.
In recent years, a number of researchers have proposed effective predicted methods which are based on 3D structures of GPCR for predicting the target drug interaction (Yamanishi et al., 2008; Ru et al., 2020). However, a lot of 3D structures of GPCR have not been measured yet. As a result, the application of these methods based on the 3D structures of proteins is greatly restricted. With the accumulation of GPCR–drug interaction data stored in Kyoto Encyclopedia of Genes and Genomes (KEGG) (Kanehisa et al., 2006), SuperTarget (Gunther et al., 2008), and DrugBank (Wishart et al., 2008), methods based on sequence information may be efficient for identifying the interaction between GPCR and drug. Therefore, we will focus the research only based on sequence information in this study.
Since the interaction between GPCRs and drugs involves two types of molecules, the method which combines the chemical structure information of drugs and the sequence information of proteins is often used. Yamanishi et al. (2008) used statistical methods to predict the GPCR–drug interaction based on the combination of protein chemical structure and sequence information. On the basis of optimizing the feature selection process, He et al. (2010) used the nearest neighbor algorithm as a classifier to predict the interaction between drugs and four targets including GPCRs. In this method, drug was formulated into a 28-D vector based on the chemical functional group, and protein was formulated into a 139-D vector using a pseudo-amino acid composition (PseAAC) (Arif et al., 2018; Mei and Zhao, 2018). Xiao et al. (2013) proposed a sequence-based predictor called “iGPCR–drug”. In the predictor, the component of the drug was represented by a two-dimensional fingerprint via a chemical toolbox called OpenBabel (O'Boyle et al., 2011), and then discrete Fourier transform (DFT) was used to extract 256 features. The GPCR was composed of PseAAC generated with the gray model theory, and the prediction engine adopted the fuzzy K-nearest neighbor algorithm. TargetGDrug (Hu et al., 2016) was also a sequence-based predictor for predicting GPCR–drug interactions. The method formed the features of the GPCR–drug pair by combining the evolutionary features of the GPCR sequence with the molecular fingerprint features of the drug based on discrete wavelet transform and input the features into a trained random forest classifier for initial prediction. Finally, a new post-processing procedure based on drug association matrix is proposed to reduce potential false positives or false negatives in initial predictions. Recently, Wang et al. (2020b) proposed a novel sequence-based method for identifying the GPCR–drug interaction. In such work, the sequences of GPCRs were encoded by the physicochemical properties of amino acids, and then clustering technology was used to create four wordbooks. The wordbooks contained 20, 20, 30, and 58 words which are determined with the method of trial and error; it is a little tedious and unreliable. Then, the GPCR–drug pairs were concatenated to a 256-D vector comprising of a 128-D wordbooks vector for GPCR and a 128-D DFT vector for drugs with fingerprint. Finally, a simple machine learning algorithm, distance-weighted K-nearest neighbors (DWKNN) (Dudani, 1976), was adopted as the predictor via training on eventual features. Although this advanced model was better than the foregoing ones, the machine learning algorithm was such simple that it could not get a better performance, so it is meaningful to employ advanced algorithm to develop a model with higher performance.
In this study, we propose a novel sequence-based machine learning model for identifying the GPCR–drug interaction based on wordbook learning from sequences. For GPCR, we use an improved bag-of-words (BOW) (Wang et al., 2020b) model containing four wordbooks to extract features by introducing silhouette coefficient to determine the best number of words. For the drug, we carry out discrete wavelet transform (DWT) on molecular fingerprint to extract features. The SMOTE algorithm is implemented to balance the training dataset, and an artificial neural network (ANN) (Rumelhart et al., 1986; Hinton and Salakhutdinov, 2006; Hinton, 2007; Zou et al., 2016; Wan et al., 2017; Chao et al., 2019) model is used to extract GPCR–drug pair features and reduce the dimension from 242-D to 121-D. A more effective algorithm called gradient boosting decision tree (GBDT) (Friedman, 2001; Lv et al., 2020a; Sahin, 2020) is employed as the classifier for interaction prediction. According to the result on the independent test dataset, the proposed model, BOW-GBDT, can achieve better performance than those of the existing references.
Datasets and Methods
Experimental Datasets and Performance Measurement
In this study, two benchmark datasets, i.e., D92M and Check390 (Hu et al., 2016), are served for testing the proposed method. D92M is used for a cross-validation dataset which contains 635 interactive GPCR–drug pairs and 1,225 non-interactive pairs. Check390 is used for an independent test dataset which consists of 130 interactive GPCR–drug pairs and 260 non-interactive GPCR–drug pairs, and each element in Check390 cannot be found in D92M. In our experiment, we evaluate the performance of the predictor from five metrics listed in formula (1), which include accuracy (Acc), sensitivity (Sn), specificity (Sp), Matthews correlation coefficient (MCC), and strength (Str, the average of Sn and Sp) (Cheng et al., 2019). In the following formula, TP is the number of the actual interactive GPCR–drug pairs predicted as interactive GPCR–drug pairs, TN is the number of the actual non-interactive pairs predicted as non-interactive pairs, FP is the number of the actual non-interactive pairs but predicted as interactive pairs, and FN is the number of the actual interactive pairs but predicted as non-interactive pairs. What is more, receiver operating characteristic (ROC) curve and area under the ROC curve (AUC) are also applied to evaluate the models in this work.
Feature Extraction From GPCRs
Based on the work of Wang et al. (2020b), who developed an effective method to represent GPCR with BOW model, this study will enhance the BOW model by using weighted silhouette coefficient and a variety of ways for determining the wordbooks. The steps of feature extraction are as follows:
• Step 1: Encoding GPCRs with amino acid index
AAindex (Kawashima and Kanehisa, 2000) is a database which collects more than 500 amino acid indices. Wang et al. (2020b) tested the effects of five common amino acid indices: hydropathy index, molecular weight, isoelectric point, pK-N, and pK-C. According to the experimental result, we choose hydropathy index as the suitable amino acid index in this paper.
• Step 2: Designing wordbooks for GPCRs
In this paper, four kinds of wordbooks were defined and denoted as WBA, WBB, WBC, and WBD. GPCR sequences were encoded according to hydropathy index. Here the amino acid composition (AAC) is the candidate for wordbook WBA, which is the same as in Wang et al. (2020b), and the number of words is 20 obviously.
To obtain wordbook WBB, the encoded sequences were split into fragments with different window sizes. The window size of WBB was set as 2, and the stride of the moving window is 1 in this paper. Given a GPCR sequence, the process of this step is shown in Figure 1. The window size is 2 in the example.
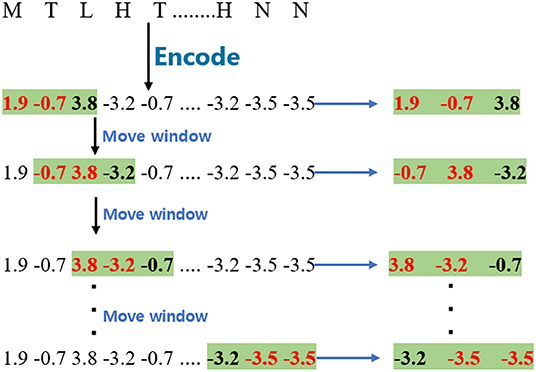
Figure 1. The process of cutting G protein-coupled receptor sequence for WBB and WBC.
As regards wordbook WBC, the model applies a similar process to obtain them except that the window size is 3, and the process of cutting the GPCR sequence is marked with a green background as shown in Figure 1.
For the WBD, the proposed model split the encoded sequences into fragments with a window size 2. The window is different from the one used in WBB and WBC since it is separated by one amino acid. The stride of the moving window is also 1. Given a GPCR sequence, the process is shown in Figure 2.
• Step 3: Determine the best number of the clustering by using weighted silhouette coefficient
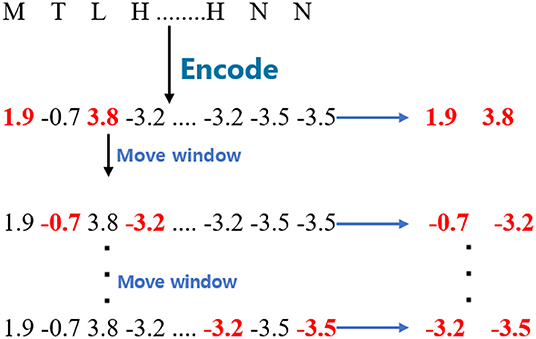
Figure 2. The process of cutting G protein-coupled receptor sequences for WBD.
Here we used K-means (Hartigan and Wong, 1979; Kanungo et al., 2002) algorithm to cluster the fragments with the same length, respectively, and take the clustering centers as the words of the GPCR wordbook. In the process of creating the four kinds of wordbooks, it is important to determine the numbers of the clustering centers which would fluctuate the results greatly (Wang et al., 2020b). In this step, a metric called weighted silhouette coefficient (Rousseeuw, 1987) (noted as WSC, an evaluation method of clustering effect) was used to decide the best K which is the number of clustering centers.
For a given dataset, D = {(x1, y1), (x2, y2), ⋯, (xM, yM)}, yi is the label of the sample xi, yi ∈ {1, ⋯, C}, and C is the number of clusters. The weighted silhouette coefficient would be calculated with the formula according to Rousseeuw (1987), in which WSCxi is the WSC of sample xi and obtained with the following steps:
Firstly, for any sample xi, Dxi = {(x, y)|(x, y) ∈ D and y = yi}, let represents the internal means distance which can be obtained with formula (2)
where , dist(xi, xj) is the Euclidean distance of samples xi and xj, and ||Dxi|| is the number of samples in set Dxi.
Secondly, let represents the external mean distance which can be obtained with formula (3), and may be derived with the following sub-steps:
(1) For any cluster with label c, let Dc = {(x, y)|(x, y) ∈ D, y = c and y ≠ yi};
(2) For (xk, yk) ∈ Dc, calculate dist(xi, xk) which is the Euclidean distance of sample xi and xk;
(3) The weighted distance is ;
(4) Calculate the mean weighted distance of the cth cluster by , ||Dc|| is the number of samples in set Dc.
Finally, the weighted silhouette coefficient of sample xi, i.e., WSCxi, would be obtained with WSCxi = .
For WBB, the line chart of the relationship between weighted silhouette coefficient and K is shown in the left subpicture of Figure 3. It is easy to find that, when K is 16, the highest weighted silhouette coefficient is achieved. Therefore, the best number of the clustering centers in WBB is 16. For WBC, it is not difficult to find that the best number of the clustering centers is 62. For the words of the GPCR wordbook WBD, the best number of words is 16 on basis that, when K equals 16, the highest weighted silhouette coefficient is achieved.
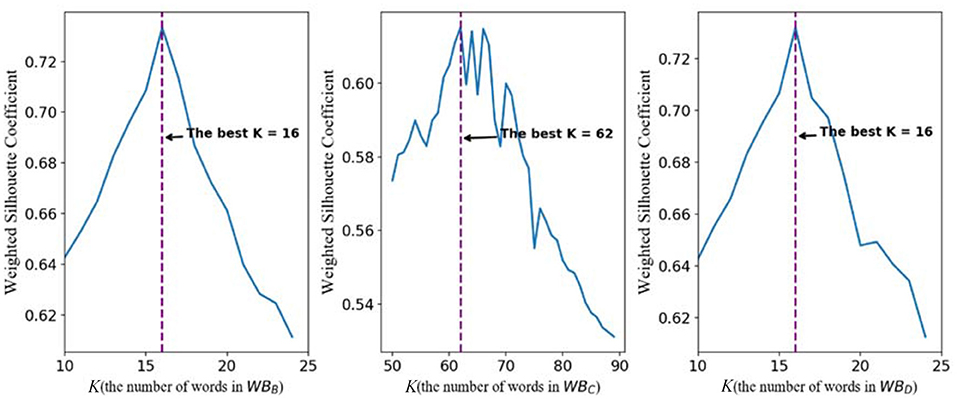
Figure 3. The profile of weighted Silhouette Coefficient and K.
In summary, the numbers of words of the different wordbooks are shown in Table 1.
• Step 4: Feature extraction based on wordbooks
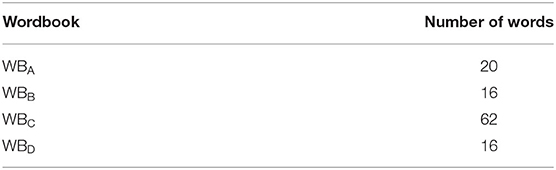
Table 1. The number of words of different wordbooks.
Based on the wordbooks, any GPCR can be represented with a feature vector following the steps below:
(1) Encode the GPCR sequence by hydropathy index.
(2) Split the encoded sequence into fragments of which the shape is like the shape of each word in the wordbook.
(3) Count the number of times each word appears in the sequence.
(4) Represent the GPCR in terms of a feature vector with formula (4).
where l means the length of a word, Cl is the number of words in the wordbook, and is the frequency of a word in the sequence.
Because of four kinds of wordbooks, any GPCR can be represented as four feature vectors denoted as G(1, 20), G(2, 16), G(3, 62), and G(4, 16). Finally, we concatenate the four vectors into a 114-D vector of GPCR listed as follows:
Feature Extraction From Drugs
Molecular fingerprint, which is a bit-string representation of molecular structure and property (Eckert and Bajorath, 2007), has demonstrated its effectiveness for the prediction of drug–target interactions in previous studies (Xiao et al., 2013; Hu et al., 2016; Li et al., 2019; Wang et al., 2020b). In this study, we also extract drug features from their molecular fingerprints. A drug's MOL file, which contains information about the chemical structure, can be acquired from the KEGG database (http://www.kegg.jp/kegg/) by using the drug code. Then, the software called OpenBabel (http://openbabel.org/) is used to convert the MOL file into a molecular fingerprint file. OpenBabel can generate multiple output formats: FP2, FP3, FP4, and MACSS. Here the FP2 is a good choice for this study. The FP2 molecular fingerprint is represented by a 256-bit hexadecimal string.
In previous studies, Wang et al. (2020b) and Hu et al. (2016) have confirmed the effectiveness of applying DFT (Jackson, 1996) or DWT (Haar, 1911; Jackson, 1996) on molecular fingerprint, respectively. In this study, we use DFT and DWT for extracting drug features, respectively, and compare the effect of the two kinds of signal processing for predicting the interactions of GPCR—drug pairs later.
For extracting drug features by using DFT, because of the symmetry of the frequency amplitudes of a digital signal, we only choose the first 128 amplitudes to form the drug feature vector DDFT.
To extract drug features by using DWT, the process should apply single-level discrete 1-D wavelet transform on a digital signal and would reach at two kinds of coefficient sets: one is the set of approximation coefficients which would be considered as useful information, and the other one is the set of detail coefficients which would be recognized as useless noise. Then, we use the set of approximation coefficients to make up the drug feature vector DDWT.
In the following process, DDWT or DDFT is used to represent drugs according to the results of comparative experiments.
Finally, a potential GPCR–drug pair is concatenated to a 242-D feature vector P which can be represented by the following formula (8).
where P0 means DDWT or DDFT.
Feature Extraction by ANN
ANN (Zeng et al., 2019; Wang et al., 2020a; Zhao et al., 2020a,b) is a kind of information processing system based on imitating the structure and function of the brain neural network, which is a complex network structure formed by a large number of interconnected processing units (neurons). In this study, we create a simple ANN model to extract features further, and the structure of ANN is shown in Figure 4. The ANN model has three layers: two layers are hidden layers, and the other layer is an output layer. The 242-D GPCR–drug pair feature vector P will input into the model, and the output of hidden layer 2 is intercepted as a new feature.
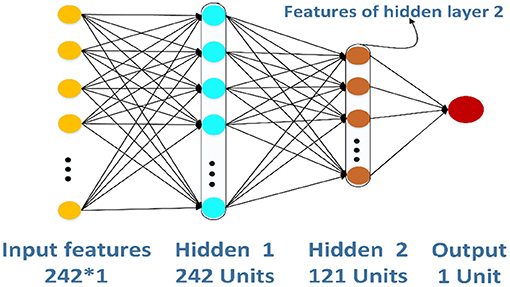
Figure 4. The structure of the artificial neural network for feature extraction.
Synthetic Minority Oversampling Technique
The Synthetic Minority Oversampling Technique (SMOTE) (Chawla et al., 2002; Blagus and Lusa, 2013; Wang et al., 2019) proposed by Chawla et al. is a very popular oversampling method to solve the problem of imbalance dataset. The basic idea of the SMOTE algorithm is to generate new data from two types of sample data to analyze and simulate a small number of sample sets and add new artificially simulated samples to the dataset. The specific procedure is as follows:
(1) Select the k nearest neighbors of each sample xi according to the Euclidean distance between xi and all samples in the minority class {x1, x2, x3, ⋯, xm} .
(2) Set a sampling rate based on the class imbalance ratio N, and select N samples {xi1, xi2, ⋯, xiN} randomly from k nearest neighbors of sample xi.
(3) Generate a new sample according to the formula xnew = xi+ α(xi − xij); here 1 ≤ i ≤ m, 1 ≤ j ≤ N and α represents a random value selected from interval (0, 1).
(4) Add new artificially simulated samples to the old dataset and get a new balance dataset.
Classifier Selection
Gradient Boosting Decision Tree
The GBDT (Friedman, 2001) is a kind of a boosting algorithm based on classification and regression trees (CART) (Breiman et al., 1984). Because of its strong generalization ability, GBDT has been widely used to be designed as a classifier. GBDT is good at handling lots of kinds of data flexibly, including continuous value and discrete value. The idea of GBDT is to generate multiple weak models iteratively and then add the prediction results of each weak model.
Random Forest
Random forest (RF) (Breiman, 2001; Song et al., 2017; Cheng and Hu, 2018; Cheng, 2019; Ru et al., 2019; Xu et al., 2019; Lv et al., 2020b) is a kind of bagging algorithm containing many decision trees, which has been widely used in computer science, bioinformatics, and so on. Each tree in the forest is generated by different samples and features. CART is often chosen as the decision tree for RF. When an unknown sample is needed to be classified, each tree will vote, and then RF will count the votes. The unknown sample will be decided to belong to the category with the largest number of votes.
Support Vector Machines
The support vector machines (SVM) proposed by Vapnik (1995), is a classical machine learning method which has been developed for many years, and its theory has been perfect. It is very popular in bioinformatics, pattern recognition, and so on. The strategy of SVM is to generate the optimal hyperplane based on learning from dataset. There are kinds of kernels in SVM, such as Gaussian radial basis function (RBF), linear kernel, and so on. The most frequently used kernel is RBF.
Logistic Regression
The logistic regression (LR) (Hosmer and Lemeshow, 1989; Cheng et al., 2019) algorithm used widely in data mining, disease automatic diagnosis, economic prediction, and other fields is one of the most basic and simplest algorithms in machine learning. LR is a kind of a linear classifier which aims at the problem of linear separability. The main idea of using logistic regression to classify is to establish regression formula for classification boundary line according to the training dataset.
Results
Firstly, DFT and DWT are carried out on molecular fingerprint, respectively, and are evaluated with formula (1) to find the effective one from the two features. It is proved by experiments that applying DWT to extract the features of a drug are better than those of DFT, and then DWT is used to represent drugs. Secondly, an ANN model is established to extract features further, and the prediction performance of GBDT is compared with the different features generated by different layers through cross-validation. Thirdly, a variety of classifiers are applied in the experiments for performance comparison, and GBDT is selected as the default classifier for its good performance. Later, SMOTE algorithm is adopted to balance D92M. Finally, a novel model called BOW-GBDT is proposed and tested with the balance D92M along with the existing models through cross-validation and an independent test. According to the result, BOW-GBDT has a better generalization ability.
Effect of Different Feature Representations of Drugs
In a previous work, carrying out DFT or DWT on molecular fingerprint had been demonstrated to be an effective feature extraction method for drugs. However, there is no experimental comparison between DFT and DWT. In this section, 10-fold cross-validation is carried on D92M while representing drugs with DFT or DWT, respectively. The results about ROC curves are shown in Figure 5. It is clear that the AUC with a value of 0.890 and ROC of DWT is better than that of DFT (whose AUC value is 0.876). Therefore, we use DWT as the default method to extract features from drugs in this study.
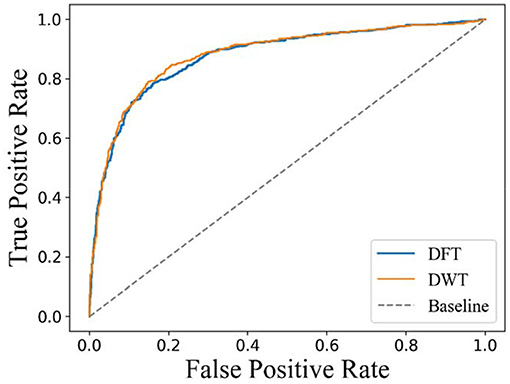
Figure 5. Receiver operating characteristic curves of 10-fold cross-validation on D92M.
Effect of Different Features Generated by ANN Models
The structure of ANN is very flexible. In this section, we would decide the number of hidden layers in the ANN model. To be simple, the number of units of hidden layer 1 is 242, and the next hidden layer has half the number of units compared with the previous hidden layer. There are two different structures of the ANN model in Figure 6. The left one has two hidden layers whose number of units are 242 and 121, respectively. The right one has three hidden layers whose number of units are 242, 121, and 60, respectively. In this paper, the ANN models are built and trained using Tensorflow, which is a popular Python software package. The hyperparameters including learning rate, epochs, and batch size of the two models are set as 0.01, 100, and 128, respectively. The activation function of the hidden layers and the output layers are LeakyReLU and Sigmoid separately.
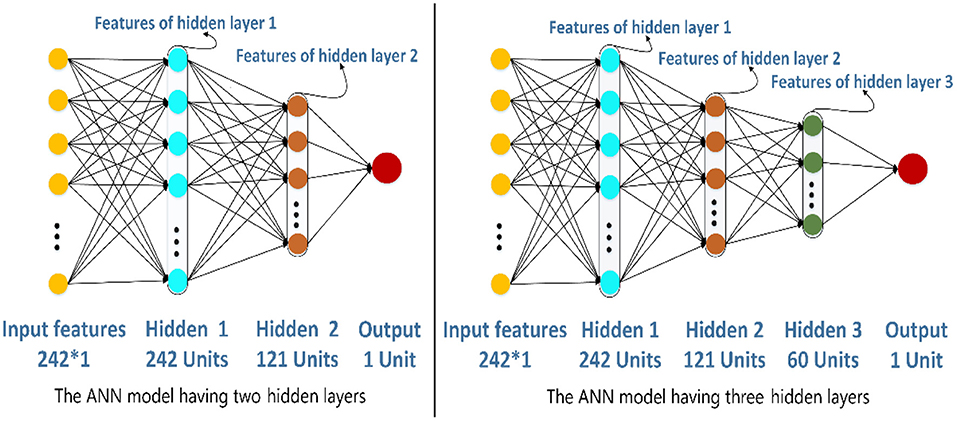
Figure 6. The different artificial neural network model.
According to the structures of the different ANN models, the features generated by different hidden layers would be extracted from the two models separately, and the results of the ROC curves are shown in Figure 7. From the figure on the left, we can see that the AUC (0.893) of the features generated by hidden layer 2 is bigger than the one generated by hidden layer 1 (0.869) in the ANN model having two hidden layers. The results in the figure on the right show that the AUC of hidden layer 2 is bigger than the one of hidden layer 3 and hidden layer 1 in the ANN model having three hidden layers. What is more, the AUC of hidden layer 2 of the two models is close to 0.893. Considering that the ANN model having two hidden layers is simpler than the one having three hidden layers, we adopt the ANN having two hidden layers in this research and the features generated by hidden layer 2 as the final features.
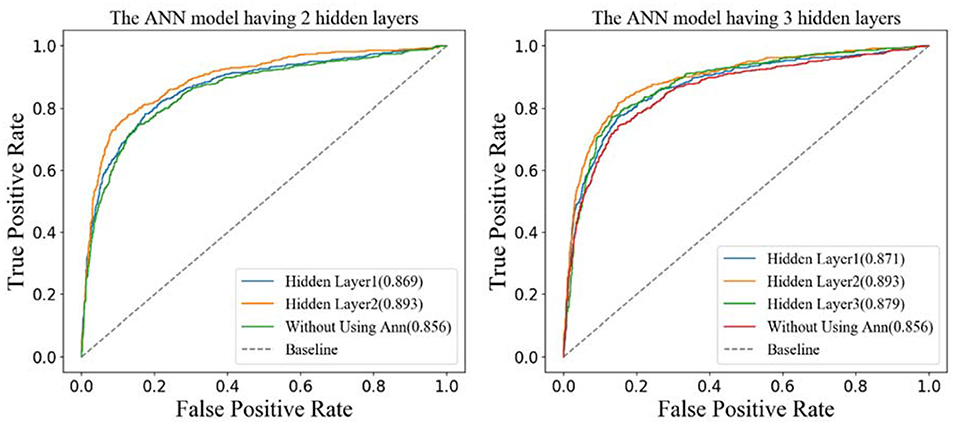
Figure 7. Receiver operating characteristic curves of 10-fold cross-validation on D92M.
Choose a Better Classifier
For a binary classification problem, the machine learning algorithm (Larrañaga et al., 2006) is very important to some extent. The knowledge learned by different algorithms from the same dataset may be very different, and the generalization ability is also different. In this section, we compare the performance of different algorithms by carrying out leave-one-out cross-validation on D92M. The algorithms that we adopt and the result values of Sn, Sp, Acc, Str, and MCC are listed in Table 2. Compared with the results of different machine learning algorithms, the Sn, Acc, Str, and MCC of GBDT gain most of good performance as marked with an italic font in the last line of Table 2. Therefore, we determine to adopt GBDT as the default algorithm to build prediction models.
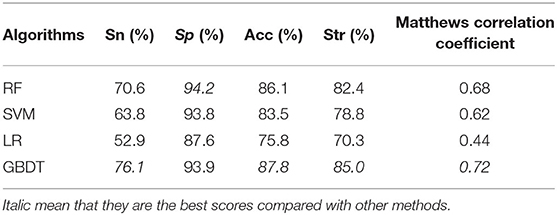
Table 2. The results of different algorithms.
The Effect of SMOTE Algorithm
The dataset D92M containing 635 interactive GPCR–drug pairs and 1,225 non-interactive pairs is an imbalance dataset. The previous work (Yamanishi et al., 2008; He et al., 2010; Xiao et al., 2013; Hu et al., 2016; Wang et al., 2020b) did not deal with the imbalanced problem of dataset. In this study, we use the SMOTE algorithm to deal with the imbalance dataset and get a new balance dataset. Then, the balance dataset and the imbalance dataset are input into GBDT over leave-one-out cross-validation, respectively. The results of Acc, MCC, Sn, Sp, and Str are listed in Table 3.
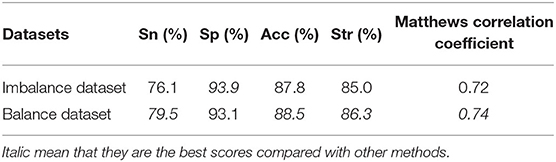
Table 3. The results of the model with the SMOTE algorithm or without.
As can be seen in Table 3, the Sn, Acc, Str, and MCC values increase by 3.4, 0.7, and 1.3% and 0.02, respectively. The results show that the SMOTE algorithm can improve the performance of GBDT. Therefore, the SMOTE algorithm is used to deal with the imbalance dataset D92M.
Comparison of Other Methods
In order to confirm the performance of our model called BOW-GBDT, we test them on D92M and Check390, respectively, and compare it with existing methods, such as IGPCR-Drug, OET-KNN, QuickRBF, and so on. The results of the different methods on D92M over leave-one-out cross-validation are shown in Table 4, along with those of other eight methods listed in Xiao et al. (2013). As shown in the table, the DWKNN has the biggest value of Sn, and the SP, Acc, Str, and MCC values of BOW-GBDT are higher than those of other methods. This result confirms the good performance of the proposed method.
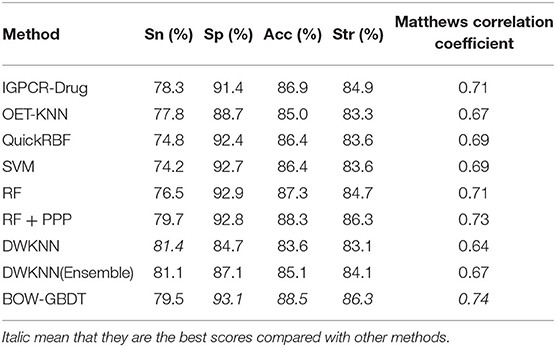
Table 4. Performance of different methods tested with leave-one-out cross-validation.
Though BOW-GBDT achieves a good result in leave-one-out cross-validation, the generalization ability is more important for a machine learning model. We use the SMOTE algorithm to balance the D92M and generate a new dataset. With the new dataset as training dataset and Check390 as the independent test, the results of the other eight methods mentioned in Xiao et al. (2013) are also listed in Table 5. From this table, we can notice that the proposed model BOW-GBDT has a better generalization ability. Like the result in Table 4, BOW-GBDT has the highest values of Sp, Acc, Str, and MCC besides Sn. Compared with other state-of-the-art methods, the Acc of BOW-GBDT is 3.9% higher than the second one, the Sp is 5.8% higher than the second one, the Str is 2.1% higher than the second one, and the MCC is 0.07 higher than the second one. This result demonstrates that BOW-GBDT is a good model for predicting the GPCR–drug interaction.

Table 5. The results of different methods over independent test dataset Check390.
Conclusions
In this paper, the authors proposed a new method for predicting the interaction between GPCR and drug. In terms of representation GPCR, a BOW model was used to extract features from GPCR sequences. For the representation of drugs, the DWT method was applied for the reason that DWT can have a better prediction performance than DFT. The highlight of this study is that the ANN model was introduced to extract more effective features by automatically learning from the original features. What is more, a popular and powerful oversampling algorithm called SMOTE was applied to balance the training dataset. According to the results on the D92M over leave-one-out cross-validation and the testing dataset Check390, the proposed method has a better generalization ability. By the way, the structure of the ANN model is very flexible, and it is hard to find the best model containing how many hidden layers and the units in every layer. Actually, this method gets a good performance for predicting the GPCR–drug pair interaction by using a simple ANN model containing two hidden layers, yet there is still room to be improved in the future.
GPCRs are involved in many physiological processes such as photosensitivity, regulation of the immune system, regulation of the autonomic nervous system, regulation of behavior and emotion, and so on. They are the most import drug targets in modern medicine. The research on identifying the interaction between GPCRs and drugs is of great importance for the discovery of GPCR-related drugs. In order to solve the problem of high cost and low efficiency of high-throughput experimental methods, we develop a model called BOW-GBDT based on GBDT algorithm for predicting the interaction between GPCR and drug. The proposed framework of BOW-GBDT can be summarized as shown in Figure 8. The boxes marked with a green border show the representation process for GPCR and tawny for drug. Although BOW-GBDT has better performance as compared to other methods when it is tested in dataset Check390, it should still be tested in other datasets to evaluate it further.
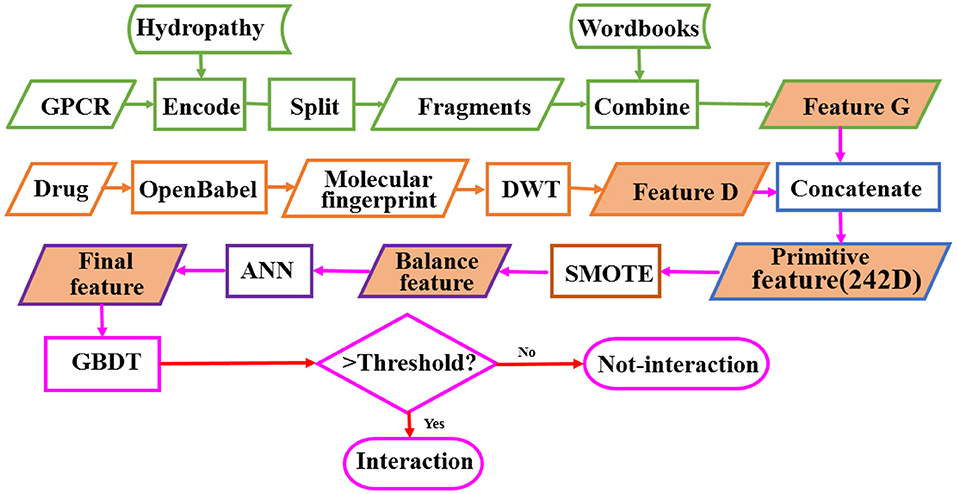
Figure 8. The framework of BOW-GBDT.
Data Availability Statement
The original contributions presented in the study are included in the article/supplementary material, further inquiries can be directed to the corresponding author/s.
Author Contributions
WQ conceived and designed the experiments. ZL performed the extraction of features, model construction, model training, and evaluation. YH and JJ analyzed the data and implemented the classifiers. ZL and WQ drafted the manuscript. XX supervised this project and revised the manuscript. All authors read and approved the final manuscript.
Funding
This work was supported by the grants from the National Natural Science Foundation of China (Nos. 31760315, 31860312, 62062043, and 61761023), the Natural Science Foundation of Jiangxi Province, China (Nos. 20202BAB202007 and 20171ACB20023), the Department of Education of Jiangxi Province (GJJ180703 and GJJ160866), and the International Cooperation Project of the Ministry of Science and Technology, China (No. 2018-3-3).
Conflict of Interest
The authors declare that the research was conducted in the absence of any commercial or financial relationships that could be construed as a potential conflict of interest.
References
Agrawal, N. J., Helk, B., and Trout, B. L. (2016). A computational tool to predict the evolutionarily conserved protein-protein interaction hot-spot residues from the structure of the unbound protein. FEBS Lett. 588, 326–333. doi: 10.1016/j.febslet.2013.11.004
Alberts, B., Johnson, A., Lewis, J., Raff, M., Roberts, K., and Walter, P. (2003). Molecular biology of the cell (4th ed.). Cell 31, 212–214. doi: 10.1002/bmb.2003.494031049999
Alexander, S. P., Mathie, A., and Peters, J. A. (2011). Guide to Receptors and Channels (GRAC), 5th edition. Br. J. Pharmacol. 164(Suppl.1), S1–324. doi: 10.1111/j.1476-5381.2011.01649_1.x
Arif, M., Hayat, M., and Jan, Z. (2018). iMem-2LSAAC: A two-level model for discrimination of membrane proteins and their types by extending the notion of SAAC into chou's pseudo amino acid composition. J. Theor. Biol. 442, 11–21. doi: 10.1016/j.jtbi.2018.01.008
Blagus, R., and Lusa, L. (2013). SMOTE for high-dimensional class-imbalanced data. BMC Bioinformatics 14:106. doi: 10.1186/1471-2105-14-106
Breiman, L., Friedman, J. H., Olshen, R. A., and Stone, C. J. (1984). Classification and Regression Trees, Wadsworth International Group. Belmont, CA.
Chao, L., Wei, L., and Zou, Q. (2019). SecProMTB: a SVM-based classifier for secretory proteins of Mycobacterium tuberculosis with imbalanced data set. Proteomics 19:e1900007. doi: 10.1002/pmic.201900007
Chawla, N. V., Bowyer, K. W., Hall, L. O., and Kegelmeyer, W. P. (2002). SMOTE: synthetic minority over-sampling technique. J. Artificial Intelligence Res. 16, 321–357. doi: 10.1613/jair.953
Cheng, L. (2019). Computational and biological methods for gene therapy. Curr. Gene Therapy 19, 210–210. doi: 10.2174/156652321904191022113307
Cheng, L., and Hu, Y. (2018). Human disease system biology. Curr. Gene Ther. 18, 255–256. doi: 10.2174/1566523218666181010101114
Cheng, L., Zhao, H., Wang, P., Zhou, W., Luo, M., Li, T., et al. (2019). Computational methods for identifying similar diseases. Mol. Ther. Nucl. Acids 18, 590–604. doi: 10.1016/j.omtn.2019.09.019
Dudani, S. A. (1976). The distance-weighted k-nearest-neighbor rule. IEEE Trans. Syst. Man Cybernet. 6, 325–327. doi: 10.1109/TSMC.1976.5408784
Eckert, H., and Bajorath, J. (2007). Molecular similarity analysis in virtual screening: foundations, limitations and novel approaches. Drug Discov. Today 12, 225–233. doi: 10.1016/j.drudis.2007.01.011
Friedman, J. H. (2001). Greedy function approximation: a gradient boosting machine. Annal. Statist. 29, 1189–1232. doi: 10.1214/aos/1013203451
Gunther, S., Kuhn, M., Dunkel, M., Campillos, M., Senger, C., Petsalaki, E., et al. (2008). SuperTarget and Matador: resources for exploring drug-target relationships. Nucl. Acids Res. 36, D919–D922. doi: 10.1093/nar/gkm862
Haar, A. (1911). Zur Theorie der orthogonalen Funktionensysteme. Mathematische Annalen 71, 38–53. doi: 10.1007/BF01456927
Hartigan, J. A., and Wong, M. A. (1979). Algorithm AS 136: a K-means clustering algorithm. J. Royal Statist. Soc. 28, 100–108. doi: 10.2307/2346830
He, Z., Zhang, J., Shi, X. H., Hu, L. L., Kong, X., Cai, Y. D., et al. (2010). Predicting drug-target interaction networks based on functional groups and biological features. PLoS ONE 5:e9603. doi: 10.1371/journal.pone.0009603
Hinton, G. E. (2007). Learning multiple layers of representation. Trends Cogn. Sci. 11, 428–434. doi: 10.1016/j.tics.2007.09.004
Hinton, G. E., and Salakhutdinov, R. R. (2006). Reducing the dimensionality of data with neural networks. Science 313, 504–507. doi: 10.1126/science.1127647
Hu, J., Li, Y., Yang, J. Y., Shen, H. B., and Yu, D. J. (2016). GPCR-drug interactions prediction using random forest with drug-association-matrix-based post-processing procedure. Comput. Biol. Chem. 60, 59–71. doi: 10.1016/j.compbiolchem.2015.11.007
Jackson, L. B. (1996). Discrete Fourier Transform. New York, NY: Springer. doi: 10.1007/978-1-4757-2458-5_7
Jacoby, E., Bouhelal, R., Gerspacher, M., and Seuwen, K. (2006). The 7 TM G-protein-coupled receptor target family. ChemMedChem 1, 761–782. doi: 10.1002/cmdc.200600134
Kanehisa, M., Goto, S., Hattori, M., Aoki-Kinoshita, K. F., Itoh, M., Kawashima, S., et al. (2006). From genomics to chemical genomics: new developments in KEGG. Nucl. Acids Res. 34, D354–D357. doi: 10.1093/nar/gkj102
Kanungo, T., Mount, D. M., Netanyahu, N. S., Piatko, C. D., Silverman, R., and Wu, A. Y. (2002). An efficient k-means clustering algorithm: analysis and implementation. IEEE Trans. Pattern Anal. Machine Intelligence 24, 881–892. doi: 10.1109/TPAMI.2002.1017616
Kawashima, S., and Kanehisa, M. (2000). AAindex: amino acid index database. Nucl. Acids Res. 28:374. doi: 10.1093/nar/28.1.374
Larrañaga, P., Calvo, B., Santana, R., Bielza, C., and Robles, V. (2006). Machine learning in bioinformatics. Briefings Bioinform. 7, 86–112. doi: 10.1093/bib/bbk007
Li, L., Koh, C. C., Reker, D., Brown, J. B., and Wei, D. Q. (2019). Predicting protein-ligand interactions based on bow-pharmacological space and Bayesian additive regression trees. Sci. Rep. 9:7703. doi: 10.1038/s41598-019-43125-6
Lv, Z. B., Wang, D. H., Ding, H., Zhong, B. N., and Xu, L. (2020a). Escherichia coli DNA N-4-methycytosine site prediction accuracy improved by light gradient boosting machine feature selection technology. IEEE Access 8, 14851–14859. doi: 10.1109/ACCESS.2020.2966576
Lv, Z. B., Zhang, J., Ding, H., and Zou, Q. (2020b). RF-PseU: a random forest predictor for RNA pseudouridine sites. Front. Bioeng. Biotechnol. 8:10. doi: 10.3389/fbioe.2020.00134
Mei, J., and Zhao, J. (2018). Analysis and prediction of presynaptic and postsynaptic neurotoxins by Chou's general pseudo amino acid composition and motif features. J. Theor. Biol. 447, 147–153. doi: 10.1016/j.jtbi.2018.03.034
O'Boyle, N. M., Banck, M., James, C. A., Morley, C., Vandermeersch, T., and Hutchison, G. R. (2011). Open Babel: an open chemical toolbox. J. Cheminform. 3:33. doi: 10.1186/1758-2946-3-33
Rousseeuw, P. J. (1987). Silhouettes: a graphical aid to the interpretation and validation of cluster analysis. Comput. Appl. Math. 20, 53–65. doi: 10.1016/0377-0427(87)90125-7
Ru, X., Wang, L., Li, L., Ding, H., Ye, X., and Zou, Q. (2020). Exploration of the correlation between GPCRs and drugs based on a learning to rank algorithm. Comput. Biol. Med. 119:103660. doi: 10.1016/j.compbiomed.2020.103660
Ru, X. Q., Li, L. H., and Zou, Q. (2019). Incorporating distance-based top-n-gram and random forest to identify electron transport proteins. J. Proteome Res. 18, 2931–2939. doi: 10.1021/acs.jproteome.9b00250
Rumelhart, D. E., Hinton, G. E., and Williams, R. J. (1986). Learning representations by back-propagating errors. Nature 323, 533–536. doi: 10.1038/323533a0
Sahin, E. K. (2020). Assessing the predictive capability of ensemble tree methods for landslide susceptibility mapping using XGBoost, gradient boosting machine, and random forest. SN Appl. Sci. 2:1308. doi: 10.1007/s42452-020-3060-1
Song, J. N., Li, C., Zheng, C., Revote, J., Zhang, Z. D., and Webb, G. I. (2017). MetalExplorer, a bioinformatics tool for the improved prediction of eight types of metal-binding sites using a random forest algorithm with two-step feature selection. Curr. Bioinform. 12, 480–489. doi: 10.2174/2468422806666160618091522
Vapnik, V. N. (1995). The Nature of Statistical Learning Theory. New York, NY: Springer. doi: 10.1007/978-1-4757-2440-0
Wan, S., Duan, Y., and Zou, Q. (2017). HPSLPred: an ensemble multi-label classifier for human protein subcellular location prediction with imbalanced source. Proteomics 17, 17–18. doi: 10.1002/pmic.201700262
Wang, J., Wang, H., Wang, X., and Chang, H. (2020a). Predicting drug-target interactions via FM-DNN learning. Curr. Bioinform. 15, 68–76. doi: 10.2174/1574893614666190227160538
Wang, P., Huang, X., Qiu, W., and Xiao, X. (2020b). Identifying GPCR-drug interaction based on wordbook learning from sequences. BMC Bioinform. 21:150. doi: 10.1186/s12859-020-3488-8
Wang, X., Yu, B., Ma, A., Chen, C., Liu, B., and Ma, Q. (2019). Protein-protein interaction sites prediction by ensemble random forests with synthetic minority oversampling technique. Bioinformatics 35, 2395–2402. doi: 10.1093/bioinformatics/bty995
Wishart, D. S., Knox, C., Guo, A. C., Cheng, D., Shrivastava, S., Tzur, D., et al. (2008). DrugBank: a knowledgebase for drugs, drug actions and drug targets. Nucl. Acids Res. 36, D901-D906. doi: 10.1093/nar/gkm958
Xiao, X., Min, J.-L., Wang, P., and Chou, K.-C. (2013). iGPCR-Drug: a web server for predicting interaction between GPCRs and drugs in cellular networking. PLoS ONE 8:e72234. doi: 10.1371/journal.pone.0072234
Xu, L., Liang, G. M., Liao, C. R., Chen, G. D., and Chang, C. C. (2019). k-Skip-n-Gram-RF: a random forest based method for Alzheimer's disease protein identification. Front. Genet. 10:7. doi: 10.3389/fgene.2019.00033
Yamanishi, Y., Araki, M., Gutteridge, A., Honda, W., and Kanehisa, M. (2008). Prediction of drug-target interaction networks from the integration of chemical and genomic spaces. Bioinformatics 24, i232–240. doi: 10.1093/bioinformatics/btn162
Zeng, X. X., Wang, W., Deng, G. S., Bing, J. X., and Zou, Q. (2019). Prediction of potential disease-associated MicroRNAs by using neural networks. Mol. Therapy-Nucl. Acids 16, 566–575. doi: 10.1016/j.omtn.2019.04.010
Zhang, R., and Xie, X. (2012). Tools for GPCR drug discovery. Acta Pharmacol. Sin 33, 372–384. doi: 10.1038/aps.2011.173
Zhao, T., Hu, Y., and Cheng, L. (2020a). Deep-DRM: a computational method for identifying disease-related metabolites based on graph deep learning approaches. Briefings Bioinform 10:bbaa212. doi: 10.1093/bib/bbaa212
Zhao, T., Hu, Y., Peng, J., and Cheng, L. (2020b). DeepLGP: a novel deep learning method for prioritizing lncRNA target genes. Bioinformatics 36, 4466–4472. doi: 10.1093/bioinformatics/btaa428
Keywords: GPCR-drug interaction, bag-of-words, weighted silhouette coefficient, discrete wavelet transform, artificial neural network
Citation: Qiu W, Lv Z, Hong Y, Jia J and Xiao X (2021) BOW-GBDT: A GBDT Classifier Combining With Artificial Neural Network for Identifying GPCR–Drug Interaction Based on Wordbook Learning From Sequences. Front. Cell Dev. Biol. 8:623858. doi: 10.3389/fcell.2020.623858
Received: 30 October 2020; Accepted: 15 December 2020;
Published: 01 February 2021.
Edited by:
Liang Cheng, Harbin Medical University, ChinaReviewed by:
Yijie Ding, Suzhou University of Science and Technology, ChinaXiaoqi Zheng, Shanghai Normal University, China
Copyright © 2021 Qiu, Lv, Hong, Jia and Xiao. This is an open-access article distributed under the terms of the Creative Commons Attribution License (CC BY). The use, distribution or reproduction in other forums is permitted, provided the original author(s) and the copyright owner(s) are credited and that the original publication in this journal is cited, in accordance with accepted academic practice. No use, distribution or reproduction is permitted which does not comply with these terms.
*Correspondence: Wangren Qiu, cWl1b25lQDE2My5jb20=; Xuan Xiao, amR6eGlhb3h1YW5AMTYzLmNvbQ==