 Ting Liu
 Jia-Mao Chen1
 Dan Zhang
 Qian Zhang
 Bowen Peng
 Lei Xu
 Hua Tang
- 1School of Basic Medical Sciences, Southwest Medical University, Luzhou, China
- 2Center for Informational Biology, University of Electronic Science and Technology of China, Chengdu, China
- 3Division of international Cooperation, Health Commission of Sichuan Province, Chengdu, China
- 4School of Electronic and Communication Engineering, Shenzhen Polytechnic, Shenzhen, China
- 5Central Nervous System Drug Key Laboratory of Sichuan Province, Luzhou, China
Apolipoprotein is a group of plasma proteins that are associated with a variety of diseases, such as hyperlipidemia, atherosclerosis, Alzheimer’s disease, and diabetes. In order to investigate the function of apolipoproteins and to develop effective targets for related diseases, it is necessary to accurately identify and classify apolipoproteins. Although it is possible to identify apolipoproteins accurately through biochemical experiments, they are expensive and time-consuming. This work aims to establish a high-efficiency and high-accuracy prediction model for recognition of apolipoproteins and their subfamilies. We firstly constructed a high-quality benchmark dataset including 270 apolipoproteins and 535 non-apolipoproteins. Based on the dataset, pseudo-amino acid composition (PseAAC) and composition of k-spaced amino acid pairs (CKSAAP) were used as input vectors. To improve the prediction accuracy and eliminate redundant information, analysis of variance (ANOVA) was used to rank the features. And the incremental feature selection was utilized to obtain the best feature subset. Support vector machine (SVM) was proposed to construct the classification model, which could produce the accuracy of 97.27%, sensitivity of 96.30%, and specificity of 97.76% for discriminating apolipoprotein from non-apolipoprotein in 10-fold cross-validation. In addition, the same process was repeated to generate a new model for predicting apolipoprotein subfamilies. The new model could achieve an overall accuracy of 95.93% in 10-fold cross-validation. According to our proposed model, a convenient webserver called ApoPred was established, which can be freely accessed at http://tang-biolab.com/server/ApoPred/service.html. We expect that this work will contribute to apolipoprotein function research and drug development in relevant diseases.
Introduction
Apolipoprotein (Apo), a protein component of plasma lipoprotein, can bind and transport blood lipids to various tissues of the body for metabolism and utilization. It is mainly synthesized in the liver and partly in the small intestine (Yiu et al., 2020). A large number of studies have found that apolipoprotein gene mutation, the formation of different allelic polymorphisms, and further the generation of different phenotypes of apolipoprotein, can affect the metabolism and utilization of blood lipid, thereby triggering the occurrence and development of hyperlipidemia, atherosclerosis, cardiovascular and cerebrovascular diseases (Richardson et al., 2020). Millions of people around the world are suffering from apolipoprotein-related diseases (Cheng et al., 2019b; Fang et al., 2019).
Apolipoprotein includes A, B, C, D, E, L, F, H, M, N, and R subfamilies, each of which has different functions. Beyond the basic function of transporting lipids and stabilizing structure of lipoproteins, some types of apolipoprotein can activate lipoprotein metabolic enzymes and recognize receptors. Alterations in expression level, spatial structure, and function of apolipoproteins are closely related to a variety of diseases. For instance, the occurrence of hyperlipidemia and atherosclerosis is often accompanied by abnormal expression of high-density lipoprotein (HDL) and ApoA-I. Besides, the increased level of ApoB can raise the incidence of coronary heart disease. And ApoC-II can affect the uptake of triglyceride-rich lipoproteins by liver receptors, leading to the formation of human hypertriglyceridemia (Wolska et al., 2017). Moreover, ApoD is up-regulated in several human neurological disorders, such as Alzheimer’s disease (AD), Schizophrenia, Parkinson’s disease, and multiple sclerosis, and serves as an early diagnostic marker for a variety of cancers and neurological diseases (Martinez-Pinilla et al., 2015). Low level of ApoE in the brain and cerebrospinal fluid is associated with Alzheimer’s disease and other neurodegenerative diseases, as well as the early stage of many eye diseases (Mahley, 2016). In addition, ApoH participates in the coagulation process, and curbs ADP-mediated platelet aggregation by regulating adenylate cyclase activity; as a plasma inhibitory factor, it suppresses the activation of intrinsic coagulation pathway. Moreover, ApoM is a novel subtype of apolipoprotein discovered by Xu and Dahlback (1999). Studies suggested that ApoM takes a role in the antiatherogenic function of HDL through multiple pathways such as lipid metabolism, immune regulation, and anti-inflammatory effect (Arkensteijn et al., 2013). In patients with diabetes, the ApoM level is significantly reduced, and the rescue of ApoM level can decrease blood sugar level, increases insulin secretion, and improves insulin resistance, thereby serving as a predictor of the development of diabetes (Nojiri et al., 2014). Thus, correctly identify apolipoproteins and their subfamilies could provide important clues for understanding their function and roles in various of diseases.
Due to its biological function and association with multifarious diseases, apolipoprotein has gained increasingly more attention by researchers. Although more than 600 annotated apolipoproteins can be retrieved from the UniProt database, over 40,000 potential apolipoproteins are not annotated. However, identifying apolipoproteins in the vast amounts of data by biochemical assays will be a time-consuming and expensive task. Therefore, the research of apolipoprotein from the perspective of bioinformatics, with the help of a variety of statistical means and kinetic theory, can effectively narrow the target research scope.
In recent years, sequence alignment analysis has become the main bioinformatical study of apolipoprotein, which can reveal the evolution mode of apolipoprotein and predict the possible functional domains (Seda and Sedova, 2003; Weinberg et al., 2003; Toledo et al., 2004; Krisko and Etchebest, 2007; Deng et al., 2015). In 2000, Frank and Marcel (2000) analyzed the amino acid sequence composition and physicochemical properties of ApoA-I in 12 species. They found that the n-terminal of ApoA-I is highly conservative, while the c-terminal and the middle of the sequence display remarkable variation. Structural analysis suggested that the C-terminal is critical for lipid binding. Subsequently, Kiss et al. (2001) studied the functional similarity of ApoA-I in humans and chickens, declaring the correlation between the spatial structures of ApoA-I and lipid binding. Then, Gangabadage et al. (2008) studied the nuclear magnetic three-dimensional structure and kinetic properties of ApoC-III and simulated the binding structure of this protein and lipids. A recent study using sequence and structural alignment showed that the structure of ApoC-III is conserved in mammals. Bashtovyy et al. (2011) conducted sequence comparison of ApoA-I from 31 animals and found that there are conservative salt bridges in the first 30 residues and many conservative functional domains, revealing the relationship between apolipoprotein structure and function. Besides, Bandarian et al. (2016) studied the sequence variation of the ApoA-II gene and the correlation between this protein and serum level of HDL cholesterol. However, all above studies based on sequence or structure comparison have limitations. When facing a new sequence without homologs, these sequence alignment-based methods will be invalid. To solve the problem, in 2016, we designed a machine learning-based model to identify apolipoproteins (Tang et al., 2016) by using g-gap dipeptide feature extraction algorithm and LibSVM classifier. Nevertheless, this model has its own vulnerabilities, which cannot predict the subfamilies of apolipoproteins and the benchmark dataset built in the model is not large enough.
To overcome the shortcomings mentioned above, we constructed a new benchmark dataset and developed a new model to distinguish apolipoproteins from non-apolipoproteins and further classified their subfamilies. Finally, based on the new model, we established a novel webserver called ApoPred, which can be freely accessible to all scholars. The whole process for the model construction was shown in Figure 1. This work can not only shed new light on the function of apolipoprotein, but also provide theoretical guidance for the further development of drug targets.
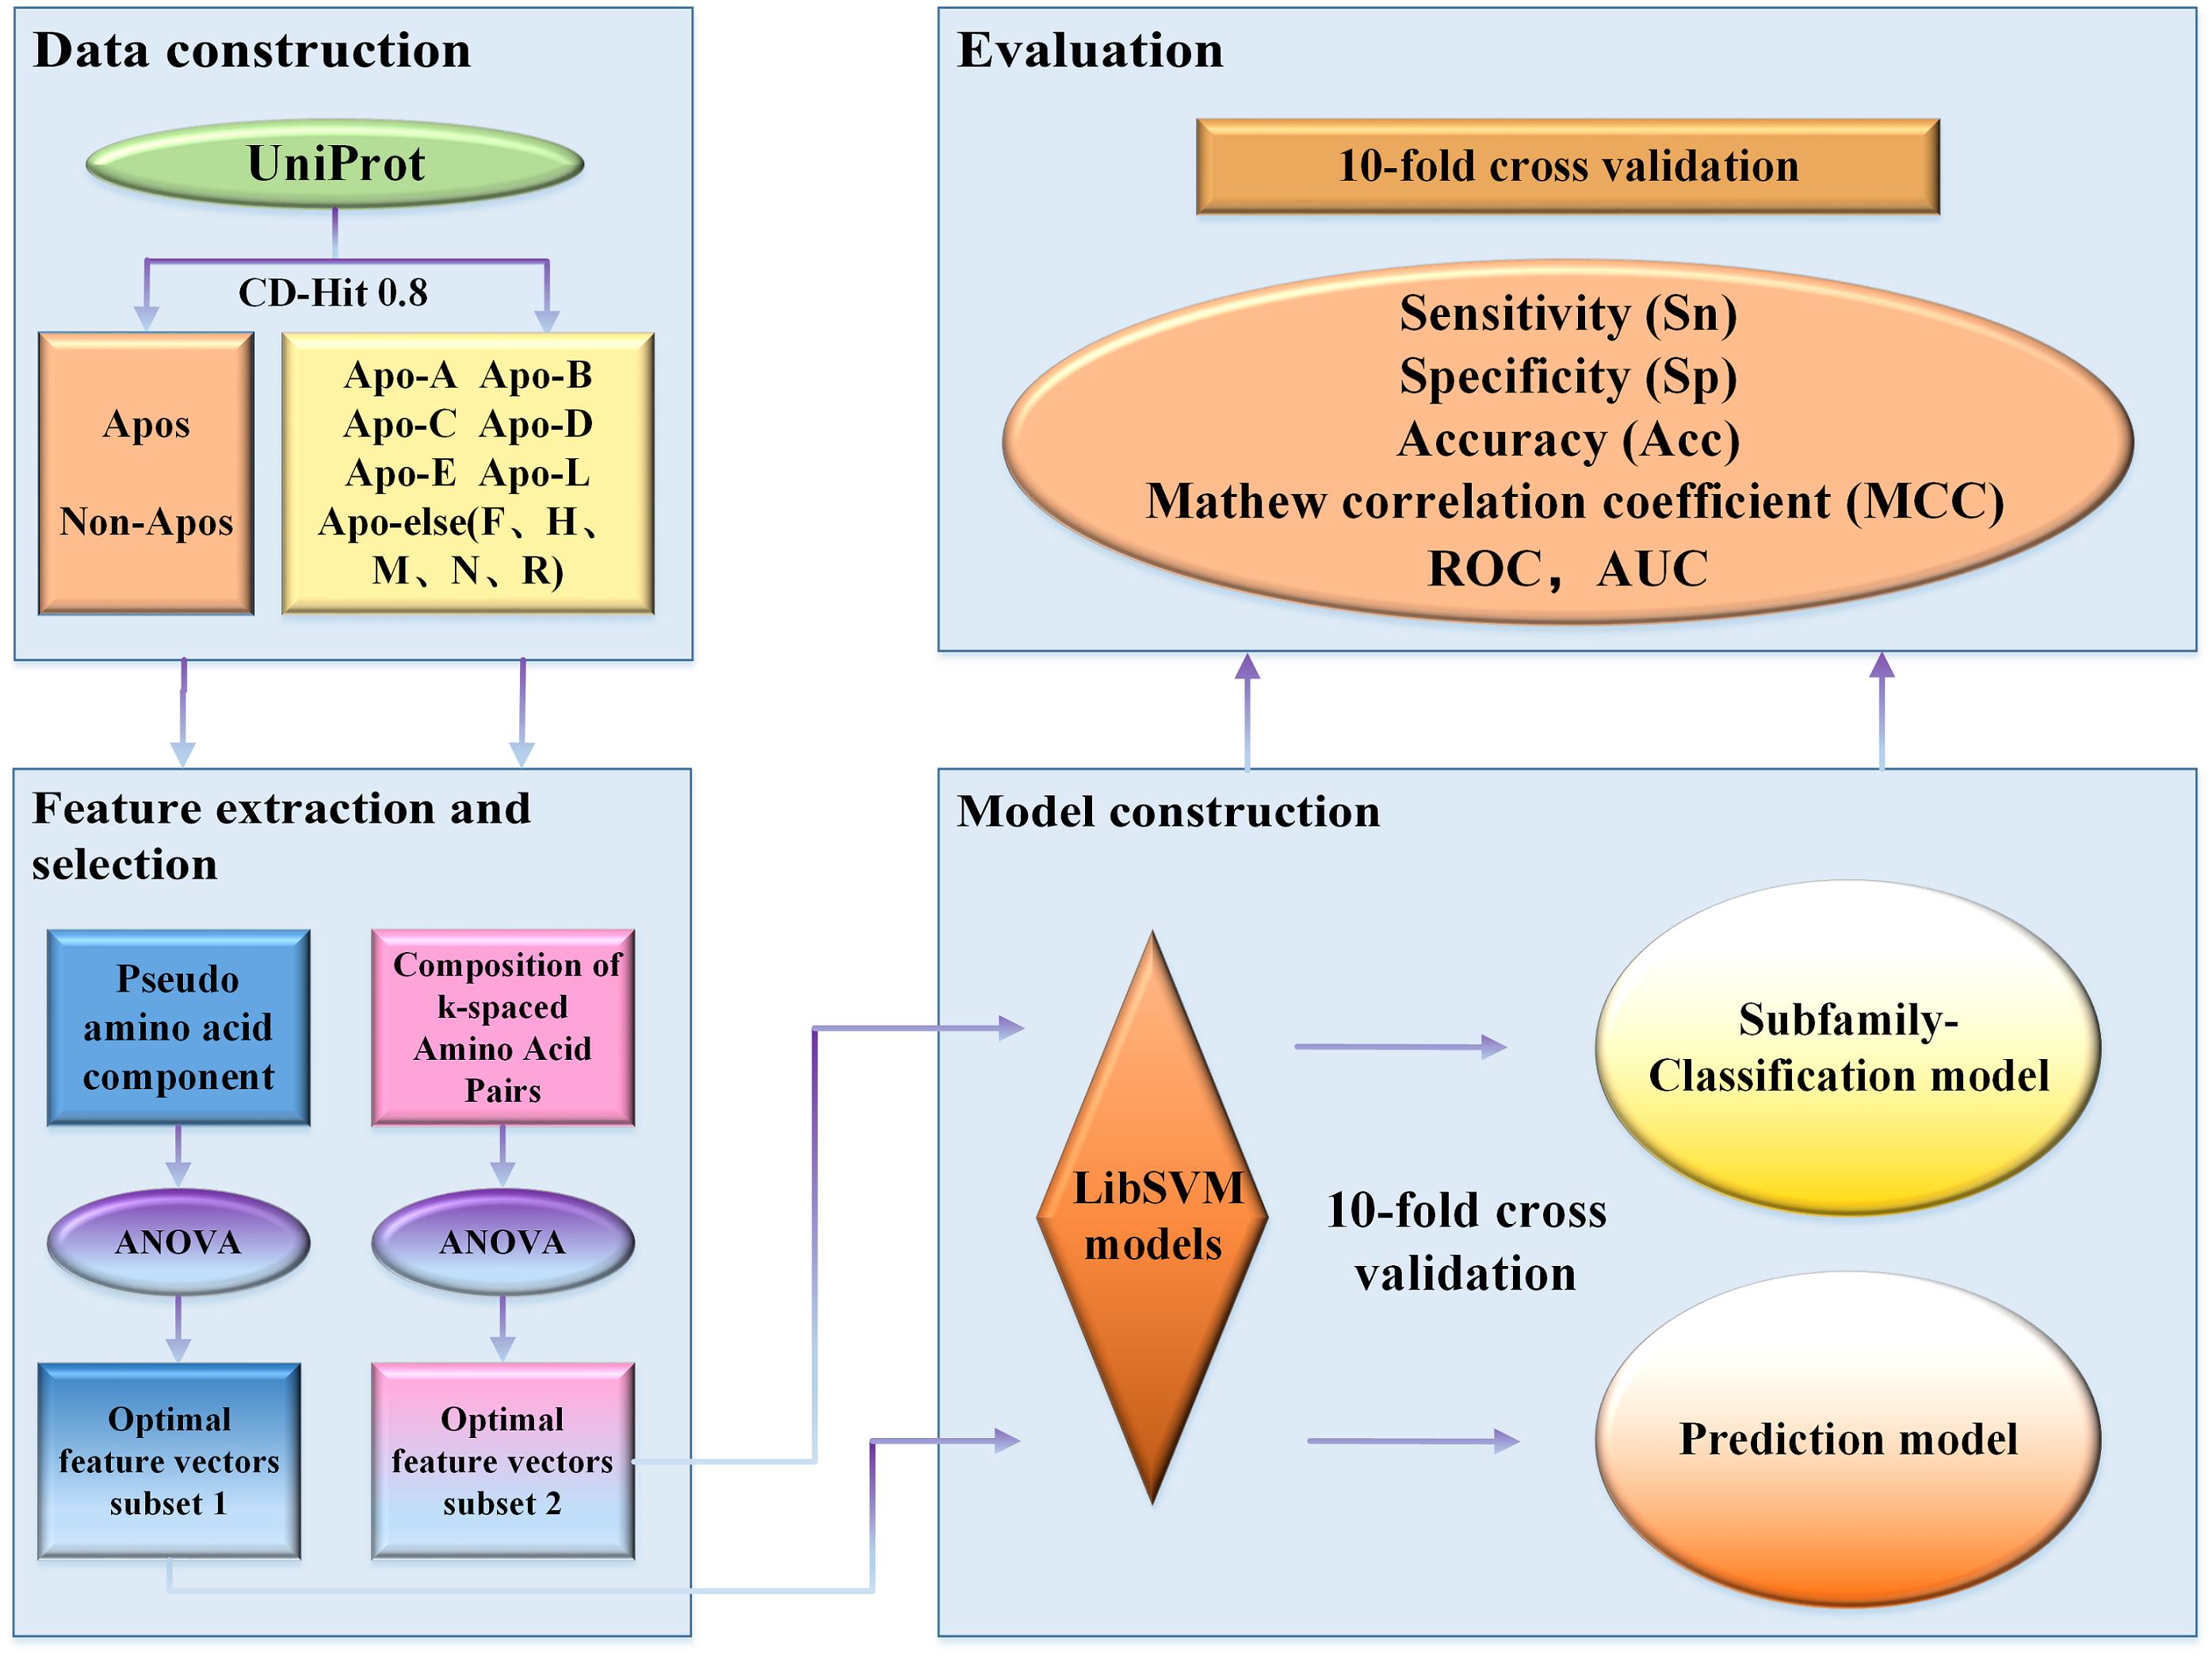
Figure 1. Flowchart of the proposed classification scheme.
Materials and Methods
Benchmark Dataset
Establishment of a high-quality dataset is the key of constructing a prediction model (Liang et al., 2017; Zhang et al., 2017; Cui et al., 2018; Hasan et al., 2019a, b). All of our apolipoprotein sequence data was downloaded from the UniProt online database. To obtain the reliable dataset, all sequences are processed in the following steps:
a. Select the apolipoprotein sequences that have been annotated in the Swiss-Prot database.
b. Remove the sequences which contain undesirable characters: such as “B,” “J,” “O,” “U,” “X,” and “Z.”
c. Remove redundant sequences by setting the cutoff value of CD-HIT at 0.8
For protein prediction, redundant sequences with similarity of higher than 40% are generally removed. Nevertheless, in this work, the cutoff value of CD-HIT was set at 0.8 in order to have enough sequences to train models. Thus, a total of 270 apolipoproteins remained. Due to the fact that the sample size of some subfamilies is too small to be compared statistically, we combined these subfamilies into a new class called Apoelse which contains 20 proteins. The details of apolipoprotein subfamilies were illustrated in Figure 2. Additionally, since apolipoproteins are mainly present in plasma, our negative samples (982 sequences) were selected from the non-apolipoproteins in plasma. To construct a reliable non-apolipoprotein dataset, we obtained 535 sequences with the sequence identity of less than 80%.
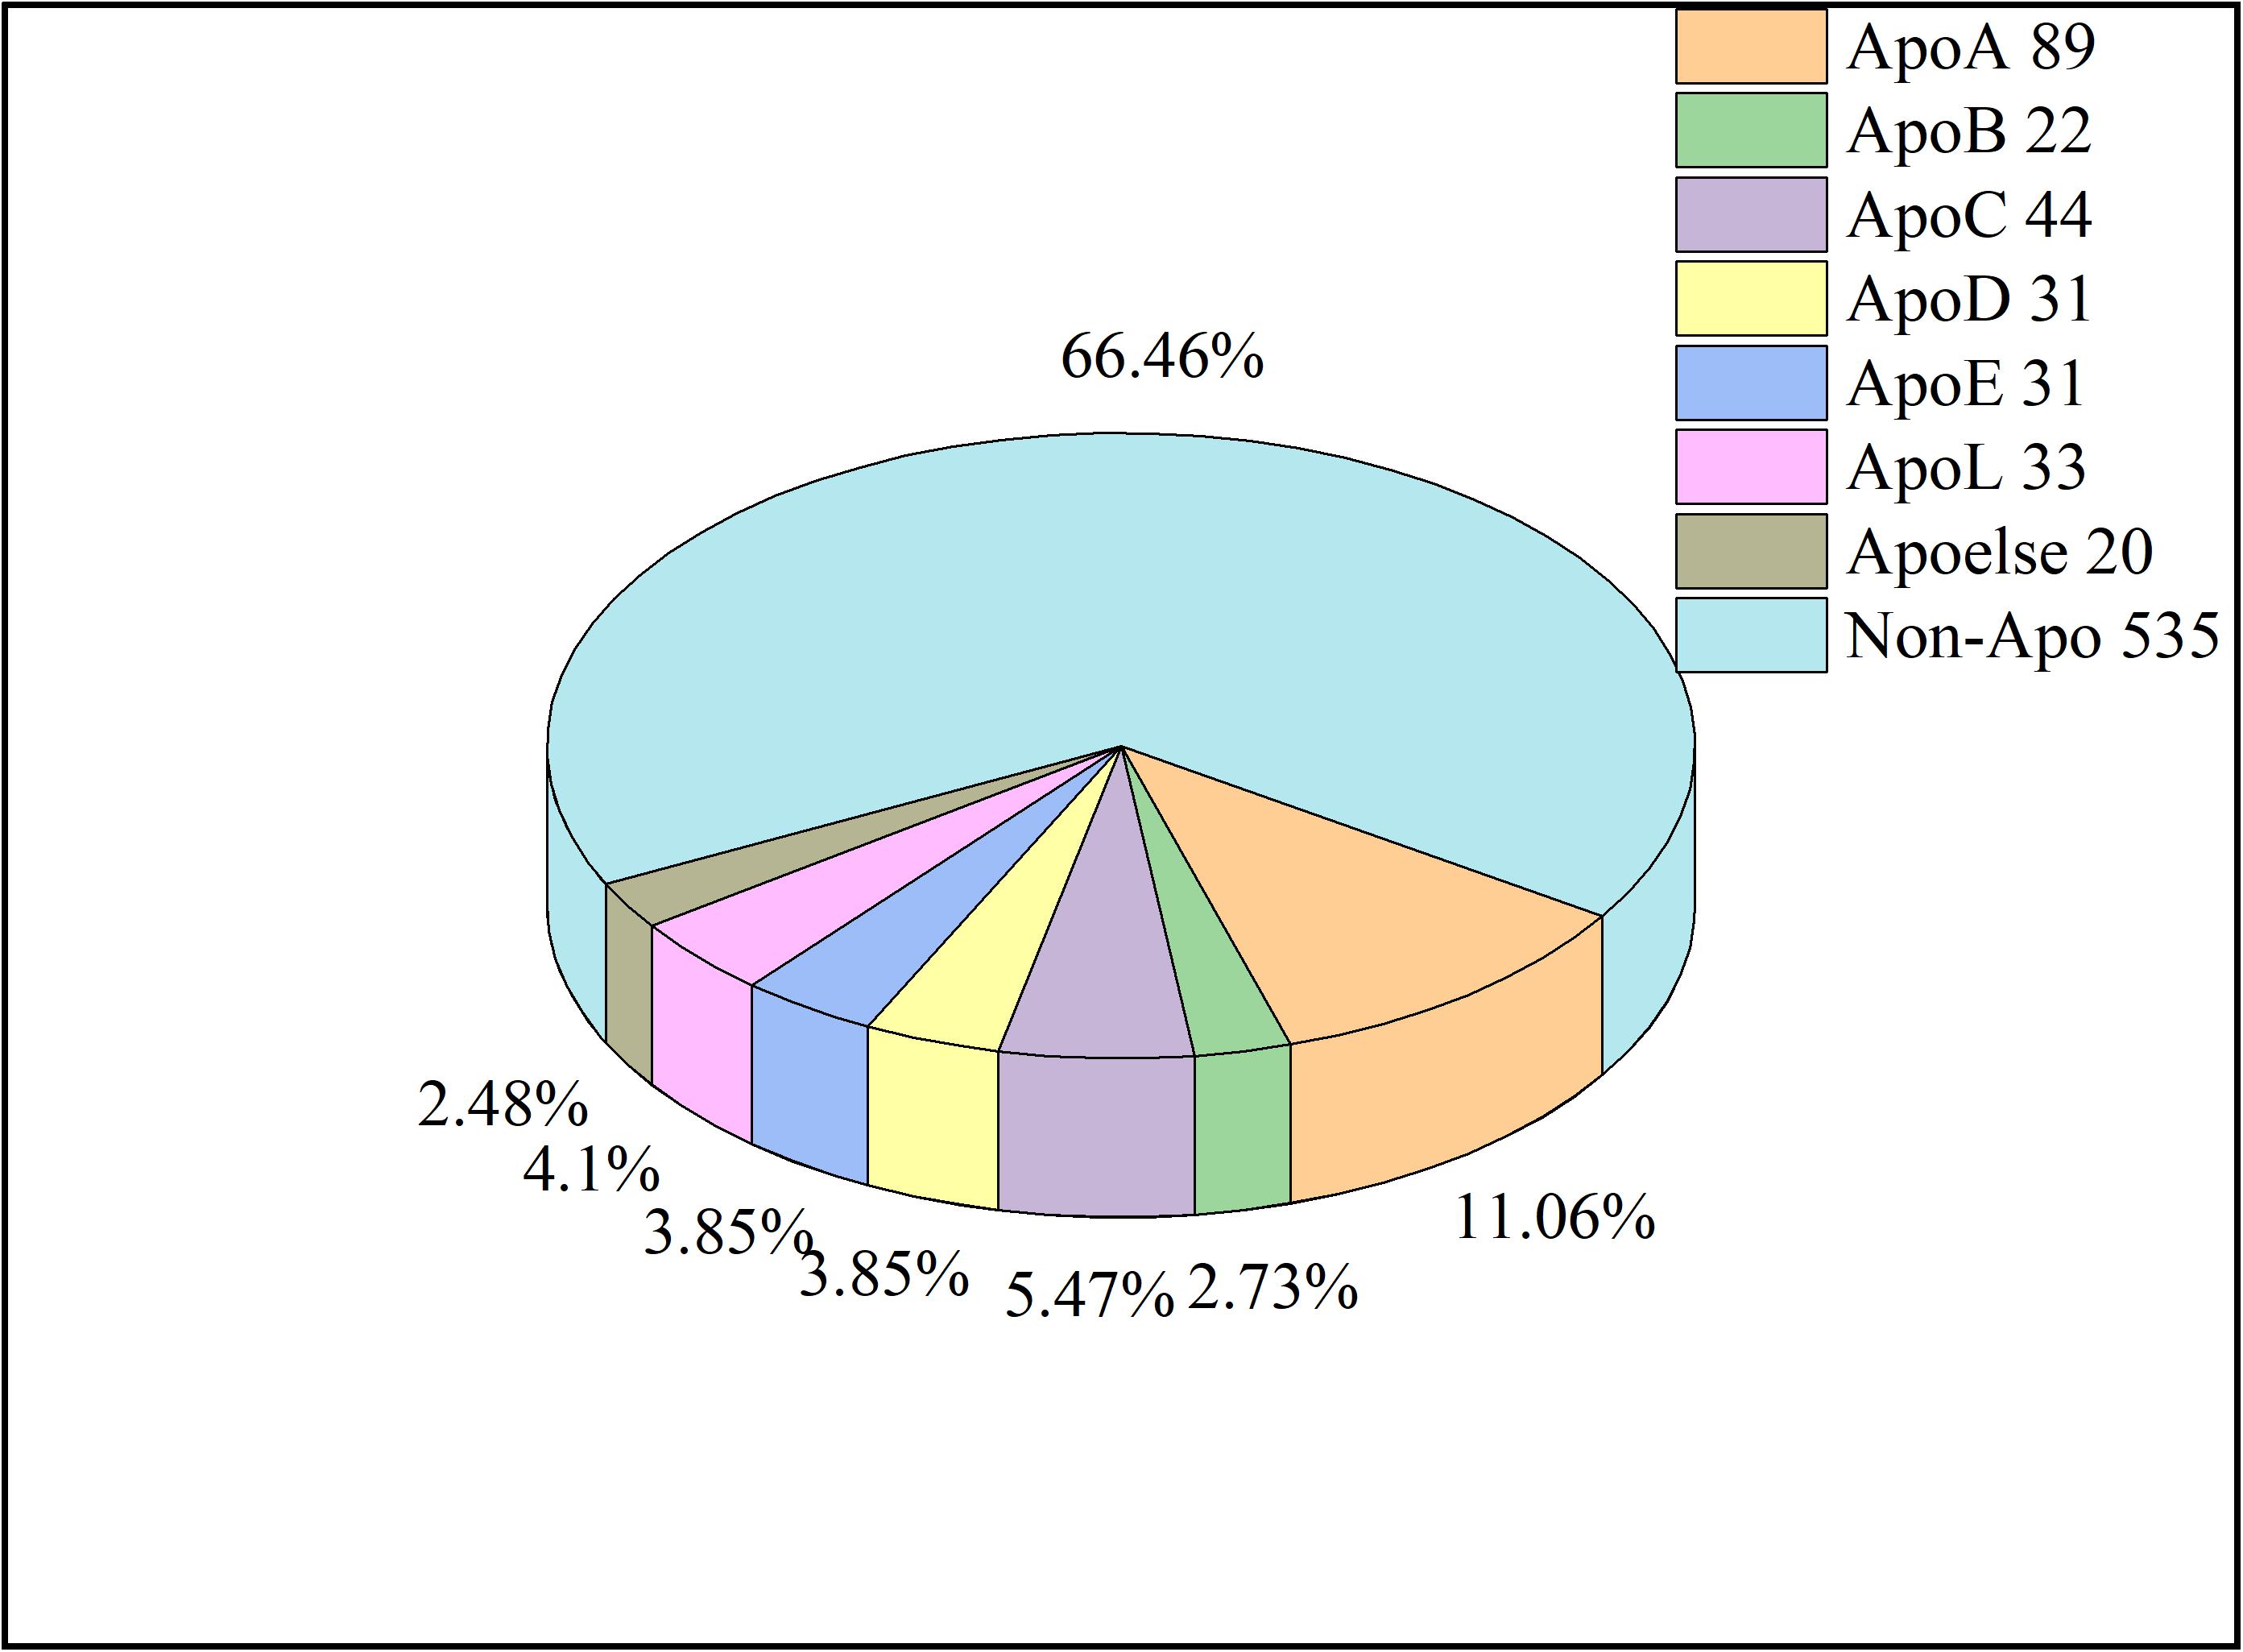
Figure 2. The pie chart of samples. The number after each Apo type indicates the sequence number. The Apoelse refers to the subfamilies including ApoF, ApoH, ApoM, ApoN, and ApoR.
Feature Expression
After constructing the dataset, we need to represent apolipoprotein sequence with a valid feature vector. It is obvious that the sequence, structure, and function are different between apolipoproteins and non-apolipoproteins, and among different apolipoprotein subfamilies. Generally, the differences are mainly manifested in long-term correlation, physicochemical properties, and amino acid composition. In this study, we tried a variety of feature extraction methods, and finally chose the optimal ones as the input vectors, namely pseudo-amino acid composition (PseAAC) and composition of k-spaced amino acid pairs (CKSAAP).
Pseudo-Amino Acid Composition (PseAAC)
PseAAC has been widely used in proteins prediction (Yang et al., 2016; Hasan et al., 2020b). It is defined by adding spatial structure and physicochemical properties to the amino acid frequency. The physicochemical properties considered in this work are hydrophobicity, hydrophilicity, mass, pK1 (alpha-COOH), pK2 (NH3), pI (at 25°C), rigidity, irreplaceability, and flexibility. Therefore, based on the formulation of Type II PseAAC, a protein sequence P with a total number of L amino acids can be described by a (20 + 9γ)-dimensional vector as follows:
where “T” is a symbol of transpose operator. A_i(i = 1, 2, …, 20) represents the frequency of occurrence of 20 amino acids in protein P. A_i(i = 20 + 1, …, 20 + nγ) are the first to γth tire correlation factors of protein sequence which can be calculated according to the equations in references. n depends on the number of physical and chemical properties we used.
Composition of k-Spaced Amino Acid Pairs (CKSAAP)
The CKSAAP has also been used to analyze protein function (Ju and Wang, 2020). It calculates the frequencies of amino acid pairs separated by any k residues (k = 0, 1, 2, …, 5. The default maximum value of k is 5). Given a k value from 0 to 5, the number of occurrences of each k-spaced amino acid pairs can be determined from target sequences. Taking k = 0 as an example, we can get 20 × 20 residual pairs of 0-interval (i.e., AA, AC, AD, YY.). Thus, a given protein P can be formulated by a 400-Dimension vector as follows:
where the NAA represents the occurrence number of 0-interval residue pair AA in the protein sequence, and the Ntotal means the total number of 0-interval residual pairs in the given protein sequence. The value of each descriptor represents the frequency of the corresponding residue pair in the sequence. Then, when k = (1,2, …, 5), a protein P can be formulated as:
where the NAAk denotes the occurrence number of k-interval residue pair AA in the protein sequence, and the Ntotalk stands for the total number of k-interval residual pairs in the given sequence. For k = 0, 1, 2, 3, 4, and 5, the values of Ntotalk are P – 1, P – 2, P – 3, P – 4, P – 5, and P – 6 for a protein of length P, respectively.
188-Dimensional Feature Vectors
188D extracts sequence features based on 20 amino acid compositions and eight physicochemical properties (Ao et al., 2020). These features encode the primary sequence with 188-dimensional vectors (Li et al., 2019). Thus, the 188D of a given protein P is calculated as:
The m_i is the frequency of 20 amino acids (in alphabetical order, ACDEFGHIKLMNPQRSTVWY) in the sequence. Then, the amino acids are classified into three groups according to each of the n(n = 1, 2, …, 8) physicochemical properties of proteins. For every single protein property, Ci is the frequency of occurrence of amino acids from the three groups respectively, yielding 3-dimension features; T describes the frequency of three types of dipeptides composed of two amino acids from different groups, which also generates 3-dimension features; D represents distribution of the three groups of amino acids at five specific points (first, 25%, 50%, 75%, and end in the sequence), through which the other 15-dimension features are extracted. In total, we obtain 20 + 8 × (3 + 3 + 15) = 188 dimensional features by this algorithm.
Dipeptide Composition (DPC)
The Dipeptide Composition is a commonly used algorithm for protein sequence description, giving 400 descriptors (Saravanan and Gautham, 2015; Manavalan et al., 2019a, b; Hasan et al., 2020a). It is defined as:
where Nrs is the number of dipeptides represented by amino acid types r and s, and the value of N stands for the length of a protein sequence.
Feature Selection
In order to obtain the optimal feature subset and eliminate redundant and irrelevant features, analysis of variance (ANOVA) feature selection technology was adopted in this work.
ANOVA generally performs well in feature selection (Ding and Li, 2015; Kwon et al., 2020). Based on its definition, the features can be ranked by the corresponding F-value, as shown below:
where the F(θ) denotes the total variance, and are the variances between groups and within a group, separately.
The detailed formula are given in
where xij is the observations of the jth sample in the ith group, k is the number of group, n_i is the sample size of each group. And here i = 1, 2, …, k.
To determine the optimal feature combination, we employed incremental feature selection (IFS) (Zhu et al., 2019), which adds features to the feature subset in succession, and then study the influence of these features on the predicting performance of the constructed machine learning model. By strictly following the above steps, the optimal feature subset can be finally obtained when the maximum accuracy appeared.
Model Construction by Support Vector Machine (SVM)
SVM is a supervised learning method which has been widely applied in statistical classification and regression analysis (Manavalan and Lee, 2017; Xu et al., 2018a, b; Basith et al., 2019; Lai et al., 2019; Manavalan et al., 2019c; Wang et al., 2019; Yang W. et al., 2019; Dao et al., 2020b). Proposed in 1964, SVM developed rapidly after 1990s and derived a series of improved and extended algorithms which have been performed in pattern recognition such as portrait recognition and text classification (Qin and He, 2005). SVM uses hinge loss function to calculate empirical risk and adds regularization terms in the solution system to optimize structural risk. Besides, SVM can build a hyperplane to carry out non-linear classification through kernel function (Bredesen and Rehmsmeier, 2019). Due to its good performance in non-linear classification, we employed SVM in this study. We adopted a tool of SVM, the LibSVM package, which can be obtained from: https://www.csie.ntu.edu.tw/~cjlin/libsvm. Grid search was used to optimize the parameters C and γ.
Performance Evaluation
Cross-validation is an objective method for evaluating the performance of predictors (Cheng and Hu, 2018; Cheng et al., 2019a; Tahir and Idris, 2020). In our study, 10-fold cross-validation was applied to assess our prediction model. Sensitivity (Sn), specificity (Sp), accuracy (Acc), and Mathew correlation coefficient (MCC) are commonly used to measure the performance of classifiers (Xu et al., 2018c, 2019; Boopathi et al., 2019; Huang et al., 2019; Liang et al., 2019; Stephenson et al., 2019; Yang H. et al., 2019; Basith et al., 2020; Dao et al., 2020a; Hasan et al., 2020c; Zhao et al., 2020), and can be defined as follows:
where TP and TN are the correctly predicted positive and negative samples, respectively; FP and FN are the falsely predicted positive and negative samples, respectively.
The Receiver Operating Characteristic (ROC) curve can intuitively represent the influence of any threshold on the generalization of the constructed prediction model (Wang et al., 2020). Generally, the closer the ROC curve is to the point of (0, 1), the higher the recall of the model is. Furthermore, the area under ROC curve (AUC) is the important numerical indicator of ROC curve, which ranges from 0 to 1. The performance of classifier is positively related to the value of AUC. Thus, we also used ROC curve and AUC to evaluate the model.
Results
The Accuracy for Apolipoproteins Prediction
We trained SVM with the different feature extraction strategies. And the best feature extraction method was selected to construct the final prediction model. In each feature extraction, feature selection was applied to achieve the optimal feature subset. In our research, a total of four different feature extraction strategies were examined. Results are recorded in Table 1.
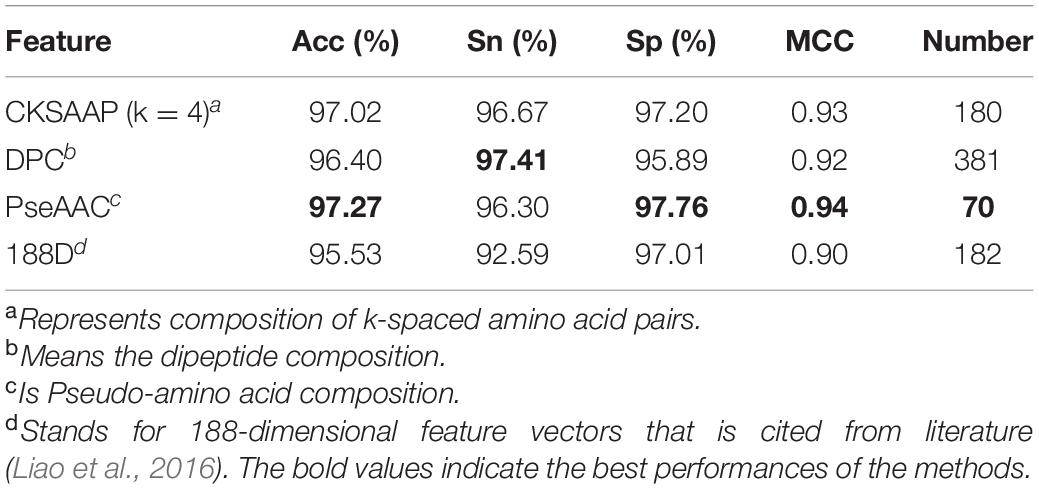
Table 1. The results of four feature extraction methods in prediction of apolipoprotein.
As shown in Table 1, the PseAAC achieved the highest Acc of 97.27% among four feature extraction methods. In addition, it also gained the best MCC of 0.94 and Sp of 97.76%. This suggests that apolipoprotein and non-apolipoprotein can be predicted satisfactorily according to the differences in their sequences.
To further evaluate the predictive performance of our models, we plotted the ROC curves in Figure 3. Obviously, PseAAC is the best one among the four features for apolipoprotein prediction because it could produce the AUC of 0.9957.
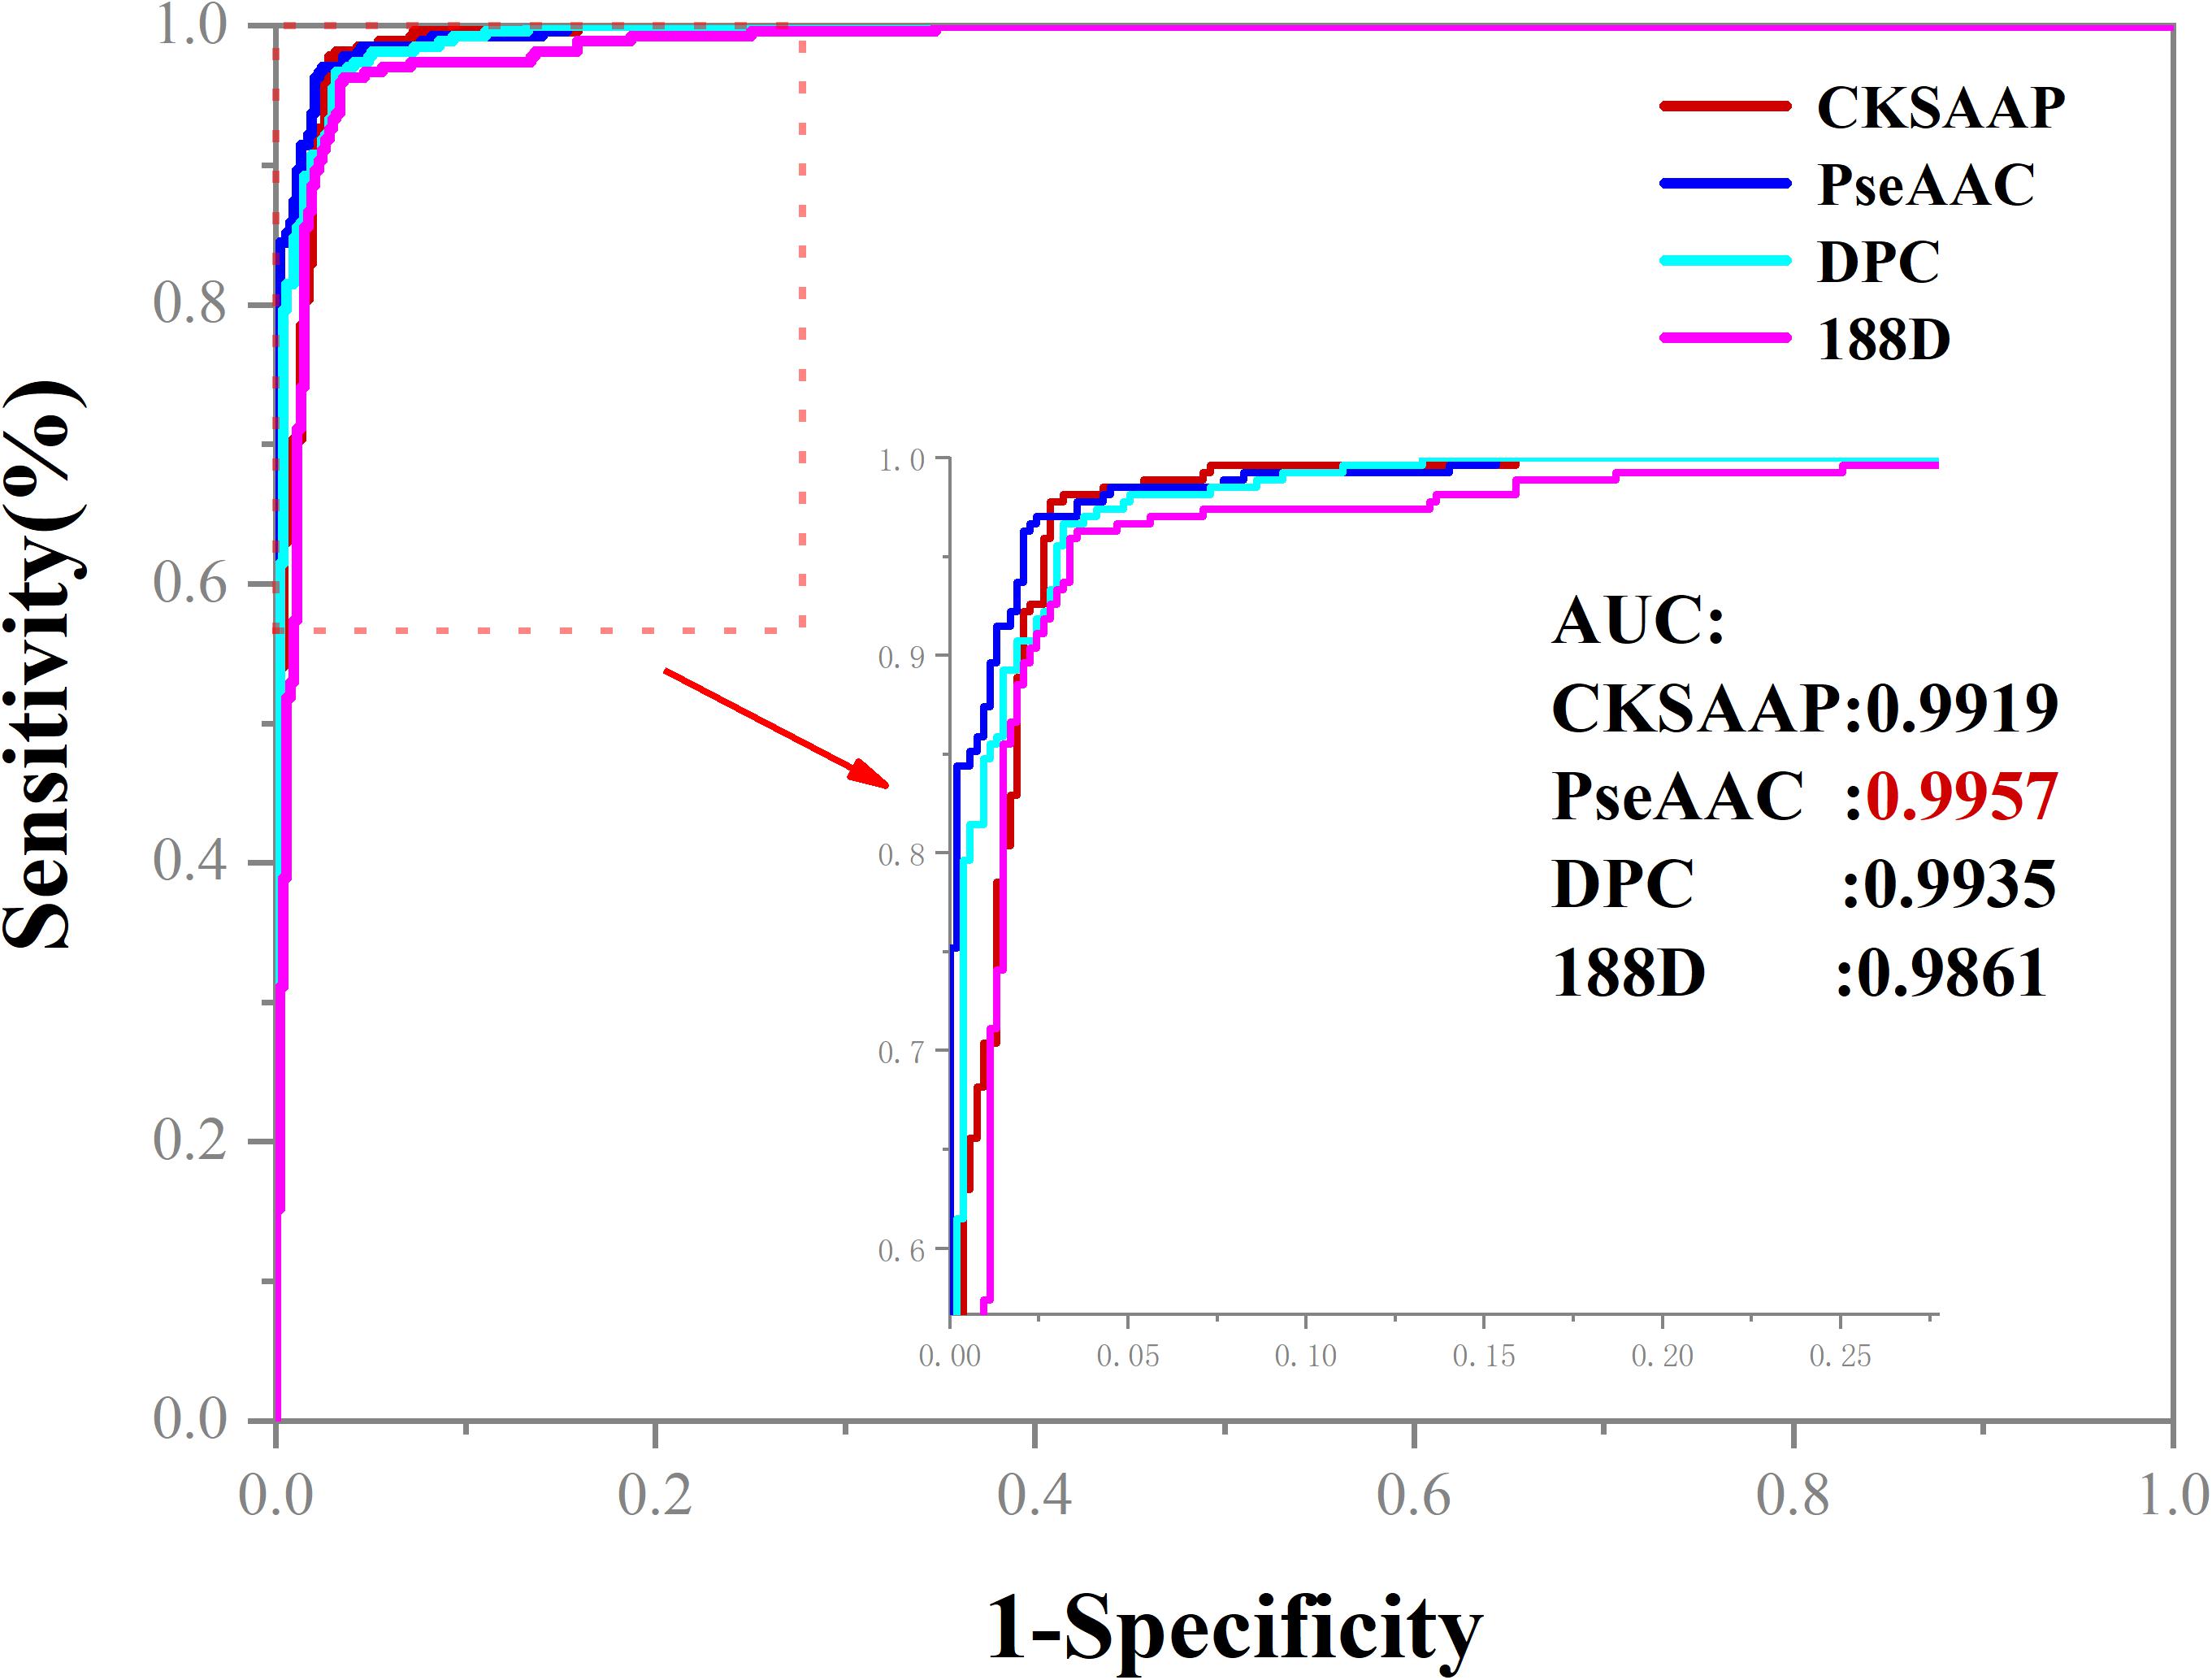
Figure 3. The ROC curves of four feature extraction methods. When PseAAC was applied to construct the model for apolipoprotein prediction, the AUC reaches the peak of 0.9957.
The Accuracy for Apolipoprotein Subfamily Classification
Up to now, this is the first machine learning work for apolipoprotein subfamily classification. By identifying the subfamilies of apolipoprotein, we aimed to provide more comprehensive understanding of apolipoproteins’ function. We investigated the performances of three kinds of features: CKSAAP, DPC, and PseAAC with feature selection. Results are listed in Table 2.
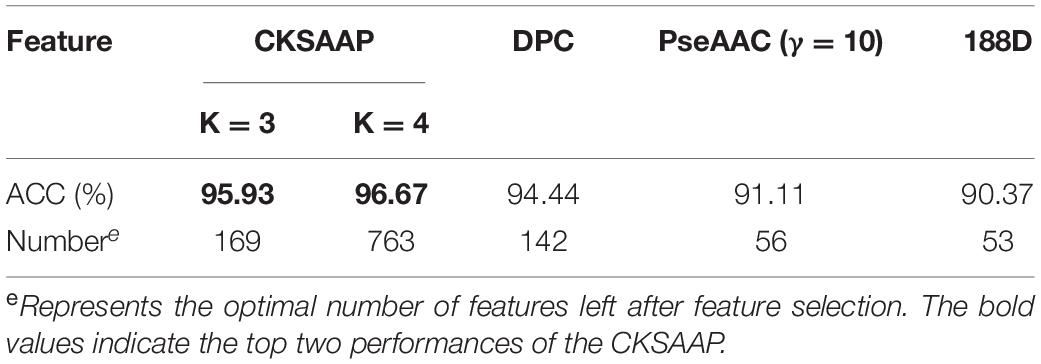
Table 2. The results of four feature extraction methods in subfamily classification of apolipoprotein.
As presented in Table 2, the best accuracy of 96.67% was obtained via CKSAAP with the k = 4. However, such high accuracy was produced at the cost of a high-dimension feature vector (763 D). From the table, one may notice that when k of CKSAAP was set to 3, the overall accuracy is 95.93% which is slightly lower than that of k = 4. Whereas, the dimension of input feature decreases dramatically from 763 to 169. Thus, the model constructed on CKSAAP (k = 3) is more robust and reliable. The prediction accuracy for each subfamily in 10-fold cross-validation is illustrated in Figure 4.
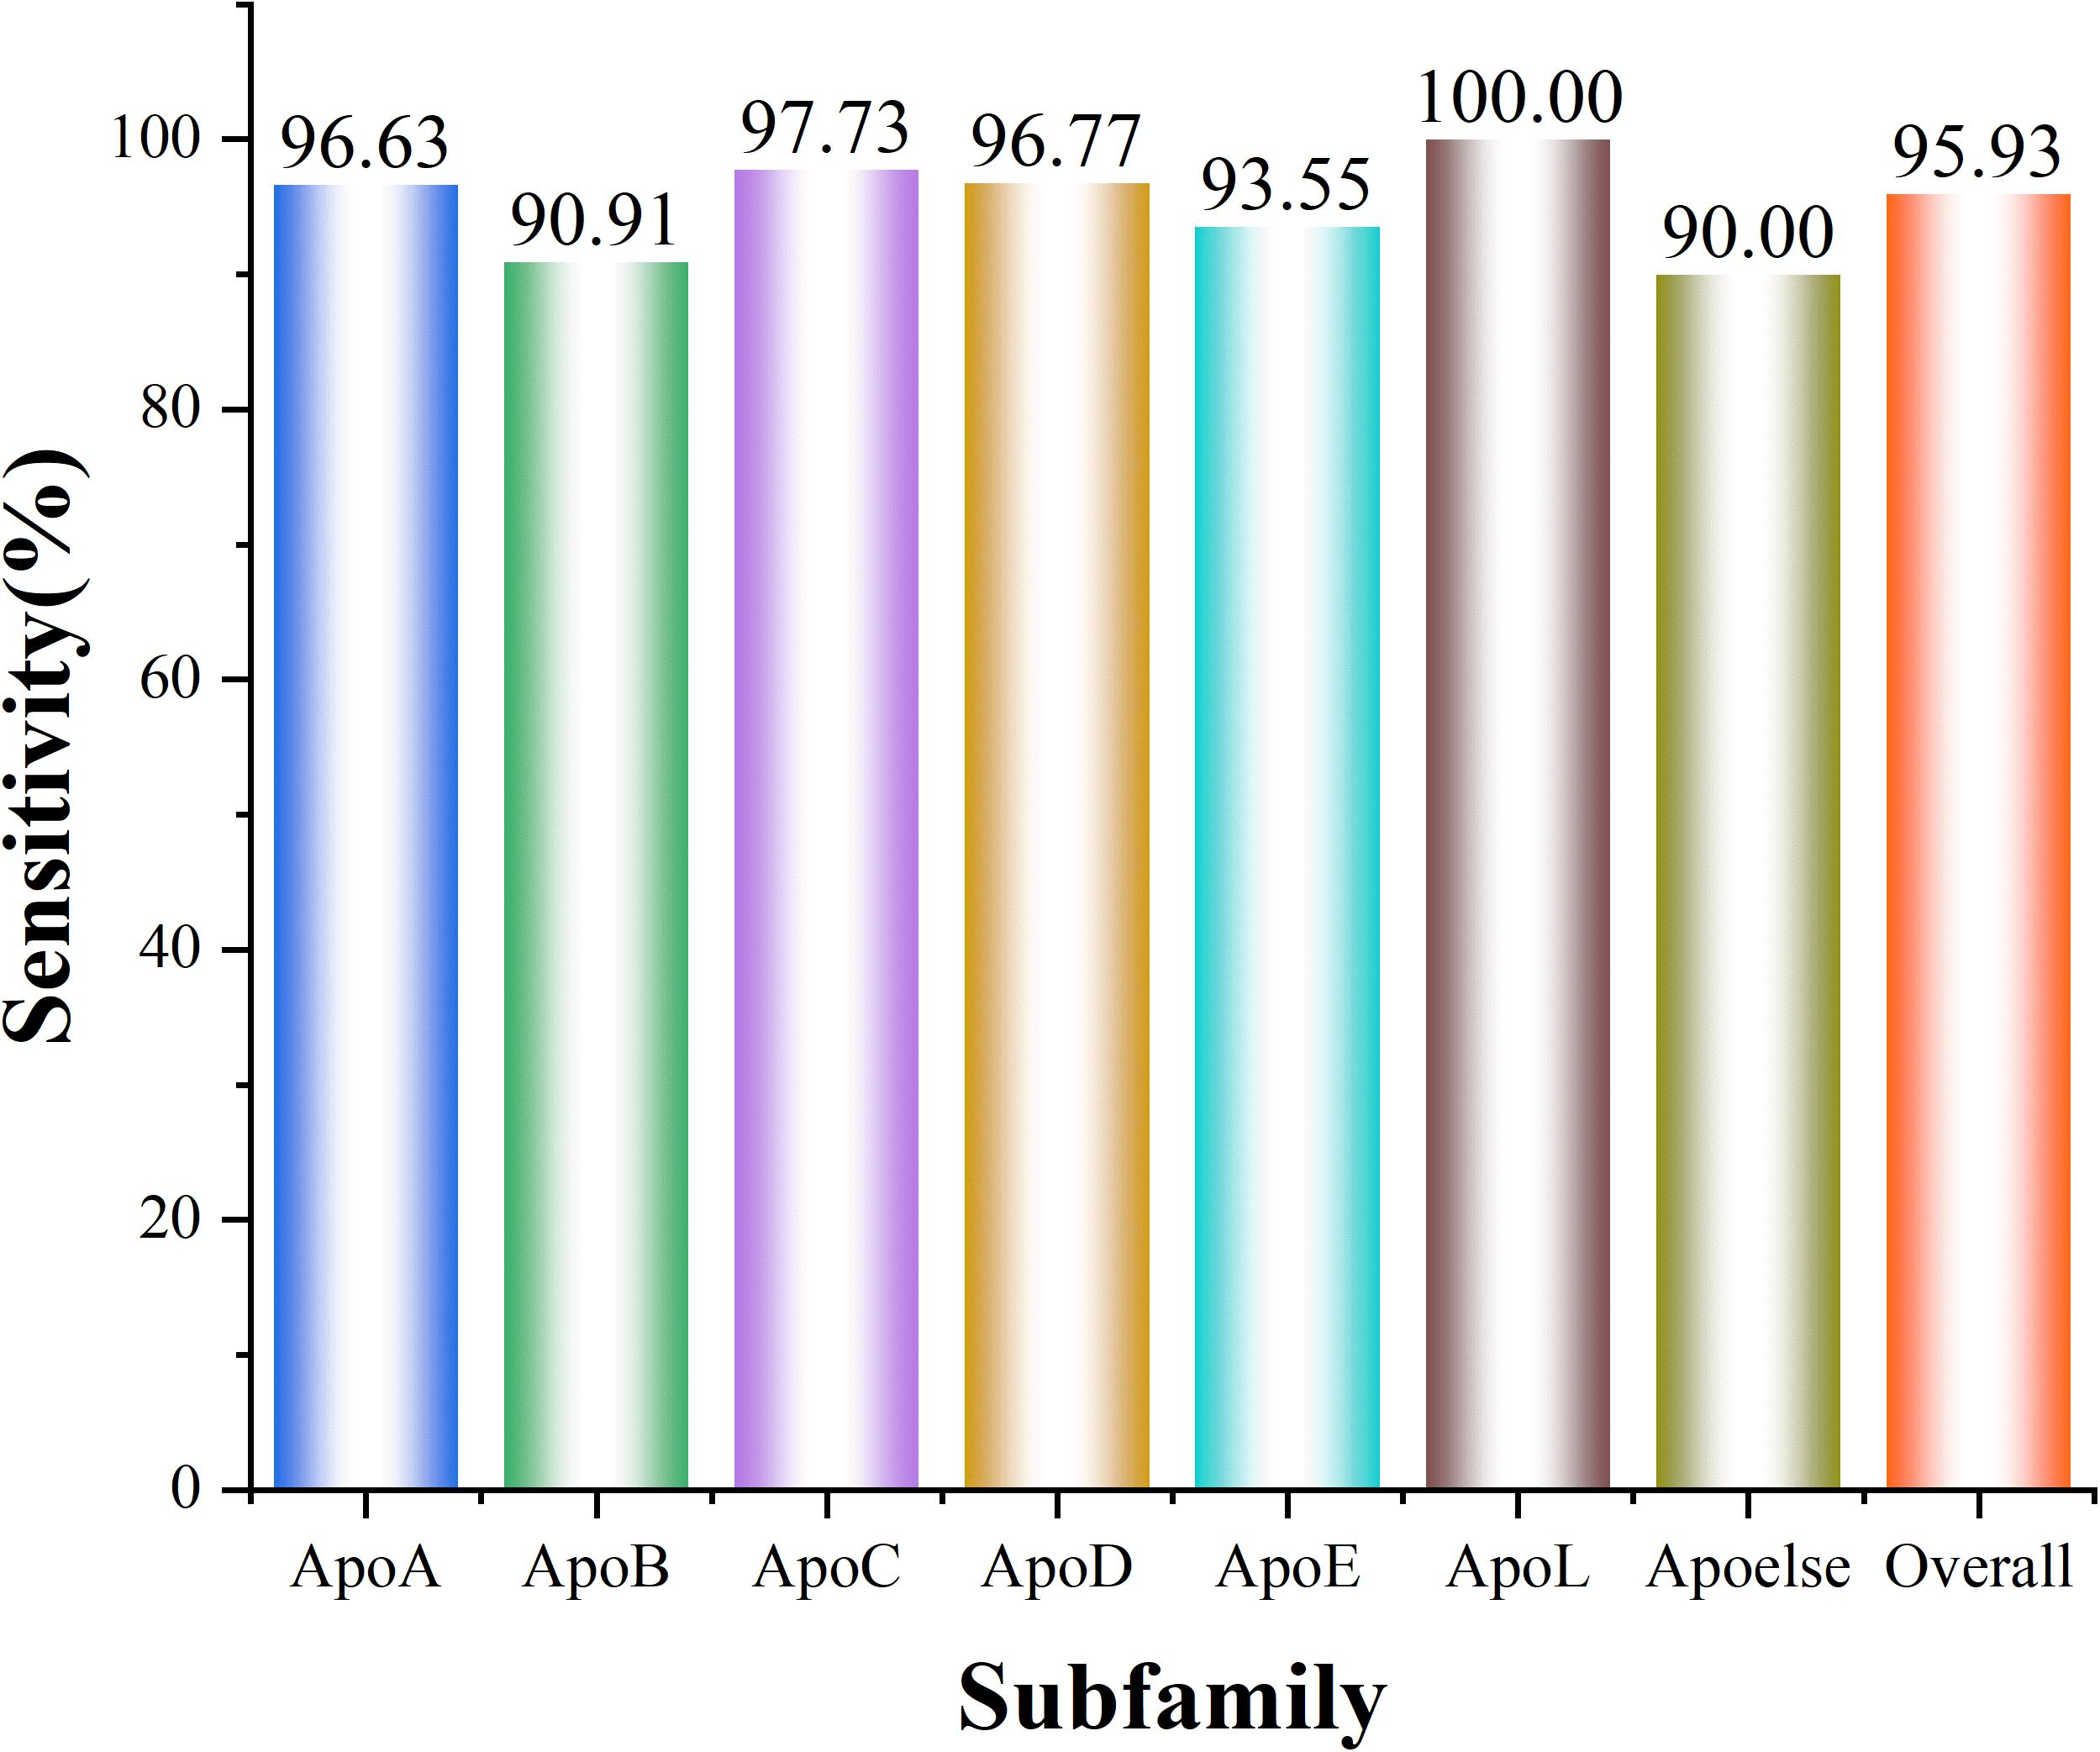
Figure 4. A histogram showing the classification sensitivity of each subfamily. ApoL has the highest Sn of 100%, while Apoelse gets the relatively lowest Sn of 90.00%. And the total Sn is 95.93%.
Different subfamilies of apolipoprotein have different functions and play distinct roles in the metabolism and physiological process of lipoprotein. Therefore, the subfamily classification of apolipoprotein is particularly significant. In our model, the highest accuracy of 100% was obtained for the ApoL subfamily. However, for Apoelse prediction, the accuracy is 90.00% which is the lowest among all subfamilies. The reason for this low accuracy is that Apoelse contains several types of subfamilies and the apolipoproteins in these subfamilies are not very similar in feature space. Such phenomenon also demonstrates that the apolipoproteins in different subfamilies possess different intrinsic sequence characteristics, structure, and function. Given this, our subfamily classification model of apolipoprotein is stable and reliable.
Webserver
For the sake of most scholars, we established a user-friendly webserver called ApoPred. Users can browse the server homepage at http://tang-biolab.com/server/ApoPred/service.html. And the webserver is guaranteed to work properly for at least 2 years. A detailed guide on how to use the webserver is given below.
On the home page of ApoPred, as shown in Figure 5, the Read Me button provides a brief introduction of the predictor and warnings when using it. Click the Data button, and the benchmark dataset that we built can be freely downloaded.
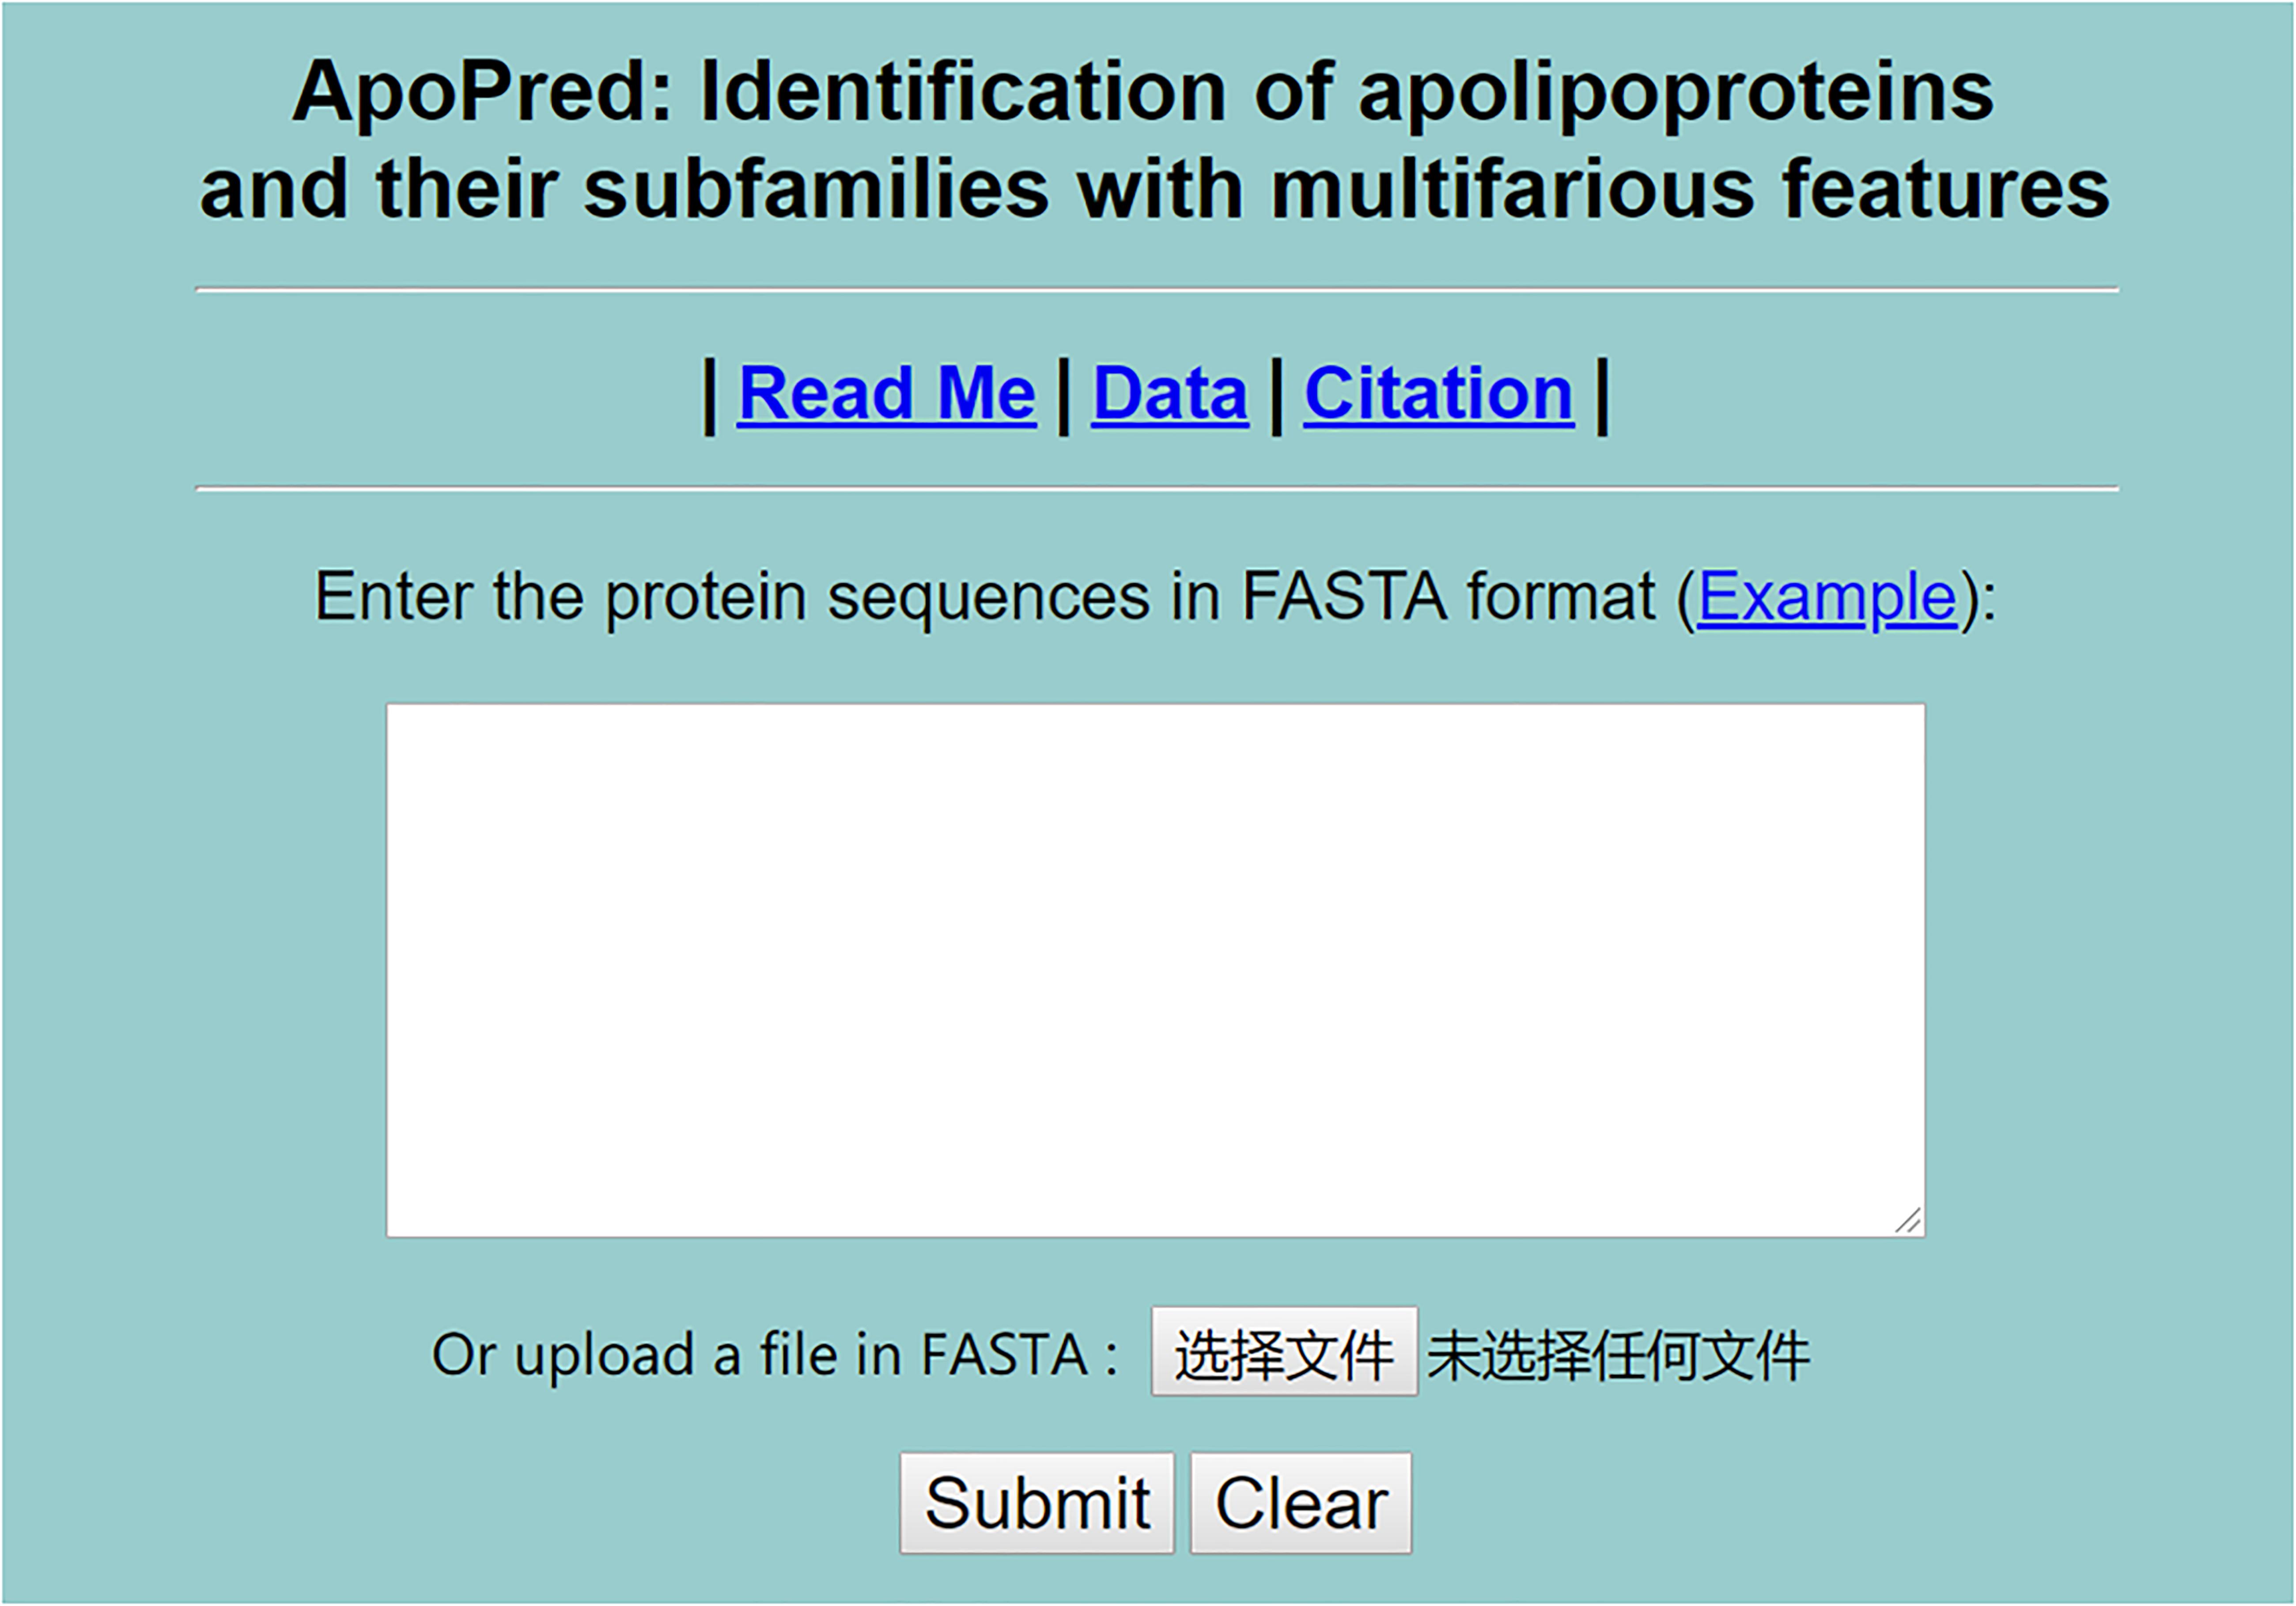
Figure 5. The top page of the ApoPred webserver at http://tang-biolab.com/server/ApoPred/service.html.
The users can input or paste the query amino acid sequences into the input box in FASTA format. The Example button supplies users with our example sequences in FASTA format. When clicking the Submit button, users can view the results of apolipoproteins identification and their subfamily classification.
Discussion
It is acknowledged that apolipoprotein has crucial effect on regulating lipoprotein metabolism, and variations in the expression level. Spatial structure and function of apolipoprotein are associated with numerous diseases. Nevertheless, lack of intensive bioinformatical analysis on the function and classification of apolipoprotein restricted its application on drug targets for the associated diseases.
In this work, we innovatively applied the correlation features obtained from residues sequence on constructing a two-tier classifier to identify apolipoproteins and their subfamilies. All the corresponding results and models stem from a reliable benchmark dataset which have been verified by biochemical experiments. Besides, the correlation of amino acids residues contains key genetic information. We consequently compared four feature extraction strategies describing the association between apolipoprotein amino acids and selected the optimal features by incorporating ANOVA into IFS. The PseAAC employed in apolipoprotein prediction model has been widely used in various fields of computational proteomics (Feng et al., 2013; Yang et al., 2016; Long et al., 2017). Another feature expression of CKSAAP used for subfamily classification is also a convenient tool in bioinformatics (Wang et al., 2016; Li et al., 2017; Cheng, 2019). The prediction models based on these features achieved encouraging results in 10-fold cross validation, which are demonstrated by cluster analysis via t-distributed stochastic neighbor embedding (t-SNE). The visualization results are shown in the Figures 6, 7.
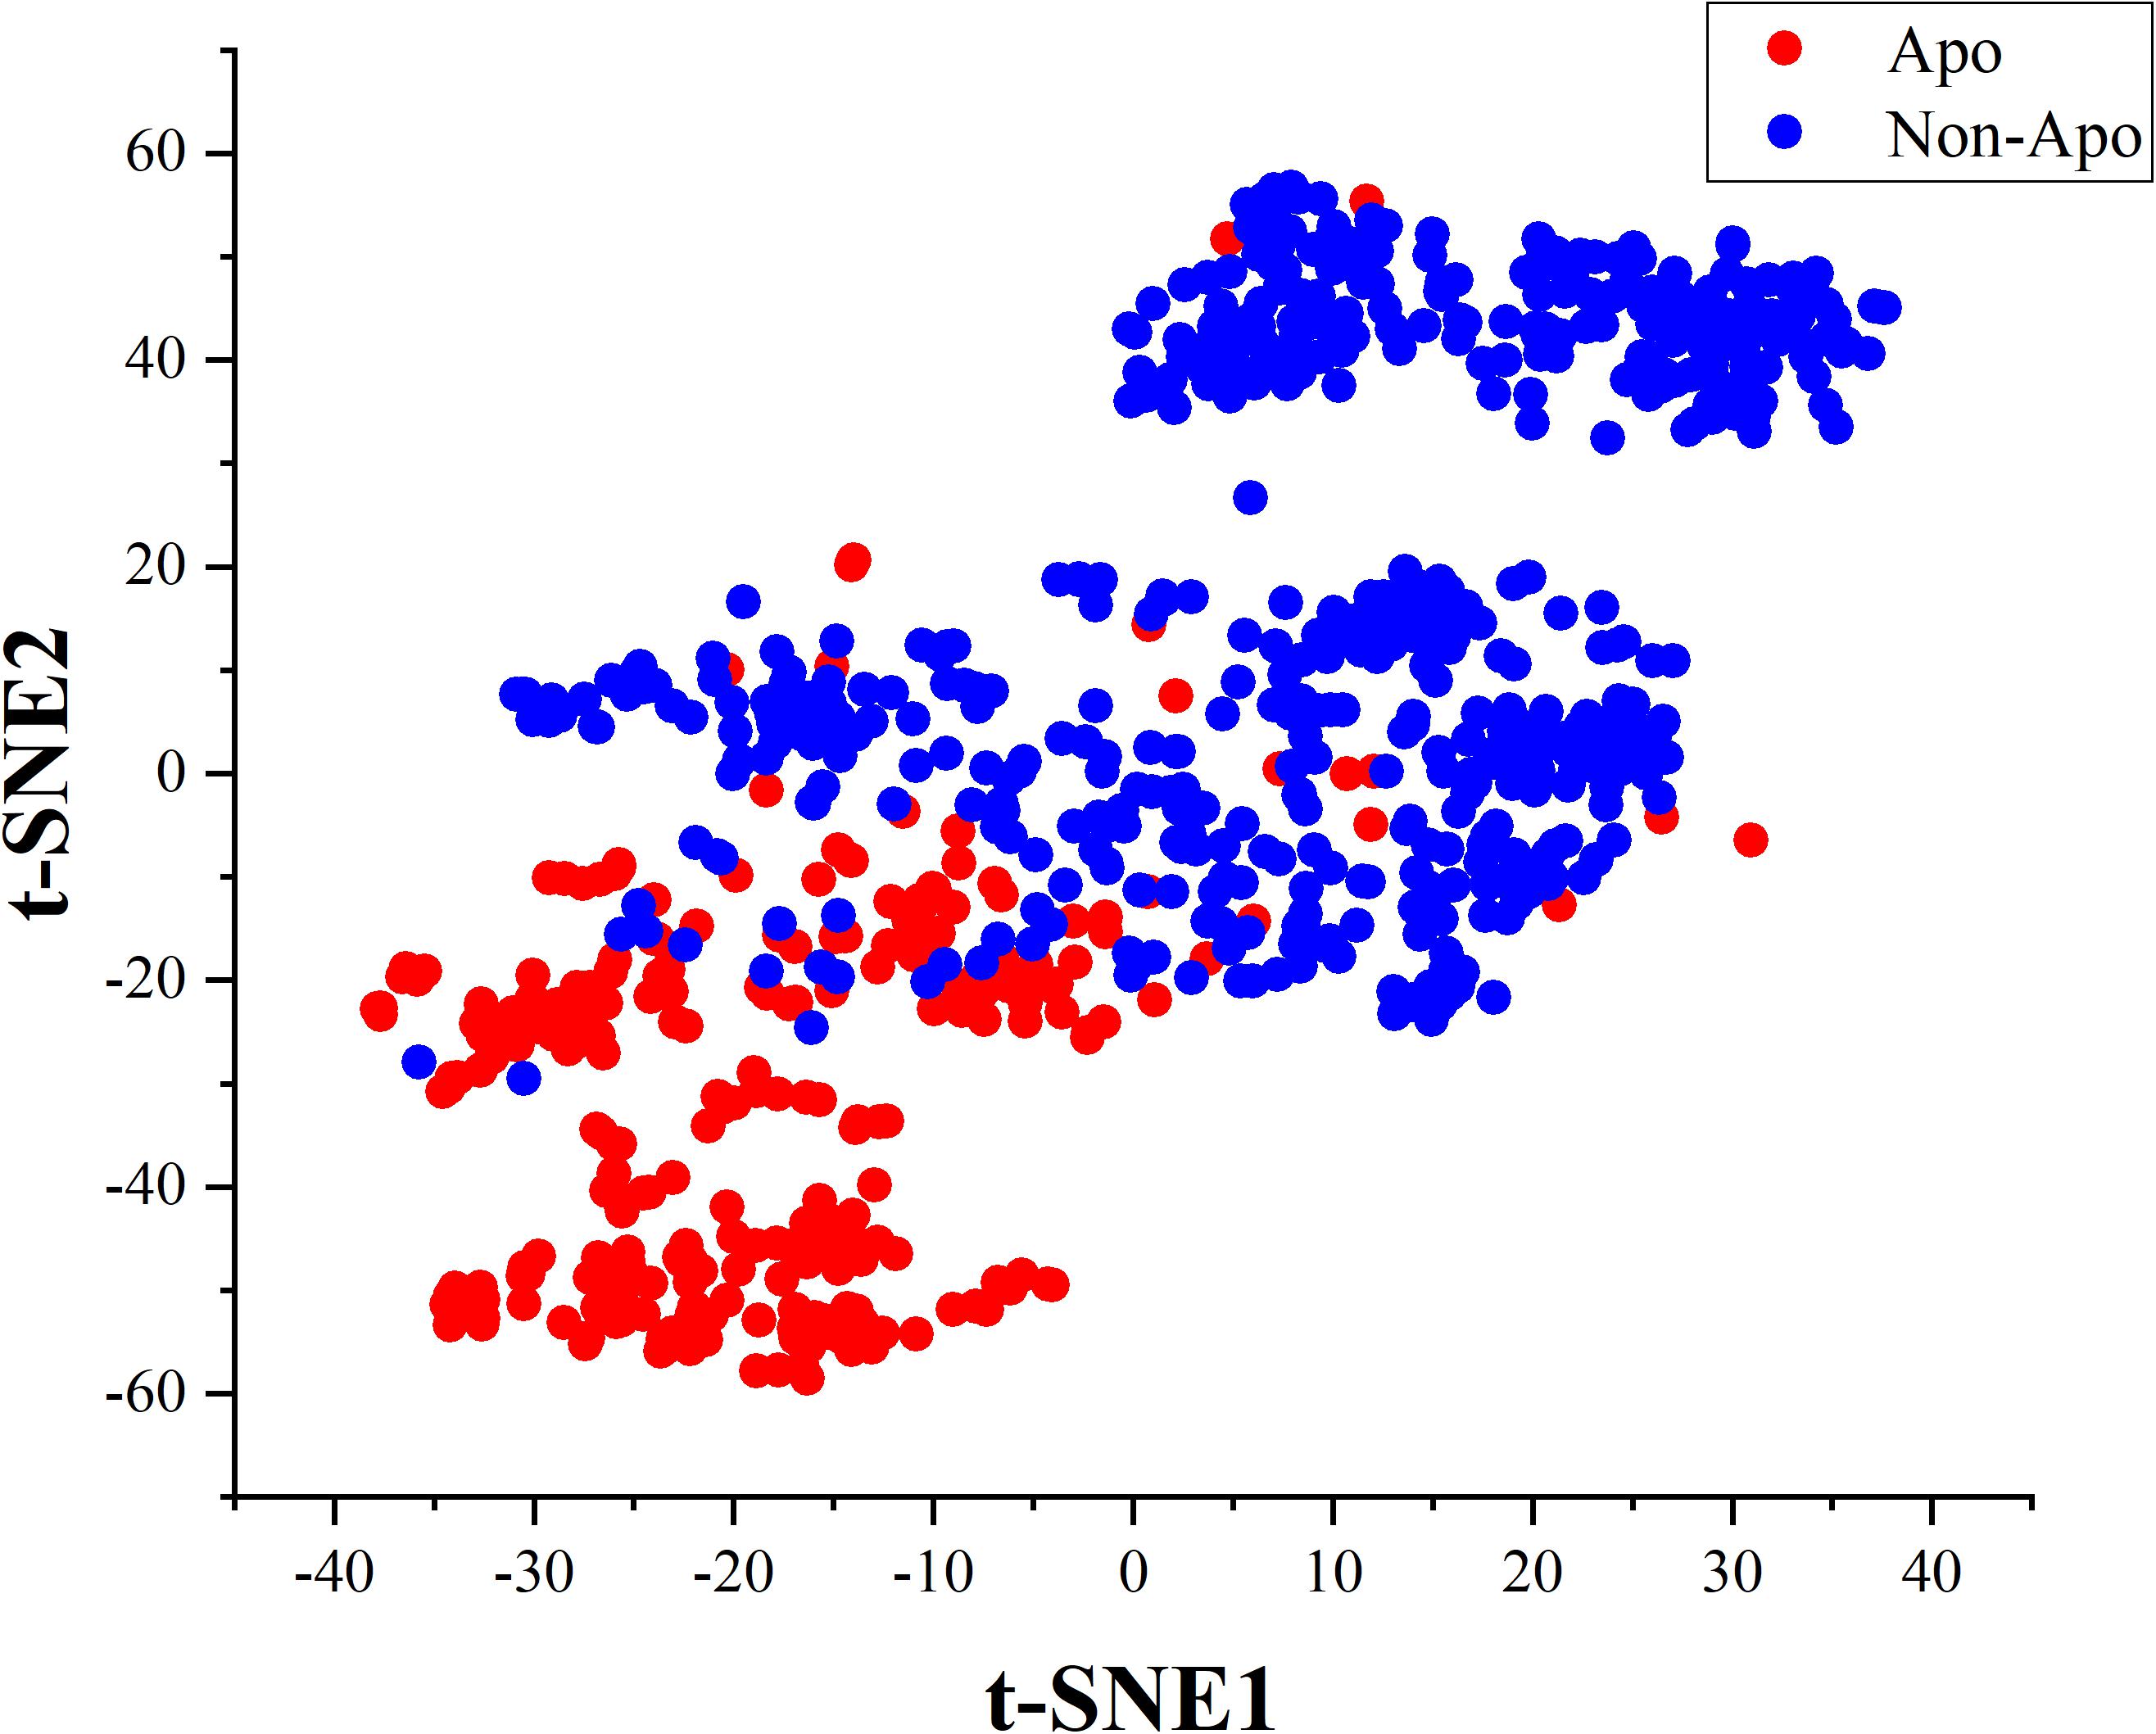
Figure 6. Cluster analysis of apolipoproteins and non-apolipoproteins.
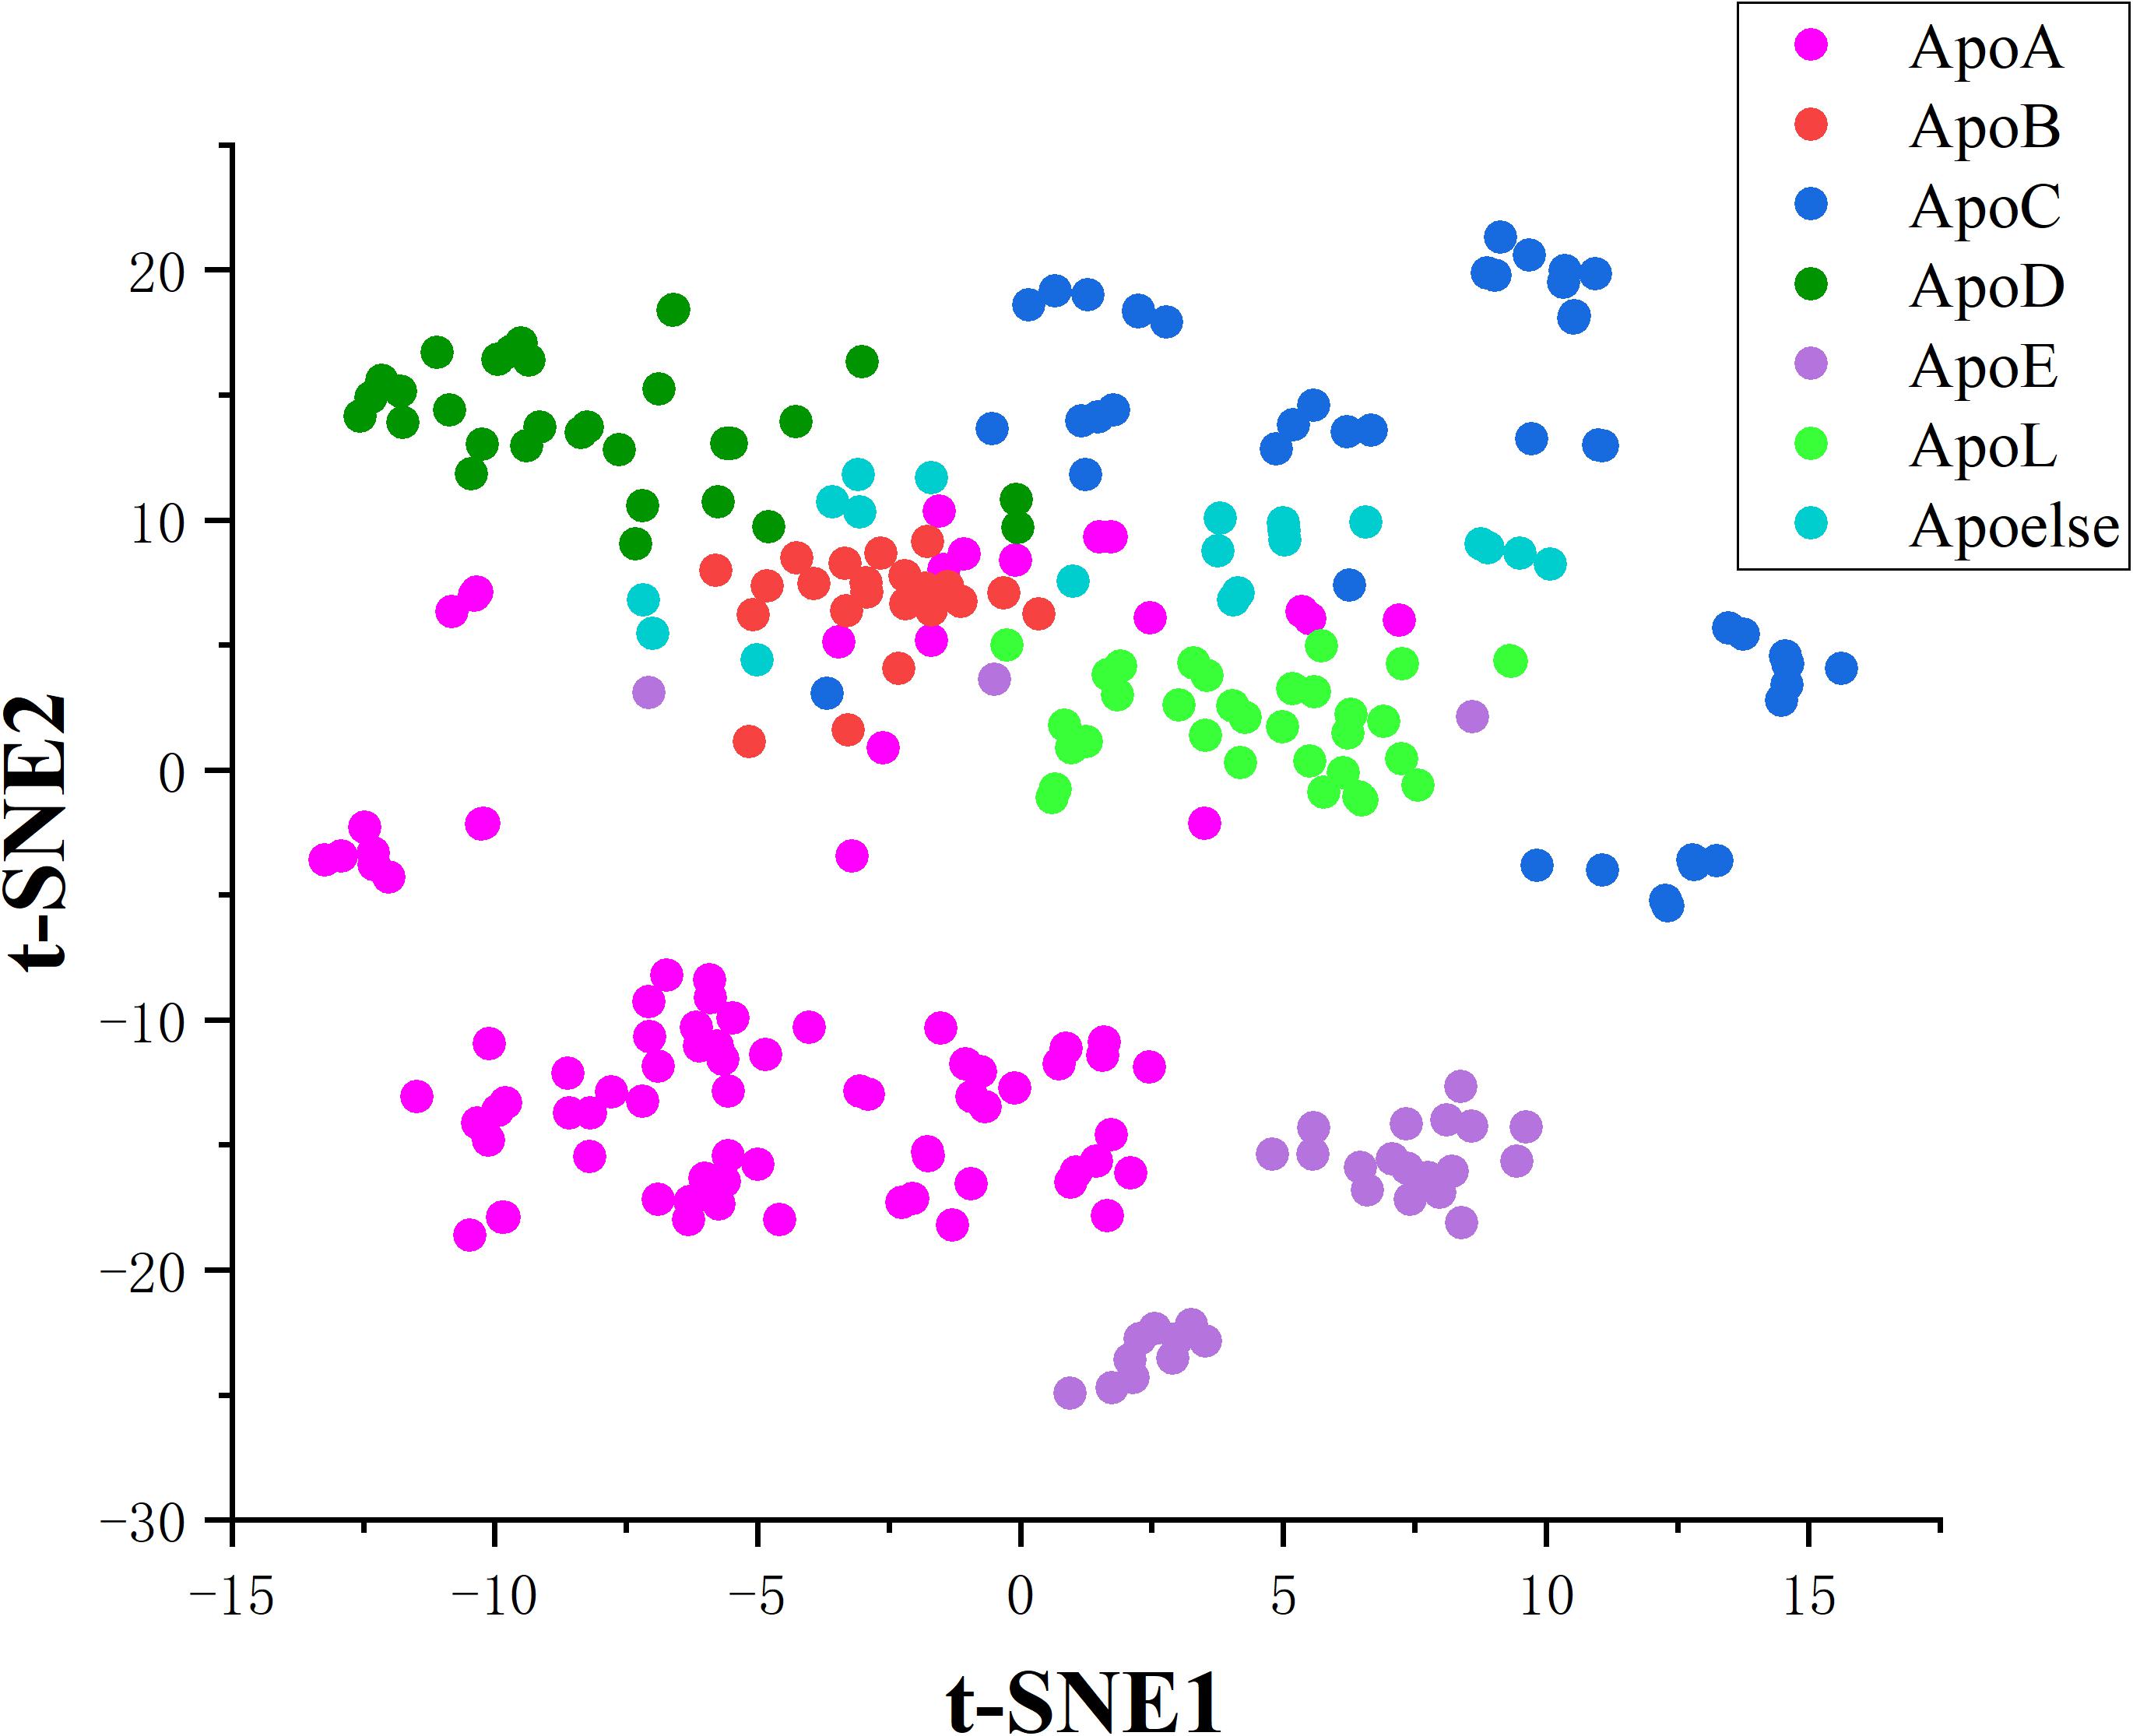
Figure 7. Cluster analysis of apolipoprotein subfamilies.
After feature extraction and selection procedure, 70-dimensional feature vectors were generated, which were reduced to 2-dimensional by t-SNE algorithm to facilitate clustering analysis. t-SNE is a common technique for dimensionality-reduction and visualization of high-dimensional data. As displayed in Figure 6, apolipoproteins are well separated from non-apolipoproteins. This illustrates that the features of PseAAC have promising performance in apolipoprotein classification. Similarly, as shown in Figure 7, the first six subfamilies, namely, ApoA, ApoB, ApoC, ApoD, ApoE, and ApoL, are obviously separated, while the seventh class, Apoelse, partly overlaps with ApoB, ApoC, ApoD, and ApoL, possibly because the seventh class is not a pure subfamily but a combination of ApoF, ApoH, ApoM, ApoN, and ApoR.
In addition, due to the size of the dataset provided by UniProt, our model does not conduct independent data validation. However, the validation of independent data will be carried out in our future work by collecting more apolipoprotein data.
In a word, based on feature extraction and selection algorithm, our models performed excellently in apolipoprotein recognition and subfamily-classification.
Conclusion
In this research, a practical tool, named ApoPred, was established to identify potential apolipoproteins and their subfamilies, providing a new theoretical basis for apolipoprotein function research and a new approach for drug target development. We have constructed the latest, high-quality, and reliable dataset to date, which is potentially to be conducted as the standard dataset for apolipoprotein research. We also successfully applied strategies of feature extraction and selection to obtain high-accuracy and robust classification models, which will facilitate further research of apolipoprotein function and drug targets for the relevant diseases. In the future, we will construct a more robust and precise model based on deep learning (Cao et al., 2017; Sunil et al., 2017; Si et al., 2020; Tomasz et al., 2020) and fusion features to identify apolipoproteins.
Data Availability Statement
The original contributions presented in the study are included in the article/supplementary materials, further inquiries can be directed to the corresponding author/s.
Author Contributions
HT conceived and designed the study. TL conducted the experiments. TL, J-MC, DZ, QZ, and BP implemented the algorithms. DZ established the web server. TL, LX, and HT performed the analysis and wrote the manuscript. All authors read and approved the final manuscript.
Funding
This work has been supported by the National Natural Science Foundation of China (61702430).
Conflict of Interest
The authors declare that the research was conducted in the absence of any commercial or financial relationships that could be construed as a potential conflict of interest.
Abbreviations
188D, 188-dimensional feature vectors; ANOVA, analysis of variance; Apo, apolipoprotein; CKSAAP, composition of k-spaced amino acid pairs; DPC, Dipeptide Composition; IFS, incremental feature selection; PseAAC, pseudo-amino acid composition; SVM, support vector machine.
References
Ao, C., Zhou, W., Gao, L., Dong, B., and Yu, L. (2020). Prediction of antioxidant proteins using hybrid feature representation method and random forest. Genomics [Epub ahead of print]. doi: 10.1016/j.ygeno.2020.08.016
Arkensteijn, B. W., Berbee, J. F., Rensen, P. C., Nielsen, L. B., and Christoffersen, C. (2013). The apolipoprotein m-sphingosine-1-phosphate axis: biological relevance in lipoprotein metabolism, lipid disorders and atherosclerosis. Int. J. Mol. Sci. 14, 4419–4431. doi: 10.3390/ijms14034419
Bandarian, F., Daneshpour, M. S., Hedayati, M., Naseri, M., and Azizi, F. (2016). Identification of sequence variation in the apolipoprotein A2 gene and their relationship with serum high-density lipoprotein cholesterol levels. Iran Biomed. J. 20, 84–90.
Bashtovyy, D., Jones, M. K., Anantharamaiah, G. M., and Segrest, J. P. (2011). Sequence conservation of apolipoprotein A-I affords novel insights into HDL structure-function. J. Lipid Res. 52, 435–450. doi: 10.1194/jlr.r012658
Basith, S., Manavalan, B., Hwan Shin, T., and Lee, G. (2020). Machine intelligence in peptide therapeutics: a next-generation tool for rapid disease screening. Med. Res. Rev. 40, 1276–1314. doi: 10.1002/med.21658
Basith, S., Manavalan, B., Shin, T. H., and Lee, G. (2019). SDM6A: a web-based integrative machine-learning framework for predicting 6mA sites in the rice genome. Mol. Ther. Nucleic Acids 18, 131–141. doi: 10.1016/j.omtn.2019.08.011
Boopathi, V., Subramaniyam, S., Malik, A., Lee, G., Manavalan, B., and Yang, D. C. (2019). mACPpred: a support vector machine-based meta-predictor for identification of anticancer peptides. Int. J. Mol. Sci. 20:1964. doi: 10.3390/ijms20081964
Bredesen, B. A., and Rehmsmeier, M. (2019). DNA sequence models of genome-wide Drosophila melanogaster polycomb binding sites improve generalization to independent polycomb response elements. Nucleic Acids Res. 47, 7781–7797. doi: 10.1093/nar/gkz617
Cao, R., Freitas, C., Chan, L., Sun, M., Jiang, H., and Chen, Z. (2017). ProLanGO: protein function prediction using neural machine translation based on a recurrent neural network. Molecules 22:1732. doi: 10.3390/molecules22101732
Cheng, L. (2019). Computational and biological methods for gene therapy. Curr. Gene Ther. 19, 210–210. doi: 10.2174/156652321904191022113307
Cheng, L., and Hu, Y. (2018). Human disease system biology. Curr. Gene Ther. 18, 255–256. doi: 10.2174/1566523218666181010101114
Cheng, L., Zhao, H., Wang, P., Zhou, W., Luo, M., Li, T., et al. (2019a). Computational methods for identifying similar diseases. Mol. Ther. Nucleic Acids 18, 590–604. doi: 10.1016/j.omtn.2019.09.019
Cheng, L., Zhuang, H., Ju, H., Yang, S., Han, J., Tan, R., et al. (2019b). Exposing the causal effect of body mass index on the risk of type 2 diabetes mellitus: a mendelian randomization study. Front. Genet. 10:94. doi: 10.3389/fgene.2019.00094
Cui, T., Zhang, L., Huang, Y., Yi, Y., Tan, P., Zhao, Y., et al. (2018). MNDR v2.0: an updated resource of ncRNA-disease associations in mammals. Nucleic Acids Res. 46, D371–D374. doi: 10.1093/nar/gkx1025
Dao, F. Y., Lv, H., Yang, Y. H., Zulfiqar, H., Gao, H., and Lin, H. (2020a). Computational identification of N6-methyladenosine sites in multiple tissues of mammals. Comput. Struct. Biotechnol. J. 18, 1084–1091. doi: 10.1016/j.csbj.2020.04.015
Dao, F. Y., Lv, H., Zulfiqar, H., Yang, H., Su, W., Gao, H., et al. (2020b). A computational platform to identify origins of replication sites in eukaryotes. Brief Bioinform. [Epub ahead of print]. doi: 10.1093/bib/bbaa017
Deng, X., Walker, R. G., Morris, J., Davidson, W. S., and Thompson, T. B. (2015). Role of conserved proline residues in human apolipoprotein A-IV structure and function. J. Biol. Chem. 290, 10689–10702. doi: 10.1074/jbc.m115.637058
Ding, H., and Li, D. (2015). Identification of mitochondrial proteins of malaria parasite using analysis of variance. Amino Acids 47, 329–333. doi: 10.1007/s00726-014-1862-4
Fang, F., Zhan, Y., Hammar, N., Shen, X., Wirdefeldt, K., Walldius, G., et al. (2019). Lipids, apolipoproteins, and the risk of parkinson disease. Circ. Res. 125, 643–652. doi: 10.1161/circresaha.119.314929
Feng, P. M., Lin, H., and Chen, W. (2013). Identification of antioxidants from sequence information using naive Bayes. Comput. Math. Methods Med. 2013:567529. doi: 10.1155/2013/567529
Frank, P. G., and Marcel, Y. L. (2000). Apolipoprotein A-I: structure-function relationships. J. Lipid Res. 41, 853–872.
Gangabadage, C. S., Zdunek, J., Tessari, M., Nilsson, S., Olivecrona, G., and Wijmenga, S. S. (2008). Structure and dynamics of human apolipoprotein CIII. J. Biol. Chem. 283, 17416–17427. doi: 10.1074/jbc.m800756200
Hasan, M. A. M., Ben Islam, M. K., Rahman, J., and Ahmad, S. (2020b). Citrullination site prediction by incorporating sequence coupled effects into PseAAC and resolving data imbalance issue. Curr. Bioinform. 15, 235–245. doi: 10.2174/1574893614666191202152328
Hasan, M. M., Basith, S., Khatun, M. S., Lee, G., Manavalan, B., and Kurata, H. (2020c). Meta-i6mA: an interspecies predictor for identifying DNA N6-methyladenine sites of plant genomes by exploiting informative features in an integrative machine-learning framework. Brief Bioinform. [Epub ahead of print]. doi: 10.1093/bib/bbaa202
Hasan, M. M., Manavalan, B., Khatun, M. S., and Kurata, H. (2019a). i4mC-ROSE, a bioinformatics tool for the identification of DNA N4-methylcytosine sites in the Rosaceae genome. Int. J. Biol. Macromol. 157, 752–758. doi: 10.1016/j.ijbiomac.2019.12.009
Hasan, M. M., Manavalan, B., Khatun, M. S., and Kurata, H. (2019b). Prediction of S-nitrosylation sites by integrating support vector machines and random forest. Mol. Omics 15, 451–458. doi: 10.1039/c9mo00098d
Hasan, M. M., Schaduangrat, N., Basith, S., Lee, G., Shoombuatong, W., and Manavalan, B. (2020a). HLPpred-Fuse: improved and robust prediction of hemolytic peptide and its activity by fusing multiple feature representation. Bioinformatics 36, 3350–3356. doi: 10.1093/bioinformatics/btaa160
Huang, K. Y., Hsu, J. B., and Lee, T. Y. (2019). Characterization and identification of lysine succinylation sites based on deep learning method. Sci. Rep. 9:16175. doi: 10.1038/s41598-019-52552-4
Ju, Z., and Wang, S. (2020). Prediction of lysine formylation sites using the composition of k-spaced amino acid pairs via Chou’s 5-steps rule and general pseudo components. Genomics 112, 859–866. doi: 10.1016/j.ygeno.2019.05.027
Kiss, R. S., Ryan, R. O., and Francis, G. A. (2001). Functional similarities of human and chicken apolipoprotein A-I: dependence on secondary and tertiary rather than primary structure. Biochim. Biophys. Acta 1531, 251–259. doi: 10.1016/s1388-1981(01)00109-3
Krisko, A., and Etchebest, C. (2007). Theoretical model of human apolipoprotein B100 tertiary structure. Proteins 66, 342–358. doi: 10.1002/prot.21229
Kwon, E., Cho, M., Kim, H., and Son, H. S. (2020). A study on host tropism determinants of influenza virus using machine learning. Curr. Bioinform. 15, 121–134. doi: 10.2174/1574893614666191104160927
Lai, H. Y., Zhang, Z. Y., Su, Z. D., Su, W., Ding, H., Chen, W., et al. (2019). iProEP: a computational predictor for predicting promoter. Mol. Ther. Nucleic Acids 17, 337–346. doi: 10.1016/j.omtn.2019.05.028
Li, K., Xu, C., Huang, J., Liu, W., Zhang, L., Wan, W., et al. (2017). Prediction and identification of the effectors of heterotrimeric G proteins in rice (Oryza sativa L.). Brief Bioinform. 18, 270–278.
Li, Y., Niu, M., and Zou, Q. (2019). ELM-MHC: an improved MHC identification method with extreme learning machine algorithm. J. Proteome Res. 18, 1392–1401. doi: 10.1021/acs.jproteome.9b00012
Liang, C., Changlu, Q., He, Z., Tongze, F., and Xue, Z. (2019). gutMDisorder: a comprehensive database for dysbiosis of the gut microbiota in disorders and interventions. Nucleic Acids Res. 48:7603. doi: 10.1093/nar/gkz843
Liang, Z. Y., Lai, H. Y., Yang, H., Zhang, C. J., Yang, H., Wei, H. H., et al. (2017). Pro54DB: a database for experimentally verified sigma-54 promoters. Bioinformatics 33, 467–469. doi: 10.1093/bioinformatics/btw630
Liao, Z., Wang, X., Zeng, Y., and Zou, Q. (2016). Identification of DEP domain-containing proteins by a machine learning method and experimental analysis of their expression in human HCC tissues. Sci. Rep. 6:39655. doi: 10.1038/srep39655
Long, H., Wang, M., and Fu, H. (2017). Deep convolutional neural networks for predicting hydroxyproline in proteins. Curr. Bioinform. 12, 233–238. doi: 10.2174/1574893612666170221152848
Mahley, R. W. (2016). Central nervous system lipoproteins: ApoE and regulation of cholesterol metabolism. Arterioscler. Thromb. Vasc. Biol. 36, 1305–1315. doi: 10.1161/atvbaha.116.307023
Manavalan, B., Basith, S., Shin, T., Wei, L., and Lee, G. (2019a). AtbPpred: a robust sequence-based prediction of anti-tubercular peptides using extremely randomized trees. Comput. Struct. Biotechnol. J. 17, 972–981. doi: 10.1016/j.csbj.2019.06.024
Manavalan, B., Basith, S., Shin, T., Wei, L., and Lee, G. (2019b). mAHTPred: a sequence-based meta-predictor for improving the prediction of anti-hypertensive peptides using effective feature representation. Bioinformatics 35, 2757–2765. doi: 10.1093/bioinformatics/bty1047
Manavalan, B., Basith, S., Shin, T. H., Wei, L., and Lee, G. (2019c). Meta-4mCpred: a sequence-based meta-predictor for accurate dna 4mc site prediction using effective feature representation. Mol. Ther. Nucleic Acids 16, 733–744. doi: 10.1016/j.omtn.2019.04.019
Manavalan, B., and Lee, J. (2017). SVMQA: support-vector-machine-based protein single-model quality assessment. Bioinformatics 33, 2496–2503. doi: 10.1093/bioinformatics/btx222
Martinez-Pinilla, E., Navarro, A., Ordonez, C., Del Valle, E., and Tolivia, J. (2015). Apolipoprotein D subcellular distribution pattern in neuronal cells during oxidative stress. Acta Histochem. 117, 536–544. doi: 10.1016/j.acthis.2015.04.003
Nojiri, T., Kurano, M., Tokuhara, Y., Ohkubo, S., Hara, M., Ikeda, H., et al. (2014). Modulation of sphingosine-1-phosphate and apolipoprotein M levels in the plasma, liver and kidneys in streptozotocin-induced diabetic mice. J. Diabetes Investig. 5, 639–648. doi: 10.1111/jdi.12232
Qin, J., and He, Z. S. (2005). “A SVM face recognition method based on Gabor-featured key points,” in Proceedings of the 4th International Conference on Machine Learning and Cybernetics, Guangzhou.
Richardson, T. G., Sanderson, E., Palmer, T. M., Ala-Korpela, M., Ference, B. A., Davey Smith, G., et al. (2020). Evaluating the relationship between circulating lipoprotein lipids and apolipoproteins with risk of coronary heart disease: a multivariable mendelian randomisation analysis. PLoS Med. 17:e1003062. doi: 10.1371/journal.pmed.1003062
Saravanan, V., and Gautham, N. (2015). Harnessing computational biology for exact linear B-cell epitope prediction: a novel amino acid composition-based feature descriptor. Omics 19, 648–658. doi: 10.1089/omi.2015.0095
Seda, O., and Sedova, L. (2003). New apolipoprotein A-V: comparative genomics meets metabolism. Physiol. Res. 52, 141–146.
Si, D., Moritz, S., Pfab, J., Hou, J., Cao, R., Wang, L., et al. (2020). Deep learning to predict protein backbone structure from high-resolution Cryo-EM density maps. Sci. Rep. 10:4282. doi: 10.1038/s41598-020-60598-y
Stephenson, N., Shane, E., Chase, J., Rowland, J., Ries, D., Justice, N., et al. (2019). Survey of machine learning techniques in drug discovery. Curr. Drug Metab. 20, 185–193. doi: 10.2174/1389200219666180820112457
Sunil, P., Rashmi, T., Vandana, K., and Pritish, V. (2017). DeepInteract: deep neural network based protein-protein interaction prediction tool. Curr. Bioinform. 12, 551–557. doi: 10.2174/1574893611666160815150746
Tahir, M., and Idris, A. (2020). MD-LBP: an efficient computational model for protein subcellular localization from HeLa cell lines using SVM. Curr. Bioinform. 15, 204–211. doi: 10.2174/1574893614666190723120716
Tang, H., Zou, P., Zhang, C., Chen, R., Chen, W., and Lin, H. (2016). Identification of apolipoprotein using feature selection technique. Sci. Rep. 6:30441. doi: 10.1038/srep30441
Toledo, J. D., Prieto, E. D., Gonzalez, M. C., Soulages, J. L., and Garda, H. A. (2004). Functional independence of a peptide with the sequence of human apolipoprotein A-I central region. Arch. Biochem. Biophys. 428, 188–197. doi: 10.1016/j.abb.2004.05.009
Tomasz, S., Irena, R.-K., and Katarzyna, S. (2020). Protein secondary structure prediction: a review of progress and directions. Curr. Bioinform. 15, 90–107. doi: 10.2174/1574893614666191017104639
Wang, L., You, Z. H., Li, J. Q., and Huang, Y. A. (2020). “IMS-CDA: prediction of CircRNA-disease associations from the integration of multisource similarity information with deep stacked autoencoder model,” in Proceedings of the IEEE Transactions on Cybernetics, (Piscataway, NJ: IEEE). doi: 10.1109/TCYB.2020.3022852
Wang, X., Yan, R., and Song, J. (2016). DephosSite: a machine learning approach for discovering phosphotase-specific dephosphorylation sites. Sci. Rep. 6:23510. doi: 10.1038/srep23510
Wang, Y., Shi, F., Cao, L., Dey, N., Wu, Q., Ashour, A. S., et al. (2019). Morphological segmentation analysis and texture-based support vector machines classification on mice liver fibrosis microscopic images. Curr. Bioinform. 14, 282–294. doi: 10.2174/1574893614666190304125221
Weinberg, R. B., Cook, V. R., Beckstead, J. A., Martin, D. D., Gallagher, J. W., Shelness, G. S., et al. (2003). Structure and interfacial properties of human apolipoprotein A-V. J. Biol. Chem. 278, 34438–34444. doi: 10.1074/jbc.M303784200
Wolska, A., Dunbar, R. L., Freeman, L. A., Ueda, M., Amar, M. J., Sviridov, D. O., et al. (2017). Apolipoprotein C-II: new findings related to genetics, biochemistry, and role in triglyceride metabolism. Atherosclerosis 267, 49–60. doi: 10.1016/j.atherosclerosis.2017.10.025
Xu, L., Liang, G., Liao, C., Chen, G.-D., and Chang, C.-C. (2018a). An efficient classifier for Alzheimer’s disease genes identification. Molecules 23:3140. doi: 10.3390/molecules23123140
Xu, L., Liang, G., Shi, S., and Liao, C. (2018b). SeqSVM: a sequence-based support vector machine method for identifying antioxidant proteins. Int. J. Mol. Sci. 19:1773. doi: 10.3390/ijms19061773
Xu, L., Liang, G., Wang, L., and Liao, C. (2018c). A novel hybrid sequence-based model for identifying anticancer peptides. Genes 9:158. doi: 10.3390/genes9030158
Xu, L., Liang, G., Liao, C., Chen, G.-D., and Chang, C.-C. (2019). k-Skip-n-Gram-RF: a random forest based method for Alzheimer’s disease protein identification. Front. Genet. 10:33. doi: 10.3389/fgene.2019.00033
Xu, N., and Dahlback, B. (1999). A novel human apolipoprotein (apoM). J. Biol. Chem. 274, 31286–31290. doi: 10.1074/jbc.274.44.31286
Yang, H., Tang, H., Chen, X. X., Zhang, C. J., Zhu, P. P., Ding, H., et al. (2016). Identification of secretory proteins in mycobacterium tuberculosis using pseudo amino acid composition. Biomed. Res. Int. 2016:5413903. doi: 10.1155/2016/5413903
Yang, H., Yang, W., Dao, F. Y., Lv, H., Ding, H., Chen, W., et al. (2019). A comparison and assessment of computational method for identifying recombination hotspots in Saccharomyces cerevisiae. Brief Bioinform. 21, 1568–1580. doi: 10.1093/bib/bbz123
Yang, W., Zhu, X. J., Huang, J., Ding, H., and Lin, H. (2019). A brief survey of machine learning methods in protein sub-Golgi localization. Curr. Bioinform. 14, 234–240. doi: 10.2174/1574893613666181113131415
Yiu, J. H. C., Chan, K. S., Cheung, J., Li, J., Liu, Y., Wang, Y., et al. (2020). Gut microbiota-associated activation of TLR5 induces apolipoprotein A1 production in the liver. Circ. Res. 127, 1236–1252. doi: 10.1161/circresaha.120.317362
Zhang, T., Tan, P., Wang, L., Jin, N., Li, Y., Zhang, L., et al. (2017). RNALocate: a resource for RNA subcellular localizations. Nucleic Acids Res. 45, D135–D138.
Zhao, T., Hu, Y., Peng, J., and Cheng, L. (2020). DeepLGP: a novel deep learning method for prioritizing lncRNA target genes. Bioinformatics 36, 4466–4472. doi: 10.1093/bioinformatics/btaa428
Keywords: apolipoprotein, identification, subfamily-classification, multiple features, machine learning
Citation: Liu T, Chen J-M, Zhang D, Zhang Q, Peng B, Xu L and Tang H (2021) ApoPred: Identification of Apolipoproteins and Their Subfamilies With Multifarious Features. Front. Cell Dev. Biol. 8:621144. doi: 10.3389/fcell.2020.621144
Received: 25 October 2020; Accepted: 24 November 2020;
Published: 08 January 2021.
Edited by:
Lei Deng, Central South University, ChinaReviewed by:
Yongchun Zuo, Inner Mongolia University, ChinaMeng Zhou, Wenzhou Medical University, China
Copyright © 2021 Liu, Chen, Zhang, Zhang, Peng, Xu and Tang. This is an open-access article distributed under the terms of the Creative Commons Attribution License (CC BY). The use, distribution or reproduction in other forums is permitted, provided the original author(s) and the copyright owner(s) are credited and that the original publication in this journal is cited, in accordance with accepted academic practice. No use, distribution or reproduction is permitted which does not comply with these terms.
*Correspondence: Lei Xu, Y3NsZWl4dUBzenB0LmVkdS5jbg==; Hua Tang, aHVhdGFuZ0Bzd211LmVkdS5jbg==