
94% of researchers rate our articles as excellent or good
Learn more about the work of our research integrity team to safeguard the quality of each article we publish.
Find out more
ORIGINAL RESEARCH article
Front. Cell Dev. Biol. , 07 December 2020
Sec. Epigenomics and Epigenetics
Volume 8 - 2020 | https://doi.org/10.3389/fcell.2020.529386
 Ming Zhang1,2,3,4
 Yilin Wang1,2,3,4Yan Wang1,2,3,4Longyang Jiang1,2,3,4Xueping Li1,2,3,4Hua Gao1,2,3,4*
 Minjie Wei1,2,3,4*
 Lin Zhao1,2,3,4*
Background: DNA methylation is a common event in the early development of various tumors, including breast cancer (BRCA), which has been studies as potential tumor biomarkers. Although previous studies have reported a cluster of aberrant promoter methylation changes in BRCA, none of these research groups have proved the specificity of these DNA methylation changes. Here we aimed to identify specific DNA methylation signatures in BRCA which can be used as diagnostic and prognostic markers.
Methods: Differentially methylated sites were identified using the Cancer Genome Atlas (TCGA) BRCA data set. We screened for BRCA-differential methylation by comparing methylation profiles of BRCA patients, healthy breast biopsies and blood samples. These differential methylated sites were compared to nine main cancer samples to identify BRCA specific methylated sites. A BayesNet model was built to distinguish BRCA patients from healthy donors. The model was validated using three Gene Expression Omnibus (GEO) independent data sets. In addition, we also carried out the Cox regression analysis to identify DNA methylation markers which are significantly related to the overall survival (OS) rate of BRCA patients and verified them in the validation cohort.
Results: We identified seven differentially methylated sites (DMSs) that were highly correlated with cell cycle as potential specific diagnostic biomarkers for BRCA patients. The combination of 7 DMSs achieved ~94% sensitivity in predicting BRCA, ~95% specificity comparing healthy vs. cancer samples, and ~88% specificity in excluding other cancers. The 7 DMSs were highly correlated with cell cycle. We also identified 6 methylation sites that are highly correlated with the OS of BRCA patients and can be used to accurately predict the survival of BRCA patients (training cohort: likelihood ratio = 70.25, p = 3.633× 10⁻¹³, area under the curve (AUC) = 0.784; validation cohort: AUC = 0.734). Stratification analysis by age, clinical stage, Tumor types, and chemotherapy retained statistical significance.
Conclusion: In summary, our study demonstrated the role of methylation profiles in the diagnosis and prognosis of BRCA. This signature is superior to currently published methylation markers for diagnosis and prognosis for BRCA patients. It can be used as promising biomarkers for early diagnosis and prognosis of BRCA.
Globally, breast cancer (BRCA) is currently the most common malignant cancer in women (Bray et al., 2018). Early detection of BRCA can significantly increase the chance of effective treatment and has a very important role in improving survival. If patients are diagnosed early, the 5-year survival rate is >90%, while the 5-year survival rate for patients with advanced BRCA is reduced to ~25% (Cardoso et al., 2018). From this, early detection of BRCA can increase the chance of effective treatment and has a very important role in improving survival. Cancer antigen 125 (CA125) is an ovarian-associated antigen found in tumors such as ovarian epithelial cancer, endometrial cancer, and breast cancer (Wang et al., 2017; Russell et al., 2019; Zang et al., 2019), which has been used as a diagnostic marker of breast cancer. The expression levels of bone sialoprotein (BSP) and osteopontin (OPN) serve as markers for lung cancer, breast cancer and prostate cancer (Fedarko et al., 2001). However, CA125 has a specificity of 97.0% in the diagnosis of breast cancer, but its sensitivity is relatively low at 25.6%. BSP (sensitivity 88.9%, specificity 96.1%) and OPN (sensitivity 95.0%, specificity 84.5%) can achieve a high accuracy rate for the diagnosis of breast cancer. But their diagnostic threshold is very close to other tumors. Therefore, it is very important to find specific diagnostic markers for breast cancer.
Studies have shown that DNA methylation abnormality, an epigenetic modification, is closely related to the occurrence and development of cancer (Hahn and Weinberg, 2002; Gu et al., 2006; Shen et al., 2017; Guo et al., 2019). The changes of DNA methylation have been observed in various types of cancers (Maruya et al., 2004; Aine et al., 2015; Nguyen et al., 2017; Bian et al., 2018; Jurmeister et al., 2019; Majumder et al., 2019; Norgaard et al., 2019). There are two patterns of cancer gene methylation which are related to cancer occurrence: genome-wide hypomethylation and promoter domain CpG island hypermethylation (Cheng et al., 2018). DNA methylation affects genes involved in different cellular pathways, Including cell proliferation, invasion and apoptosis (Gopisetty et al., 2006; Shao et al., 2018). In addition, DNA molecules in tumor cells are released into the blood as a result of apoptosis or necrosis as cell-free tumor DNA (ctDNA), where the DNA methylation of ctDNA in cancer patients have been found to be different from that in healthy individuals (Visvanathan et al., 2017). Therefore, the methylation detection of ctDNA in the blood can be used for cancer detection (Xu et al., 2017). More and more biomarkers based on methylation have been developed to help early diagnosis of cancer (Shen et al., 2017; Cheng et al., 2018; Toth et al., 2019). Wu et al. reported that DNA methylation with 4 CpGs can distinguish the healthy people and BRCA patients, with a sensitivity of over 97% and a specificity of nearly 91% (Wu et al., 2019). Core et al. found that methylation can also distinguish between BRCA patients and healthy people, with a sensitivity of more than 83% and a specificity of more than 90% (Croes et al., 2018). Both markers are good biomarkers for diagnosing BRCA. However, cancers are heterogeneous diseases, none of them considered whether other types of cancer had similar methylation changes. In this study, we identified 7 BRCA-specific methylation biomarkers by comparing BRCA to normal breast and other cancer types. And we also identified 6 CpG sites that could predict the survival of BRCA patients.
DNA methylation, gene expression, and clinical BRCA data are from the cancer genome atlas (TCGA) (International Cancer Genome Consortium et al., 2010). The data are downloaded from UCSC Xena (http://xena.ucsc.edu). DNA methylation profile was measured experimentally using the Illumina Infinium HumanMethylation 450 platform which contains 485,577 CpG sites. The methylation level is expressed as β value. Poor performing probes, cross reactive probes, Y chromosomes probes and SNP probes have been excluded in our data processing. Because the vast majority of breast cancer patients are female, the X chromosomes probes have not been excluded. R function “normalizeBetweenArrays” was be used to normalize the data between arrays function. Methylation data of another 9 [Glioblastoma (two normal, 153 cancer), Bladder Cancer (21 normal, 413 cancer), Liver Cancer (50 normal, 379 cancer), Head and Neck Cancer (50 normal, 530 cancer), Cervical Cancer (three normal, 309 cancer), Lung Adenocarcinoma (32 normal, 460 cancer), Lung Squamous Cell Carcinoma (43 normal, 372 cancer), Colon Cancer (38 normal, 309 cancer) and Rectal Cancer (seven normal, 99 cancer) cancer tissues and adjacent tissues were collected from the TCGA, and the 184 blood samples of healthy people were collected from the database GSE69270 (the profile of these cases in the Supplementary Table 1). Excluded sites were related to gender (male and female, |Δβ| > 0.2, FDR < 0.05) (Supplementary Table 2). The β values of methylation sites with missing values over 10% were deleted. The remaining missing values were estimated by the k-Nearest Neighbor (KNN) estimation method. The “limma” package(Ritchie et al., 2015) was used to calculate the methylation difference. The sites with an FDR < 0.05 and an absolute of the β value difference >0.2 were considered to be differentially methylated. The gene expression profile was measured experimentally using the Illumina HiSeq 2000 RNA Sequencing platform. For the correlation analysis of DNA methylation and gene expression, we used the R package “ChAMP” to map sites assigned to a gene. Pearson correlation test was used to obtain the correlation between them. The correlation coefficient >0.3 and the p-value < 0.05 were considered to be significant. The correlation coefficient of DMSs was obtained by Pearson correlation test, and R package “corplot” was used to plot the correlation between DMSs.
The TCGA breast cancer DNA methylation data were randomly sorted. Sixty seven percent of them (515 tumor tissues, 77 normal tissues) were used as training cohort and 33% (275 tumor tissues, 21 normal tissues) were used as validation cohort. The Wilcox test was used to find differential methylated sites (DMSs) in the training cohort (|Δβ|> 0.2, FDR < 0.05). Next, Pearson correlation test was performed on these DMSs and their corresponding genes to find sites that can drive gene expression. Then, Wilcox test was used to screen the DMSs in breast cancer samples and normal blood samples (|Δβ|> 0.2, FDR < 0.05) to eliminate the interference factors of blood. Next, these DMSs that could drive gene expression were subjected to Wilcox test (|Δβ| > 0.2, FDR < 0.05) in breast cancer and other nine tumors and para-cancerous tissues to discover breast cancer specific diagnostic biomarkers. Finally, we used the WrapperSubsetEval evaluator, which used cross-validation to evaluate the accuracy of each subset's learning scheme to assess the predictive power of each DMS and select the most representative of the DMSs as diagnostic biomarkers. The BaysNet model was built using the Weka software (version 3.8 at https://waikato.github.io/weka-wiki/downloading_weka/). Weka is a machine learning software which tries and tests open source. Our goal was to build a classifier from sample information with known histological characteristics (whether it is BRCA tissue) and use the classifier to predict whether the sample to be tested is BRCA tissue. We constructed a classifier based on the β value of the BRCA-specific DMSs of the training cohort. The classifier compares the characteristics of the DMSs in BRCA tissues and BRCA para-cancerous tissues. Then we learned various thresholds or rules and stored them in the constructed classifier. For learning Bayesian network, we leveraged the K2 algorithm (Lerner and Malka, 2011). Three other independent data sets GSE66695, GSE60185 (Fleischer et al., 2014) and GSE78754 (Mathe et al., 2016) are used as external test cohort. We also organized the profile of the three external test cohort (Supplementary Tables 3–5).
Prognostic markers were selected from 776 BRCA patients with methylation data and clinical information. They are shuffled and randomly reordered. Sixty seven percent of them were the training cohort (517 cases) and 33% of them were the validation cohort (259 cases). The univariate Cox proportional hazard analysis was performed in the training cohort to find the methylation sites significantly related to the survival of patients. Then, in univariate analysis, the sites that were significantly related to OS were included in the multivariate Cox regression analysis, and a model containing all possible combinations of 2 to 6 factors was constructed to select the best combination of biomarkers. The R-package “mass” was used for analysis.
PPI (protein protein interaction) network, KEGG (Kyoto Encyclopedia of Genes and Genomes) pathway analysis, and GO (Gene Ontology) pathway were analyzed by the STRING database. Line color indicated the type of interaction evidence, minimum required interaction score was 0.70. The R-package “ggplot” and “GOplot” was used for plotting.
In order to explore the biological pathways of CpG markers, Gene Set Enrichment Analysis (GSEA) was used (Subramanian et al., 2005). The annotated c2.cp.kegg.v6.2.symbols.gmt gene set is regarded as the reference gene set. The critical criterion was p-value < 0.05 and q-value < 0.25
Four DNA methylation datasets were collected from the Gene Expression Omnibus (GEO) database: GSE66695 (80 breast cancer, 40 normal), GSE78754 (Mathe et al., 2016) (80 breast cancer), GSE60185 (Fleischer et al., 2014) (239 breast cancer, 46 normal), and GSE69270 (Kananen et al., 2016) (normal blood).
The assay was carried out according to the method mentioned in the previous study (Song et al., 2020). We collected breast cancer tissues of patients from the First Affiliated Hospital of China Medical University for Immunohistochemistry (IHC) assay. The IHC antibodys were ordered from BOSTER Biological Technology co.ltd (USA).
Differential methylation calculated from mean (β value- cancer)–mean (β-value- normal). Wilcox test was used to determine the different methylation sites between tumor and normal tissues. Use the false discovery rate (FDR) method to adjust the p-value. The sites with an absolute difference of β-value > 0.2 and FDR < 0.05 are considered to be differentially methylated. The hazard ratio (HR) and the corresponding 95% confidence interval (CI) were evaluated by the Cox proportional risk model. The ROC analysis was performed by the proc package to determine the area under the curve (AUC). All data analyses were performed with R (R version 3.5.4).
DNA methylation of 790 BRCA tumor samples and 98 adjacent normal tissue samples obtained from TCGA were used for differential methylation analysis. Sixty seven percent of the samples were used as training cohort, and 33% were used as validation cohort (Table 1). The Wilcox test was used to find differential methylated sites (DMSs) in the training cohort (|Δβ|> 0.2, FDR < 0.05). Pearson correlation test was performed on these DMSs to find the DMSs that can drive gene expression (| r |> 0.3, p < 0.05) (Supplementary Table 6). There were 2,362 hypermethylated and 2,322 Hypomethylated DMSs in BRCA (Figure 1A), which correspond to 1,157 hypermethylation and 989 hypomethylated genes. We then analyzed the distribution of DMSs in different genomic regions. The hypermethylation and hypomethylation sites were mainly located in the opensea, and the second hypermethylation sites were mainly located in the island, while the hypomethylation sites island, shore and shelf had obvious distribution (Figure 1B). From the point of view of gene distribution, DMSs were mainly distributed on the body, but the vicinity of the promoter region was mainly concentrated by hypermethylation sites. The distribution of hypomethylation sites was relatively broad (Figure 1C). This was consistent with the general characteristics of solid tumor DNA methylated.
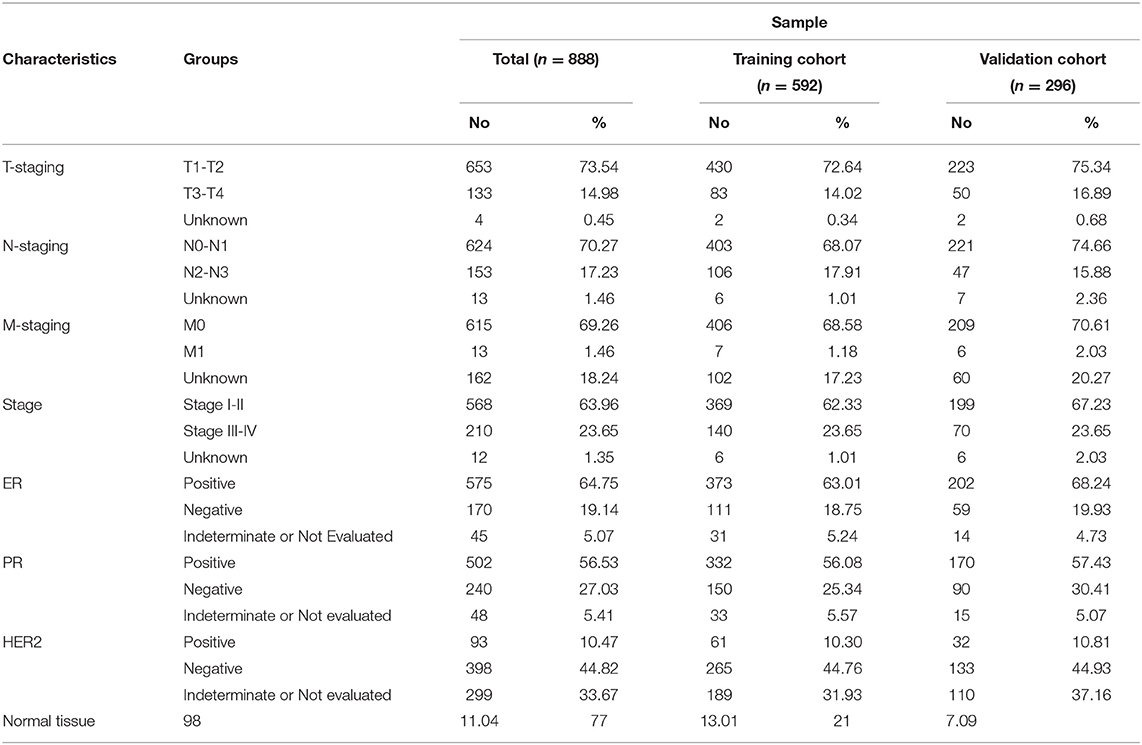
Table 1. Clinicopathological characteristics of BRCA sample.
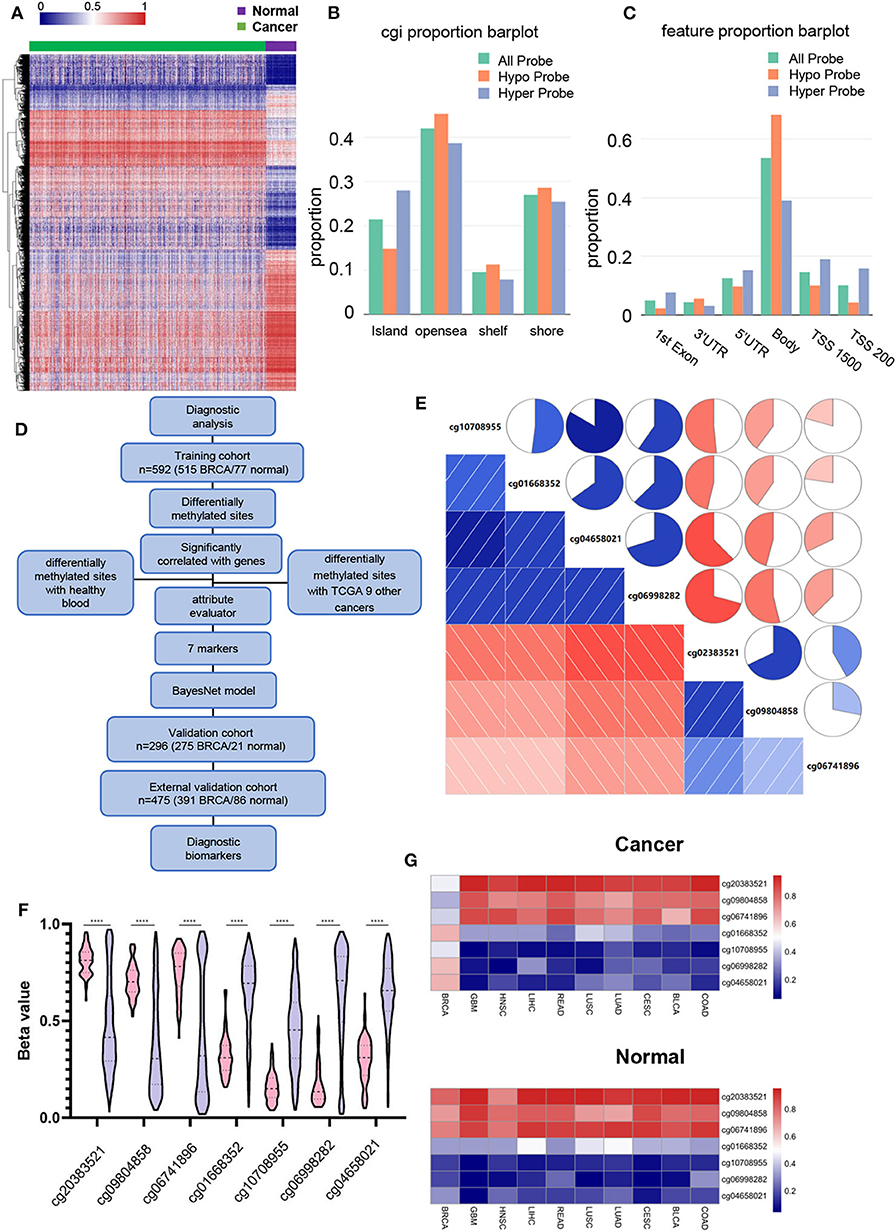
Figure 1. Identifying BRCA-specific differentially methylated sites. (A) Heatmap of the differentially methylated sites, contains 2,362 hypermethylated and 2,322 Hypomethylated DMSs. Green are cancer tissues and purple are normal tissues. (B) Differential methylation sites distribution in CpG island, opensea, shelf, and shore. The DNA methylation sites between genes have been omitted. (C) Differentially methylated the distribution of DMS based on the distance to the TSS. (D) Flowchart for finding BRCA candidate diagnostic biomarkers. (E) Correlation between 7 DMSs. The square and circle symbols represent the one-to-one correlation coefficient. Blue indicated the positive correlation, and red indicated the negative correlation. Each correlation coefficient was shown by the shadow intensity and increased uniformly as the correlation value starts from 0 to 1. (F) Methylation level of 7 DMSs in BRCA and normal tissues. Pink represents normal tissue, purple represents BRCA tissue. (G) The sites mean β value show the methylation levels of 7 BRCA markers in BRCA and nine other cancers.
In order to find the specific diagnostic biomarkers of BRCA, we designed a workflow (Figure 1D). Filtration was performed using methylation data from healthy human blood (GSE69270). Two thousand six hundred and forty three DMSs that were differentially methylated between BRCA (|Δβ| > 0.2, FDR < 0.05) and healthy individuals' blood were left. Secondly, we screened the differentially expressed DMSs of the above breast cancers with other nine common cancers and their corresponding adjacent tissues (|Δβ| > 0.2, FDR < 0.05). There were still 17 DMSs with methylation differences in BRCA and other cancers and adjacent tissues. Finally, we used the WrapperSubsetEval evaluator, which used cross-validation to evaluate the accuracy of each subset's learning scheme to assess the predictive power of each DMS and select the most representative of the 7 DMSs (cg20383521, cg09804858, cg06741896, cg01668352, cg10708955, cg06998282, cg04658021) (Table 2). The 7 DMSs had a significant correlation with the corresponding gene expression (Supplementary Figure 1). These 7 DMSs were significantly correlated with each other (p < 0.05), Among them, cg10708955 and cg04658021 had the strongest correlation (r = 0.803), indicating that the 7 DMSs might jointly mediate the occurrence of BRCA (Figure 1E). They were differentially methylated between BRCA and normal tissues (Figure 1F). Unsupervised cluster analysis revealed that BRCA samples were well-differentiated from normal tissues, indicating the robustness of our results (Supplementary Figure 2). Similarly, 7 DMSs were also different methylate between BRCA and other cancer tissues (Figure 1G).
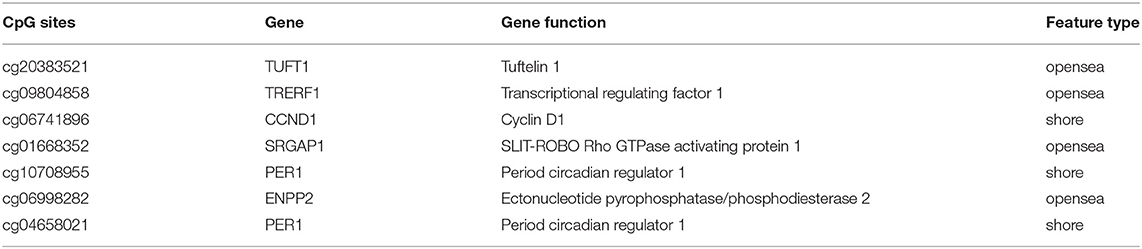
Table 2. The 7 DMSs for BRCA diagnosis.
Next, we built a BayesNet model based on 7DMSs through the TCGA training cohort data. We tested the model accuracy in the TCGA validation cohort. Three independent methylation data sets (GSE66695, GSE60185, and GSE78754) of BRCA were used as external test sets. Our model had a training cohort of AUC = 0.994 and a validation cohort of AUC = 0.974 (Figures 2A,B). We then compared our results to previously published methylation markers, Wu et al. reported that DNA methylation with four CpGs could distinguish BRCA patients from healthy individuals (Wu et al., 2019). Core et al. found that methylation could also distinguish between BRCA patients and healthy people (Croes et al., 2018). The sensitivity and specificity of distinguishing between normal breast and breast cancer were high among different feature sets (Figure 2C). Next, we examined the ability of different methylation markers to distinguish between BRCA and other cancers. When our BRCA-specific markers were used in our study, few tumors and normal tissues of other cancers were predicted to be BRCA (0–19.8%, median 13.4%). However, 89.5–100% (median 98.1%) of other cancers and normal tissue were expected to be BRCA using markers from Wu et al. And markers from Croes et al. (2018) 43.4–91.7% (median 66.5%) of other cancers and normal tissue were expected to be BRCA (Figure 2D). Therefore, our study found highly specific biomarkers for BRCA diagnosis.
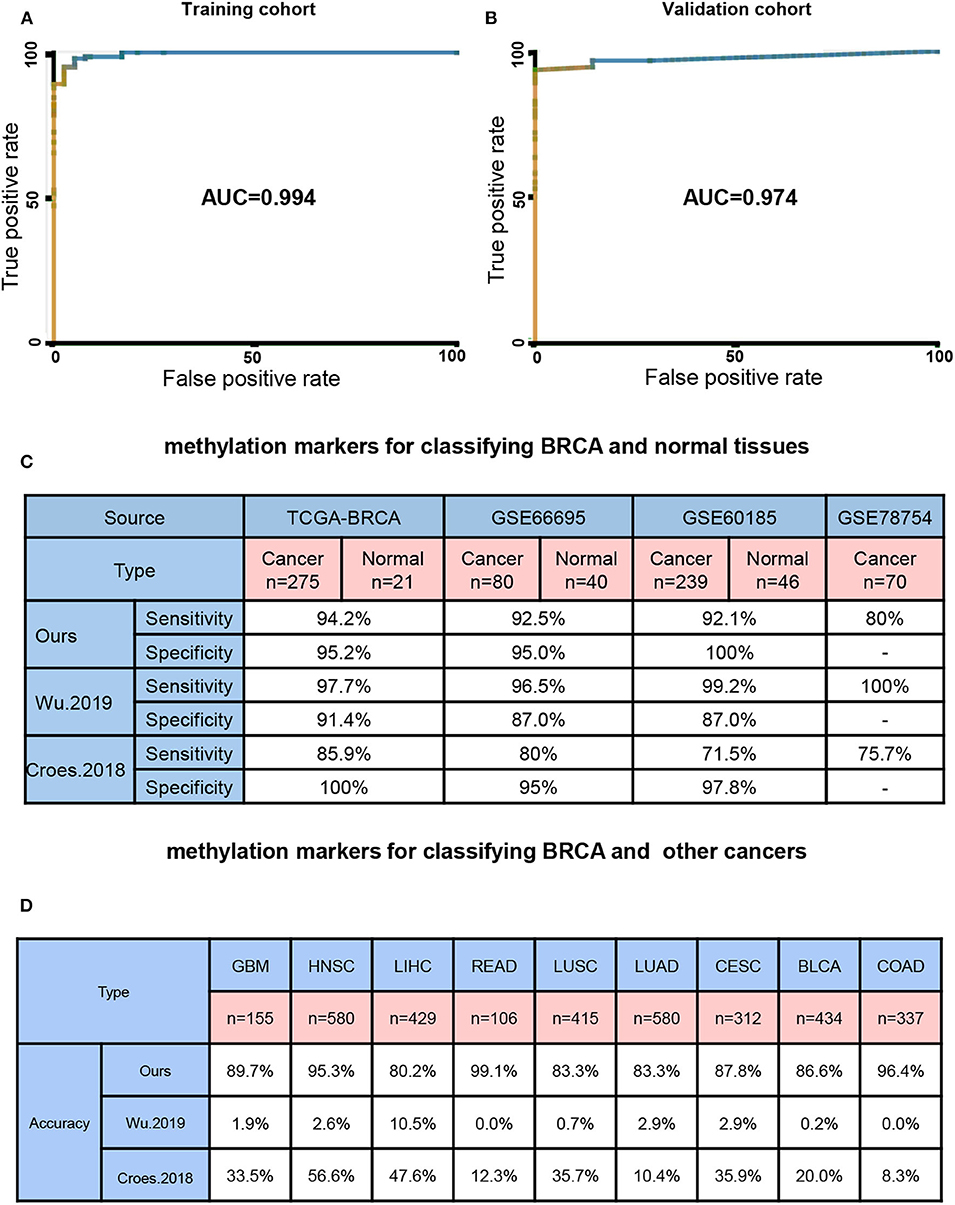
Figure 2. Seven BRCA-specific differential methylation sites as a diagnostic biomarker. (A) model training cohort ROC curve area measurement. (B) Model validation cohort ROC curve area measurement. (C) Four different source sets test the correct rate of the 7 DMSs model and other models. (D) Nine other cancers set test the 7 DMSs model and other models correct rate.
In order to further investigate the correlation between these 7 newly discovered DMSs and BRCA progression, we investigated whether their corresponding genes are differentially expressed in breast cancer in the TCGA gene expression data. The results shown that the expression of TRRERF1, PER1, TUFT1, CCND1, and ENPP2 genes was significantly different in breast cancer and adjacent tissues (p < 0.0001) (Figure 3A). Considering potential clinical significance and biologic implications, we performed immunohistochemistry (IHC) to evaluate the expression of CCND1 and PER1 in 14 paired BRCA and adjacent tissue. The results confirmed that CCND1 was highly expressed in breast cancer tissues and PER1 was low expressed in breast cancer tissues, which is consistent with the results of our data analysis (Figure 3B). To explore the biological behavior that our markers may be involved in, we constructed a PPI expression network using the STRING database for 6 DNA methylation-driven genes mapped by the 7 DMSs. There were only four genes: TRERF1, CCND1, PER1 and ENPP2 forming networks, TUFT1 and SRGAP1 did not form networks with other genes. The other genes in the network were all reported to be related to these four genes (Figure 3C). KEGG pathway analysis indicated these pathways were significantly correlated with these genes: Cell cycle, p53 signaling pathway, Pathways in cancer, Breast cancer, PI3K-Akt signaling pathway, Proteoglycans in cancer, Transcriptional misregulation in cancer (p < 0.05) with the most significant related pathway was “Cell cycle” (p = 9.79 × 10−09) (Figure 3D). At the same time, GO pathway analysis shown that the mitotic cell cycle phase transition was significantly correlated with these genes (p < 0.05) (Figure 3E). Among them, a number of biological processes were related to the cell cycle. This suggests that our 7 DNA methylation signature may be involved in the regulation of the cell cycle.
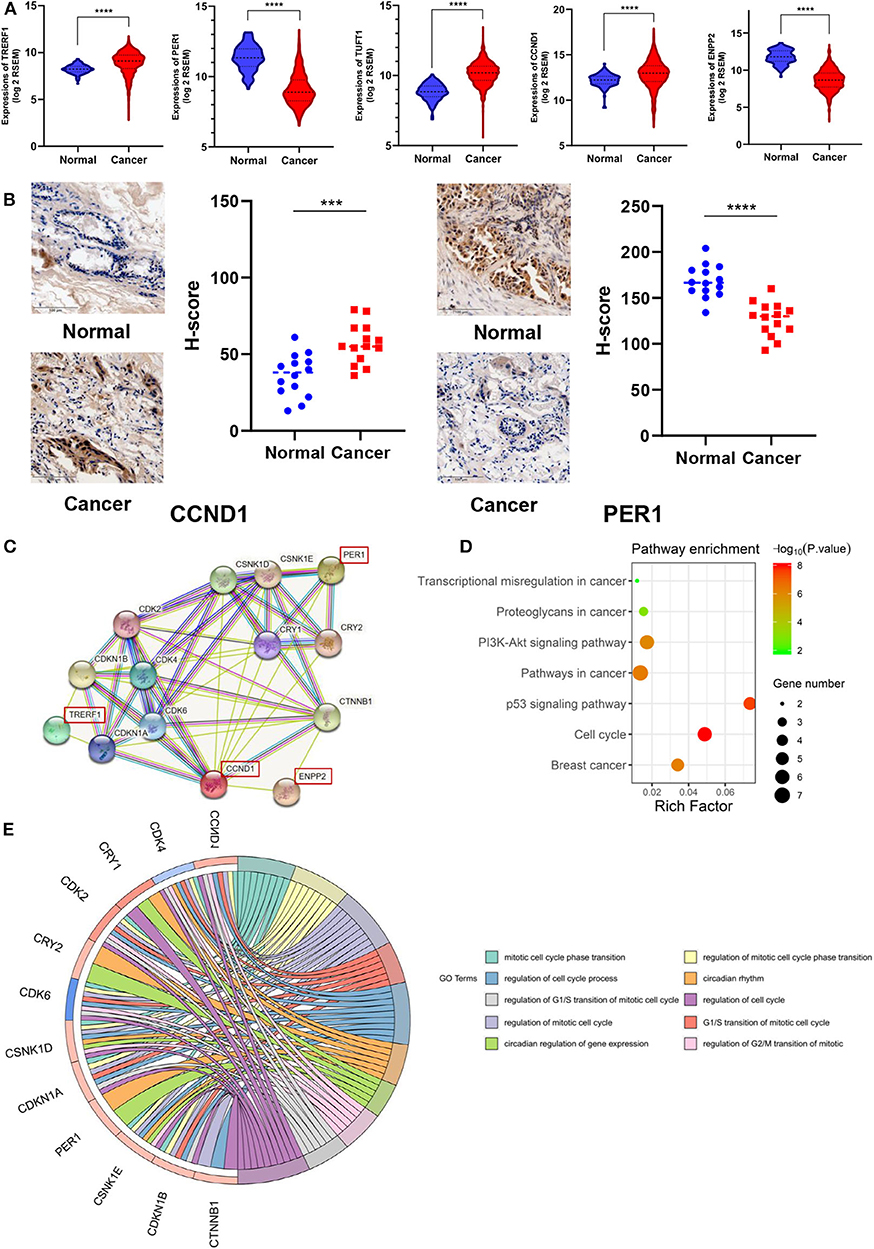
Figure 3. Association of 7 DNA methylation signatures with the cell cycle. (A) DMSs corresponding genes expression in TCGA. (B) CCND1 and PER1 protein expression in 14 paired BRCA and adjacent tissue by IHC assay. (C) PPI expression network for six genes corresponding to the seven methylation sites. (D) The KEGG pathway analysis of the mRNA of the PPI network map of the seven methylation sites corresponding gene. The vertical axis is the enriched pathway, and the horizontal axis is the number of genes enriched in this pathway compared to the number of genes on this pathway. (E) GO enrichment analysis. The circle indicates the correlation between the methylation-driven mRNAs and their gene ontology terms.
We also designed a workflow to screen BRCA prognostic biomarkers (Figure 4A). The clinicopathological characteristics of BRCA patients in training cohort and validation cohort are summarized in Table 3. By performing a univariate Cox proportional hazards regression analysis in the training cohort, a total of 611 DNA methylation sites were significantly associated with OS in BRCA patients (p < 1 × 10⁻³), and they were used as candidate markers (Supplementary Table 7). Subsequently, these candidate markers were used to perform multivariate Cox stepwise regression analyses. Finally, the 6 methylation sites (cg04747226, cg04544154, cg16814416, cg03951219, cg17080504, cg19458602) was selected as the best prognosis model to predict OS (Figure 4B). The risk scoring formula was as follows:
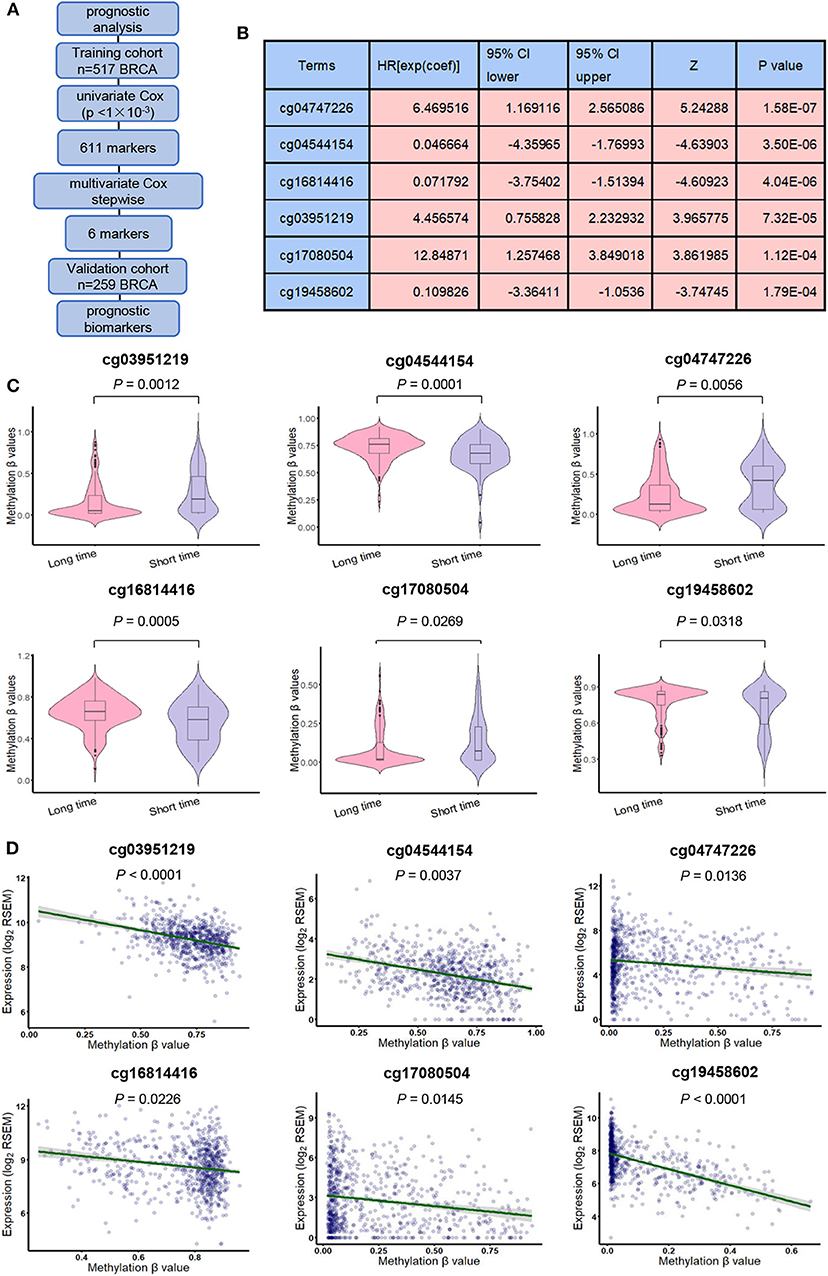
Figure 4. Derivation of prognostic DNA methylation markers. (A) The flowchart for finding BRCA candidate prognostic biomarkers. (B) General characteristics of univariate Cox regression analysis of six methylation biomarkers. (C) methylation β values in short survival (OS <5 years) patients and long survival (OS > 5 years) patients. (D) Pearson correlation test was used to evaluate the correlation between gene expression and methylation level.
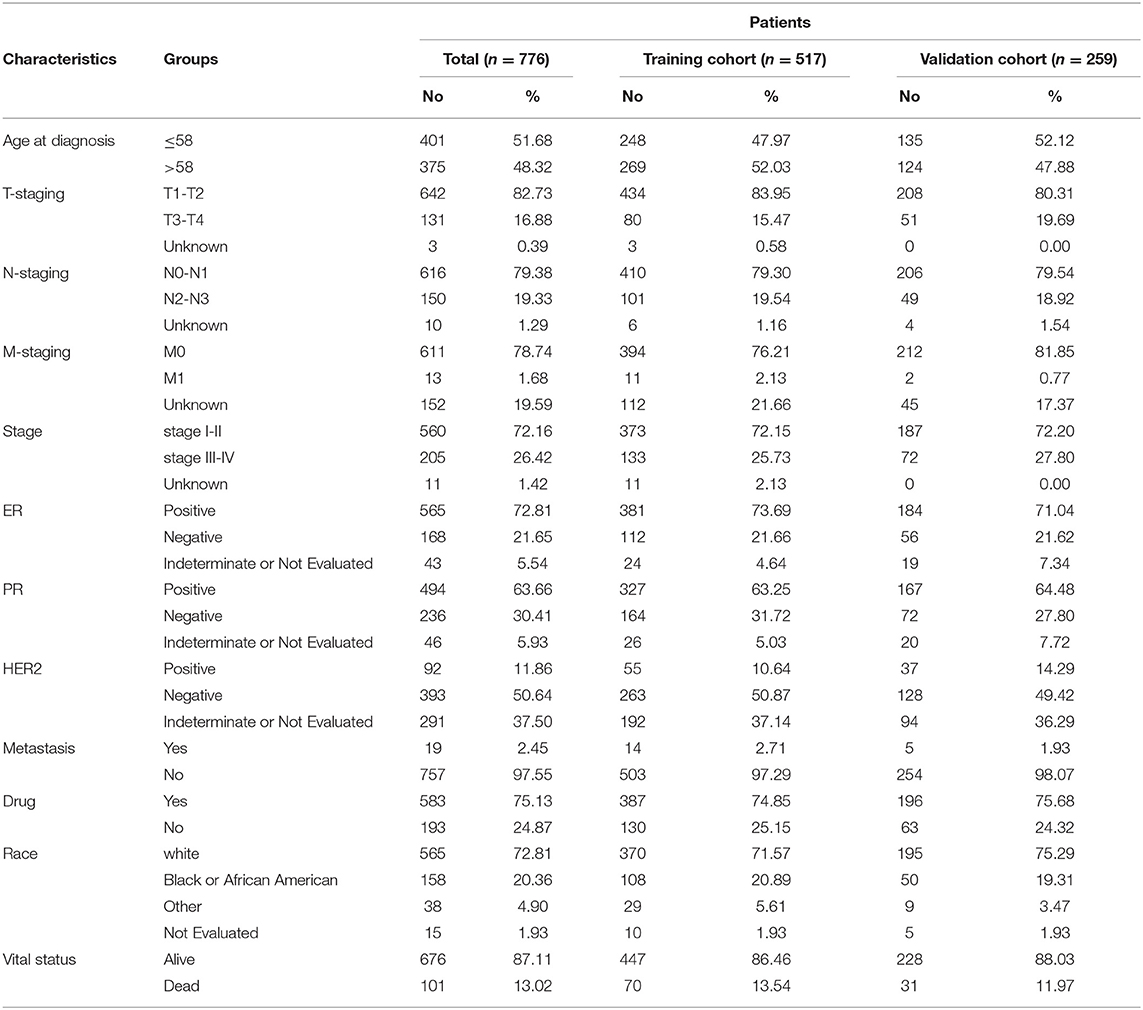
Table 3. Clinicopathological characteristics of BRCA patients from TCGA database.
RiskScore = 1.78920 × cg04747226–1.97075 × cg04544154–2.92310 × cg16814416 + 1.69264 × cg03951219 + 1.84526 × cg17080504–2.33118 × cg19458602.
The risk score indicates the chance of belonging to low-risk or high-risk group. Among the 6 methylation sites, cg04747226, cg03951219, and cg17080504 had positive correlation coefficients, indicating that their high DNA methylation level may be related to the short OS. cg04544154, cg16814416, and cg19458602 had negative correlation coefficients, indicating that their high DNA methylation level might be related to the longer OS. At the same time, for these 6 DNA methylation sites, DNA methylation levels were significantly different between patients exhibiting long-term (> 5 years) and short-term (<5 years) survival. cg04747226, cg03951219and cg17080504 shown long-term survival in patients who tended to have lower methylation levels, while cg04544154, cg16814416and cg19458602 shown long-term survival in patients who tend to have higher methylation levels (p < 0.05, Figure 4C). Then, we analyzed the correlation between these 6 methylation sites and their corresponding genes and found that they were significantly associated with the corresponding genes (p < 0.05, Figure 4D).
In order to understand the accuracy of 6 DNA methylation markers in predicting the survival, the median of β-value of these sites were used as the cut-off point to distinguish between the high and low risk groups, the value of AUC was calculated by time-dependent ROC analysis, overall survival for outcome variable. In the validation cohort, Kaplan Meier survival analysis was performed on these six markers, and the AUC was calculated. The AUC of the 6 CpG sites in the validation set could reach more than 0.6, and the KM curve could effectively distinguish the high-risk and low-risk groups (Figure 5A). However, after combining them (the median of risk score as cutoff), the 6 DNA methylation markers had a good predictive ability for patient OS in the training and validation cohort. the AUC = 0.784 (Figure 5B) and 0.734 (Figure 5C), respectively. These results indicate that the six methylation markers have high sensitivity and specificity, the markers may have great potential in clinical application as prognostic biomarkers.
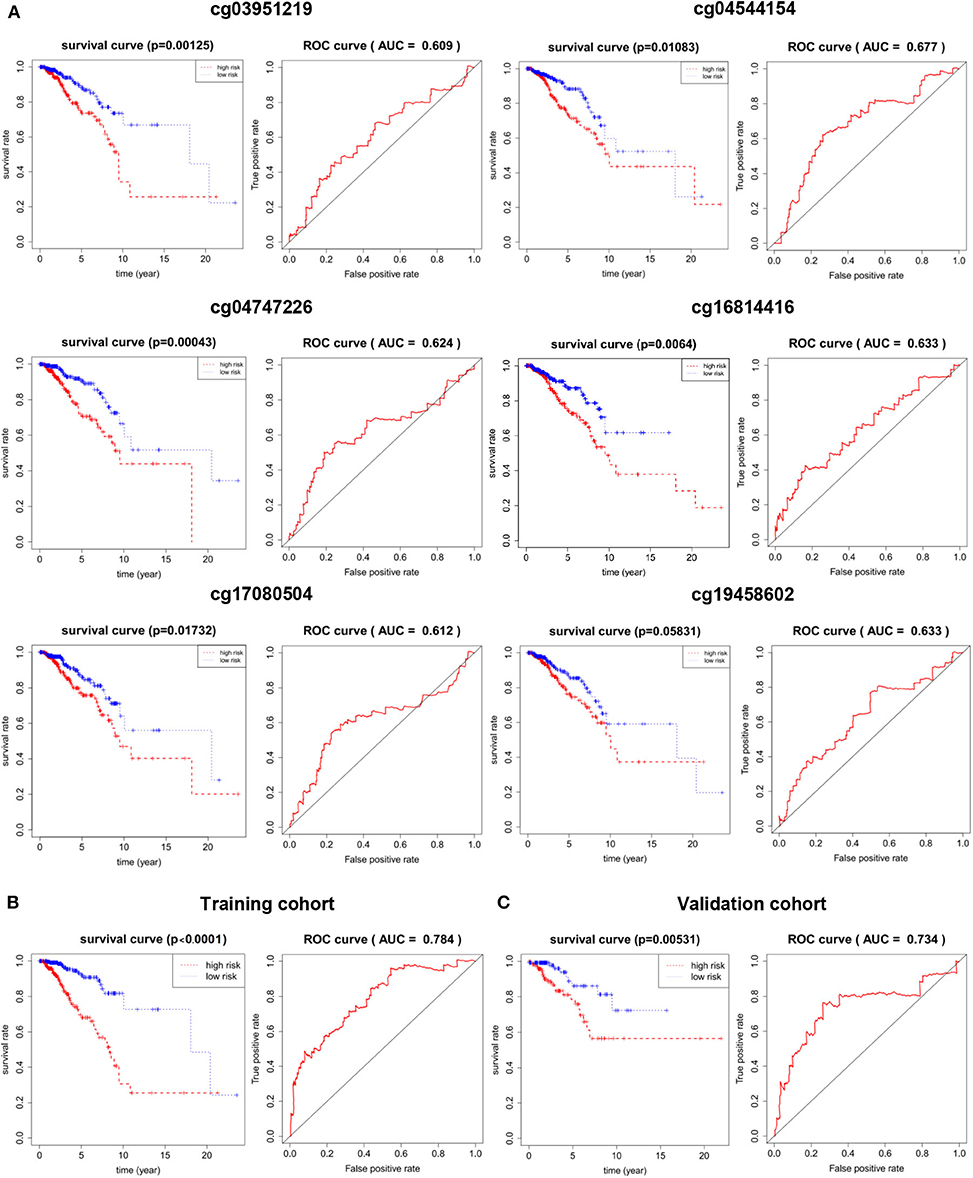
Figure 5. The prognostic potential of the 6 DNA methylation markers. (A) single site of methylation of breast cancer predicted and Kaplan-Meier survival analysis of the AUC of the ROC curve area. (B) Kaplan-Meier survival analysis and sensitivity and specificity for ROC analysis of predictive the power of 6 DNA methylation markers in predicting OS in patients in the training cohort. (C) Kaplan-Meier survival Analysis and ROC analysis in validation cohort.
An excellent prognostic marker should be independent of the current clinical pathological prognostic indicators or be able to cooperate with them. Clinical and pathological features, such as patient age, clinical stage, and tumor classification, were also considered to be major predictors of prognosis in breast cancer patients. In order to evaluate the independence and applicability of 6 DNA methylation markers, patients were recombined according to different clinicopathological characteristics. Considering that the clinical staging, type, and clinical medication of BRCA can affect the prognosis, we regrouped patients based on different clinical characteristics. According to the progress of breast cancer, we divided the patients into early stage (stage I-II) and advanced stage (stage III-IV). Although the disease progression of these two groups of patients was markedly different, the OS between high-risk and low-risk populations are significantly different (p < 1 × 10⁻³). AUC of the early and advanced stage cohorts were 0.752 and 0.796, respectively (Figure 6A). According to PAM50 classification, we divided the BRCA patients into four subtypes: luminal A, luminal B, HER2+ and basal-like. Kaplan–Meier and ROC analysis shown that there was too few results in no statistical significance in Kaplan–Meier analysis without the cases of HER2 patients, the survival rate of patients in the low-risk group was greatly improved compared to the high-risk group (p < 0.05), and the 6 DNA methylation markers had high predictive performance (AUC > 0.70) (Figure 6B). Chemotherapy is one of the main treatments for BRCA. Considering the influence of drug treatments on the phenotype of patients, we divided breast cancer patients into chemotherapy group and non-chemotherapy group. Our biomarker performed well in both groups, with the patients in the low-risk group shown a better trend of OS (p < 1 × 10⁻³, AUC >0.65) (Figure 6C). In addition, many prognostic markers of BRCA have been reported: CD24, EGFR, CXCR 4 genes can predict the metastasis and prognosis of breast cancer. At the same time, Zhang et al. reported that the DNA methylation of 12 genes could be used as a prognostic marker of BRCA (Zhang et al., 2015). Tao et al. reported that seven differentially DNA methylation sites could be used as a novel prognostic biomarker for BRCA (Tao et al., 2019). In order to determine whether our biomarkers had a better ability to predict patient survival than known biomarkers, ROC analysis of other biomarkers was performed in the same way in the validation cohort. The results shown that the AUC of these 6 DNA methylation markers was higher than that of all other known biomarkers in the validation cohort. The results of ROC analysis showing that the 6 DNA methylation sites are better markers and provide better stability and reliability in predicting the OS of BRCA patients (Figure 6D).
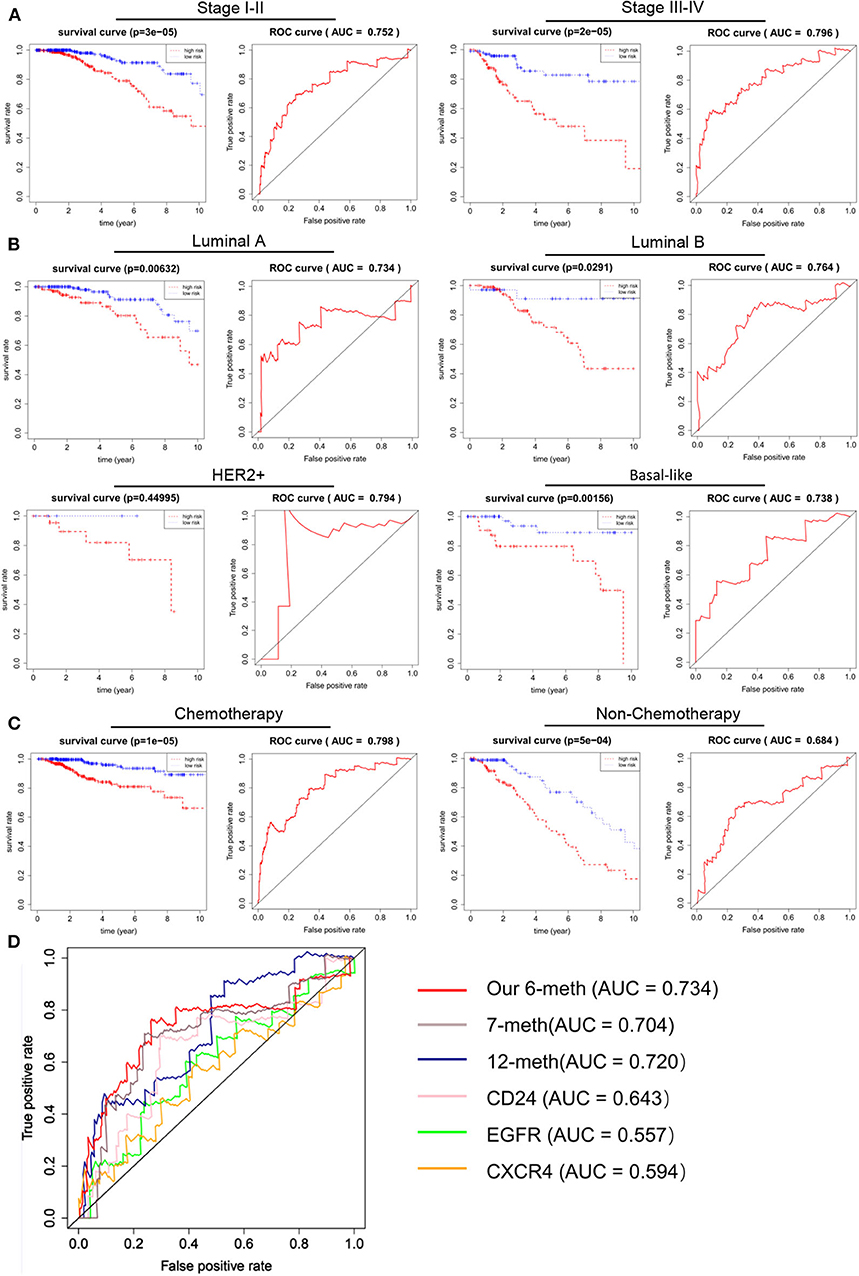
Figure 6. Independence of 6 DNA methylation markers in OS prediction, and comparison with reported markers. A Kaplan–Meier and ROC analysis were performed on patients with different stages of BRCA. Stage I-II (N = 560, 72.16%), Stage III-IV (N = 205, 26.42%). (B) Kaplan–Meier and ROC analyses were performed on BRCA patients with different phenotypes. According to their tumor phenotype, luminal A breast cancer (N = 277, 35.70%), luminal B breast cancer (N = 126, 16.24%), HER2+ breast cancer (N = 29, 3.74%) and basal-like breast cancer (N = 85, 10.95%). (C) Kaplan–Meier and ROC analysis were performed on BRCA patients with different treatment regimens. Grouped according to whether they were undergoing chemotherapy. After chemotherapy (N = 583, 75.13%), no chemotherapy (N = 193, 24.87%). (D) The ROC curve shows the sensitivity and specificity of our 6 DNA methylation markers and other known biomarkers in predicting patient OS based on the TCGA validation data set.
The above analysis shows that our 6 CpG sites could distinguish between the high and low risk groups of breast cancer. In order to explore the mechanism, we conducted the Gene Set Enrichment Analysis (GSEA) KEGG analysis on high and low-risk individuals to explore the possible pathways of 6 CpG sites. We found that the gene expression of the high-risk population identified by the 6 CpG sites model was mainly enriched in the biological behaviors of DNA replication and cell cycle (Figure 7A). We then calculated the correlation between these 6 CpG sites and the genes in the two pathways and found that these 6 CpG sites had significant correlation with many genes of the two pathways (Figure 7B, Supplementary Table 8). This suggested that the underlying biological mechanism of the 6 CpG sites model we found may be related to DNA replication and cell cycle.
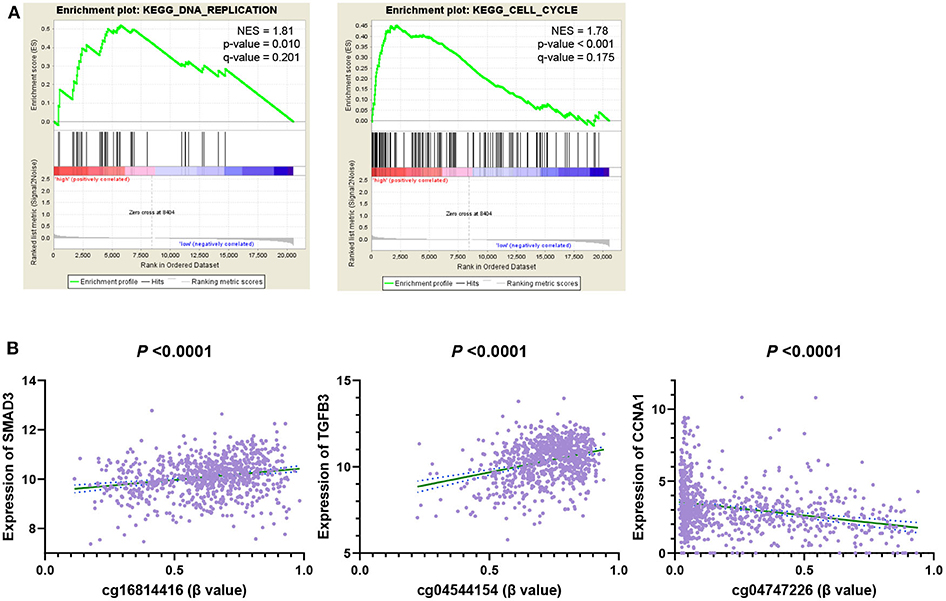
Figure 7. GSEA analysis 6 DNA methylation site driven gene related pathway. (A) GSEA KEGG Pathways enrichment analysis genes of high-risk individuals. (B) The correlation between 6 CpG markers and genes in the enrichment pathway.
Previous studies have suggested that mutations in genes leading to changes in DNA sequences, activation of oncogenes, and inactivation of tumor suppressor genes are major mechanisms of tumorigenesis (Gough et al., 1990; Hahn and Weinberg, 2002; Domchek et al., 2013; Ablain et al., 2018; Poillet-Perez et al., 2018). With the deepening of research on cancer, researchers have found that abnormal regulation mechanisms other than DNA sequences, that is, epigenetic changes also play a key role in tumorigenesis and development (Berdasco and Esteller, 2010). The occurrence and development of breast cancer is a multi-step, multi-stage process, which is considered to be the result of accumulation of genetic and epigenetic variations (Widschwendter et al., 2018). Therefore, it is reasonable and valuable to study the epigenetic mechanisms in the progression of breast cancer to identify clinically applicable biomarkers.
In this study, we systematically analyzed the whole genome methylation data and gene expression data of breast cancer. By comparing BRCA, normal tissue and non-BRCA cancer, we identified seven methylation sites as BRCA specific diagnostic biomarkers. BayesNet model was constructed to predict the diagnosis of BRCA. The sensitivity was 94.2%, and the accuracy was 95.2%. Our 7 CpG sites diagnostic biomarkers had better sensitivity and specificity than most of the previously reported biomarkers and had been verified in a variety of databases. Finally, the abnormal expression of several related genes was verified through experiments. These results provide new insights into the role of DNA methylation in the diagnosis of breast cancer.
Ideal diagnostic biomarkers should be highly sensitive to detect BRCA at an early stage; specific to BRCA and not found in other cancers; measured by non-invasive and cost-effective techniques; and in different populations authenticating. Here, we found 7 BRCA specific differentially methylated sites, which are superior to the widely used serum biomarker CA125 in sensitivity and specificity. However, we have not used non-invasive biological samples to verify their diagnostic ability. In order to solve this problem, we will continue to develop a technique for detecting the methylation level of cell-free ctDNA in serum. Then we will verify the consistency of methylation in tissues and blood and verify the prediction ability of biomarkers by detecting DNA methylation in blood.
In routine clinical practice, some clinicopathological features are used to assess possible prognosis in breast cancer patients, such as tumor size, histological grade, tumor stage, lymph node metastasis, etc. Second, different molecular subtypes of breast cancer also suggest different prognosis. Studies have shown that triple-negative breast cancer tends to have higher tumor grades, higher risk of lymph node metastasis or distant metastasis, and relatively lack of effective treatments, resulting in lower tumor-free survival rate (Liedtke et al., 2008). The results shown that our signature was in dependent of the tumor stage, molecular subtype, or medication.
In addition, Cox regression analysis was carried out on six different methylation sites. Kaplan Meier and ROC analysis shown that each DNA methylation site could also distinguish high-risk and low-risk patients, but the prediction performance was lower than the combination of these 6 DNA methylation sites in the validation cohort, suggesting that a single methylation site may play a role in prognosis prediction, and the combination of methylation sites may provide a better potential to predict OS in BRCA patients.
In summary, our study demonstrated the role of methylation profiles in the diagnosis and prognosis of BRCA. We identified BRCA specific methylation markers to distinguish BRCA tissues from normal tissues. Moreover, our study can also distinguish breast cancer from other cancers. At the same time, we found the BRCA prognostic markers, stratification analysis by clinical stage, tumor types, and chemotherapy retained statistical significance.
Publicly available datasets were analyzed in this study. This data can be found here: https://cancergenome.nih.gov, https://www.ncbi.nlm.nih.gov/geo/.
The studies involving human participants were reviewed and approved by Ethics Committee of China Medical University belongs to the China Medical University. The patients/participants provided their written informed consent to participate in this study.
MZ conceived and designed the study. YiW provided help for the specific ideas of the article. The data were analyzed by YaW and LJ. XL provided part of the code of the R Language. HG, MW, and LZ reviewed and edited the manuscript. All authors read and approved the manuscript.
This work was supported by grants from National Natural Science Foundation of China (Nos. U1608281, 81703560, and 81573462), Liaoning Revitalization Talents Program (No. XLYC1807201), and Shenyang S&T Projects (No. 19-109-4-09).
The authors declare that the research was conducted in the absence of any commercial or financial relationships that could be construed as a potential conflict of interest.
The Supplementary Material for this article can be found online at: https://www.frontiersin.org/articles/10.3389/fcell.2020.529386/full#supplementary-material
Supplementary Figure 1. The correlation between 7 DMSs and corresponding genes. Pearson correlation test was used.
Supplementary Figure 2. Unsupervised cluster analysis of 7 DMSs in BRCA and adjacent tissues.
Supplementary Table 1. Profile of healthy blood sample (GSE69270).
Supplementary Table 2. Differentially methylated sites in the blood (GSE69270).
Supplementary Table 3. The profile of GSE66695.
Supplementary Table 4. The profile of GSE60185.
Supplementary Table 5. The profile of GSE78754.
Supplementary Table 6. The DMSs were significantly correlated with corresponding gene expression.
Supplementary Table 7. DNA methylation sites associated with OS significant.
Supplementary Table 8. Genes significantly related to 6 CpG sites on DNA replication and cell cycle pathways.
BRCA, breast cancer; GBM, Glioblastoma multiforme; BLCA, Bladder Urothelial Carcinoma; LIHC, Liver hepatocellular Carcinoma; HNSC, Head and Neck squamous cell carcinoma; CESC, Cervical squamous cell carcinoma and endocervical adenocarcinoma; LUAD, Lung Adenocarcinoma; LUSC, Lung Squamous Cell Carcinoma; COAD, Colon adenocarcinoma; READ, Rectum adenocarcinoma; TCGA, Cancer Genome Atlas; GEO, Gene Expression Omnibus; OS, overall survival; DMS, differentially methylated site; CA125, Cancer antigen 125; ctDNA, cell-free tumor DNA; FDR, false discovery rate; KEGG, Kyoto Encyclopedia of Genes and Genomes; GSEA, Gene Set Enrichment Analysis; KNN, k-Nearest Neighbor; RSEM, RNA-Seq by Expectation-Maximization; PPI, Protein-Protein Interaction; HR, hazard ratio; CI, confidence interval; AUC, area under the curve; GO, gene ontology; FC, fold change.
Ablain, J., Xu, M., Rothschild, H., Jordan, R. C., Mito, J. K., Daniels, B. H., et al. (2018). Human tumor genomics and zebrafish modeling identify SPRED1 loss as a driver of mucosal melanoma. Science 362, 1055–1060. doi: 10.1126/science.aau6509
Aine, M., Sjodahl, G., Eriksson, P., Veerla, S., Lindgren, D., Ringner, M., et al. (2015). Integrative epigenomic analysis of differential DNA methylation in urothelial carcinoma. Genome Med. 7:23. doi: 10.1186/s13073-015-0144-4
Berdasco, M., and Esteller, M. (2010). Aberrant epigenetic landscape in cancer: how cellular identity goes awry. Dev. Cell. 19, 698–711. doi: 10.1016/j.devcel.2010.10.005
Bian, S., Hou, Y., Zhou, X., Li, X., Yong, J., Wang, Y., et al. (2018). Single-cell multiomics sequencing and analyses of human colorectal cancer. Science 362, 1060–1063. doi: 10.1126/science.aao3791
Bray, F., Ferlay, J., Soerjomataram, I., Siegel, R. L., Torre, L. A., and Jemal, A. (2018). Global cancer statistics 2018: GLOBOCAN estimates of incidence and mortality worldwide for 36 cancers in 185 countries. CA Cancer J. Clin. 68, 394–424. doi: 10.3322/caac.21492
Cardoso, F., Senkus, E., Costa, A., Papadopoulos, E., Aapro, M., Andre, F., et al. (2018). 4th ESO-ESMO international consensus guidelines for advanced breast cancer (ABC 4)dagger. Ann. Oncol. 29, 1634–1657. doi: 10.1093/annonc/mdy192
Cheng, J., Wei, D., Ji, Y., Chen, L., Yang, L., Li, G., et al. (2018). Integrative analysis of DNA methylation and gene expression reveals hepatocellular carcinoma-specific diagnostic biomarkers. Genome Med. 10:42. doi: 10.1186/s13073-018-0548-z
Croes, L., Beyens, M., Fransen, E., Ibrahim, J., Vanden Berghe, W., Suls, A., et al. (2018). Large-scale analysis of DFNA5 methylation reveals its potential as biomarker for breast cancer. Clin. Epigenetics 10:51. doi: 10.1186/s13148-018-0479-y
Domchek, S. M., Jhaveri, K., Patil, S., Stopfer, J. E., Hudis, C., Powers, J., et al. (2013). Risk of metachronous breast cancer after BRCA mutation-associated ovarian cancer. Cancer 119, 1344–1348. doi: 10.1002/cncr.27842
Fedarko, N. S., Jain, A., Karadag, A., Van Eman, M. R., and Fisher, L. W. (2001). Elevated serum bone sialoprotein and osteopontin in colon, breast, prostate, and lung cancer. Clin. Cancer Res. 7, 4060–4066. Available online at: https://clincancerres.aacrjournals.org/content/7/12/4060.long
Fleischer, T., Frigessi, A., Johnson, K. C., Edvardsen, H., Touleimat, N., Klajic, J., et al. (2014). Genome-wide DNA methylation profiles in progression to in situ and invasive carcinoma of the breast with impact on gene transcription and prognosis. Genome Biol 15:435. doi: 10.1186/s13059-014-0435-x
Gopisetty, G., Ramachandran, K., and Singal, R. (2006). DNA methylation and apoptosis. Mol. Immunol. 43, 1729–1740. doi: 10.1016/j.molimm.2005.11.010
Gough, A. C., Miles, J. S., Spurr, N. K., Moss, J. E., Gaedigk, A., Eichelbaum, M., et al. (1990). Identification of the primary gene defect at the cytochrome P450 CYP2D locus. Nature 347, 773–776. doi: 10.1038/347773a0
Gu, J., Berman, D., Lu, C., Wistuba, I. I., Roth, J. A., Frazier, M., et al. (2006). Aberrant promoter methylation profile and association with survival in patients with non-small cell lung cancer. Clin. Cancer Res. 12, 7329–7338. doi: 10.1158/1078-0432.CCR-06-0894
Guo, W., Zhu, L., Zhu, R., Chen, Q., Wang, Q., and Chen, J. Q. (2019). A four-DNA methylation biomarker is a superior predictor of survival of patients with cutaneous melanoma. eLife 8:e44310. doi: 10.7554/eLife.44310.046
Hahn, W. C., and Weinberg, R. A. (2002). Rules for making human tumor cells. N. Engl. J. Med. 347, 1593–1603. doi: 10.1056/NEJMra021902
International Cancer Genome Consortium, Hudson, T. J., Anderson, W., Artez, A., Barker, A. D., Bell, C., et al. (2010). International network of cancer genome projects. Nature 464, 993–998. doi: 10.1038/nature08987
Jurmeister, P., Bockmayr, M., Seegerer, P., Bockmayr, T., Treue, D., Montavon, G., et al. (2019). Machine learning analysis of DNA methylation profiles distinguishes primary lung squamous cell carcinomas from head and neck metastases. Sci. Transl. Med. 11:eaaw8513. doi: 10.1126/scitranslmed.aaw8513
Kananen, L., Marttila, S., Nevalainen, T., Jylhava, J., Mononen, N., Kahonen, M., et al. (2016). Aging-associated DNA methylation changes in middle-aged individuals: the Young Finns study. BMC Genomics 17:103. doi: 10.1186/s12864-016-2421-z
Lerner, B., and Malka, R. (2011). Investigation of the K2 algorithm in learning bayesian network classifiers. Appl. Artif. Intell. 25, 74–96. 10.1080/08839514.2011.529265.
Liedtke, C., Mazouni, C., Hess, K. R., Andre, F., Tordai, A., Mejia, J. A., et al. (2008). Response to neoadjuvant therapy and long-term survival in patients with triple-negative breast cancer. J. Clin. Oncol. 26, 1275–1281. doi: 10.1200/JCO.2007.14.4147
Majumder, S., Taylor, W. R., Yab, T. C., Berger, C. K., Dukek, B. A., Cao, X., et al. (2019). Novel methylated DNA markers discriminate advanced neoplasia in pancreatic cysts: marker discovery, tissue validation, and cyst fluid testing. Am. J. Gastroenterol. 114, 1539–1549. doi: 10.14309/ajg.0000000000000284
Maruya, S., Issa, J. P., Weber, R. S., Rosenthal, D. I., Haviland, J. C., Lotan, R., et al. (2004). Differential methylation status of tumor-associated genes in head and neck squamous carcinoma: incidence and potential implications. Clin. Cancer Res. 10, 3825–3830. doi: 10.1158/1078-0432.CCR-03-0370
Mathe, A., Wong-Brown, M., Locke, W. J., Stirzaker, C., Braye, S. G., Forbes, J. F., et al. (2016). DNA methylation profile of triple negative breast cancer-specific genes comparing lymph node positive patients to lymph node negative patients. Sci. Rep. 6:33435. doi: 10.1038/srep33435
Nguyen, H. N., Lie, A., Li, T., Chowdhury, R., Liu, F., Ozer, B., et al. (2017). Human TERT promoter mutation enables survival advantage from MGMT promoter methylation in IDH1 wild-type primary glioblastoma treated by standard chemoradiotherapy. Neuro Oncol. 19, 394–404. doi: 10.1093/neuonc/now189
Norgaard, M., Haldrup, C., Bjerre, M. T., Hoyer, S., Ulhoi, B., Borre, M., et al. (2019). Epigenetic silencing of MEIS2 in prostate cancer recurrence. Clin. Epigenetics 11:147. doi: 10.1186/s13148-019-0742-x
Poillet-Perez, L., Xie, X., Zhan, L., Yang, Y., Sharp, D. W., Hu, Z. S., et al. (2018). Autophagy maintains tumour growth through circulating arginine. Nature 563, 569–573. doi: 10.1038/s41586-018-0697-7
Ritchie, M. E., Phipson, B., Wu, D., Hu, Y., Law, C. W., Shi, W., et al. (2015). limma powers differential expression analyses for RNA-sequencing and microarray studies. Nucleic Acids Res. 43:e47. doi: 10.1093/nar/gkv007
Russell, M. R., Graham, C., D'Amato, A., Gentry-Maharaj, A., Ryan, A., Kalsi, J. K., et al. (2019). Diagnosis of epithelial ovarian cancer using a combined protein biomarker panel. Br. J. Cancer 121, 483–489. doi: 10.1038/s41416-019-0544-0
Shao, L., Chen, Z., Peng, D., Soutto, M., Zhu, S., Bates, A., et al. (2018). Methylation of the HOXA10 promoter directs miR-196b-5p-dependent cell proliferation and invasion of gastric cancer cells. Mol. Cancer Res. 16, 696–706. doi: 10.1158/1541-7786.MCR-17-0655
Shen, S., Wang, G., Shi, Q., Zhang, R., Zhao, Y., Wei, Y., et al. (2017). Seven-CpG-based prognostic signature coupled with gene expression predicts survival of oral squamous cell carcinoma. Clin. Epigenetics 9:88. doi: 10.1186/s13148-017-0392-9
Song, X., Zhang, X., Wang, X., Chen, L., Jiang, L., Zheng, A., et al. (2020). LncRNA SPRY4-IT1 regulates breast cancer cell stemness through competitively binding miR-6882-3p with TCF7L2. J. Cell Mol. Med. 24, 772–784. doi: 10.1111/jcmm.14786
Subramanian, A., Tamayo, P., Mootha, V. K., Mukherjee, S., Ebert, B. L., Gillette, M. A., et al. (2005). Gene set enrichment analysis: a knowledge-based approach for interpreting genome-wide expression profiles. Proc. Natl. Acad. Sci. U.S.A. 102, 15545–15550. doi: 10.1073/pnas.0506580102
Tao, C., Luo, R., Song, J., Zhang, W., and Ran, L. (2019). A seven-DNA methylation signature as a novel prognostic biomarker in breast cancer. J. Cell Biochem. 121, 2385–2393. doi: 10.1002/jcb.29461
Toth, R., Schiffmann, H., Hube-Magg, C., Buscheck, F., Hoflmayer, D., Weidemann, S., et al. (2019). Random forest-based modelling to detect biomarkers for prostate cancer progression. Clin. Epigenetics 11:148. doi: 10.1186/s13148-019-0736-8
Visvanathan, K., Fackler, M. S., Zhang, Z., Lopez-Bujanda, Z. A., Jeter, S. C., Sokoll, L. J., et al. (2017). Monitoring of serum DNA methylation as an early independent marker of response and survival in metastatic breast cancer: TBCRC 005 prospective biomarker study. J. Clin. Oncol. 35, 751–758. doi: 10.1200/JCO.2015.66.2080
Wang, W., Xu, X., Tian, B., Wang, Y., Du, L., Sun, T., et al. (2017). The diagnostic value of serum tumor markers CEA, CA19-9, CA125, CA15-3, and TPS in metastatic breast cancer. Clin. Chim. Acta 470, 51–55. doi: 10.1016/j.cca.2017.04.023
Widschwendter, M., Jones, A., Evans, I., Reisel, D., Dillner, J., Sundstrom, K., et al. (2018). Epigenome-based cancer risk prediction: rationale, opportunities and challenges. Nat. Rev. Clin. Oncol. 15, 292–309. doi: 10.1038/nrclinonc.2018.30
Wu, J., Zhang, Y., and Li, M. (2019). Identification of methylation markers and differentially expressed genes with prognostic value in breast cancer. J. Comput. Biol. 26, 1394–1408. doi: 10.1089/cmb.2019.0179
Xu, R. H., Wei, W., Krawczyk, M., Wang, W., Luo, H., Flagg, K., et al. (2017). Circulating tumour DNA methylation markers for diagnosis and prognosis of hepatocellular carcinoma. Nat. Mater. 16, 1155–1161. doi: 10.1038/nmat4997
Zang, R., Li, Y., Jin, R., Wang, X., Lei, Y., Che, Y., et al. (2019). Enhancement of diagnostic performance in lung cancers by combining CEA and CA125 with autoantibodies detection. Oncoimmunology 8:e1625689. doi: 10.1080/2162402X.2019.1625689
Keywords: breast cancer, DNA methylation, DMSs, specific diagnostic biomarkers, prognostic markers, risk stratification
Citation: Zhang M, Wang Y, Wang Y, Jiang L, Li X, Gao H, Wei M and Zhao L (2020) Integrative Analysis of DNA Methylation and Gene Expression to Determine Specific Diagnostic Biomarkers and Prognostic Biomarkers of Breast Cancer. Front. Cell Dev. Biol. 8:529386. doi: 10.3389/fcell.2020.529386
Received: 24 January 2020; Accepted: 18 November 2020;
Published: 07 December 2020.
Edited by:
Rui Henrique, Portuguese Oncology Institute, PortugalReviewed by:
Lucas Delmonico, Federal University of Rio de Janeiro, BrazilCopyright © 2020 Zhang, Wang, Wang, Jiang, Li, Gao, Wei and Zhao. This is an open-access article distributed under the terms of the Creative Commons Attribution License (CC BY). The use, distribution or reproduction in other forums is permitted, provided the original author(s) and the copyright owner(s) are credited and that the original publication in this journal is cited, in accordance with accepted academic practice. No use, distribution or reproduction is permitted which does not comply with these terms.
*Correspondence: Hua Gao, aHVhZzU1QDE2My5jb20=; Minjie Wei, d2VpbWluamllY211QDE2My5jb20=; Lin Zhao, emxfY211QDE2My5jb20=
Disclaimer: All claims expressed in this article are solely those of the authors and do not necessarily represent those of their affiliated organizations, or those of the publisher, the editors and the reviewers. Any product that may be evaluated in this article or claim that may be made by its manufacturer is not guaranteed or endorsed by the publisher.
Research integrity at Frontiers
Learn more about the work of our research integrity team to safeguard the quality of each article we publish.