 Jie Zhang
 Yue Zhou1
 Linyu Huang
 Chongcheng Xi
- 1School of Nursing, Chengdu University of Traditional Chinese Medicine, Chengdu, China
- 2School of Basic Medicine, Chengdu University of Traditional Chinese Medicine, Chengdu, China
Background: Risk prediction models for depression in patients with coronary heart disease are increasingly being developed. However, the quality and applicability of these models in clinical practice remain uncertain.
Objective: To systematically evaluate depression risk prediction models in patients with coronary heart disease (CHD).
Methods: Databases including PubMed, Web of Science, Embase, Cochrane Library, CNKI, Wanfang, VIP, and SinoMed were searched for relevant studies from inception to September 29, 2024. Two researchers independently screened the literature, extracted data, and used the Prediction Model Risk of Bias Assessment Tool (PROBAST) to evaluate the models' risk of bias and applicability.
Results: Eight studies, encompassing 13 risk prediction models and involving 8,035 CHD patients, were included, with 1,971 patients diagnosed with depression. Common predictors included age, educational level, gender, and cardiac function classification. The area under the curve (AUC) for the models ranged from 0.772 to 0.961, indicating overall good performance; however, risk of bias was high, primarily due to issues in the analysis phase, such as inadequate handling of missing values, univariate analysis for variable selection, and lack of external validation.
Conclusion: Depression risk prediction models for CHD patients generally perform well, but high risk of bias and limited applicability remain concerns. Future studies should focus on developing and validating more robust models to aid healthcare professionals in early identification of high-risk patients for depression.
Systematic Review Registration: https://www.crd.york.ac.uk/prospero/display_record.php?ID=CRD42024625641, identifier (CRD42024625641).
1 Introduction
Coronary Heart Disease (CHD) is an ischemic heart disease caused by coronary artery atherosclerosis, leading to vessel lumen narrowing or occlusion, which consequently triggers myocardial ischemia, hypoxia, or necrosis (1). According to the World Health Organization (WHO), approximately 9 million people die from CHD each year, making it one of the leading causes of mortality worldwide (2, 3). Clinically, CHD is often treated with Percutaneous Coronary Intervention (PCI), a procedure that rapidly restores coronary blood flow and significantly reduces mortality rates (4). However, CHD is marked by a high recurrence rate, particularly among patients who have experienced myocardial infarction, as they often develop depressive symptoms from recalling near-death experiences. Studies indicate that the prevalence of depression among CHD patients ranges from 20% to 50%, considerably higher than in the general population (5). Depression is not only an independent risk factor for CHD onset but also a key predictor of poor prognosis (6). Research has shown that depression increases the risk of myocardial infarction recurrence by 1.3 times and elevates mortality risk by 1.8 to 2 times (7). These findings underscore the profound impact of depression on CHD patients, as it not only exacerbates the condition but also markedly increases mortality. Therefore, selecting or developing scientifically validated risk prediction models to identify high-risk patients early is crucial. Although several predictive models for depression in CHD patients have been developed (8, 9), their quality and predictive performance vary significantly, and a systematic review is lacking. This study aims to comprehensively review depression risk prediction models in CHD patients, systematically evaluate their bias and applicability, provide clinical guidance for selecting reliable models, and inform future model improvement and development.
2 Methods
The protocol for this systematic review and meta-analysis is available in the PROSPERO database (CRD42024625641).
2.1 Inclusion and exclusion criteria
2.1.1 Inclusion criteria
(1) P (Population): Age ≥18 years, diagnosed with coronary heart disease (CHD) according to established criteria; (2) I (Intervention model): Development or validation of a depression risk prediction model for CHD patients, including predictors ≥ 2; (3) C (Comparator): No comparator model; (4) O (Outcome): The primary outcome was depression.
2.1.2 Exclusion criteria
(1) Articles without full-text availability; (2) Duplicate publications; (3) Conference abstracts and dissertations; (4) Non-Chinese or non-English publications.
2.2 Search strategy
A computer-based search was conducted across four English databases (Web of Science, PubMed, Embase, and Cochrane Library) and four Chinese databases (CNKI, Wanfang, VIP, and SinoMed) to identify studies related to depression risk prediction models in CHD patients. The search period spanned from database inception to September 29, 2024. A combination of subject terms, free terms, and Boolean operators was used for both Chinese and English searches. Chinese search terms included coronary heart disease, acute coronary syndrome, myocardial infarction, post-PCI, depression, depressive state, prediction, predictive factors, influencing factors, risk assessment, model, and tool. English search terms included coronary disease, acute coronary syndrome, myocardial infarction, post-PCI, depression, depressive disorder, prediction, predictors, influencing factors, risk assessment, model, tool, and score. For each database, a tailored search strategy was developed based on its unique features. Additionally, references in included studies were reviewed to identify supplementary relevant literature.
2.3 Literature screening and data extraction
Two researchers independently screened the literature and extracted data based on the inclusion and exclusion criteria, followed by cross-checking the data results. Any disagreements were resolved through discussion or decided by a third researcher. The extracted data included the following details: first author, year, country, study type, study population, depression diagnostic criteria, sample size, modeling method, area under the receiver operating characteristic curve (AUC), and model presentation format.
2.4 Risk of bias and applicability assessment
The Prediction model Risk Of Bias ASsessment Tool (PROBAST) (10) was used to assess the risk of bias and applicability of the included models. The risk of bias evaluation covers four domains: participants, predictors, outcomes, and analysis, with a total of 20 specific questions. Based on the “shortcoming theory,” each domain's results were synthesized as follows: if all items are marked as “probably yes” or “yes,” the domain is rated as “low risk”; if any item is rated as “no” or “probably no,” the domain is deemed “high risk”; if an item lacks sufficient information, the domain is rated as “unclear.” For the overall risk of bias, a “low risk” is assigned only when all four domains are rated as “low risk”; if any domain is rated as “high risk,” the overall risk of bias is rated as “high risk”; if any domain is rated as “unclear,” the overall risk of bias is categorized as “unclear.” The applicability assessment includes three domains: study population, predictors, and outcomes, using the same evaluation approach as the risk of bias assessment.
2.5 Statistical analysis
Stata 17.0 software was used for quantitative analysis of the AUCs of the included models. Cochrane's Q test was applied to assess heterogeneity among the models, with I2 used to quantify the degree of heterogeneity. If P > 0.05 and I2 ≤ 50%, it indicates no significant heterogeneity among studies, and a fixed-effects model is applied. Conversely, if P ≤ 0.05 or I2 > 50%, it suggests substantial heterogeneity. In such cases, subgroup analysis is conducted to explore the sources of heterogeneity, and sensitivity analysis is performed by sequentially excluding individual studies. If heterogeneity persists, a random-effects model is used for the analysis. To detect potential publication bias, Egger's test was performed, with P > 0.05 suggesting a low likelihood of publication bias.
3 Results
3.1 Study selection
The initial search yielded 2,421 relevant articles. After removing 792 duplicates, a further 1,590 articles were excluded based on title and abstract screening for topic relevance. Full texts of 39 articles were reviewed, and ultimately, 8 articles were included. The screening process is shown in Figure 1.
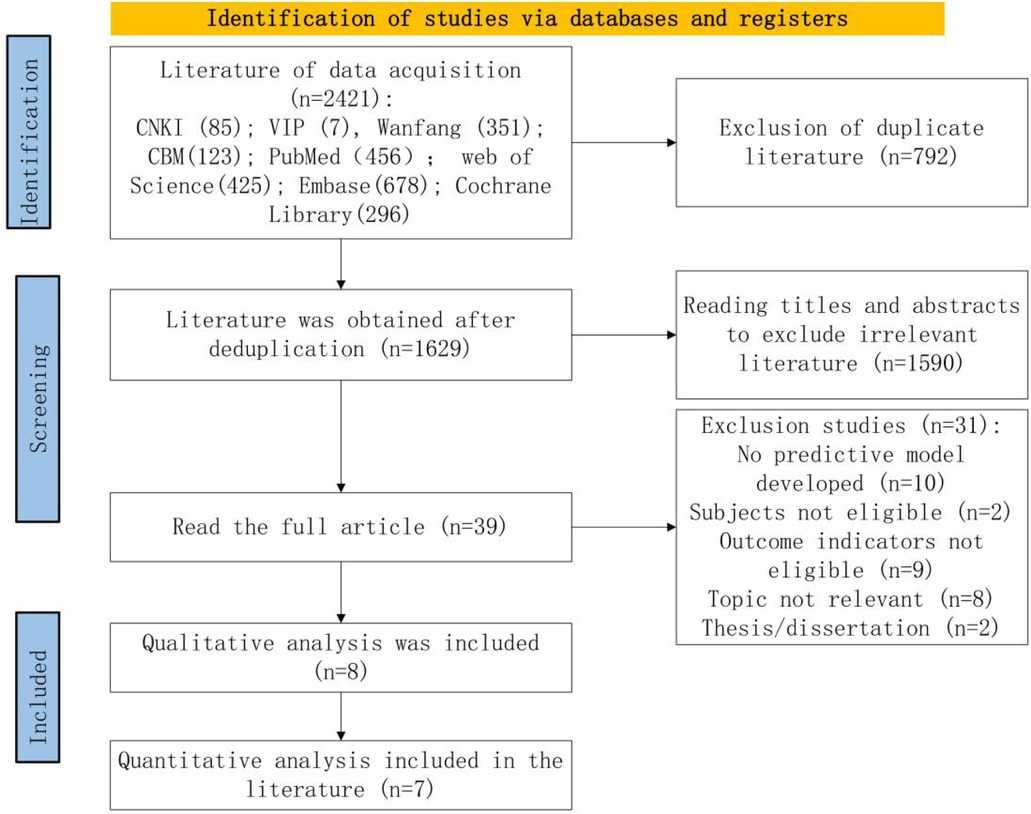
Figure 1. Preferred reporting items for systematic reviews and meta-analysis-conforming flowchart of the screening process.
3.2 Study characteristics
This study included a total of 8 studies (8, 9, 11–16), comprising 3 prospective cohort studies (8, 12, 14), 4 retrospective studies (9, 13, 15, 16) (including 2 retrospective cohort studies (13, 16) and 2 retrospective case-control studies (9, 15), with one being a nested case-control study (15), and 1 cross-sectional study (11). Data for 2 studies (9, 11) were sourced from the U.S. Centers for Disease Control and Prevention's National Health and Nutrition Examination Survey (NHANES), while data for the remaining 6 studies (8, 12–16) were drawn from clinical databases. A total of 8,035 CHD patients were included in the analysis. Details are provided in Table 1.
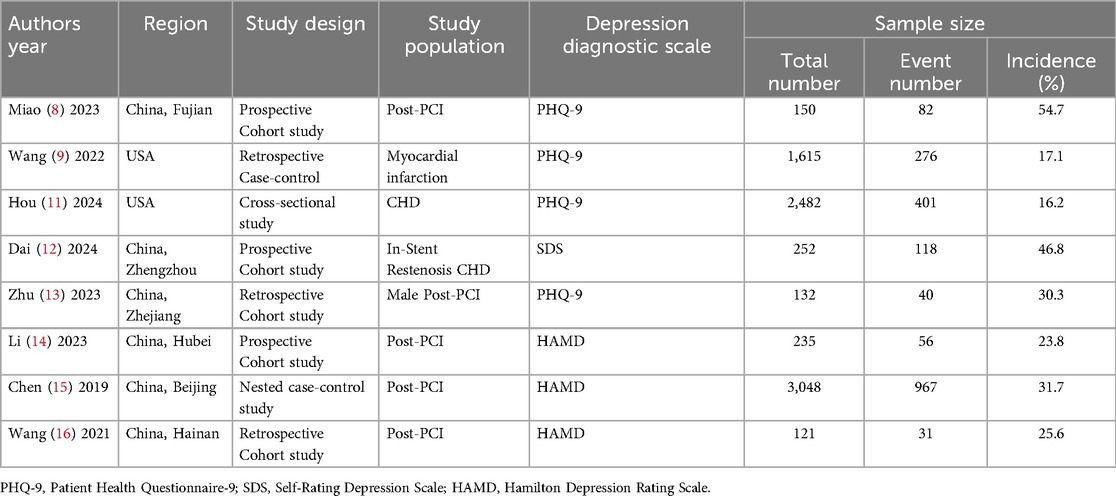
Table 1. Basic characteristics of included studies.
3.3 Basic characteristics of prediction models
The 8 studies constructed a total of 13 prediction models. Hou et al. developed 5 models and ultimately selected an optimal model for nomogram construction, while Wang et al. developed 2 models; each of the remaining studies constructed 1 model. In terms of variable selection, Hou et al.'s optimal model used the best subset selection method, Li Cexing et al. applied Lasso regression, and the other 6 studies utilized univariate analysis to select variables. Regarding modeling methods, Wang et al. employed Lasso regression in their second model, while all other models used logistic regression. In terms of model performance, 8 models reported the area under the curve (AUC), ranging from 0.772 to 0.961; 1 model reported the C-index. Calibration was assessed in 7 studies through calibration plots, 1 study reported the Brier score, and 3 studies conducted the Hosmer-Lemeshow test (Figure 2). Details are provided in Table 2.
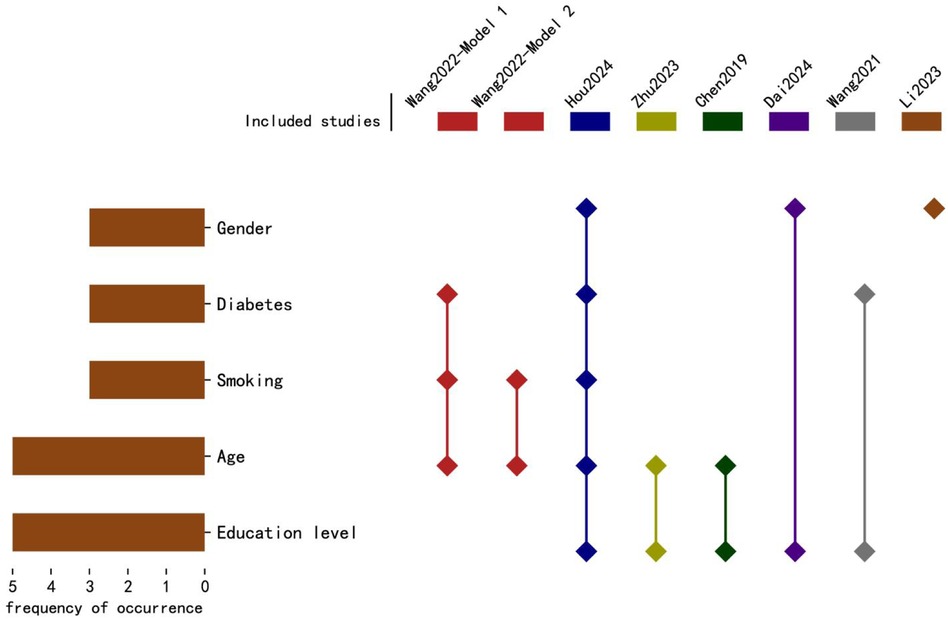
Figure 2. The frequency and distribution of predictive factors in each predictive. The horizontal axis represents the frequency of occurrence of predictive factors, while the vertical axis lists the top five predictive factors. The horizontal bars indicate the frequency of occurrence, and the diamond markers show the distribution of these factors in each study, corresponding to the study names listed above.
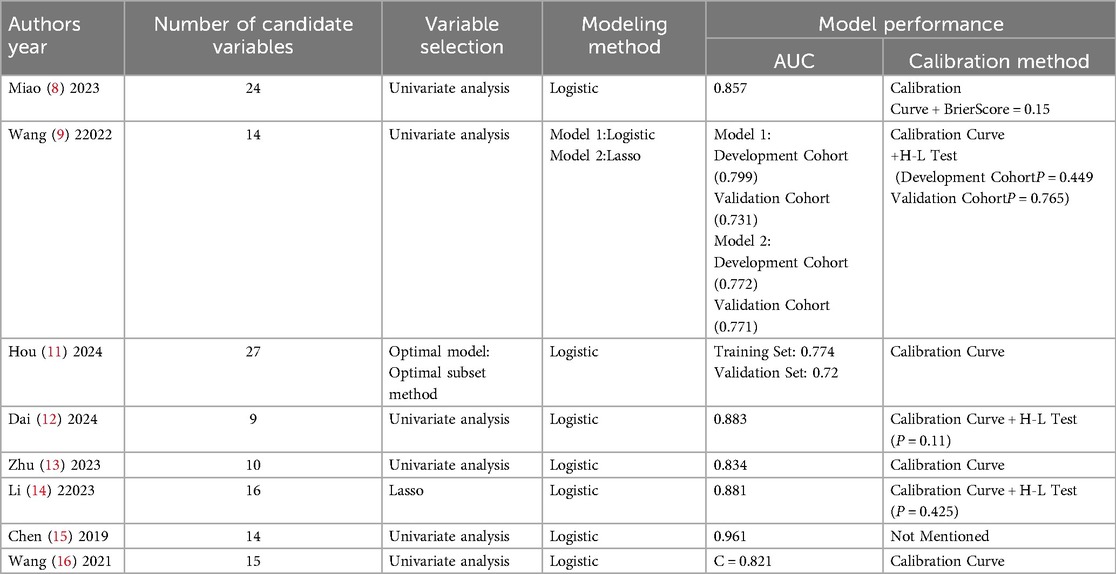
Table 2. Construction methods and performance of included predictive models.
For model validation, only 2 studies performed external validation, while 5 conducted internal validation. Regarding model presentation, 7 studies used nomograms, and 1 used regression equations. The number of candidate predictors ranged from 9 to 27, with the final number of included predictors between 3 and 10 (distribution of the top five predictive factors, Figure 3). Additional details are available in Table 3.
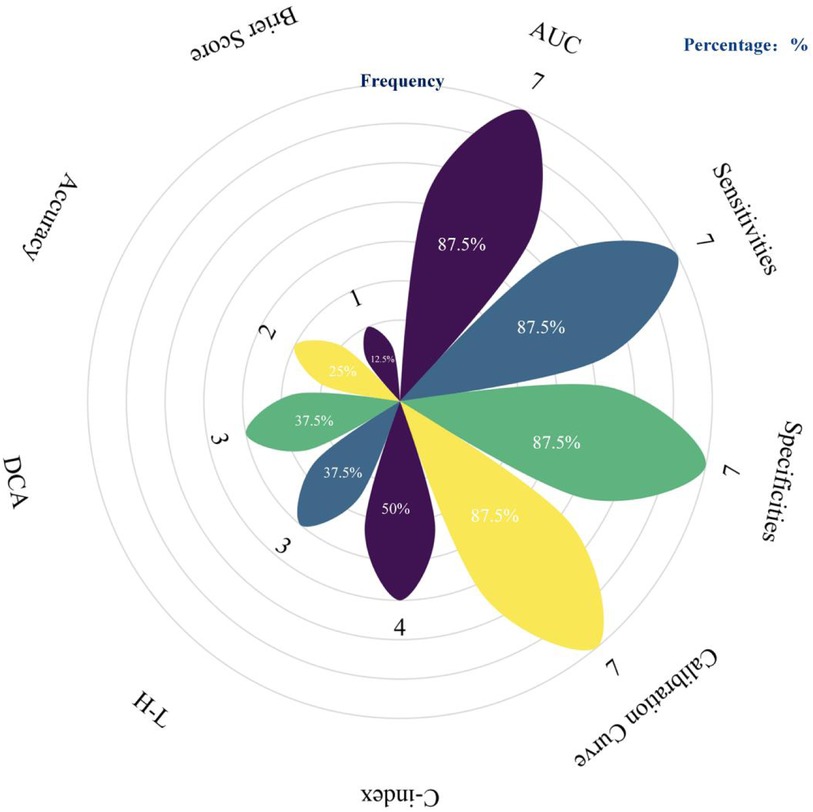
Figure 3. Summary of performance evaluation metrics used in predictive models. The petals represent different performance evaluation metrics, and the length of each petal along with the labeled percentage indicates the frequency of use for the corresponding metric (created using the following website: https://www.chiplot.online/).
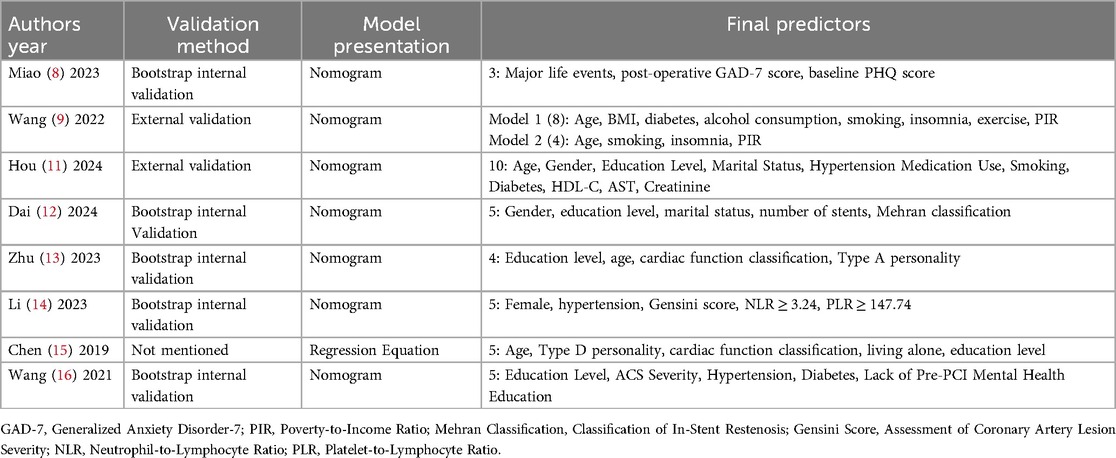
Table 3. Validation methods and final predictors of included models.
3.4 Risk of bias and applicability assessment
3.4.1 Risk of bias assessment
The overall risk of bias in the included studies was relatively high: (1) Participants: Three prospective cohort studies (8, 12, 14) and one nested case-control study (15) were rated as low risk, while four retrospective studies (9, 11, 13, 16) were rated as high risk. The high risk in retrospective studies is primarily due to potential recall bias and the fact that data collection was not initially intended for model development or validation, leading to missing key depression-related predictors in cases, thus increasing bias risk. (2) Predictors: Five studies (12–16) were rated as low risk, while three studies (8, 9, 11) were rated as high risk. Miao's (8) study included the postoperative GAD score as a predictor, which cannot be obtained when using the model, impacting accuracy and resulting in a high risk of bias. Wang's (9) and Hou's (11) studies used self-reported predictors, which increased subjectivity and outcome uncertainty, hence rated as high risk. (3)Outcomes: Two studies (12, 14) were rated as low risk, one study (8) as high risk, and five studies (9, 11, 13, 15, 16) as unclear. Miao's (8) study used baseline PQH scores as predictors, potentially overestimating their association with outcomes, resulting in high risk. The other five studies (9, 11, 13, 15, 16) did not report assessor training, leaving the objectivity of depression outcomes uncertain, hence rated as unclear. (4)Analysis: All included studies were rated as high risk. Three studies (13, 14, 16) had an events-per-variable (EPV) ratio of less than 20, increasing bias risk. One study (12) excluded subjects with missing data directly, leading to a high risk of data bias. Six studies did not mention handling of missing data. Six studies (8, 9, 13–16) relied on univariate analysis for variable selection, which increases bias risk. None of the studies (8, 9, 11–16) addressed complex data processing methods. One study (15) did not report discrimination or calibration and did not account for model overfitting, contributing to a high risk of bias. Details are provided in Table 4.
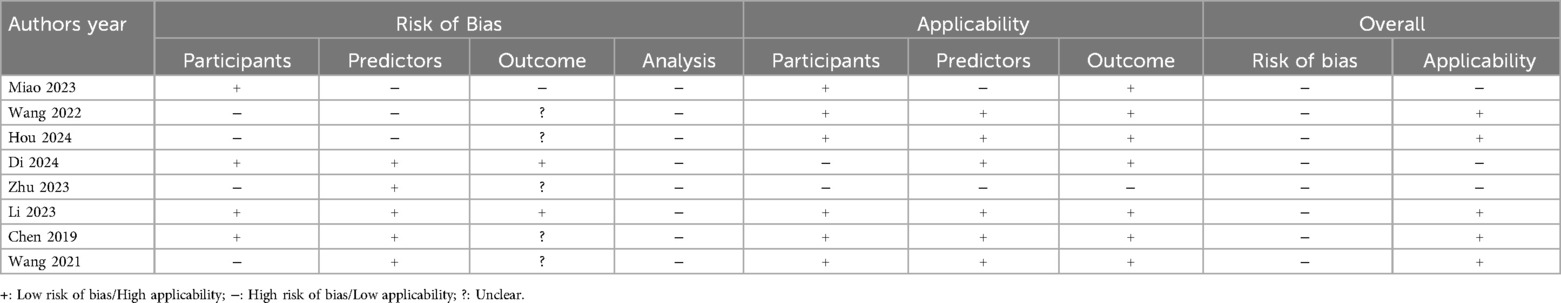
Table 4. Risk of bias and applicability assessment of included studies.
3.4.2 Applicability assessment
Five studies (9, 11, 14–16)demonstrated generally good applicability, while the remaining three studies (8, 12, 13) showed poor applicability: (1) Participants: Dai Xuehui's (12)study focused on CHD patients with in-stent restenosis, and Zhu Hupei's (13) study limited participants to male subjects, which reduces the applicability of these studies to the general population. (2) Predictors: Miao's (8) study included inappropriate predictors (such as the postoperative GAD score), while Zhu Hupei's (13) study did not report definitions or assessment methods for the predictors, affecting applicability. (3) Outcomes: All studies assessed depression using validated scales; however, Zhu Hupei's (13) study combined anxiety and depression as a single outcome measure without separate analysis, which reduced its applicability. Details are provided in Table 4.
3.5 Meta-analysis of included models
Among the 8 included studies with a total of 9 models, significant heterogeneity was observed (I2 = 90.2%, P < 0.001), prompting the use of a random-effects model for analysis. The pooled AUC estimate was 0.84 (95% CI: 0.80–0.88), indicating good overall predictive performance (Figure 4a). The substantial heterogeneity among studies may be attributed to differences in study design, patient characteristics, and outcome evaluation metrics. Subgroup analysis based on different outcome measurement scales showed that heterogeneity was I2 = 74.4% for the PHQ-9 group and I2 = 95.1% for the HAMD group, with no significant reduction in heterogeneity, suggesting that measurement tools were not the primary source of heterogeneity (Figure 4b). Sensitivity analysis, conducted by sequentially excluding individual studies, revealed no significant changes in heterogeneity, further supporting the robustness of the findings. Egger's test yielded a P-value of 0.767 (P > 0.05), indicating no significant publication bias.
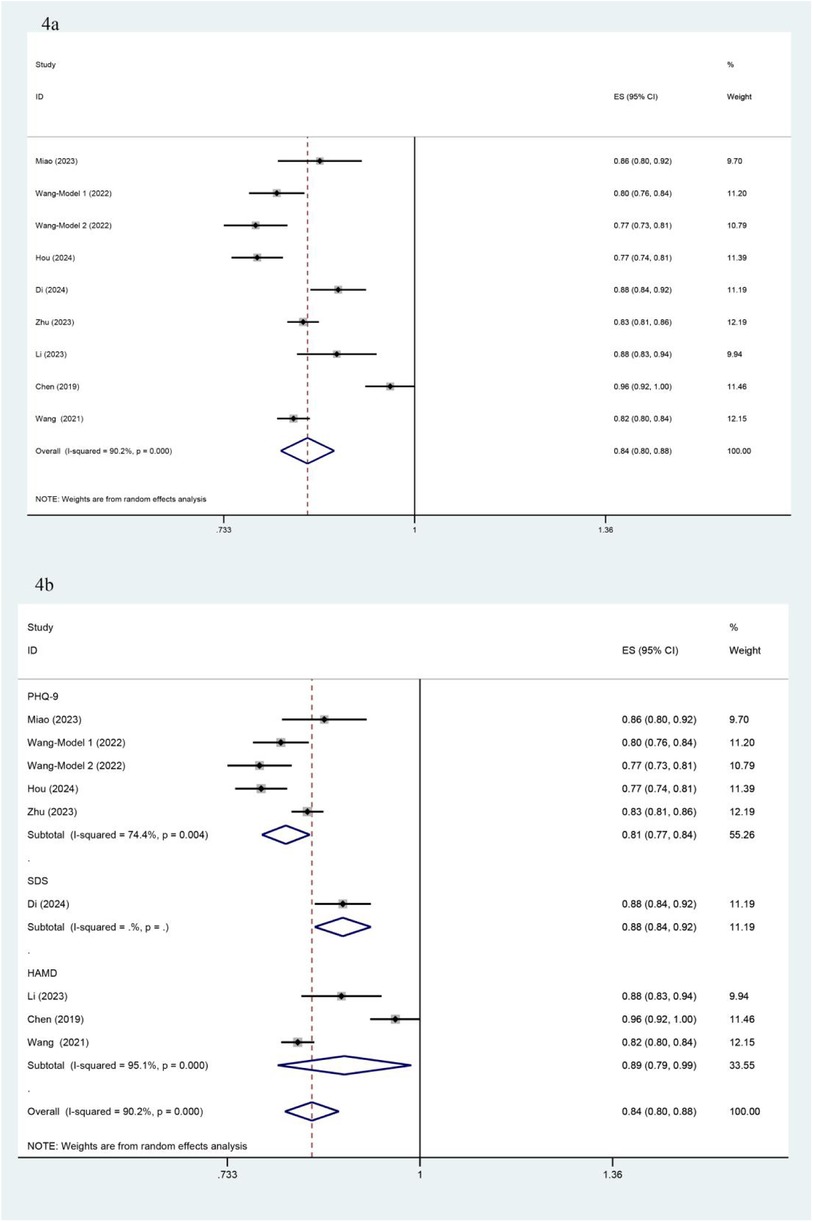
Figure 4. Forest plot and subgroup analysis based on AUC. (a) presents the overall forest plot of the 9 included models, based on AUC values and their 95% confidence intervals. (b) shows the forest plot for subgroup analysis by different outcome measurement scales, displaying the AUC values and their 95% confidence intervals within each subgroup.
4 Discussion
4.1 Model performance is good but bias risk is high; focus needed on external validation and diverse modeling
The commonly used metrics for evaluating model performance include AUC and calibration. In this study, all 9 included models demonstrated AUCs above 0.7, with 6 models reaching or exceeding 0.8, indicating good discriminative ability. Additionally, the calibration curves for 8 models closely aligned with the diagonal line, suggesting strong agreement between predicted probabilities and actual occurrence rates. Four models also underwent Hosmer-Lemeshow (H-L) testing, with P-values ≥0.05, further supporting good calibration. Overall, these models effectively identify high-risk patients for depression, showing favorable performance; however, the high risk of bias persists.
First, there is bias in the data sources. (1) Most data are from single-center studies with insufficient sample sizes, and five studies are retrospective analyses, introducing recall bias to some extent and affecting the model's quality. (2) Depression diagnosis is highly subjective and requires professional assessment; however, five studies did not mention the training of evaluators, which may lead to outcome bias. Future studies should prioritize multicenter, large-sample, high-quality prospective studies to minimize recall bias. Additionally, outcome evaluators should be uniformly trained independent third parties to enhance the consistency and accuracy of depression diagnoses.
Second, biases also exist in model construction. (1) In terms of variable selection, six studies relied on univariate analysis to identify predictors, potentially omitting important factors and leading to model overfitting, which weakens predictive power (17). (2) Six studies did not report missing values, and one study directly excluded missing data. This approach may introduce bias in the associations between predictors and outcomes, and even in the absence of bias, missing data can reduce precision, widening confidence intervals. (3) Six studies used traditional logistic regression to build models, limiting the ability to capture complex relationships among variables, which affects model accuracy and stability (18). Therefore, future research should combine domain knowledge and clinical experience and cautiously select variables using methods like LASSO regression and stepwise regression (19). When handling missing data, methods such as multiple imputation and single imputation should be used to mitigate the adverse effects of missing data on statistical analysis and model stability (20). Additionally, incorporating machine learning and deep learning approaches can enhance the accuracy and adaptability of predictive models (21).
Finally, there are some limitations in model validation. The predictive performance of a model can be affected by variations in populations and regions, underscoring the need for thorough validation during model development. Internal validation assesses model reproducibility and prevents overfitting, while external validation evaluates transferability and generalizability, regarded as the “gold standard” of validation (22, 23). In this study, three models underwent external validation but lacked internal validation, potentially impacting model performance and reliability; five models performed internal validation without external validation, with study populations mainly composed of Chinese individuals, limiting the model's generalizability and applicability. Future research should emphasize external validation, particularly across diverse regions, ethnicities, cultural backgrounds, and lifestyle factors, to enhance model generalizability. Additionally, variations in coronary heart disease types (e.g., stable angina, acute coronary syndrome, post-PCI), as well as different disease stages, should be considered. Treatment modalities and levels of social support may also influence predictive performance. Taking these factors into account comprehensively will contribute to improving model reliability and applicability.
4.2 Predictor differences and commonalities: focus on age, education level, and gender
The nine models in this study included between 3 and 10 predictors, primarily categorized into four groups: demographic factors (e.g., age, gender), psychological factors (e.g., PHQ score, personality), clinical factors (e.g., hypertension, number of stents), and lifestyle factors (e.g., smoking, alcohol consumption). Despite variations in predictor selection due to study types and included variables, some commonalities were identified. Predictors frequently appearing across eight studies included age, education level, gender, and cardiac function classification. Wang's study (9) found a negative correlation between age and depression, a finding supported by Murphy et al. (24). Conversely, Zhu Hupei (13) and Chen Hongyu (15) indicated that age over 60 is an independent risk factor for post-PCI depression. This may be because younger patients feel disoriented by sudden illness, while older patients, experiencing functional decline, may perceive themselves as a burden. Research (12) suggests that patients with higher education levels have stronger comprehension and application abilities when receiving health education, resulting in better prognosis and lower risk of depression. Multiple studies (25–27) found that females are more prone to depression, likely due to hormonal fluctuations during menstruation, menopause, and perinatal periods, which contribute to emotional instability. Additionally, women often bear more responsibilities and pressures in social and family roles, increasing depression risk. Higher cardiac function classifications are associated with more pronounced symptoms of dyspnea and chest tightness, as well as greater limitations in daily life and physical activity. Such physiological discomfort amplifies psychological stress, eroding confidence in life, and leading to negative emotions or even self-harm and suicidal behaviors (28). Thus, early screening should focus on these common factors to promptly identify high-risk individuals. However, this study also found that many current predictors are challenging to directly intervene upon, limiting nursing interventions. Future research should consider including modifiable factors, such as sleep quality, psychological state, and medication adherence, to enable more targeted nursing interventions and enhance clinical outcomes.
4.3 Limitations of this study
(1) Seventy-five percent (6/8) of the studies included were based on data from China, which may introduce regional bias and limit the applicability of the findings to Western populations. (2) Seventy-five percent (6/8) of the studies did not perform external validation, restricting the generalizability of the models. (3) The included studies were limited to those published in Chinese and English, potentially introducing language bias and failing to capture findings from studies published in other languages.
5 Conclusion
The predictive models included in this study demonstrated generally good performance; however, as evaluated by PROBAST, the overall risk of bias remains high, and the models' applicability needs improvement. Currently, risk prediction models for depression in patients with coronary heart disease do not yet meet established standards. Future researchers should develop and validate more scientifically robust risk prediction models in accordance with PROBAST guidelines.
Data availability statement
The original contributions presented in the study are included in the article/Supplementary Material, further inquiries can be directed to the corresponding author.
Author contributions
JZ: Methodology, Writing – original draft. YZ: Writing – original draft. LH: Investigation, Software, Writing – original draft. XZ: Formal Analysis, Methodology, Writing – original draft. LL: Investigation, Writing – original draft. CX: Writing – review & editing, Writing – original draft.
Funding
The author(s) declare financial support was received for the research, authorship, and/or publication of this article. Sichuan Provincial Natural Science Foundation (2023NSFSC1811).
Conflict of interest
The authors declare that the research was conducted in the absence of any commercial or financial relationships that could be construed as a potential conflict of interest.
Generative AI statement
The author(s) declare that no Generative AI was used in the creation of this manuscript.
Publisher's note
All claims expressed in this article are solely those of the authors and do not necessarily represent those of their affiliated organizations, or those of the publisher, the editors and the reviewers. Any product that may be evaluated in this article, or claim that may be made by its manufacturer, is not guaranteed or endorsed by the publisher.
Supplementary material
The Supplementary Material for this article can be found online at: https://www.frontiersin.org/articles/10.3389/fcvm.2024.1522619/full#supplementary-material
References
1. Li S, Zhang J, Ni J, Cao J. Hypoxia-associated genes predicting future risk of myocardial infarction: a GEO database-based study. Front Cardiovasc Med. (2023) 10:1068782. doi: 10.3389/fcvm.2023.1068782
2. Wu P, Yu S, Wang J, Zou S, Yao DS, Xiaochen Y. Global burden, trends, and inequalities of ischemic heart disease among young adults from 1990 to 2019: a population-based study. Front Cardiovasc Med. (2023) 10:1274663. doi: 10.3389/fcvm.2023.1274663
3. Roth GA, Mensah GA, Johnson CO, Addolorato G, Ammirati E, Baddour LM, et al. Global burden of cardiovascular diseases and risk factors, 1990–2019: update from the GBD 2019 study. J Am Coll Cardiol. (2020) 76(25):2982–3021. doi: 10.1016/j.jacc.2020.11.010
4. De Luca L, Rosano GMC, Spoletini I. Post-percutaneous coronary intervention angina: from physiopathological mechanisms to individualized treatment. Cardiol J. (2022) 29(5):850–7. doi: 10.5603/CJ.a2021.0042
5. Rawashdeh SI, Ibdah R, Kheirallah KA, Al-Kasasbeh A, Raffee LA, Alrabadi N, et al. Prevalence estimates, severity, and risk factors of depressive symptoms among coronary artery disease patients after ten days of percutaneous coronary intervention. Clin Pract Epidemiol Ment Health. (2021) 17:103–13. doi: 10.2174/1745017902117010103
6. Bai B, Yin H, Guo L, Ma H, Wang H, Liu F, et al. Comorbidity of depression and anxiety leads to a poor prognosis following angina pectoris patients: a prospective study. BMC psychiatry. (2021) 21(1):202. doi: 10.1186/s12888-021-03202-5
7. Henao Pérez M, López Medina DC, Lemos Hoyos M, Ríos Zapata P. Depression and the risk of adverse outcomes at 5 years in patients with coronary heart disease. Heliyon. (2020) 6(11):e05425. doi: 10.1016/j.heliyon.2020.e05425
8. Miao X, Chen Y, Qiu X, Wang R. Construction and validation of a nomogram predicting depression risk in patients with acute coronary syndrome undergoing coronary stenting: a prospective cohort study. J Cardiovasc Dev Dis. (2023) 10(9):385. doi: 10.3390/jcdd10090385
9. Wang D, Jia S, Yan S, Jia Y. Development and validation using NHANES data of a predictive model for depression risk in myocardial infarction survivors. Heliyon. (2022) 8(1):e08853. doi: 10.1016/j.heliyon.2022.e08853
10. Moons KGM, Wolff RF, Riley RD, Whiting PF, Westwood M, Collins GS, et al. PROBAST: a tool to assess risk of bias and applicability of prediction model studies: explanation and elaboration. Ann Intern Med. (2019) 170(1):W1–w33. doi: 10.7326/M18-1377
11. Hou XZ, Wu Q, Lv QY, Yang YT, Li LL, Ye XJ, et al. Development and external validation of a risk prediction model for depression in patients with coronary heart disease. J Affect Disord. (2024) 367:137–47. doi: 10.1016/j.jad.2024.08.218
12. Dai X, Wang C, Gao J. Influencing factors and prediction model construction of anxiety and depression in coronary heart disease patients with in-stent restenosis. Hainan Med J. (2024) 35(06):788–94. doi: 10.3969/j.issn.1003-6350.2024.06.006
13. Zhu H, Sun Y, Pan Y. Analysis of factors associated with new-onset anxiety and depression in male patients with acute coronary syndrome after PCI and creation of a nomogram prediction model. Mod Pract Med. (2023) 35(01):119–21. doi: 10.3969/j.issn.1671-0800.2023.01.038
14. Li C, Lyu J, Wan S, Li W, Wang Y, Chen Y, et al. Nomogram prediction model of depressive symptoms risk in patients with acute coronary syndrome after interventional treatment. Chin Ment Health J. (2023) 37(09):771–9. doi: 10.3969/j.issn.1000-6729.2023.09.007
15. Chen H, Cao L, Wu L. Establishment of a predictive model of post-percutaneous coronary intervention depression in patients with coronary heart disease and its effect analysis. Chin J Prac Nurs. (2019) 35(36):2812–6.
16. Wang B, Fang X-L, Ouyang Y. Analysis of risk factors of depression in patients with acute coronary syndrome after percutaneous coronary intervention and establishment of risk nomogram model. J Clin Psychiatry. (2021) 31(04):292–5. doi: 10.3969/j.issn.1005-3220.2021.04.012
17. Strandberg R, Jepsen P, Hagström H. Developing and validating clinical prediction models in hepatology - an overview for clinicians. J Hepatol. (2024) 81(1):149–162. doi: 10.1016/j.jhep.2024.03.030
18. Ma J, Dhiman P, Qi C, Bullock G, van Smeden M, Riley RD, et al. Poor handling of continuous predictors in clinical prediction models using logistic regression: a systematic review. J Clin Epidemiol. (2023) 161:140–51. doi: 10.1016/j.jclinepi.2023.07.017
19. Chen Q, Hu H, He Q, Huang X, Shi H, Cao X, et al. Evaluating the risk of developing hyperuricemia in patients with type 2 diabetes mellitus using least absolute shrinkage and selection operator regression and machine learning algorithm. Digit Health. (2024) 10:20552076241241381. doi: 10.1177/20552076241241381
20. Zhang Q, Wang L. Moderation analysis with missing data in the predictors. Psychol Methods. (2017) 22(4):649–66. doi: 10.1037/met0000104
21. Alanazi HO, Abdullah AH, Qureshi KN. A critical review for developing accurate and dynamic predictive models using machine learning methods in medicine and health care. J Med Syst. (2017) 41(4):69. doi: 10.1007/s10916-017-0715-6
22. Wang J, Zhang Z, Zhou Z, Gu H. Clinical prediction models: model validation. Chin J Evid Based Cardiovasc Med. (2019) 11(2):141–4. doi: 10.3969/j.issn.1674-4055.2019.02.04
23. Chen L. Overview of clinical prediction models. Ann Transl Med. (2020) 8(4):71. doi: 10.21037/atm.2019.11.121
24. Murphy B, Le Grande M, Alvarenga M, Worcester M, Jackson A. Anxiety and depression after a cardiac event: prevalence and predictors. Front Psychol. (2019) 10:3010. doi: 10.3389/fpsyg.2019.03010
25. Hyde JS, Mezulis AH. Gender differences in depression: biological, affective, cognitive, and sociocultural factors. Harv Rev Psychiatry. (2020) 28(1):4–13. doi: 10.1097/HRP.0000000000000230
26. Hernández-Vásquez A, Vargas-Fernández R, Bendezu-Quispe G, Grendas LN. Depression in the Peruvian population and its associated factors: analysis of a national health survey. J Affect Disord. (2020) 273:291–7. doi: 10.1016/j.jad.2020.03.100
27. Morssinkhof MWL, Van Wylick DW, Priester-Vink S, van der Werf YD, den Heijer M, van den Heuvel OA, et al. Associations between sex hormones, sleep problems and depression: a systematic review. Neurosci Biobehav Rev. (2020) 118:669–80. doi: 10.1016/j.neubiorev.2020.08.006
Keywords: coronary heart disease, depression, prediction models, systematic review, meta-analysis
Citation: Zhang J, Zhou Y, Huang L, Zhang X, Li L and Xi C (2025) Risk prediction models for depression in patients with coronary heart disease: a systematic review and meta-analysis. Front. Cardiovasc. Med. 11:1522619. doi: 10.3389/fcvm.2024.1522619
Received: 4 November 2024; Accepted: 31 December 2024;
Published: 15 January 2025.
Edited by:
Marilena Anastasaki, University of Crete, GreeceReviewed by:
Ersin Saricam, Medicana Hospital, TürkiyeGulfairus Yessenbayeva, National Research Oncology and Transplantation Center, Kazakhstan
Copyright: © 2025 Zhang, Zhou, Huang, Zhang, Li and Xi. This is an open-access article distributed under the terms of the Creative Commons Attribution License (CC BY). The use, distribution or reproduction in other forums is permitted, provided the original author(s) and the copyright owner(s) are credited and that the original publication in this journal is cited, in accordance with accepted academic practice. No use, distribution or reproduction is permitted which does not comply with these terms.
*Correspondence: Chongcheng Xi, eGljaG9uZ2NoZW5nQGJ1Y20uZWR1LmNu