 Vaya Chen1,†
 Jue Zhang1,†
 Jackie Chang1
 Mirza Ahmar Beg1Lance Vick2
 Dandan Wang1,3
 Ankan Gupta4Yaxin Wang1
 Ziyu Zhang1
 Wen Dai1Mindy Kim1,5Shan Song6,7
 Duane Pereira8
 Ze Zheng1,9
 Komal Sodhi8Joseph I. Shapiro9Roy L. Silverstein9
 Subramaniam Malarkannan1,3,4,9
 Yiliang Chen1,9*
- 1Versiti Blood Research Institute, Milwaukee, WI, United States
- 2Department of Biochemistry, Medical College of Wisconsin, Milwaukee, WI, United States
- 3Department of Microbiology and Immunology, Medical College of Wisconsin, Milwaukee, WI, United States
- 4Department of Pediatrics, Medical College of Wisconsin, Milwaukee, WI, United States
- 5Department of Physiology, Medical College of Wisconsin, Milwaukee, WI, United States
- 6Department of Pathology, Hebei Medical University, Shijiazhuang, China
- 7Hebei Key Laboratory of Kidney Diseases, Shijiazhuang, China
- 8Department of Surgery, Biomedical Sciences, and Medicine, Joan C. Edwards School of Medicine, Marshall University, Huntington, WV, United States
- 9Department of Medicine, Medical College of Wisconsin, Milwaukee, WI, United States
Visceral white adipose tissues (WAT) regulate systemic lipid metabolism and inflammation. Dysfunctional WAT drive chronic inflammation and facilitate atherosclerosis. Adipose tissue-associated macrophages (ATM) are the predominant immune cells in WAT, but their heterogeneity and phenotypes are poorly defined during atherogenesis. The scavenger receptor CD36 mediates ATM crosstalk with other adipose tissue cells, driving chronic inflammation. Here, we combined the single-cell RNA sequencing technique with cell metabolic and functional assays on major WAT ATM subpopulations using a diet-induced atherosclerosis mouse model (Apoe-null). We also examined the role of CD36 using Apoe/Cd36 double-null mice. Based on transcriptomics data and differential gene expression analysis, we identified a previously undefined group of ATM displaying low viability and high lipid metabolism and labeled them as “unhealthy macrophages”. Their phenotypes suggest a subpopulation of ATM under lipid stress. We also identified lipid-associated macrophages (LAM), which were previously described in obesity. Interestingly, LAM increased 8.4-fold in Apoe/Cd36 double-null mice on an atherogenic diet, but not in Apoe-null mice. The increase in LAM was accompanied by more ATM lipid uptake, reduced adipocyte hypertrophy, and less inflammation. In conclusion, CD36 mediates a delicate balance between lipid metabolism and inflammation in visceral adipose tissues. Under atherogenic conditions, CD36 deficiency reduces inflammation and increases lipid metabolism in WAT by promoting LAM accumulation.
Introduction
Atherosclerosis is characterized by hyperlipidemia, oxidative stress, and chronic inflammation. It is the underlying mechanism causing a variety of cardiovascular diseases, which remain the leading cause of death worldwide (1). Although atherosclerotic plaques mainly develop in the medium and large arteries, many studies have shown that adipose tissues, especially the visceral white adipose tissues (WAT), contribute to atherosclerosis, possibly through their adverse effects on systemic lipid metabolism and immune regulation (2–4). Despite decades of studies, molecular mechanisms linking WAT phenotypes and functions to atherosclerosis development remain poorly understood.
Adipose tissues normally consist of adipocytes, which are the specialized lipid-storage cells, along with preadipocytes, vascular endothelial cells, fibroblasts, and many immune cells such as macrophages, dendritic cells, and lymphocytes (5). Among adipose tissue-associated immune cells, macrophages are the predominant cells, representing about 5% of all adipose tissue cells from lean mice and humans (6). Interestingly, the adipose tissue-associated macrophages (ATM) can undergo pro-inflammatory phenotypic switch (7) and expand dramatically up to over 50% of all adipose tissue cells in obesity (8), a significant risk factor for atherosclerosis (9, 10). New technologies such as single-cell RNA sequencing (scRNA-seq) have significantly advanced our knowledge of the dynamics of ATM in obesity. As an example, a recent report using obese mice identified a distinct ATM subpopulation called lipid-associated macrophages (LAM), which are active in lipid metabolism, and play a protective role against adipocyte hypertrophy and systemic inflammation (11). Unfortunately, while ATM pro-inflammatory activation and expansion under atherogenic conditions are well documented (12), the phenotypes and heterogeneity of ATM during atherogenesis remain poorly understood.
CD36 is a type 2 cell surface scavenger receptor highly expressed in macrophages as well as non-immune cells like adipocytes (13). Besides its role as a signal transducer mediating immune cell activation, CD36 also facilitates long-chain fatty acid transport across the plasma membrane, which is a unique feature among the scavenger receptors (14). We and our colleagues have previously demonstrated a contributing role of CD36 in foam cell formation and the development of atherosclerosis (15–18). Specifically, mice deficient in CD36 are resistant to diet-induced atherosclerosis (17). Moreover, CD36 deficiency protects mice ATM from diet-induced pro-inflammatory activation, implicating CD36 in the crosstalk between adipocytes and ATM (19).
In this work, we used scRNA-seq to analyze the transcriptomics of ATM from WAT of Apoe-null mice fed with an atherogenic high-fat diet (HFD), a widely used diet-induced atherosclerosis animal model (20). We identified the major subpopulations of ATM based on the specific transcriptome signatures described by others, including LAM, inflammatory macrophages, cavity macrophages, and vascular-associated macrophages (VAM). We also reported the presence of “unhealthy macrophages” displaying high lipid metabolism and low viability. Consistent with the literature on LAM in obesity (11), our pathway analysis revealed that the LAM were highly active in lipid metabolism, but downregulated pro-inflammatory pathways, compared to other major ATM. We further analyzed and identified the transcription factor regulons specific to each ATM subpopulation. Using ATM from WAT of age-matched Apoe/Cd36 double-null mice (17), we found that HFD resulted in an 8.4-fold increase in the relative amount of LAM in Apoe/Cd36 double-null mice, but not in Apoe-null mice. We validated this finding at protein levels by immunostaining and flow cytometry. Additionally, LAM increase was accompanied by a significant 42% higher long-chain fatty acid (palmitate) uptake by the ATM, less inflammatory ATM induction, and less adipocyte hypertrophy. Finally, we showed that the most differentially regulated genes caused by CD36 deficiency were those involved in pro-inflammatory responses and lipid metabolism. Our findings have indicated a negative role of CD36 in the regulation of LAM amount and lipid handling during atherogenesis and provided novel insights into molecular mechanisms of ATM dynamics.
Materials and methods
Mice
All mice used in this study were on the C57BL/6 background. Apoe-null mice (strain# 002052) were purchased from the Jackson Laboratory. Apoe/Cd36 double-null mice were generated as previously described (17). All mice were kept in a 12-hour dark/light cycle and fed standard chow ad libitum until the start of the diet challenge. Adult mice of both sexes between 12 and 16 weeks of age were randomly divided into two groups: one was continued on a standard chow diet, and the other was placed on an HFD (Harlan Teklad, #TD.88137) for 10 weeks. The diet is high in total fat (21% by weight and 42% kcal from fat) and saturated fatty acids (>60% of total fatty acids) and is widely used on atherosclerosis-prone mouse models (16, 18). All mice were weighed once every week before being euthanized at the end of the 10-week diet challenge. Mice were euthanized by CO2 asphyxiation followed by cervical dislocation. For the scRNA-seq, we combined perigonadal visceral white adipose tissue WAT (pgWAT) from one male and one female in each condition to eliminate differences introduced by sex. All procedures involving live animals were approved by the Institutional Animal Care and Use Committee at the Medical College of Wisconsin.
Isolation of pgWAT-associated leukocytes for scRNA-Seq
Mice were sacrificed and perfused with 10 ml PBS to remove peripheral blood from the adipose tissues. Then pgWAT was isolated, weighed, and washed with ice-cold PBS. pgWAT was minced into 2–3 mm pieces by scissors and transferred to gentleMACS C-tubes (Cat# 130-093-237, Miltenyi Biotec) with 1.5 ml enzymatic digestion mixture (Liberase, 0.77 mg/ml; Hyaluronidase, 0.3 mg/ml; Deoxyribonuclease, 0.3 mg/ml; BSA, 1 mg/ml; CaCl2, 1.5 μM in PBS). Tissues were digested in a gentle MACSTM Octo Dissociator with Heaters (Cat# 130-096-427, Miltenyi Biotec) at 37°C for 30 min. Suspensions were immediately filtered with a 70 μm cell strainer (Fisher Scientific) and washed once with FACS buffer (5% FBS and 0.1% sodium azide in PBS). Then, CD45+ cells were selected by the EasySep Mouse CD45 Positive Selection Kit (Cat# 18945, STEMCELL Technologies). The CD45+ cells were then suspended in the FACS buffer, counted, and immediately loaded onto a 10× Genomics Chromium instrument according to the instructions from the Chromium Next GEM Single Cell 3’ Reagent Kits v3.1 (Cat# PN-1000121, 10× Genomics, Pleasanton, CA, USA). 5,000 live cells per condition were loaded onto each GEM.
Flow cytometry assays
Cell suspension was prepared in 200 μl FACS buffer. All flow cytometry experiments were performed with a BD LSR II instrument using FACSDiva software with optimal compensation and gain settings determined for each experiment based on unstained and single color-stained samples. Live cells were gated based on cell forward and side scatter signals. Doublets were excluded based on FSC-A vs. FSC-H plots. Flowjo software version 10.9.0 (Tree Star, OR) was used to analyze the data. To quantify Trem2+ LAM, cell suspension was stained with FITC-conjugated anti-F4/80 (Cat# 123108, Biolegend) and PE-conjugated anti-Trem2 (Cat# FAB17291P, R&D Systems). Cells were washed three times with FACS buffer and subjected to flow cytometry analysis.
Ex vivo palmitate uptake assay
CD45 + cells isolated from pgWAT were incubated with 1 μg/ml Bodipy-C16 Palmitate (Cat# D3821, Invitrogen) in FACS buffer at 37°C 15 min (18) and stained by Pacific Blue-conjugated anti-CD11b (Cat# 101224, Biolegend) and PE/Cyanine5-conjugated anti-F4/80 (Cat# 123111, Biolegend). Cells were washed three times with FACS buffer and subjected to flow cytometry analysis.
Plasma isolation and profiling
All mice were fast for 5 h before whole blood collection through the jugular vein. The whole blood was centrifuged at room temperature at 1,200 g for 10 min. The supernatant (plasma) was transferred to a fresh Eppendorf tube and stored at −80 freezer. Plasma insulin was measured using a commercial ELISA kit (Cat# 90080, Crystal Chem). Plasma IL-6 was measured by a commercial ELISA kit (Cat# 88-7064-22, Invitrogen).
Single-cell RNA-sequencing analyses
Library preparation and sequencing
ScRNA-seq libraries were prepared using the Chromium Next GEM Single Cell 3’ Reagent Kits v3.1 (10× Genomics) following the manufacturer's instructions. The library quality was assessed with the Bioanalyzer RNA Nano Assay (Agilent). Generated libraries were then sequenced on the Illumina High Seq-2500 platform.
Data processing
Feature-barcode matrix were generated using the Cell Ranger 4.0 (10× Genomics). Sequenced data were aggregated and reads were aligned by the Cell Ranger. The following quality control steps were conducted: 1. cells that have unique feature counts over 6,000 or less than 50 were excluded for further analysis; 2. cells that have over 20% of unique molecular identifiers (UMIs) were derived from the mitochondrial genome were excluded for further analysis; 3. cells with the expression more than 4 in Hbb-related genes like Hbb-bs, Hba-a1, Hba-a2, and Hbb-bt after normalization were considered contaminated cells from epididymis and were excluded for further analysis. The data were normalized and scaled for principal component analysis (PCA) by Seurat Package. The computational method SingleR was used to annotate cell clusters. Then identified macrophages from all 4 conditions were pooled together for further analysis. We used 10 dims from PCA and set the resolution to 0.5 for cell clustering. Uniform manifold approximation and projection (UMAP) functions were used for visualizing the cells on a 2-dimension plot.
Gene set analysis and regulon analysis
We used gseKEGG function in ClusterProfile Package (21) for gene set enrichment analysis (GSEA), based on FindMarkers function from Seurat Package. Library org.Mm.eg.db was used for gene ID mapping. We used dotplot and gseaplot2 for further visualizing the GSEA results. Transcription factor regulons were characterized by Single-Cell rEgulatory Network Inference and Clustering (SCENIC), a computational method generated previously (22).
Results
Macrophages are the predominant immune cells in the white adipose tissues during atherogenesis
We fed Apoe-null mice with HFD for 10 weeks, a widely used diet-induced atherosclerosis animal model (20). CD36 is widely expressed in many immune cells, especially macrophages (13), and has a significant impact on adipose tissue inflammation and metabolism (19). Moreover, Apoe/Cd36 double-null mice were resistant to diet-induced atherosclerosis (17). Therefore, in this work, we included Apoe/Cd36 double-null mice and compare them with Apoe-null mice to investigate how CD36 deficiency affected ATM phenotypes. We chose the pgWAT for our scRNA-seq analysis because visceral WAT, compared with subcutaneous adipose tissues, are more correlated with metabolic syndromes and atherosclerosis (2, 3, 23). After a 10-week diet to induce an intermediate stage of atherosclerosis in the Apoe-null HFD group, we removed pgWAT from all 4 groups of mice (Supplementary Figure S1), digested to single cell suspension, and purified adipose tissue immune cells using a CD45 positive selection kit (StemCell Technologies). Immediately, we performed scRNA-seq using the 10× Genomics platform (Supplementary Figure S1). After the data quality control steps, we have altogether acquired 1,650 cells from Apoe-null chow pgWAT, 3,957 cells from Apoe-null HFD pgWAT, 1,759 cells from Apoe/Cd36 double-null chow pgWAT, and 1,987 cells from Apoe/Cd36 double-null HFD pgWAT.
Next, we identified each cell cluster using a previously developed computational method, SingleR (24), according to ImmGen reference database (25). We found that pgWAT contained a variety of immune cells, including B cells, T cells, macrophages, dendritic cells, innate lymphoid cells, neutrophils, NK cells, NKT cells, and other less-characterized cells. We used Seurat package to show distinct immune cell subpopulations through uniform manifold approximation and projection (UMAP) (Figure 1A). Violin plots of four commonly used macrophage markers (Adgre1, Csf1r, Cxcl2, and Mrc1) validated the macrophage identity (Figure 1B). Consistent with the literature (26), among all CD45+ pgWAT immune cells, macrophages represented the largest population (Figure 1C). Interestingly, macrophage relative amount was lower in Apoe/Cd36 double-null chow (36%) compared to Apoe-null chow (53%), suggesting that CD36 expression was involved in macrophage differentiation or maintenance. However, the macrophage relative amount increased to 74% in Apoe/Cd36 double-null HFD as compared to 64% in Apoe-null HFD (Figure 1D). Thus, CD36 appears to play a negative role in macrophage population expansion induced by HFD.
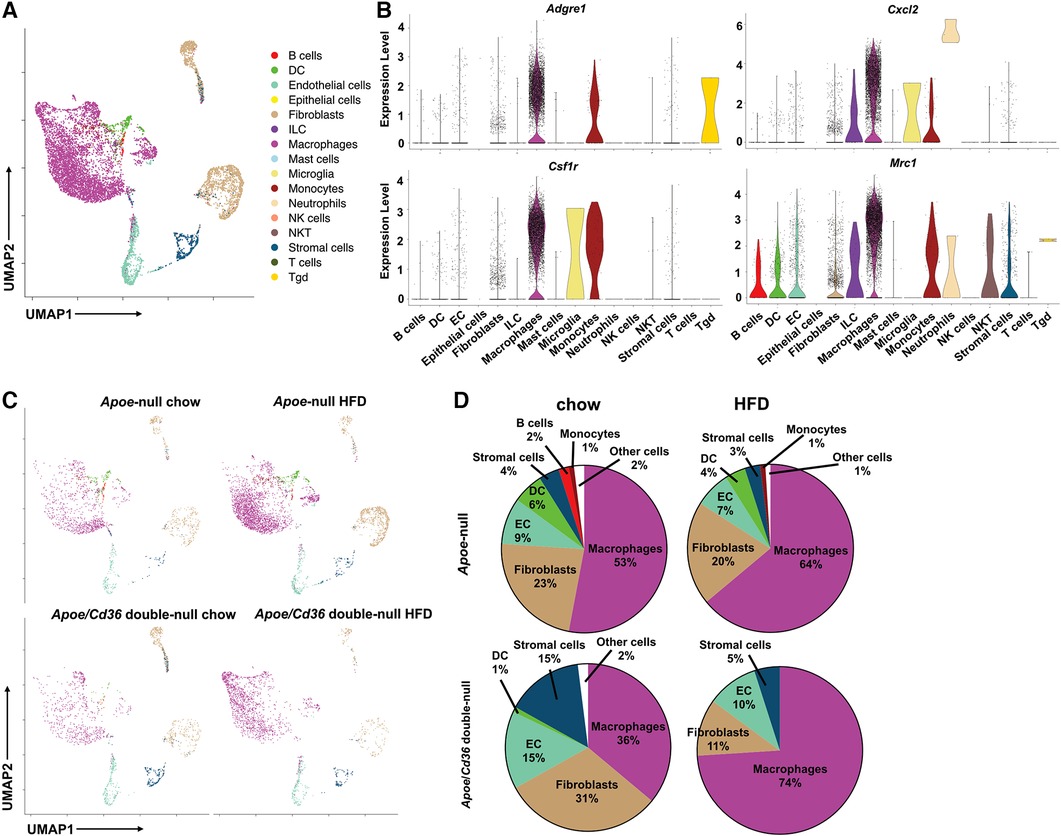
Figure 1. ATM represent the major immune cell type in the white adipose tissue during atherogenesis. (A) The Apoe-null or Apoe/Cd36 double-null mice fed on chow diet or HFD for 10 weeks were sacrificed (n = 2 per group) and CD45+ cells were isolated from pgWAT and subjected to scRNA-Seq analysis. Cells were unbiasedly clustered based on the FindNeighbors method from Seurat package. Distinct cell clusters are shown through uniform manifold approximation and projection (UMAP). Immune cell types were determined using the SingleR method. (B) Violin plots of relative expression of macrophage marker genes among CD45+ adipose tissue cells. (C) UMAP plots of 4 different conditions were shown. (D) Percentages of immune cell populations as defined by SingleR within total CD45+ cells in each condition were shown.
Identification of pgWAT macrophage subpopulations
Since ATM were the predominant immune cells in pgWAT and expanded further by HFD, we propose that change in macrophage subpopulations could provide critical knowledge on the inflammatory and metabolic status of pgWAT. To better characterize and identify macrophage subpopulations, we selected macrophages from all 4 samples and generated a second UMAP (Figure 2A). We detected 10 distinct macrophage clusters (Cluster 0–9). Among the 10 clusters, cluster 9 represented a very minor subset (<1%) with highly distinct transcriptomics from other clusters. Besides, their enriched genes showed a signature of peritoneal macrophages, i.e., Gata6, Fn1, F5, Selp (Supplementary Figure S2A), as reported previously (27, 28). Thus, we reasoned that cluster 9 represented peritoneal macrophage contamination during adipose tissue dissection and excluded cluster 9 from the following analysis. Clusters 4, 7, and 8 displayed relatively low feature counts and total RNA counts compared to other clusters (Supplementary Figure S2B), an indication of high cell membrane permeability or low cell viability. Despite that, these clusters (especially cluster 4) still expressed common macrophage markers such as Mrc1, cxcl2, adgre1, and csf1r, like other clusters (Figure 2B). So, we labeled clusters 4/7/8 as unhealthy macrophages. To explore the potential mechanism leading to the “unhealthiness”, we generated a volcano plot comparing the cluster 4/7/8 and other “healthy” ATM (Supplementary Figure S2C). In “unhealthy” macrophages, upregulated genes included those related to fatty acid transport (Fabp4), fatty acid synthesis (Scd1), and biogenesis of membrane lipid domains (cav1, cavin1, cavin2), which also affect lipid metabolism (29, 30). Downregulated genes included Lgals3, which encodes a protein with anti-apoptotic functions (31), and Ftl1, which encodes the ferritin light chain to protect cells from iron-induced oxidative stress and ferroptosis (32). Because ferroptosis is triggered by lipid peroxidation, the data implies that the unhealthy macrophages might be ferroptosis-prone cells due to abnormal lipid and iron metabolism. Next, we focused on the major clusters 0, 1, 2, 3, 5, and 6.
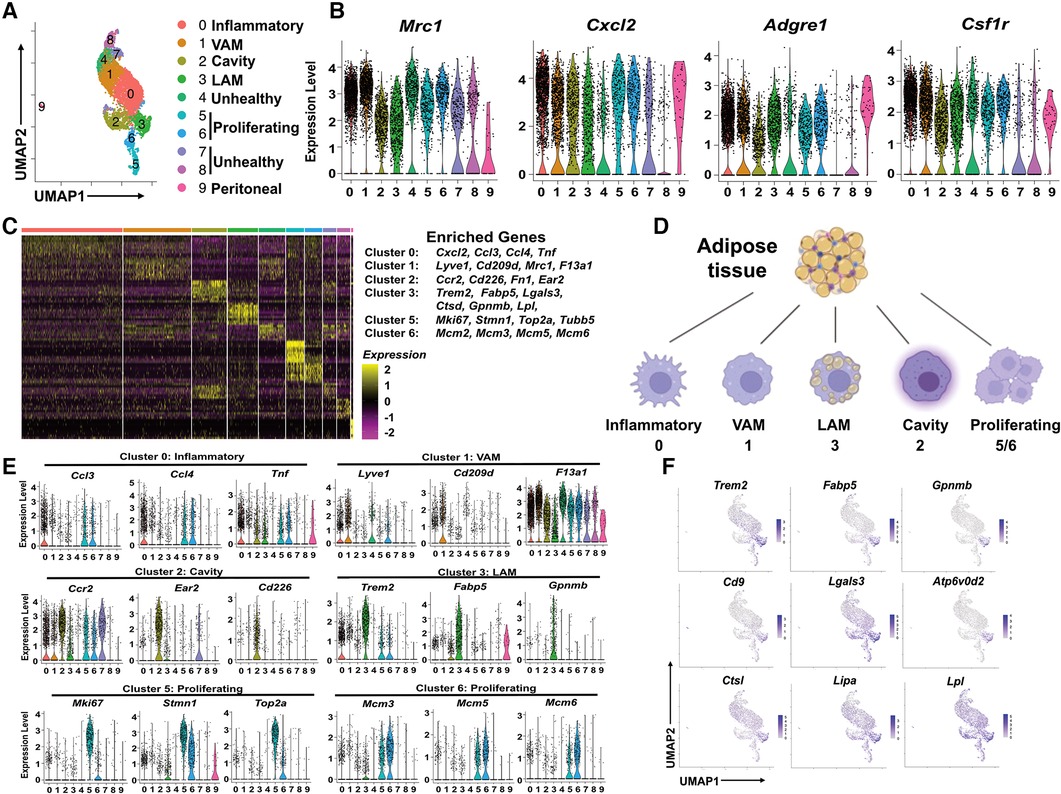
Figure 2. Identification of subpopulations of pgWAT ATM, which are highly dynamic during atherogenesis. (A) ATM from all 4 conditions were selected and combined. They were divided into 10 clusters (0–9) using the same method as in Figure 1 and shown in the UMAP. (B) Violin plots of relative expression of macrophage marker genes among ATM clusters. (C) Heatmap showing the 10 most upregulated genes in each cluster as defined in (A) Selected enriched genes used for biological identification of each cluster are shown on the right of the heatmap. (D) The ATM names corresponding to different cluster numbers in the texts are shown. (E) Violin plots of relative expression of enriched genes in the cluster 0, 1, 2, 3, 5, and 6. (F) Gene expression patterns projected onto the UMAP plots showing the enrichment of Trem2, Fabp5, Gpnmb, Cd9, Lagls3, Atp6v0d2, Ctsl, Lipa, and Lpl in LAM (cluster 3). The graphical panel in Figure 2D was created with BioRender.com.
We generated a heatmap of the top 10 enriched genes for each cluster. The major marker genes for clusters 0–3, 5, and 6 were listed on the right side of the heatmap (Figure 2C) and were used to identify ATM subpopulations (Supplementary Table 1 and Figure 2D). Cluster 0 was enriched with pro-inflammatory chemokines Ccl3, Ccl4, Cxcl2, and pro-inflammatory cytokine Tnf (Figures 2C,E). Their enriched gene signature was similar to that of inflammatory macrophages associated with mouse aorta during atherosclerosis (33). Therefore, Cluster 0 cells were identified as inflammatory macrophages. Cluster 1 was enriched with tissue-resident macrophage markers Lyve1, F13a1, and typical M2-like macrophage marker Cd209d, Mrc1 (Figures 2C,E). Interestingly, a recent study on ATM using scRNA-seq technique has identified a subpopulation of vascular-associated ATM (VAM) with highly similar enriched genes (34). In addition to lyve1, cd209d, and Mrc1, Cluster 1 cells share other enriched genes with VAM such as Abca1, Stab1, Mertk, and Lrp6 (Supplementary Figure S2D). So, Cluster 1 cells were identified as VAM. Cluster 2 was highly enriched with Ccr2, commonly found in monocytes, which use it as a receptor for CCL2 and chemoattraction. They also showed another monocyte marker, Lyz1, and cavity macrophage markers Cd226, Ear2, Fn1 (Figures 2E and Supplementary Figure S2A), as described before (35). Thus, Cluster 2 cells appeared to be macrophages differentiated from monocytes attracted from circulation or peritoneal cavities. We decided to follow the nomenclature assigned to both aorta and adipose tissue macrophages (35, 36) and address Cluster 2 cells as cavity macrophages.
Cluster 3 was enriched with a transcriptional signature highly overlapping with previously identified lipid-associated macrophages (LAM) from obese adipose tissues (11). Firstly, these cells are characterized by the enrichment of Trem2 (Figures 2E,F), a lipid-binding cell surface receptor (37). Secondly, they shared many enrichment genes like Fabp5, Gpnmb, Cd9, Lgals3, Ctsl, Ctsd, Atp6v0d2, Lipa, and Lpl (Figures 2C–F) (11). Interestingly, most of the Trem2+ LAM-enriched genes are also enriched in aorta-associated foam cells (33, 35), probably due to the notion that both of them are highly active in lipid metabolism. Cluster 5 cells were enriched with cell proliferation and cell cycle marker genes Mki6 (38), Stmn (39), and Top2a (40) (Figures 2C,E). Cluster 6 expressed the highest levels of MCM genes (Mcm2, Mcm3, Mcm5, Mcm6) (Figures 2C,E), which encode proteins mediating the DNA replication (41), the S phase of the cell cycle. Therefore, both Cluster 5 and Cluster 6 cells showed signs of proliferation and were identified as proliferating macrophages.
The pgWAT ATM are highly dynamic during atherogenesis
Visceral adipose tissue inflammation promotes atherosclerosis (42). As expected, feeding Apoe-null mice with atherogenic HFD significantly increased body weight compared to those on the chow diet (Supplementary Figure S3A). This effect was attenuated in Apoe/Cd36 double-null mice, although no significant difference in subcutaneous or gonadal fat (pgWAT) was observed between Apoe-null and Apoe/Cd36 double-null on HFD (Supplementary Figure S3B). Next, we examined the dynamics of pgWAT ATM subpopulations. Figure 3A shows the difference in macrophage subtype distribution. Specifically, inflammatory macrophages increased from 7.4% to 48.8% by HFD in Apoe-null pgWAT, while the increase by HFD was mild (13.7% in chow compared to 22.6% in HFD) in Apoe/Cd36 double-null pgWAT (Figure 3B). This is consistent with the notion that atherosclerosis is a systemic inflammatory condition and CD36 contributes to adipose tissue inflammation (19). Nevertheless, VAM did not show obvious change, while cavity macrophages were slightly reduced in both Apoe-null pgWAT (14.5% in chow compared to 7.0% in HFD) and Apoe/Cd36 double-null pgWAT (20.3% in chow compared to 10.8% in HFD), probably because more cavity macrophages were differentiated into inflammatory macrophages by HFD. The proliferating macrophages increased from 6.5% to 14.5% by HFD in Apoe-null pgWAT. However, a minor increase was observed (7.6% to 8.6% by HFD) in Apoe/Cd36 double-null pgWAT. A surprising finding was the relatively high content of unhealthy macrophages under chow diet conditions (42.5% in Apoe-null pgWAT and 32.1% in Apoe/Cd36 double-null pgWAT). Interestingly, they were decreased under HFD conditions (7.6% in Apoe-null pgWAT and 8.7% in Apoe/Cd36 double-null pgWAT) (Figure 3B).
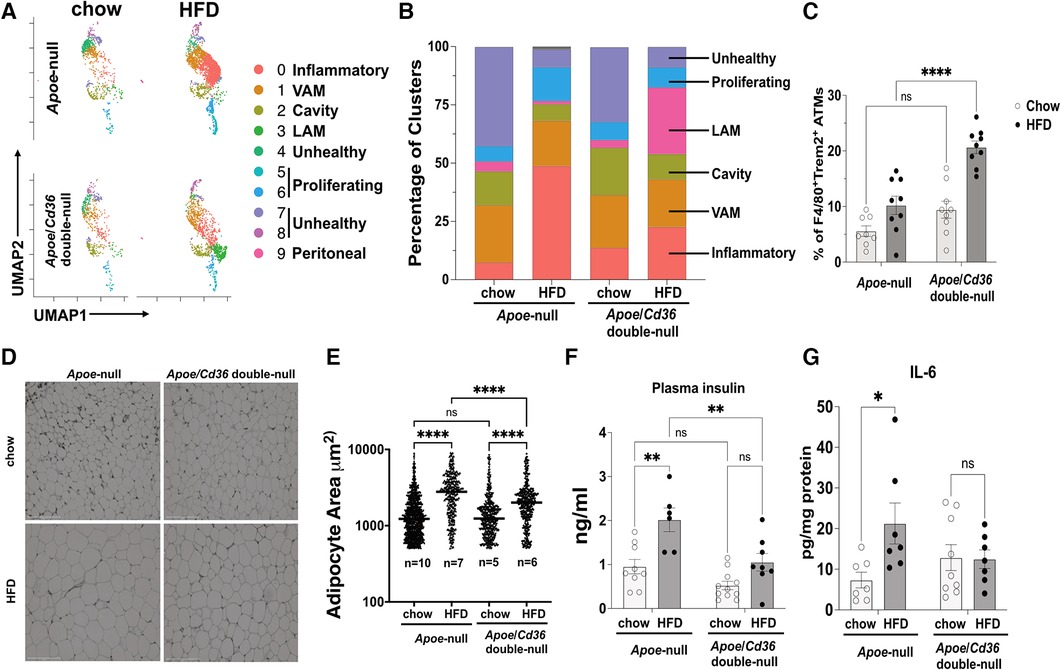
Figure 3. LAM relative content is upregulated by HFD specifically in the apoe/Cd36 double-null mice. (A) UMAP plots of 4 different conditions demonstrate distinct ATM constitutions. (B) Bar chart of the relative frequency of ATM subpopulations among 4 conditions. (C) Flow cytometry analysis of the percentage of F4/80 + Trem2+ ATM among all CD11b + F4/80+ ATM. Data are shown as mean ± S.E. in the bar graphs (n = 8-9 individuals per group) and Two-Way ANOVA was performed. (D) Representative images of H&E-stained adipose tissues. Scale bar: 150 μm. (E) Areas of the adipocytes shown in (D) were quantified and shown in the dot plot chart. The medium value in each condition was denoted with a horizontal line. The n value means the number of individuals. One-Way ANOVA was performed. ns: not significant. (F) Plasma insulin levels and (G) pgWAT IL-6 levels were shown in the bar graphs (n = 6-11 individuals per group). *P < 0.05, **P < 0.01, ****P < 0.0001.
The Trem2+ LAM distribution pattern among 4 conditions was interesting. While their content was low under chow diet conditions (4.3% in Apoe-null pgWAT and 3.4% in Apoe/Cd36 double-null pgWAT), Trem2+ LAM percentage increased more than 8-fold to 28.6% in Apoe/Cd36 double-null on HFD, but not in Apoe-null on HFD (1.4%) (Figure 3B). To validate, co-immunostaining of F4/80 (macrophage marker) and Trem2, followed by flow cytometry experiments (Figure 3C) confirmed the relatively high amount of Trem2+ LAM only in the pgWAT of Apoe/Cd36 double-null mice on HFD. According to a previous report (11), Trem2+ LAM counteract inflammation and protect adipose tissue from metabolic dysregulation and adipocyte hypertrophy. Therefore, an increase of Trem2+ LAM in Apoe/Cd36 double-null pgWAT HFD condition may be a contributing factor that limited inflammatory macrophage expansion. Supporting this notion, although HFD induced adipocyte hypertrophy in both genotypes, less adipocyte hypertrophy induction was observed in Apoe/Cd36 double-null pgWAT (Figures 3D,E). In addition, HFD increased plasma insulin (Figure 3F) and eWAT IL-6 levels (Figure 3G) in Apoe-null mice, both of which indicated insulin resistance (43). Nevertheless, Apoe/Cd36 double-null mice appeared to be protected here, supporting the notion that Trem2+ LAM provide beneficial effects against metabolic dysfunction.
The LAM were less inflammatory and more active in lipid metabolism
We next investigated pathways that are distinctly activated in major macrophage subpopulations (cluster 0–4). We ranked all genes by their relative enrichment in different macrophage clusters, followed by Gene Set Enrichment Analysis (GSEA) comparing either of two clusters according to Kyoto Encyclopedia of Genes and Genomes database (KEGG). We found that there were very few (2–7) differentially activated/suppressed pathways from a total list of 341 pathways among inflammatory, VAM, cavity, and unhealthy macrophages (Supplementary Table 2). However, the LAM displayed more (35–60) differentially activated/suppressed pathways compared with either major macrophage subpopulations (Supplementary Tables 3-6), suggesting that LAM cells are highly distinct from other ATM. To further understand the features of LAM cells, we combined major ATM other than LAM (denoted as other ATM) and performed a GSEA comparing with LAM. This approach reveals the common pathways that are specifically up or downregulated in LAM (Figure 4A). Consistent with a previous report on the LAM isolated from mouse adipose tissues (11), the LAM appeared to be metabolically active in energy production (oxidative phosphorylation and glycolysis), lipid metabolism (cholesterol metabolism and PPAR signaling for fatty acid metabolism), and phagocytosis (phagosome, synaptic vesicle trafficking, and lysosome) (Figures 4A,B). The downregulated pathways were mostly related to inflammation, such as TNF signaling, NF-κB signaling, IL-17 signaling, and viral protein receptor interaction (Figures 4A,C). Interestingly, the high lipid metabolism with low inflammatory signaling signatures in Trem2+ LAM were very similar to those observed in aorta-associated Trem2+ foam cells (44). To further test the functional relevance, we isolated pgWAT ATM and conducted a palmitate uptake assay. Consistent with an increase in LAM, ATM from the Apoe/Cd36 double-null HFD condition showed a significant 42% increase in palmitate uptake (Figure 4D).
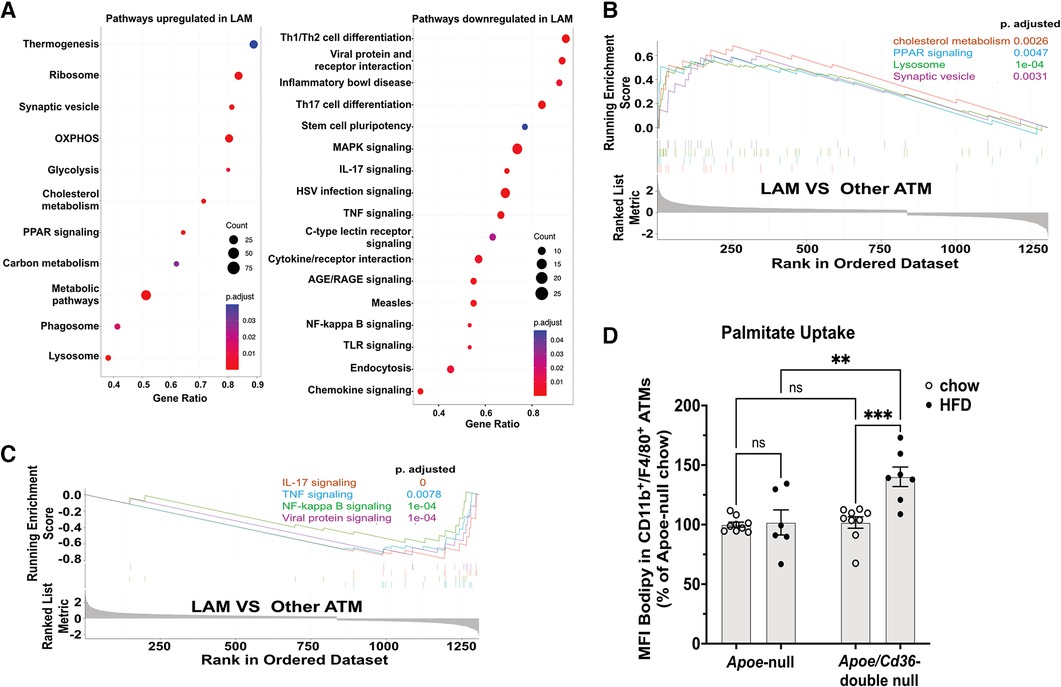
Figure 4. LAM are more active in lipid metabolism and less inflammatory, compared to other ATM. (A) Gene ontology enrichment analysis of biological pathways showing upregulated pathways (left panel) and downregulated pathways (right panel) in the LAM. (B) GSEA on LAM upregulated pathways including cholesterol metabolism, lysosome, PPAR signaling, and synaptic vesicle cycle. (C) GSEA on LAM downregulated pathways including IL-17 signaling, NF-κB signaling, TNF signaling, and viral protein signaling. (D) Isolated ATM were incubated with Bodipy-labeled palmitate for 15 min. Flow cytometry analysis of palmitate uptake by CD11b + F4/80+ ATM. Mean fluorescence intensity (MFI) of Bodipy was quantified. Data are shown as mean ± S.E. in the bar graphs (n = 7 individuals per group) and Two-Way ANOVA was performed. ns: not significant. **P < 0.01.
ATM subpopulations display distinct patterns of transcription factor regulons
Gene transcription is mainly determined by the activities of transcription factors and their co-activators/repressors. To understand what transcription factors, co-activators, co-repressors, and their downstream target genes (regulons) are characteristic of each macrophage cluster, we conducted Single-Cell rEgulatory Network Inference and Clustering (SCENIC) (22). In Figure 5A, we present a comprehensive picture of the regulon activity among all ATM. The first interesting finding is that inflammatory macrophages (cluster 0) and the anti-inflammatory VAM (cluster 1) are similar in regulon activities. Specifically, they share many transcription factor regulons (Box A), including Maf, Mafb, and Dab2 that are in favor of “M2-like” anti-inflammatory macrophages (45–47), Mef2c that promotes “M1-like” pro-inflammatory macrophages (48), Jdp2 that is involved in macrophage differentiation (49), and Egr3, a regulator of immune cell activation (50).
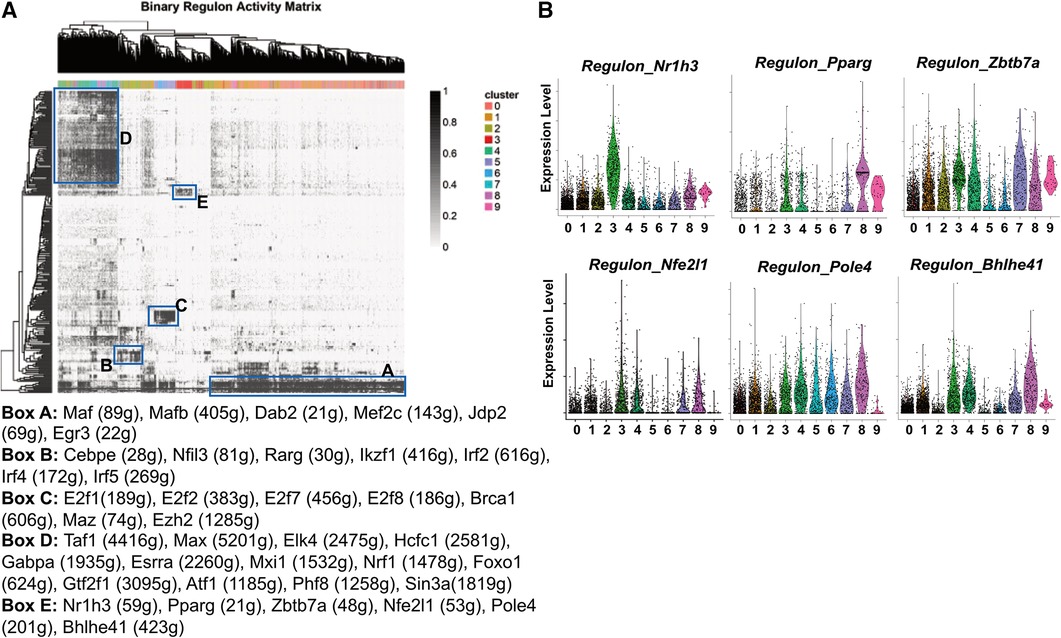
Figure 5. Transcription factor regulons of pgWAT ATM. (A) SCENIC results showing the binary regulon activity matrix. The regulons that are specific to ATM subpopulations are highlighted in rectangle boxes (A–E). The highly enriched transcription factor regulons in each box are listed underneath the matrix. (B) Violin plots of relative expression of LAM-active regulons among ATM clusters.
The cavity macrophages (cluster 2) displayed a distinct pattern of transcription factor regulons (Box B). They include Cebpe, which is involved in macrophage lipid metabolisms and differentiation (51, 52), Nfil3, which regulates macrophage activation against enteric microbiota (53), and Rarg, Ikzf1, Irf2, Irf4, Irf5, all of which facilitate “M2-like” polarization of macrophages (54–56). The proliferating macrophages (clusters 5 and 6) were enriched with transcription factor regulons (Box C). Consistent with their identity, their specific regulons include E2f family members that are critical regulators of the cell cycle (57), Brca1, which is an important regulator of DNA damage repair and cell cycle checkpoint control (58), and two transcriptional regulators potentially for genome stability (Maz, Ezh2) (59, 60). The unhealthy macrophages (clusters 4, 7, and 8) shared many regulons (Box D), among which are Nrf1, a mitochondria biogenesis regulator (61); Foxo1, a glycolysis regulator (62), and Atf1, which is involved in the macrophage response to iron handling and oxidative stress (63). These findings further suggest that those cells are unhealthy due to defective metabolism, energy production, and subsequent oxidative stress, potentially leading to ferroptosis.
The most interesting finding is the identification of transcription factor regulons that are highly active in LAM (Box E). Firstly, the regulon by Nr1h3 is almost exclusively highly activated in LAM (Figure 5B). Nr1h3 encodes the transcription factor Liver X receptor-α (LXR-α), which is a member of the nuclear hormone receptor superfamily. LXR-α is highly activated in tissues/cells for the regulation of cholesterol efflux in response to elevated intracellular cholesterol (64, 65). In macrophages, their activation often leads to anti-inflammatory responses (65), which is in agreement with our pathway analysis showing that LAM are largely non-inflammatory macrophages (Figure 3). LAM is also active in the PPAR-γ (encoded by the gene Pparg) regulon (Figure 5B) that is known to regulate macrophage cholesterol levels by mediating CD36 expression and oxidized LDL uptake (66). Additionally, PPAR-γ also controls fatty acid metabolism as well as macrophage polarization in response to different stimulants (67). Zbtb7a is a third identified LAM-specific transcription factor (Figure 5B) that is known to promote lipid metabolism through SREBP1 (68). The above three transcription factor regulons (LXR-α, PPAR-γ, and Zbtb7a) have further supported the notion that LAM are highly active in lipid metabolism. The next identified regulon is mediated by the nuclear factor erythroid-2 like 1 (encoded by the gene Nfe2l1). It is a member of the CNC-bZIP family of transcription factors, which is induced by oxidative stress (69). Previous studies have indicated that Nrf1 is critical for protecting cells against lipid or metal-induced oxidative stress (70–73). Thus, an active Nfe2l1-mediated regulon shared by both LAM and unhealthy macrophages (Figure 5B) suggests that LAM are possibly under oxidative stress due to lipid or metal accumulation. A further demonstration of LAM under stress is the concentration of Pole4-mediated regulon. Pole4 encodes the DNA polymerase ε 4, which was found to be a histone chaperone for the maintenance of chromatin integrity (74, 75). Since oxidative stress may lead to DNA damage and cell death (76), the Pole4 regulon shared by all ATM (Figure 5B) indicated a microenvironment with oxidative stress. The last identified LAM-active regulon is Bhlhe41, which is involved in macrophage self-renewal and cell identity (77).
CD36 deficiency reverses the pro-inflammatory and metabolic responses to HFD
Using volcano plots, we showed genes that were differentially expressed by comparing Apoe-null chow and Apoe-null HFD conditions (Figure 6A). We found many ribosome genes (Rps12, Rpl10, Rpl30, Rpl9, Rps13, Rps2) and Hspa8 for proper protein folding in HFD conditions, indicating ATM were active in protein synthesis. Meanwhile, many inflammatory genes (Ifi27l2a, Cd74, Cxcl2, Nfkbiz, Icam1, Ccl3) were significantly elevated, which was confirmed by GSEA (Figure 6A), consistent with the notion that HFD stimulated a pro-inflammatory response in pgWAT.
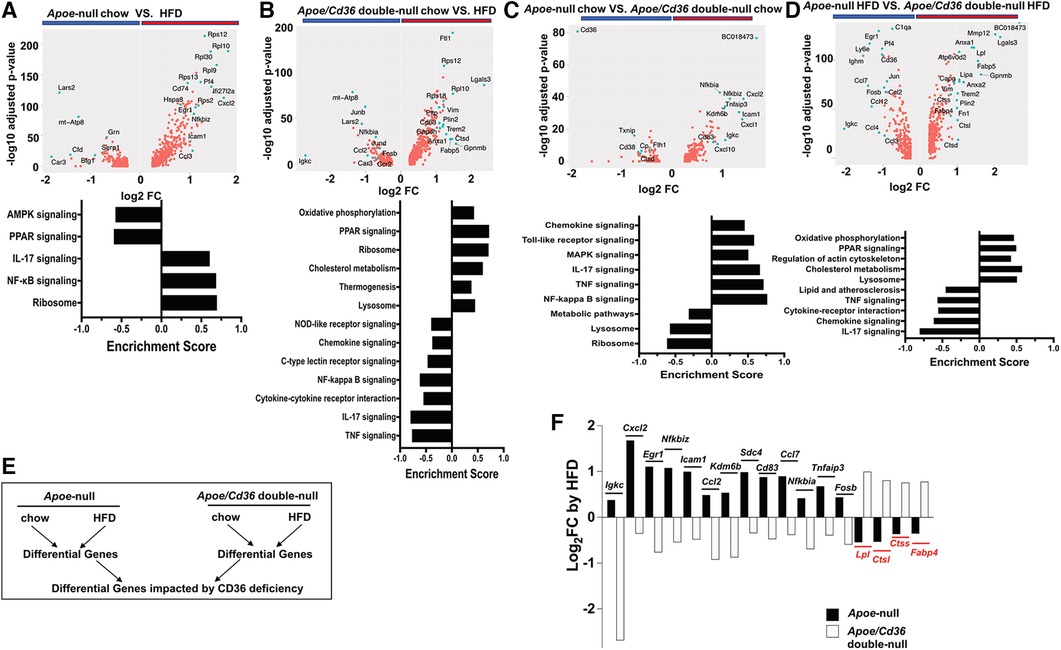
Figure 6. Cd36 deficiency reverses the pro-inflammatory and metabolic responses to HFD. (A) Upper panel: Volcano plot showing Apoe-null chow vs. Apoe-null HFD gene expression fold change (x-axis, log2 scale) and their adjusted p-value (y-axis, -log10 scale). Highly significant genes are indicated by a green dot. Bottom panel: GSEA showing significantly different pathways compared between Apoe-null chow and Apoe-null HFD. (B) Same analysis as in (A) comparing Apoe/Cd36 double-null chow and Apoe/Cd36 double-null HFD. (C) Same analysis as in (A) comparing Apoe-null chow and Apoe/Cd36 double-null chow. (D) Same analysis as in (A) comparing Apoe-null HFD and Apoe/Cd36 double-null HFD. (E) The schematic diagram shows the strategy for identifying genes that are most impacted by CD36 deficiency. (F) Fold change (y-axis, Log2 scale) of individual genes (x-axis) as induced by HFD in Apoe-null or Apoe/Cd36 double-null pgWAT ATM respectively. The top 17 differentially regulated genes are shown.
However, the response of Apoe/Cd36 double-null pgWAT ATM to HFD was largely different. HFD condition was associated with many metabolic genes (Trem2, Plin2, Ftl1, Pltp, Anxa1, Lgals3, Gapdh), most of which were involved in lipid metabolism. Other upregulated genes by HFD included Vim (cytoskeleton regulation), Ctsd (lysosome functions), Cd63 (exosome biogenesis), and ribosome genes (Figure 6B). Opposite to what was observed in Apoe-null pgWAT ATM, inflammatory genes (Igkc, Junb, Jund, Fosb, Nfkbia, Ccl2, Ccr2) were downregulated by HFD in Apoe/Cd36 double-null pgWAT ATM. Moreover, GSEA confirmed that HFD increased metabolic pathways (oxidative phosphorylation, PPAR signaling, cholesterol metabolism, thermogenesis, lysosome) and decreased pro-inflammatory pathways (Figure 6B). Since most upregulated genes and pathways were the same to those in LAM (Figure 2F, 4A), we reasoned that the major difference was contributed by a percentage increase in LAM (Figure 3B).
We next directly compared between Apoe-null and Apoe/Cd36 double-null. Under chow conditions, the most downregulated gene was cd36 as expected (Figure 6C). But the most upregulated gene, BC018473, encodes a long non-coding RNA with an unknown function, which might be a good candidate for future investigation. Interestingly, CD36 deficiency led to higher inflammatory genes and pathways and lower metabolic pathways (Figure 6C). Nevertheless, under HFD conditions CD36 deficiency promoted metabolic pathways with reduced inflammation (Figure 6D). To further characterize how CD36 deficiency led to differential gene expression, we quantified the fold change of each gene by HFD within each genotype, followed by a comparison between genotypes (Figure 6E). This strategy allowed us to find the most differentially regulated genes considering both HFD and CD36 deficiency factors. Figure 6F showed the highest 17 differentially regulated genes. Consistently, inflammatory genes (Igkc, Cxcl2, Egr1, Nfkbiz, Icam1, Ccl2, Kdm6b, Cd83, Ccl7, Nfkbia, Tnfaip3, Fosb) predominated those upregulated by HFD in Apoe-null ATM but downregulated by HFD in Apoe/Cd36 double-null ATM. The only non-inflammatory gene was Sdc4, which encoded syndecan-4 protein, a heparan sulfate proteoglycan involved in exosome biogenesis (78). 4 genes were downregulated by HFD in Apoe-null ATM but upregulated in Apoe/Cd36 double-null ATM. Two (Lpl, Fabp4) were lipid metabolism genes, and two (Ctsl, Ctss) were lysosome enzyme genes.
Discussion
In this study, we revealed and characterized distinct transcriptomics signatures of major pgWAT ATM subpopulations from a diet-induced atherosclerosis mouse model. Consistent with the literature applying scRNA-seq on adipose tissues and aortas (11, 34), the major ATM subpopulations were identified as inflammatory macrophages, tissue-resident VAM, cavity macrophages, LAM, and proliferating macrophages (Figure 2). In addition, we showed a previously undefined ATM cluster and labeled them as “unhealthy macrophages” based on their low feature and total RNA counts (Supplementary Figure S2B). However, we do not think these “unhealthy macrophages” were simply byproducts during tissue processing that randomly disrupted cell membranes. This is because: (1) although relatively low compared to other ATM, they still expressed between 500 and 2,000 feature counts with comparable macrophage marker gene expression like Mrc1 (Figure 2B); (2) their percentages among ATM were much higher under chow conditions than those under HFD conditions (Figure 3B), which suggested that their formation was affected by diet-associated microenvironment instead of random tissue processing, and 3. most importantly, our differential gene expression analysis comparing them to the healthy ATM suggested that “unhealthy macrophages” might be undergoing programmed cell death due to abnormal lipid and iron metabolism (Supplementary Figure S2C). Since the adipose tissues provide a lipid-enriched microenvironment (79, 80), these features of “unhealthy macrophages” have raised the question of whether ATM are constantly under stress by extracellular lipids and the atherogenic hyperlipidemia conditions may aggravate the stress, which drives chronic inflammation in the adipose tissues. Supporting this notion, a previous study in obese mice demonstrated that adipocyte-derived lipids modulated ATM lipotoxicity and M1 (pro-inflammatory) polarization (81). Although we are still unclear about the molecular mechanism of adipocyte/macrophage crosstalk to maintain the local lipid balance under physiological and atherogenic conditions, our findings on LAM elevation in CD36 deficient mice may provide a clue.
LAM is characterized by the enrichment of Trem2, a lipid receptor and regulator (82). First identified in WAT from obese mice and humans, the Trem2+ LAM function in lipid uptake and metabolism to prevent adipocyte hypertrophy, local inflammation, and systemic metabolic dysregulation (11). The transcriptomics signatures of Trem2+ LAM reported here and by Jaitin et al. are highly similar to the Trem2+ foam macrophages identified in the mouse aortas (33, 44), which suggests that they may perform similar functions as well. However, a critical difference in our findings is that Trem2+ LAM from pgWAT did not appear to accumulate under atherogenic conditions (Figure 3B). Surprisingly, although Cd36 is one of the markers of Trem2+ LAM (11), its deficiency leads to the increase of LAM induced by HFD (Figure 3B). Thus, we draw two conclusions based on these results. First, CD36 is not required for LAM formation and function. Second, CD36 expression restricts pgWAT LAM increase under atherogenic conditions. The increase in Trem2+ LAM in Apoe/Cd36 double-null pgWAT was accompanied by less inflammatory macrophages compared to Apoe-null pgWAT-HFD. We propose that increased Trem2+ LAM alleviated extracellular lipid stress in the adipose tissues and reduced local inflammation. Our pathway analysis (Figure 4) and transcription factor regulon (Figure 5, Box E) result further support this notion showing the enrichment of the lipid metabolism genes and downregulation of the pro-inflammatory genes in Trem2+ LAM, which is corroborated by palmitate uptake assay (Figure 4D). In agreement with this hypothesis, we reported that ATM isolated from HFD-fed CD36 deficiency mice were protected from diet-induced pro-inflammatory signaling and insulin resistance (19). Since insulin resistance is associated with hyperinsulinemia (83), it is also consistent with our observation of no plasma insulin induction by HFD in the Apoe/Cd36 double-null mice (Figure 3F).
A potential scenario to explain the increase in Trem2+ LAM and less inflammatory macrophages in CD36 deficient mice is that ATM CD36 expression is important for a pro-inflammatory response to hyperlipidemia but is dispensable for lipid uptake and catabolism. Alternatively, as we used CD36 full-body deficient animals, it is also possible that adipocyte CD36 mediates the pro-inflammatory response to hyperlipidemia and restricts Trem2+ LAM via adipocyte/macrophage crosstalk. Thus, more CD36 tissue-specific deficient animals are required to study mechanisms of ATM dynamics during atherogenesis further. Regardless of the real scenario, an important lesson learned here is that macrophage lipid metabolism is somehow associated with its inflammatory status and viability. This may also apply to the aortic macrophages that directly contribute to the atherosclerotic plaques. Moreover, the adipose tissues are active endocrine organs and regulate systemic inflammation. Perivascular adipose tissues mediate inflammation that contributes to atherosclerosis (84), which is also compatible with the proposition that adipocytes chronically activate aortic macrophages facilitating the progression of atherosclerosis. Unfortunately, little is known about the molecular mechanisms of how adipocytes crosstalk with macrophages in distinct tissues during atherogenesis.
Our study provides a novel perspective on the pro-atherogenic function of CD36, which is highly expressed by both adipocytes and macrophages. CD36 deficiency under atherogenic conditions not only significantly alters the ATM dynamics (Figure 3B), but also decreases adipocyte hypertrophy (Figures 3E,F), which is associated with adipose tissue dysfunction and metabolic disease (85). Therefore, it is likely that CD36 is involved in the adipocyte/macrophage crosstalk by sensing the extracellular lipids such as oxPCCD36 or oxidized LDL, which are highly induced within the circulation under atherogenic hyperlipidemic oxidative conditions (86, 87). These lipids may chronically bind and activate CD36 in both adipocytes and macrophages, leading to adipose tissue dysfunction and abnormal lipid metabolism and deposition, as observed in atherosclerosis. Since CD36 null humans are common in some areas and they appear to have a normal life expectancy and no obvious increased risk for specific diseases (14), our results highlight the possibility of designing specific CD36 inhibitors against chronic inflammatory metabolic diseases, such as atherosclerosis.
Taken together, our results reveal a delicate balance between lipid metabolism and inflammation that governs ATM dynamics during atherogenesis. CD36 is critically involved in the maintenance of this balance, possibly via its dual role as a signal transducer and a fatty acid transporter (14).
Limitations of the study
Despite our comprehensive analysis integrating scRNA-seq data with tissue histology, plasma profiling, and metabolic assays, we acknowledge the inherent limitations of our study stemming from methodological constraints. Firstly, the “unhealthy macrophages” remain to be further characterized to confirm that they are unhealthy due to defective metabolism induced by lipid stress. Secondly, we could not compare ATM transcriptomics profiles between sexes, although we did not detect obvious sex differences in tissue histology, plasma profiling, and lipid uptake, except for the fat weight. Thirdly, our study employed CD36 full-body knockout mice. As CD36 is highly expressed in both adipocytes and macrophages, the use of cell-type-specific CD36-deficient murine models would further enhance our understanding of CD36's role in adipose tissue function during atherogenesis.
Data availability statement
The datasets presented in this study can be found in online repositories. The accession number for the raw sequence data and the processed data reported in this paper is GSE242120. The code used for scRNA-seq data analysis is available at: https://github.com/vayac/20201109SingleCell. Any additional information required to reanalyze the data reported in this paper is available from the corresponding upon request.
Ethics statement
The animal study was approved by the Institutional Animal Care and Use Committee at the Medical College of Wisconsin. The study was conducted in accordance with the local legislation and institutional requirements.
Author contributions
VC: Data curation, Formal Analysis, Methodology, Software, Supervision, Visualization, Writing – original draft, Writing – review & editing. JZ: Data curation, Formal Analysis, Funding acquisition, Investigation, Project administration, Writing – review & editing. JC: Data curation, Formal Analysis, Methodology, Writing – review & editing. MB: Data curation, Writing – review & editing. LV: Data curation, Formal Analysis, Writing – review & editing. DW: Data curation, Methodology, Writing – review & editing. AG: Formal Analysis, Writing – review & editing. YW: Writing – review & editing. ZZ: Data curation, Writing – review & editing. WD: Data curation, Writing – review & editing. MK: Data curation, Formal Analysis, Writing – review & editing. SS: Data curation, Writing – review & editing. DP: Data curation, Writing – review & editing. ZZ: Conceptualization, Funding acquisition, Supervision, Writing – review & editing. KS: Funding acquisition, Supervision, Writing – review & editing. JS: Funding acquisition, Writing – review & editing. RS: Conceptualization, Funding acquisition, Project administration, Resources, Supervision, Writing – review & editing. SM: Resources, Writing – review & editing. YC: Conceptualization, Data curation, Formal Analysis, Funding acquisition, Investigation, Methodology, Project administration, Resources, Software, Supervision, Validation, Visualization, Writing – original draft, Writing – review & editing.
Funding
The author(s) declare financial support was received for the research, authorship, and/or publication of this article.
This work was supported by the National Institutes of Health [R01HL164460, R15HL150721], Advancing a Healthier Wisconsin Endowment, and MCW Cardiovascular Center, the Michael H. Keelan Research Foundation.
Acknowledgments
We thank Ms. Kathryn Williams and Mr. Douglas Franklin for providing excellent technical support for the mice work. We also thank Brad Best, Dr. Robert Burns, and Dr. Anthony Veltri for assisting with the scRNA-seq library preparation, data alignment, and analysis procedures. We thank the VBRI flow cytometry core led by Ms. Benedetta Bonacci and Savannah Neu, and the VBRI imaging core led by Marie Shulte, who have provided numerous technical support.
Conflict of interest
The authors declare that the research was conducted in the absence of any commercial or financial relationships that could be construed as a potential conflict of interest.
The author(s) declared that they were an editorial board member of Frontiers, at the time of submission. This had no impact on the peer review process and the final decision.
Publisher's note
All claims expressed in this article are solely those of the authors and do not necessarily represent those of their affiliated organizations, or those of the publisher, the editors and the reviewers. Any product that may be evaluated in this article, or claim that may be made by its manufacturer, is not guaranteed or endorsed by the publisher.
Supplementary material
The Supplementary Material for this article can be found online at: https://www.frontiersin.org/articles/10.3389/fcvm.2024.1436865/full#supplementary-material
Abbreviations
ATM, adipose tissue-associated macrophages; GSEA, Gene Set Enrichment Analysis; HFD, high-fat diet; KEGG, Kyoto Encyclopedia of Genes and Genomes database; LAM, lipid-associated macrophages; SCENIC, Single-Cell Regulatory Network Inference and Clustering; UMAP, uniform manifold approximation and projection; VAM, vascular-associated macrophages; WAT, visceral white adipose tissue.
References
1. Barquera S, Pedroza-Tobias A, Medina C, Hernandez-Barrera L, Bibbins-Domingo K, Lozano R, et al. Global overview of the epidemiology of atherosclerotic cardiovascular disease. Arch Med Res. (2015) 46:328–38. doi: 10.1016/j.arcmed.2015.06.006
2. Lear SA, Humphries KH, Kohli S, Frohlich JJ, Birmingham CL, Mancini GB. Visceral adipose tissue, a potential risk factor for carotid atherosclerosis: results of the multicultural community health assessment trial (M-CHAT). Stroke. (2007) 38:2422–9. doi: 10.1161/STROKEAHA.107.484113
3. Sharma AM. Adipose tissue: a mediator of cardiovascular risk. Int J Obes Relat Metab Disord. (2002) 26(Suppl 4):S5–7. doi: 10.1038/sj.ijo.0802210
4. Fantuzzi G, Mazzone T. Adipose tissue and atherosclerosis: exploring the connection. Arterioscler Thromb Vasc Biol. (2007) 27:996–1003. doi: 10.1161/ATVBAHA.106.131755
5. Lu J, Zhao J, Meng H, Zhang X. Adipose tissue-resident immune cells in obesity and type 2 diabetes. Front Immunol. (2019) 10:1173. doi: 10.3389/fimmu.2019.01173
6. Ferrante AW Jr. The immune cells in adipose tissue diabetes. Obes Metab. (2013) 15(Suppl 3):34–8. doi: 10.1111/dom.12154
7. Lumeng CN, Bodzin JL, Saltiel AR. Obesity induces a phenotypic switch in adipose tissue macrophage polarization. J Clin Invest. (2007) 117:175–84. doi: 10.1172/JCI29881
8. Weisberg SP, McCann D, Desai M, Rosenbaum M, Leibel RL, Ferrante AW Jr. Obesity is associated with macrophage accumulation in adipose tissue. J Clin Invest. (2003) 112:1796–808. doi: 10.1172/JCI19246
9. Cassidy AE, Bielak LF, Zhou Y, Sheedy PF 2nd, Turner ST, Breen JF, et al. Progression of subclinical coronary atherosclerosis: does obesity make a difference? Circulation. (2005) 111:1877–82. doi: 10.1161/01.CIR.0000161820.40494.5D
10. Klein S, Burke LE, Bray GA, Blair S, Allison DB, Pi-Sunyer X, et al. Clinical implications of obesity with specific focus on cardiovascular disease: a statement for professionals from the American Heart Association council on nutrition, physical activity, and metabolism: endorsed by the American College of Cardiology foundation. Circulation. (2004) 110:2952–67. doi: 10.1161/01.CIR.0000145546.97738.1E
11. Jaitin DA, Adlung L, Thaiss CA, Weiner A, Li B, Descamps H, et al. Lipid-Associated macrophages control metabolic homeostasis in a Trem2-dependent manner. Cell. (2019) 178:686–698.e14. doi: 10.1016/j.cell.2019.05.054
12. Berg AH, Scherer PE. Adipose tissue, inflammation, and cardiovascular disease. Circ Res. (2005) 96:939–49. doi: 10.1161/01.RES.0000163635.62927.34
13. Silverstein RL, Febbraio M. CD36, a scavenger receptor involved in immunity, metabolism, angiogenesis, and behavior. Sci Signal. (2009) 2:re3. doi: 10.1126/scisignal.272re3
14. Chen Y, Zhang J, Cui W, Silverstein RL. CD36, a signaling receptor and fatty acid transporter that regulates immune cell metabolism and fate. J Exp Med. (2022) 219:e20211314. doi: 10.1084/jem.20211314
15. Rahaman SO, Lennon DJ, Febbraio M, Podrez EA, Hazen SL, Silverstein RL. A CD36-dependent signaling cascade is necessary for macrophage foam cell formation. Cell Metab. (2006) 4:211–21. doi: 10.1016/j.cmet.2006.06.007
16. Chen Y, Kennedy DJ, Ramakrishnan DP, Yang M, Huang W, Li Z, et al. Oxidized LDL-bound CD36 recruits an na(+)/K(+)-ATPase-lyn complex in macrophages that promotes atherosclerosis. Sci Signal. (2015) 8:ra91. doi: 10.1126/scisignal.aaa9623
17. Febbraio M, Podrez EA, Smith JD, Hajjar DP, Hazen SL, Hoff HF, et al. Targeted disruption of the class B scavenger receptor CD36 protects against atherosclerotic lesion development in mice. J Clin Invest. (2000) 105:1049–56. doi: 10.1172/JCI9259
18. Chen Y, Yang M, Huang W, Chen W, Zhao Y, Schulte ML, et al. Mitochondrial metabolic reprogramming by CD36 signaling drives macrophage inflammatory responses. Circ Res. (2019) 125:1087–102. doi: 10.1161/CIRCRESAHA.119.315833
19. Kennedy DJ, Kuchibhotla S, Westfall KM, Silverstein RL, Morton RE, Febbraio M. A CD36-dependent pathway enhances macrophage and adipose tissue inflammation and impairs insulin signalling. Cardiovasc Res. (2011) 89:604–13. doi: 10.1093/cvr/cvq360
20. Plump AS, Smith JD, Hayek T, Aalto-Setala K, Walsh A, Verstuyft JG, et al. Severe hypercholesterolemia and atherosclerosis in apolipoprotein E-deficient mice created by homologous recombination in ES cells. Cell. (1992) 71:343–53. doi: 10.1016/0092-8674(92)90362-g
21. Yu G, Wang LG, Han Y, He QY. Clusterprofiler: an R package for comparing biological themes among gene clusters. OMICS. (2012) 16:284–7. doi: 10.1089/omi.2011.0118
22. Aibar S, Gonzalez-Blas CB, Moerman T, Huynh-Thu VA, Imrichova H, Hulselmans G, et al. SCENIC: single-cell regulatory network inference and clustering. Nat Methods. (2017) 14:1083–6. doi: 10.1038/nmeth.4463
23. Ohman MK, Shen Y, Obimba CI, Wright AP, Warnock M, Lawrence DA, et al. Visceral adipose tissue inflammation accelerates atherosclerosis in apolipoprotein E-deficient mice. Circulation. (2008) 117:798–805. doi: 10.1161/CIRCULATIONAHA.107.717595
24. Aran D, Looney AP, Liu L, Wu E, Fong V, Hsu A, et al. Reference-based analysis of lung single-cell sequencing reveals a transitional profibrotic macrophage. Nat Immunol. (2019) 20:163–72. doi: 10.1038/s41590-018-0276-y
25. Heng TS, Painter MW, Immunological Genome Project, C. The immunological genome project: networks of gene expression in immune cells. Nat Immunol. (2008) 9:1091-4. 1091-1094doi: 10.1038/ni1008-1091
26. Catrysse L, van Loo G. Adipose tissue macrophages and their polarization in health and obesity. Cell Immunol. (2018) 330:114–9. doi: 10.1016/j.cellimm.2018.03.001
27. Buechler MB, Kim KW, Onufer EJ, Williams JW, Little CC, Dominguez CX, et al. A stromal niche defined by expression of the transcription factor WT1 mediates programming and homeostasis of cavity-resident macrophages. Immunity. (2019) 51:119–130.e5. doi: 10.1016/j.immuni.2019.05.010
28. Okabe Y, Medzhitov R. Tissue-specific signals control reversible program of localization and functional polarization of macrophages. Cell. (2014) 157:832–44. doi: 10.1016/j.cell.2014.04.016
29. Ding SY, Lee MJ, Summer R, Liu L, Fried SK, Pilch PF. Pleiotropic effects of cavin-1 deficiency on lipid metabolism. J Biol Chem. (2014) 289:8473–83. doi: 10.1074/jbc.M113.546242
30. Gargalovic P, Dory L. Caveolins and macrophage lipid metabolism. J Lipid Res. (2003) 44:11–21. doi: 10.1194/jlr.r200005-jlr200
31. Nangia-Makker P, Nakahara S, Hogan V, Raz A. Galectin-3 in apoptosis, a novel therapeutic target. J Bioenerg Biomembr. (2007) 39:79–84. doi: 10.1007/s10863-006-9063-9
32. Chen X, Yu C, Kang R, Tang D. Iron metabolism in ferroptosis. Front Cell Dev Biol. (2020) 8:590226. doi: 10.3389/fcell.2020.590226
33. Cochain C, Vafadarnejad E, Arampatzi P, Pelisek J, Winkels H, Ley K, et al. Single-cell RNA-Seq reveals the transcriptional landscape and heterogeneity of aortic macrophages in murine atherosclerosis. Circ Res. (2018) 122:1661–74. doi: 10.1161/CIRCRESAHA.117.312509
34. Silva HM, Bafica A, Rodrigues-Luiz GF, Chi J, Santos PDA, Reis BS, et al. Vasculature-associated fat macrophages readily adapt to inflammatory and metabolic challenges. J Exp Med. (2019) 216:786–806. doi: 10.1084/jem.20181049
35. Zernecke A, Winkels H, Cochain C, Williams JW, Wolf D, Soehnlein O, et al. Meta-analysis of leukocyte diversity in atherosclerotic mouse aortas. Circ Res. (2020) 127:402–26. doi: 10.1161/CIRCRESAHA.120.316903
36. Trim WV, Lynch L. Immune and non-immune functions of adipose tissue leukocytes. Nat Rev Immunol. (2022) 22:371–86. doi: 10.1038/s41577-021-00635-7
37. Hou J, Zhang J, Cui P, Zhou Y, Liu C, Wu X, et al. TREM2 sustains macrophage-hepatocyte metabolic coordination in nonalcoholic fatty liver disease and sepsis. J Clin Invest. (2021) 131:e135197. doi: 10.1172/JCI135197
38. Gerdes J, Schwab U, Lemke H, Stein H. Production of a mouse monoclonal antibody reactive with a human nuclear antigen associated with cell proliferation. Int J Cancer. (1983) 31:13–20. doi: 10.1002/ijc.2910310104
39. Rubin CI, Atweh GF. The role of stathmin in the regulation of the cell cycle. J Cell Biochem. (2004) 93:242–50. doi: 10.1002/jcb.20187
40. Nielsen CF, Zhang T, Barisic M, Kalitsis P, Hudson DF. Topoisomerase IIalpha is essential for maintenance of mitotic chromosome structure. Proc Natl Acad Sci U S A. (2020) 117:12131–42. doi: 10.1073/pnas.2001760117
41. Lei M. The MCM complex: its role in DNA replication and implications for cancer therapy. Curr Cancer Drug Targets. (2005) 5:365–80. doi: 10.2174/1568009054629654
42. Alexopoulos N, Katritsis D, Raggi P. Visceral adipose tissue as a source of inflammation and promoter of atherosclerosis. Atherosclerosis. (2014) 233:104–12. doi: 10.1016/j.atherosclerosis.2013.12.023
43. Bastard JP, Maachi M, Van Nhieu JT, Jardel C, Bruckert E, Grimaldi A, et al. Adipose tissue IL-6 content correlates with resistance to insulin activation of glucose uptake both in vivo and in vitro. J Clin Endocrinol Metab. (2002) 87:2084–9. doi: 10.1210/jcem.87.5.8450
44. Kim K, Shim D, Lee JS, Zaitsev K, Williams JW, Kim KW, et al. Transcriptome analysis reveals nonfoamy rather than foamy plaque macrophages are proinflammatory in atherosclerotic murine models. Circ Res. (2018) 123:1127–42. doi: 10.1161/CIRCRESAHA.118.312804
45. Cuevas VD, Anta L, Samaniego R, Orta-Zavalza E, Vladimir de la Rosa J, Baujat G, et al. MAFB Determines human macrophage anti-inflammatory polarization: relevance for the pathogenic mechanisms operating in multicentric carpotarsal osteolysis. J Immunol. (2017) 198:2070–81. doi: 10.4049/jimmunol.1601667
46. Kang K, Park SH, Chen J, Qiao Y, Giannopoulou E, Berg K, et al. Interferon-gamma represses M2 gene expression in human macrophages by disassembling enhancers bound by the transcription factor MAF. Immunity. (2017) 47:235–250.e4. doi: 10.1016/j.immuni.2017.07.017
47. Adamson SE, Griffiths R, Moravec R, Senthivinayagam S, Montgomery G, Chen W, et al. Disabled homolog 2 controls macrophage phenotypic polarization and adipose tissue inflammation. J Clin Invest. (2016) 126:1311–22. doi: 10.1172/JCI79590
48. Zhao X, Di Q, Liu H, Quan J, Ling J, Zhao Z, et al. MEF2C Promotes M1 macrophage polarization and Th1 responses. Cell Mol Immunol. (2022) 19:540–53. doi: 10.1038/s41423-022-00841-w
49. Kawaida R, Ohtsuka T, Okutsu J, Takahashi T, Kadono Y, Oda H, et al. Jun dimerization protein 2 (JDP2), a member of the AP-1 family of transcription factor, mediates osteoclast differentiation induced by RANKL. J Exp Med. (2003) 197:1029–35. doi: 10.1084/jem.20021321
50. Taefehshokr S, Key YA, Khakpour M, Dadebighlu P, Oveisi A. Early growth response 2 and Egr3 are unique regulators in immune system. Cent Eur J Immunol. (2017) 42:205–9. doi: 10.5114/ceji.2017.69363
51. Tavor S, Vuong PT, Park DJ, Gombart AF, Cohen AH, Koeffler HP. Macrophage functional maturation and cytokine production are impaired in C/EBP epsilon-deficient mice. Blood. (2002) 99:1794–801. doi: 10.1182/blood.v99.5.1794
52. Okamoto R, Gery S, Gombart AF, Wang X, Castellani LW, Akagi T, et al. Deficiency of CCAAT/enhancer binding protein-epsilon reduces atherosclerotic lesions in LDLR-/- mice. PLoS One. (2014) 9:e85341. doi: 10.1371/journal.pone.0085341
53. Kobayashi T, Matsuoka K, Sheikh SZ, Elloumi HZ, Kamada N, Hisamatsu T, et al. NFIL3 Is a regulator of IL-12 p40 in macrophages and mucosal immunity. J Immunol. (2011) 186:4649–55. doi: 10.4049/jimmunol.1003888
54. Chiba T, Skrypnyk NI, Skvarca LB, Penchev R, Zhang KX, Rochon ER, et al. Retinoic acid signaling coordinates macrophage-dependent injury and repair after AKI. J Am Soc Nephrol. (2016) 27:495–508. doi: 10.1681/ASN.2014111108
55. Mougiakakos D, Bach C, Bottcher M, Beier F, Rohner L, Stoll A, et al. The IKZF1-IRF4/IRF5 axis controls polarization of myeloma-associated macrophages. Cancer Immunol Res. (2021) 9:265–78. doi: 10.1158/2326-6066.CIR-20-0555
56. Cui H, Banerjee S, Guo S, Xie N, Liu G. IFN regulatory factor 2 inhibits expression of glycolytic genes and lipopolysaccharide-induced proinflammatory responses in macrophages. J Immunol. (2018) 200:3218–30. doi: 10.4049/jimmunol.1701571
57. Attwooll C, Lazzerini Denchi E, Helin K. The E2F family: specific functions and overlapping interests. EMBO J. (2004) 23:4709–16. doi: 10.1038/sj.emboj.7600481
58. Savage KI, Harkin DP. BRCA1, A ‘complex’ protein involved in the maintenance of genomic stability. FEBS J. (2015) 282:630–46. doi: 10.1111/febs.13150
59. Zheng C, Wu H, Jin S, Li D, Tan S, Zhu X. Roles of myc-associated zinc finger protein in malignant tumors. Asia Pac J Clin Oncol. (2022) 18:506–14. doi: 10.1111/ajco.13748
60. Tan JZ, Yan Y, Wang XX, Jiang Y, Xu HE. EZH2: biology, disease, and structure-based drug discovery. Acta Pharmacol Sin. (2014) 35:161–74. doi: 10.1038/aps.2013.161
61. Kiyama T, Chen CK, Wang SW, Pan P, Ju Z, Wang J, et al. Essential roles of mitochondrial biogenesis regulator Nrf1 in retinal development and homeostasis. Mol Neurodegener. (2018) 13:56. doi: 10.1186/s13024-018-0287-z
62. Yan K, Da TT, Bian ZH, He Y, Liu MC, Liu QZ, et al. Multi-omics analysis identifies FoxO1 as a regulator of macrophage function through metabolic reprogramming. Cell Death Dis. (2020) 11:800. doi: 10.1038/s41419-020-02982-0
63. Boyle JJ, Johns M, Kampfer T, Nguyen AT, Game L, Schaer DJ, et al. Activating transcription factor 1 directs mhem atheroprotective macrophages through coordinated iron handling and foam cell protection. Circ Res. (2012) 110:20–33. doi: 10.1161/CIRCRESAHA.111.247577
64. Repa JJ, Turley SD, Lobaccaro JA, Medina J, Li L, Lustig K, et al. Regulation of absorption and ABC1-mediated efflux of cholesterol by RXR heterodimers. Science. (2000) 289:1524–9. doi: 10.1126/science.289.5484.1524
65. Schulman IG. Liver X receptors link lipid metabolism and inflammation. FEBS Lett. (2017) 591:2978–91. doi: 10.1002/1873-3468.12702
66. Tontonoz P, Nagy L, Alvarez JG, Thomazy VA, Evans RM. PPARgamma promotes monocyte/macrophage differentiation and uptake of oxidized LDL. Cell. (1998) 93:241–52. doi: 10.1016/s0092-8674(00)81575-5
67. Chawla A. Control of macrophage activation and function by PPARs. Circ Res. (2010) 106:1559–69. doi: 10.1161/CIRCRESAHA.110.216523
68. Zhou JP, Ren YD, Xu QY, Song Y, Zhou F, Chen MY, et al. Obesity-induced upregulation of ZBTB7A promotes lipid accumulation through SREBP1. Biomed Res Int. (2020) 2020:4087928. doi: 10.1155/2020/4087928
69. Kim HM, Han JW, Chan JY. Nuclear factor erythroid-2 like 1 (NFE2L1): structure, function and regulation. Gene. (2016) 584:17–25. doi: 10.1016/j.gene.2016.03.002
70. Kwong M, Kan YW, Chan JY. The CNC basic leucine zipper factor, Nrf1, is essential for cell survival in response to oxidative stress-inducing agents. Role for Nrf1 in gamma-gcs(l) and gss expression in mouse fibroblasts. J Biol Chem. (1999) 274:37491–8. doi: 10.1074/jbc.274.52.37491
71. Chan JY, Kwong M, Lu R, Chang J, Wang B, Yen TS, et al. Targeted disruption of the ubiquitous CNC-bZIP transcription factor, nrf-1, results in anemia and embryonic lethality in mice. EMBO J. (1998) 17:1779–87. doi: 10.1093/emboj/17.6.1779
72. Ohtsuji M, Katsuoka F, Kobayashi A, Aburatani H, Hayes JD, Yamamoto M. Nrf1 and Nrf2 play distinct roles in activation of antioxidant response element-dependent genes. J Biol Chem. (2008) 283:33554–62. doi: 10.1074/jbc.M804597200
73. Song MO, Mattie MD, Lee CH, Freedman JH. The role of Nrf1 and Nrf2 in the regulation of copper-responsive transcription. Exp Cell Res. (2014) 322:39–50. doi: 10.1016/j.yexcr.2014.01.013
74. Bellelli R, Belan O, Pye VE, Clement C, Maslen SL, Skehel JM, et al. POLE3-POLE4 Is a histone H3-H4 chaperone that maintains chromatin integrity during DNA replication. Mol Cell. (2018) 72:112–126.e5. doi: 10.1016/j.molcel.2018.08.043
75. Bellelli R, Borel V, Logan C, Svendsen J, Cox DE, Nye E, et al. Polepsilon instability drives replication stress, abnormal development, and tumorigenesis. Mol Cell. (2018) 70:707–721.e7. doi: 10.1016/j.molcel.2018.04.008
76. Cooke MS, Evans MD, Dizdaroglu M, Lunec J. Oxidative DNA damage: mechanisms, mutation, and disease. FASEB J. (2003) 17:1195–214. doi: 10.1096/fj.02-0752rev
77. Rauschmeier R, Gustafsson C, Reinhardt A, A N, Tortola G, Cansever L, et al. Bhlhe40 and Bhlhe41 transcription factors regulate alveolar macrophage self-renewal and identity. EMBO J. (2019) 38:e101233. doi: 10.15252/embj.2018101233
78. Friand V, David G, Zimmermann P. Syntenin and syndecan in the biogenesis of exosomes. Biol Cell. (2015) 107:331–41. doi: 10.1111/boc.201500010
79. Flaherty SE 3rd, Grijalva A, Xu X, Ables E, Nomani A, Ferrante AW Jr. A lipase-independent pathway of lipid release and immune modulation by adipocytes. Science. (2019) 363:989–93. doi: 10.1126/science.aaw2586
80. Kosteli A, Sugaru E, Haemmerle G, Martin JF, Lei J, Zechner R, et al. Weight loss and lipolysis promote a dynamic immune response in murine adipose tissue. J Clin Invest. (2010) 120:3466–79. doi: 10.1172/JCI42845
81. Prieur X, Mok CY, Velagapudi VR, Nunez V, Fuentes L, Montaner D, et al. Differential lipid partitioning between adipocytes and tissue macrophages modulates macrophage lipotoxicity and M2/M1 polarization in obese mice. Diabetes. (2011) 60:797–809. doi: 10.2337/db10-0705
82. Li RY, Qin Q, Yang HC, Wang YY, Mi YX, Yin YS, et al. TREM2 in the pathogenesis of AD: a lipid metabolism regulator and potential metabolic therapeutic target. Mol Neurodegener. (2022) 17:40. doi: 10.1186/s13024-022-00542-y
83. Abdul-Ghani M, DeFronzo RA. Insulin resistance and hyperinsulinemia: the egg and the chicken. J Clin Endocrinol Metab. (2021) 106:e1897–9. doi: 10.1210/clinem/dgaa364
84. Lin A, Dey D, Wong DTL, Nerlekar N. Perivascular adipose tissue and coronary atherosclerosis: from biology to imaging phenotyping. Curr Atheroscler Rep. (2019) 21:47. doi: 10.1007/s11883-019-0817-3
85. Laforest S, Labrecque J, Michaud A, Cianflone K, Tchernof A. Adipocyte size as a determinant of metabolic disease and adipose tissue dysfunction. Crit Rev Clin Lab Sci. (2015) 52:301–13. doi: 10.3109/10408363.2015.1041582
86. Colas R, Sassolas A, Guichardant M, Cugnet-Anceau C, Moret M, Moulin P, et al. LDL from obese patients with the metabolic syndrome show increased lipid peroxidation and activate platelets. Diabetologia. (2011) 54:2931–40. doi: 10.1007/s00125-011-2272-8
Keywords: lipid, inflammation, visceral adipose tissue, macrophage, scRNA-Seq, atherosclerosis
Citation: Chen V, Zhang J, Chang J, Beg MA, Vick L, Wang D, Gupta A, Wang Y, Zhang Z, Dai W, Kim M, Song S, Pereira D, Zheng Z, Sodhi K, Shapiro JI, Silverstein RL, Malarkannan S and Chen Y (2024) CD36 restricts lipid-associated macrophages accumulation in white adipose tissues during atherogenesis. Front. Cardiovasc. Med. 11:1436865. doi: 10.3389/fcvm.2024.1436865
Received: 22 May 2024; Accepted: 1 July 2024;
Published: 2 August 2024.
Edited by:
Jaume Amengual, University of Illinois at Urbana-Champaign, United StatesReviewed by:
Johana Coronel, Columbia University, United StatesShruti Rawal, Harvard Medical School, United States
© 2024 Chen, Zhang, Chang, Beg, Vick, Wang, Gupta, Wang, Zhang, Dai, Kim, Song, Pereira, Zheng, Sodhi, Shapiro, Silverstein, Malarkannan and Chen. This is an open-access article distributed under the terms of the Creative Commons Attribution License (CC BY). The use, distribution or reproduction in other forums is permitted, provided the original author(s) and the copyright owner(s) are credited and that the original publication in this journal is cited, in accordance with accepted academic practice. No use, distribution or reproduction is permitted which does not comply with these terms.
*Correspondence: Yiliang Chen, eWlsY2hlbkBtY3cuZWR1
†These authors have contributed equally to this work