
95% of researchers rate our articles as excellent or good
Learn more about the work of our research integrity team to safeguard the quality of each article we publish.
Find out more
ORIGINAL RESEARCH article
Front. Cardiovasc. Med. , 08 February 2024
Sec. Hypertension
Volume 11 - 2024 | https://doi.org/10.3389/fcvm.2024.1284114
 Sarah Al Ashmar1
 Najeha Rizwana Anwardeen2
 Gulsen Guliz Anlar1
 Shona Pedersen1
 Mohamed A. Elrayess1,2
 Asad Zeidan1*
Introduction: Pre-hypertension is a prevalent condition among the adult population worldwide. It is characterized by asymptomatic elevations in blood pressure beyond normal levels but not yet reaching the threshold for hypertension. If left uncontrolled, pre-hypertension can progress to hypertension, thereby increasing the risk of serious complications such as heart disease, stroke, kidney damage, and others.
Objective: The precise mechanisms driving the progression of hypertension remain unknown. Thus, identifying the metabolic changes associated with this condition can provide valuable insights into potential markers or pathways implicated in the development of hypertension.
Methods: In this study, we utilized untargeted metabolomics profiling, which examines over 1,000 metabolites to identify novel metabolites contributing to the progression from pre-hypertension to hypertension. Data were collected from 323 participants through Qatar Biobank.
Results: By comparing metabolic profiles between pre-hypertensive, hypertensive and normotensive individuals, six metabolites including stearidonate, hexadecadienoate, N6-carbamoylthreonyladenosine, 9 and 13-S-hydroxyoctadecadienoic acid (HODE), 2,3-dihydroxy-5-methylthio- 4-pentenoate (DMTPA), and linolenate were found to be associated with increased risk of hypertension, in both discovery and validation cohorts. Moreover, these metabolites showed a significant diagnostic performance with area under curve >0.7.
Conclusion: These findings suggest possible biomarkers that can predict the risk of progression from pre-hypertension to hypertension. This will aid in early detection, diagnosis, and management of this disease as well as its associated complications.
Hypertension, a significant global health burden and a leading cause of premature death worldwide, affects approximately 1 billion people worldwide (1, 2). It is a critical risk factor for coronary heart disease and stroke, particularly in Gulf Cooperation Council (GCC) (3). In Qatar, hypertension prevalence is around 33% (4).
Pre-hypertension, an intermediate stage between normal and high blood pressure (5), affects 25 to 50% of adults globally (6). Recognized as a hypertension precursor (6), pre-hypertension can convert to hypertension at a rate of 30% over a four-year period (7) and contribute to cardiovascular disease progression (8). Cardiovascular risk factors, including genetics, smoking, obesity, and physical activity are linked to pre-hypertension (9, 10). Early detection of pre-hypertension can prevent hypertension and cardiovascular disease risk (11). Non-pharmacological interventions for the management of pre-hypertension include dietary, exercise, smoking cessation, reducing salt intake and alcohol consumption, weight, and stress reduction (6, 11, 12). If these measures fail, medication may be required (12). Hypertension management involves both non-pharmacological and pharmacological interventions including, antihypertensive drugs such as diuretics, angiotensin-converting enzyme inhibitors, angiotensin receptor blockers, beta-blockers, and calcium channel blockers (12, 13). However, despite the recent advances in the awareness, treatment, and management of hypertension, only 42% of hypertensive adults are diagnosed and treated, and only 21% have it under control (1).
Blood pressure changes are typically used to diagnose hypertension (14). However, many pathological changes precede blood pressure elevation (15). Therefore, identifying new biomarkers and understanding underlying mechanisms involved in hypertension progression is crucial. Metabolomics, a rapidly expanding field, involves the comprehensive analysis of all low-molecular-weight metabolites within biological samples at a given time (16). Metabolites play crucial roles in biological processes such as energy production, signaling, and cellular pathway regulation (16). Changes in these metabolites are being studied as potential biomarkers for cardiovascular disease and other pathological conditions (17). Metabolomics profiling can provide information about the metabolic changes in pathological conditions, potentially offering new insights into disease pathogenesis and therapeutic options (18). Clinically, metabolomics can aid in early disease detection and diagnosis (19). It also plays a significant role in precision medicine (20). By identifying unique metabolic signatures in individuals, it allows for personalized treatment strategies and guides for the selection of more effective treatments (20). Additionally, metabolomics helps in the discovery of biomarkers for various diseases, facilitating not only diagnosis but also monitoring disease progression and response to therapy (21). Recent advancements in metabolomics have significantly enhanced our understanding of hypertension (18). Metabolite profiling in hypertension has gained growing attention after the discovery of a correlation between serum metabolites and blood pressure in hypertensive individuals (17). Subsequently, numerous studies have focused on studying the metabolic signature of hypertension and identifying novel metabolites associated with this disease.
In this study, we aimed to characterize the metabolomic profile in pre-hypertensive and hypertensive patients and healthy individuals using untargeted metabolomics. We also examined the metabolites and the related metabolic pathways that can distinguish pre-hypertension from hypertension pathophysiology.
A total of 323 participants were enrolled in this study categorized based on their blood pressure. In the discovery cohort, 46 healthy controls, 98 patients with pre-hypertension, and 35 patients with hypertension were included, while the validation cohort included 72 healthy and 72 pre-hypertensive participants. Clinical and metabolomics data were provided by Qatar Biobank (QBB) which is a population-based cohort study launched in 2012 and aiming to recruit 60,000 local participants. 26,279 participants have been enrolled as of 2020. QBB collects personal data and biological samples for each participant every five years (22).
The inclusion criteria encompassed, both Qatari males and females, age between 46 and 68 years old for the discovery cohort, and between 20 and 34 for the validation cohort. The study groups comprised hypertensive participants (blood pressure ≥ 140 mmHg), pre-hypertensive (Blood pressure 120–139 mmHg), and a control group of normotensive participants (blood pressure < 120 mmHg). Patients with diabetes or obesity were excluded. An informed consent was obtained from each participant prior to the involvement in the study. The study received an approval from the QBB institutional review board (E -2021-QF-QBB-RES-ACC-00021-0160).
Approximately 60 ml of blood was collected from each participant following an overnight fasting. Biochemical and hematological assessment of the blood samples was conducted at Hamad Medical Center in Doha. Blood samples containing EDTA were centrifuged to separate various components, including plasma, buffy coat, and erythrocytes. Aliquots were prepared for each sample and stored either in liquid nitrogen for long-term storage or at −80°C for subsequent analysis (22).
For each participant, anthropometric measurements such as the height, weight, waist, and hip were obtained using Seca stadiometer and Seca Bio Impedance Analysis (Seca GmbH & Co. KG, Hamburg, Germany). Body Mass Index was calculated as weight in kg divided by height in meters squared. Blood pressure was assessed utilizing the Omron 705 automated instrument. An average of two to three blood pressure measurements, taken when the initial two measurements differ by 5 mmHg, was considered. Clinical parameters, including complete blood count, lipid profile, HBA1C%, liver function tests and C-reactive protein were analyzed as previously described (22, 23).
Untargeted metabolomics was employed using Metabolon's platform at Anti-Doping Lab in Qatar to analyze the samples for each individual, following a previously described methodology (24). In brief, waters ACQUITY ultra-performance liquid chromatography (UPLC), a Thermo Scientific Q-Exactive high resolution/accurate mass spectrometer coupled with a heated electrospray ionization (HESI-II) source, and an Orbitrap mass analyzer with a 35,000-mass resolution were utilized for metabolite detection. Methanol was used for protein precipitation and serum sample extraction. The resulting extracts were partitioned into separate fractions: two for analysis by distinct reverse phases (RP)/UPLC-MS/MS methods using positive ion mode electrospray ionization (ESI), one for analysis by RP/UPLC-MS/MS with negative ion mode ESI, one for analysis by hydrophilic interaction chromatography (HILIC)/UPLC-MS/MS with negative ion mode ESI, and one aliquot reserved as a backup. Peaks identification was conducted using Metabolon's platform, matching them to existing library entries of over 3,300 pure standard chemicals to determine compound identities (25). Subsequently, compounds were classified based on their origins. A total of 1,159 metabolites were identified.
Clinical measurement data were classified into control, pre-hypertension, and hypertension groups according to their blood pressure. Data were presented as mean (SD), median (IQR) and number (percentage) for parametric, non-parametric and nominal variables respectively. Differences between the groups were tested by ANOVA/Kruskal–Wallis for parametric/non-parametric variables and Chi-square test for nominal variables. Post-HOC tests (Pairwise T-test/Dunnett's) were applied accordingly. A p-value significance level of 0.05 was used.
The metabolomics data were log-transformed. Multivariate analysis including unsupervised PCA (principal component analysis) and supervised OPLS-DA (orthogonal partial least square-discriminant analysis) were run using the software SIMCA® (version 16.0.1). Metabolites with >50% missingness and 222 unidentified metabolites were excluded from the models. R version 4.2.1 was used to perform linear models to identify significant metabolites differentiating the study group [control (0)—pre-hypertension (1)—hypertension (2), denoting disease progression]. The model also included the following confounders: age, gender, and BMI. Multiple testing correction method [False Discovery Rate (FDR)] was used to adjust the nominal p-values. FDR < 0.05 was considered statistically significant. ROC analysis for validation of the metabolites was performed using R package pROC. Spearman's correlation between clinical measurements and significant metabolites was carried out using R packages Hmisc and corrplot.
In the discovery cohort, 178 participants were included: 46 control participants (blood pressure <120 mmHg), 98 participants with pre-hypertension (Blood pressure 120–139 mmHg) and 35 participants with hypertension (blood pressure ≥ 140 mmHg). As shown in Table 1, systolic and diastolic blood pressure measurements were significantly different between the three groups. The participants in control group were younger compared to pre-hypertensive and hypertensive groups and they were mostly females, however, no significant difference was observed between pre-hypertensive and hypertensive groups in terms of age and sex. Haemoglobin levels and red blood cells count were observed to be significantly lower in the control group compared to both the pre-hypertensive and hypertensive groups. This difference is mainly attributed to the predominance of females in the control group, as females typically exhibit lower haemoglobin and red blood cell levels. ALP, HDL cholesterol and triglyceride level also showed a significant difference between the control and disease groups; however, their values fell within normal levels. Chi square analysis further indicated no significant difference between pre-hypertensive and hypertensive participants taking blood pressuring lowering medications (Supplementary Table S1).
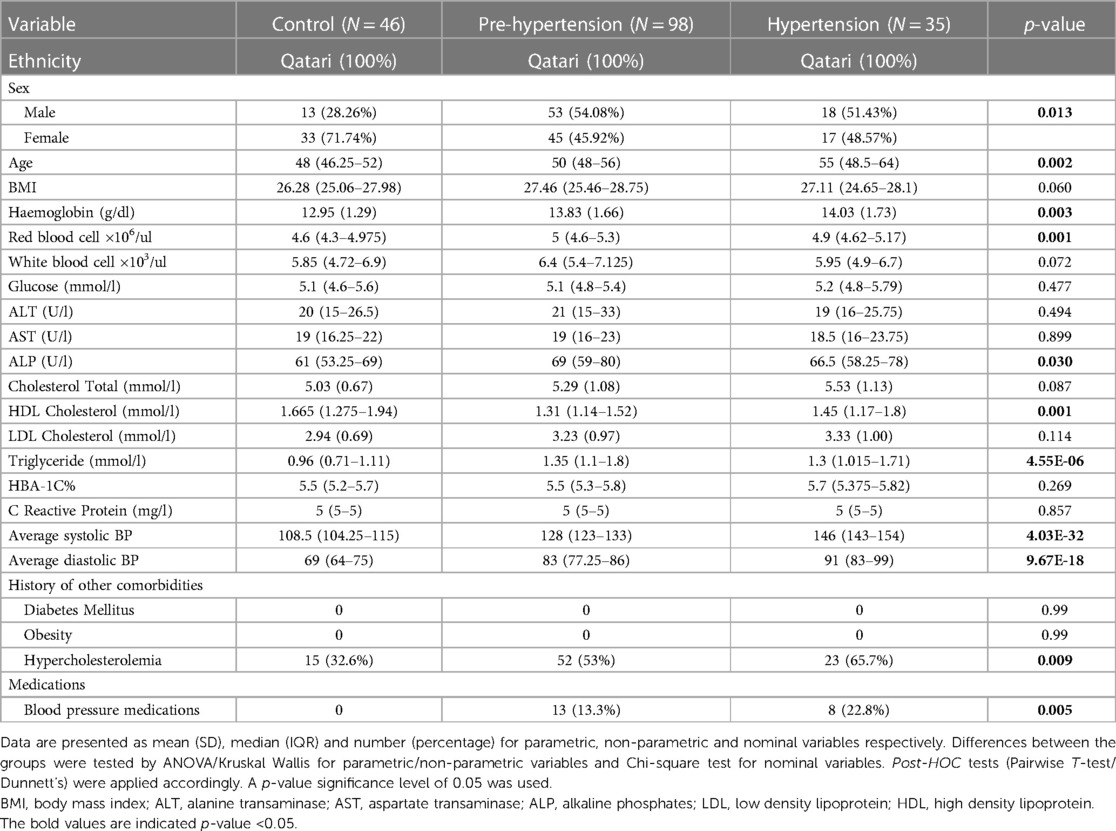
Table 1. Clinical measurements of the discovery cohort categorized by blood pressure.
The orthogonal partial least square discriminant analysis (OPLS-DA) was employed to evaluate the metabolites in our study. This analysis showed a clear separation between healthy, pre-hypertensive and hypertensive participants based on their metabolomic signature. The cumulative model predictability, R2Y (cum), was found to be 79.7%, while the cumulative model validation, Q2 (cum), was 22.3% indicating a strong ability to explain the observed patterns and an acceptable predictive accuracy. A scatter plot (Figure 1A) illustrates a two-dimensional space representation of the three study groups based on their metabolomic profiles. In addition to the scatter plot, we have provided supplementary data containing a list of the most influential metabolites for discriminating between the groups based on the variable influence on projection (VIP) scores (Supplementary Figure S1 and Table S2). Loading plot revealing the metabolites closely associated with the progression of hypertension is also presented in Figure 1B. Furthermore, to explore whether the metabolic profile vary between male and female participants, multivariate analysis was conducted for each gender separately. The OPLSDA for male participants demonstrated a distinct metabolic pattern for controls, prehypertensive, and hypertensive groups, achieving a high R2Y of 99% and a substantial predictive ability with Q2 of 48% (Supplementary Figure S2). Similarly, a clear group separation based on the metabolic profile was observed among female participants with 86% for R2Y and 22.6% for Q2 (Supplementary Figure S3). These results confirm that the observed group separation is primarily attributed to the disease condition rather than inherent sex differences.
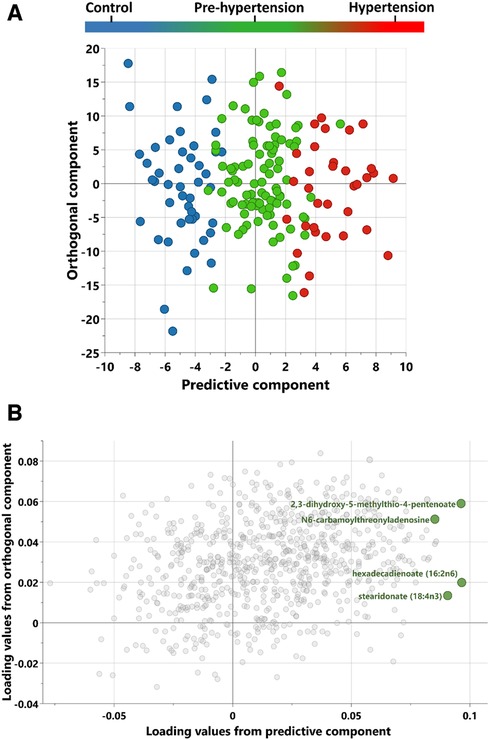
Figure 1. Scores and loadings plot from OPLS-DA (orthogonal projections to latent structures discriminant analysis) of control, pre-hypertension and hypertension discovery groups. (A) A score plot from OPLS-DA showing the predictive component (x-axis) vs. orthogonal component (y-axis). (B) Loadings plot revealing the discriminant metabolites associated with progression to hypertension.
To identify the metabolites associated with increased risk of hypertension, a univariate analysis was conducted. Figure 2 displays the metabolites that were significantly correlated with an elevated risk of hypertension. These metabolites consist of four lipids {stearidonate [18:4n3], hexadecadienoate [16:2n6], 13-HODE + 9-HODE, and linolenate [alpha or gamma; (18:3n3 or 6)]}, one nucleotide (N6-carbamoylthreonyladenosine), and one amino acid metabolite (2,3-dihydroxy-5-methylthio-4-pentenoate (DMTPA) (Table 2). Moreover, these metabolites, associated with a higher risk of hypertension, exhibited nominal significance in the univariant analysis of males and females separately (Supplementary Tables S3, S4). These finding confirm the robustness and consistency of the association of the identified metabolites with hypertension risk across different sex groups.
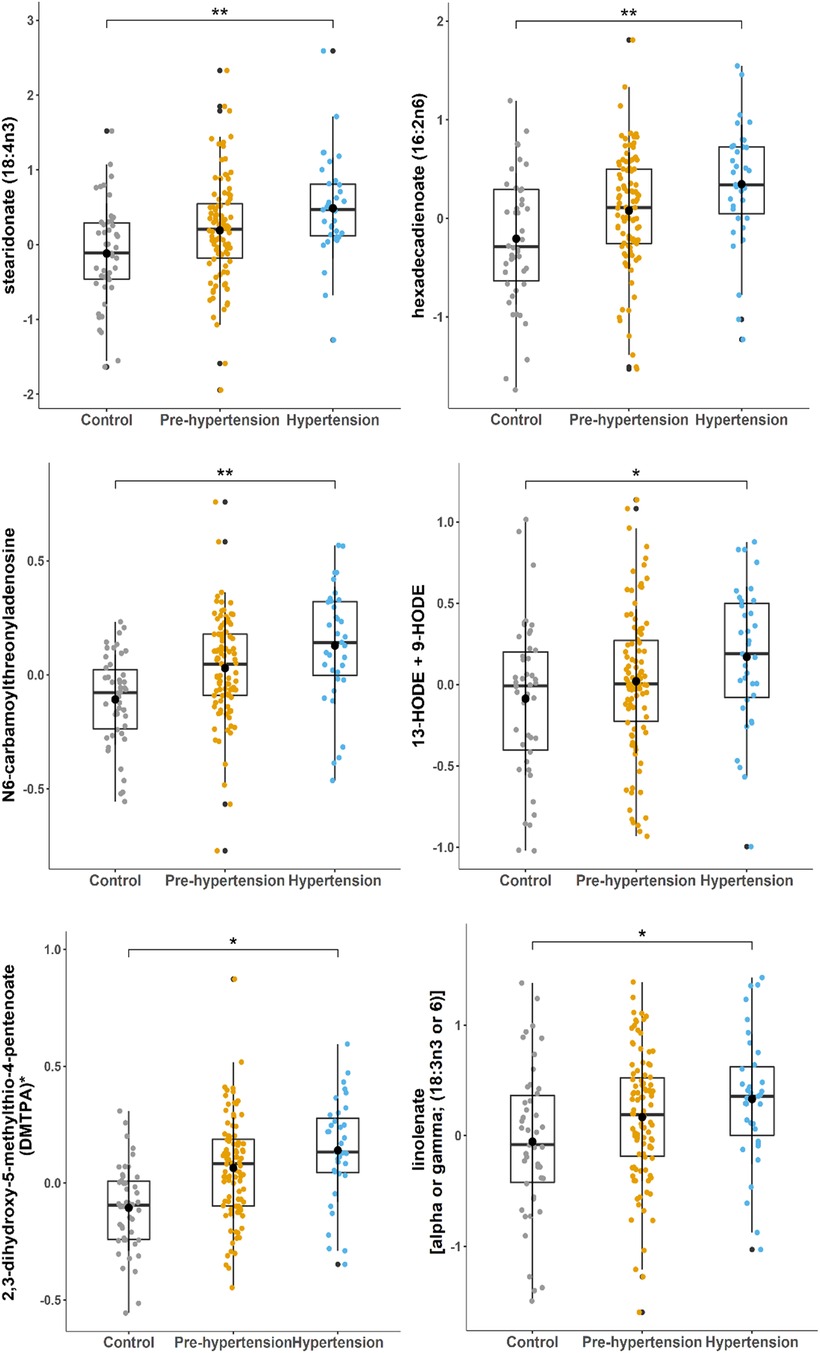
Figure 2. Boxplots of metabolites associated with hypertension progression in the discovery cohort. Linear regression performed using the R statistical package. Y-axis indicates levels of metabolites (ln). FDR significance level of 0.05 was used.
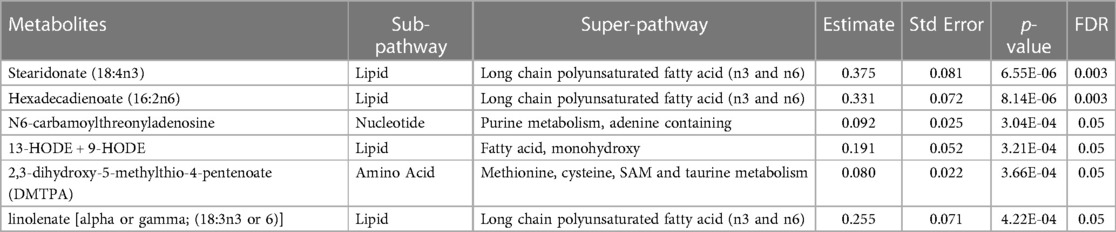
Table 2. Metabolites significantly linked to a higher risk of hypertension in the discovery cohort.
In order to validate our findings, additional 72 healthy and 72 pre-hypertensive participants were used (table including their clinical profile is provided in Supplementary Table S5). By conducting a Receiver Operating Characteristic (ROC) analysis for the metabolites stearidonate (18:4n3), hexadecadienoate (16:2n6), N6-carbamoylthreonyladenosine, 13-HODE + 9-HODE, 2,3-dihydroxy-5-methylthio-4-pentenoate (DMTPA), and linolenate [alpha or gamma; (18:3n3 or 6)], we were able to determine their diagnostic performance. The cumulative ROC of all six metabolites provided AUC of 0.736 (Figure 3A) [95% CI: 0.654–0.818, p-value: 5.32 69 × 10-7]. However, the ROC of metabolites 13-HODE + 9-HODE and 2,3-dihydroxy-5-methylthio-4-pentenoate (DMTPA) provided AUC of 0.712 (Figure 3B) [95% CI: 0.627–0.796, p-value: 5.69 × 10⁻⁶], indicating a significant level of accuracy in predicting pre-hypertension risk, as evidenced by the significant p-value.
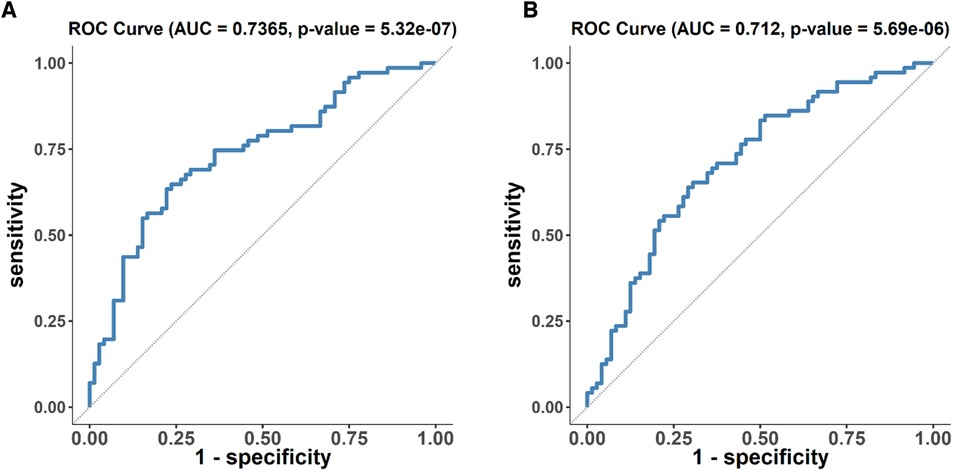
Figure 3. ROC analysis of metabolites associated with disease progression in the discovery cohort. (A) ROC analysis of six metabolites (stearidonate (18:4n3), hexadecadienoate (16:2n6), N6-carbamoylthreonyladenosine, 13-HODE + 9-HODE, 2,3-dihydroxy-5-methylthio-4-pentenoate (DMTPA), and linolenate [alpha or gamma; (18:3n3 or 6)]) (B) ROC analysis of 13-HODE + 9-HODE and 2,3-dihydroxy-5-methylthio-4-pentenoate (DMTPA) only.
To strengthen our findings, further analysis was performed by combining the cohorts with diverse age ranges (below and above 40 years old). A random selection of 70% of the combined population was used as a discovery cohort, while the remaining 30% served as validation cohort. The obtained results confirmed our previously reported findings indicating a significant association between linolenate (18:3n3 or 6), stearidonate (18:4n3), hexadecadienoate (16:2n6), and 13-HODE + 9-HODE with an increased risk of hypertension progression in the new discovery cohort. Notably, stearidonate (18:4n3) and hexadecadienoate (16:2n6) also demonstrated significance in the validation cohort. The results of this analysis are included in Supplementary Table S6.
The results of the linear regression analysis' (Table 2) were used to undertake a correlation study between the clinical characteristics of pre-hypertensive and hypertensive patients and the significantly altered metabolites as shown in Figure 4.
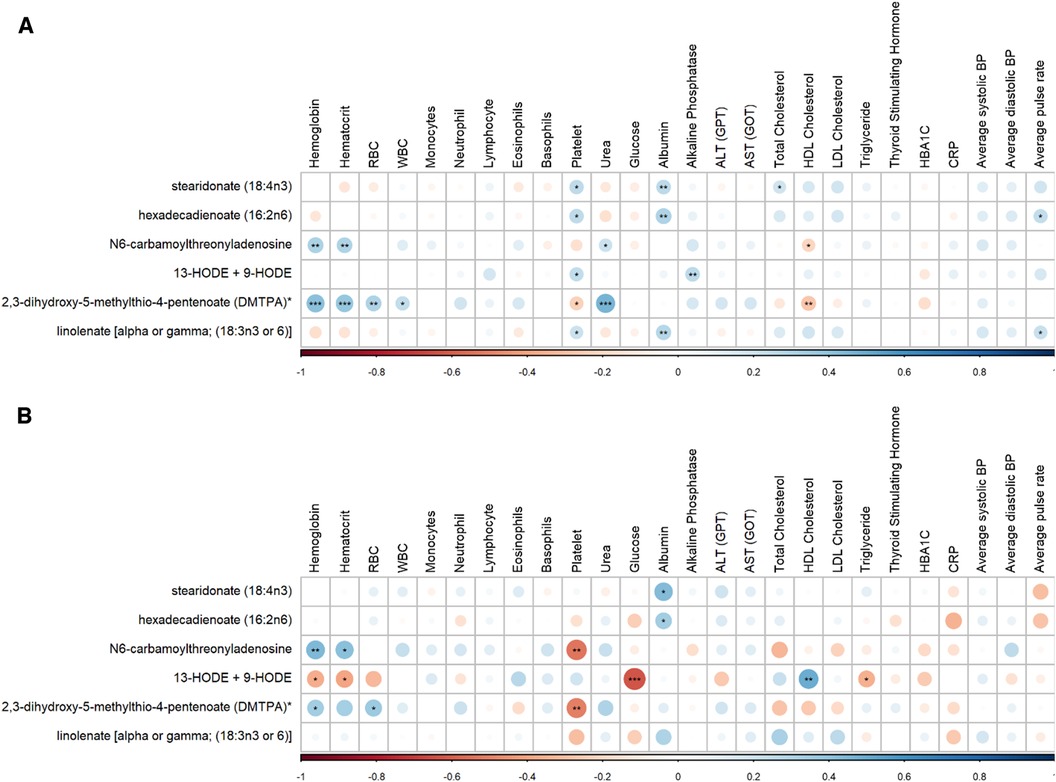
Figure 4. Correlation matrix between clinical characteristics and metabolites in (A) pre-hypertensive patients and (B) hypertensive discovery patients showing positive (blue) and negative (red) correlations. Significant correlations are displayed by ***/**/* denoting <0.001/<0.01/<0.05.
Epidemiological studies have reported that pre-hypertension is common worldwide (6), and it is likely to progress to hypertension and increase the risk of cardiovascular diseases (8). Metabolomic profiling has been widely used for the identification of novel pathways and biomarkers for hypertension (18), however, there is limited research on the metabolomic pathways underlying the progression of pre-hypertension to hypertension.
In this study, we have identified and validated numerous metabolites that exhibit significant association with an increased risk of hypertension in Qatari population. These metabolites play a crucial role in various metabolic pathways, providing insights into the underlying mechanisms contributing to the development and progression of this disease.
Our study revealed alterations in lipid metabolism, as evident from the changes in the levels of specific polyunsaturated fatty acids: stearidonate (18:4n-3), hexadecadienoate (16:2n6), and linolenate [alpha or gamma; (18:3n3 or 6)], between healthy, pre-hypertensive and hypertensive participants. Dysregulation of lipid metabolism has been previously linked to blood pressure elevation and cardiovascular risks, highlighting its importance in the context of hypertension (26–28). However, the direct relation between hypertension and stearidonate, hexadecadienoate, or linolenate, has not been established. First, in this study, we observed an elevation in stearidonate, which is an omega-3 fatty acid derived from α-linolenic acid (18:3 n -3) metabolic pathway (29, 30). This pathway has been shown to be implicated in many biological processes in the human body (30). Stearidonate has been found to be altered in many metabolomics studies. For example, metabolomics profiling of patients with excessive fluid retention, inflammation and acute graft vs. host rejection revealed an alteration in stearidonate (18:4n-3) (31). Exposure to dioxin, which is known to increase the risk of cardiovascular diseases and hypertension, also lead to increased stearidonate in mice liver (32). In addition, elevation in stearidonate (18:4n3) was noted in the metabolomic analysis of patients with argininosuccinate lyase deficiency (33). Plasma stearidonate levels were also elevated in untreated patients with primary dilated cardiomyopathy (34). Furthermore, stearidonate was significantly associated with increased urinary albumin excretion which indicates nephropathy and reflects endothelial dysfunction and kidney damage in the metabolomic analysis of patients with albuminuria (35). In contrast, several studies highlighted the potential benefits of stearidonate in relation to cardiovascular diseases (36, 37). It has been reported that stearidonate can exert an anti-thrombotic (30), anti-inflammatory (38, 39), as well as athero-protective effect (38). Second, our study revealed an alteration in hexadecadienoate (16:2n6) between healthy, pre-hypertensive and hypertensive participants. Hexadecadienoate is a long chain polyunsaturated fatty acid involved in lipid metabolism (40). Consistent with our results, a positive association between hexadecadienoate and systolic and diastolic blood pressure has reported in Chinese adults (41). Moreover, a study investigating the metabolomic profile in patients with chronic thromboembolic pulmonary hypertension showed higher hexadecadienoate levels in those patients compared to controls (31). Hexadecadienoate (16:2n6) was also listed among the metabolites differentiating insulin-sensitive from insulin-resistant lean/overweight subjects (42). In addition, analysis of the metabolic signature of leukocyte telomere length in elite soccer players, demonstrated that hexadecadienoate was associated with leukocyte telomere length in those individuals proposing a role of this metabolite in age-related diseases including cardiovascular diseases (43). Third, the polyunsaturated fatty acid linolenate (18:3n3 or 6) was shown to be associated with increased hypertension risk in the current study. Linolenate refers to either alpha-linolenic acid or gamma-linolenic acid (44). Alpha-linolenic acid is an essential omega-3 fatty acid highly present in edible and flaxseed oils (29), while gamma-linolenic acid is an omega-6 fatty acid, abundant in green leafy vegetables and nuts (45). Similar to our findings, a study comparing levels of metabolic predictors of coronary heart disease indicated that linolenate (18:3n3 or 6) was significantly different between lean and overweight females and was associated with elevated c-peptide and diastolic blood pressure (46). Zhe Wang et al. also reported that linoleante is associated with increased risk of coronary heart disease (47). Moreover, linolenate was found among the metabolites that differed significantly in dogs with dilated cardiomyopathy eating a non-traditional diet or a traditional diet (48). In addition, this metabolite was shown to be associated with urine albumin excretion rate (35). Together, these studies suggest a role for linoleante in hypertension and cardiovascular disease progression. On the other hand, clinical studies have also reported that alpha- linolenic acid can exert anti-obesity, anti-diabetic, anti-inflammatory, anti-cancer and anti-oxidize effects. It also has neuro and cardioprotective properties (49). Furthermore, food rich with alpha- linolenic acid was able to regulate blood pressure in hypertensive patients (49). Gamma- linolenic acid is also known for its potential benefits as an anti-inflammatory nutrient (45). Therefore, whether these polyunsaturated fatty acids are beneficial or deleterious to human health is still controversial and further research is needed to identify the role of these metabolite in the development of hypertension, as well as other pathological condition.
Moreover, our study uncovers the importance of purine metabolism disturbances, with N6-carbamoylthreonyladenosine, a nucleotide metabolite, significantly associated with increased risk of hypertension. Consistent with our finding, it has been reported that N6-carbamoylthreonyladenosine was significantly associated with systolic blood pressure (41). It has been identified as a biomarker for chronic kidney disease progression in children (50, 51) and highly correlated with glomerular filtration rate (52). Hypertension can often lead to end organ damage including renal dysfunction and chronic kidney disease (53). In addition, chronic kidney disease patients often face a higher risk of cardiovascular complications, including hypertension (54, 55). N6-carbamoylthreonyladenosine was shown to be associated with inflammatory marker IL-6 in older adults (56). Hypertension has been linked to inflammation and hypertensive patients have higher levels of IL-6 (57, 58). Thus, investigating the effect of N6-carbamoylthreonyladenosine on blood pressure regulation is important for early detection and prevention of hypertension, particularly in patients with chronic kidney disease.
Additionally, this study identified 13-HODE and 9-HODE as biomarkers for the progression of hypertension. 13-HODE and 9-HODE, known as oxylipins, are oxidized metabolites of linoleic acid which is the most common polyunsaturated fatty acid found in human diets (59). Several studies have demonstrated the contribution of oxylipins, in general, to cardiovascular diseases including hypertension (60), however, limited studies are available on the influence of 13-HODE and 9-HODE, specifically, on hypertension. A study have reported a significant increase in serum 13-HODE in patients with essential hypertension and it was positively correlated with mean blood pressure (61). Another study suggested that 13-HODE and 9-HODE are associated with pulmonary arterial hypertension (32). 9 and 13-HODE were considered among the most important derivatives after an early incident of ischemic stroke (62). Furthermore, 13-HODE and 9-HODE can affect vascular cells including smooth muscle cells (62). Alteration in vascular smooth muscle cell signaling and function can affect vascular reactivity and tone, which are critical determinants of vascular resistance and blood pressure (63). Several studies also show that HODE can induce pro-inflammatory effect including the production of inflammatory cytokines IL-1β and IL-8 (64, 65),and the activation of NF-κB (66). In addition, 13-HODE and 9-HODE have been considered as biomarkers for oxidative stress and are linked to various pathological conditions such as atherosclerosis, diabetes, chronic inflammation, obesity, and cancer (59, 67). As oxidative stress plays an important role in the progression of hypertension, the strong relationship between 13-HODE and 9-HODE and oxidative stress (68) further emphasizes the potential role of those metabolites in the progression of this disease.
Finally, our results showed alteration in 2,3-dihydroxy-5-methylthio-4-pentenoate (DMTPA) between the study groups. DMTPA is an amino acid metabolite derived from S-adenosyl methionine (69). This metabolite is considered as uremic toxin and increased in patients with acute kidney injury (69). A study have revealed an association between DMTPA and systolic blood pressure (41). It has also been shown to be significantly correlated with BMI (70). High BMI can increase the risk of hypertension (71). Although the direct role of DMTPA in hypertension remains unclear, its connection to renal function suggests a possible link. Further research is needed to better understand the role of DMTPA in the context of hypertension.
To our knowledge, this is the first study identifying the metabolites associated with hypertension progression in Qatar. Despite the fact that our study provides significant insights, we acknowledge that certain limitations may have affected the outcomes. First, the data provided by Qatar Biobank did not specify whether the patients included in the study had primary or secondary hypertension. These two types might have distinct metabolic signatures in hypertensive patients. Second, the absence of hypertensive participants for validation due to limited data availability. However, validation in pre-hypertensive participants can still indicate that these metabolites might increase the risk of hypertension progression in these individuals. Thirdly, the study lacks information on the menopausal stage of female participants, especially given the age range of the discovery cohort (40–65 years), indicative of pre-menopausal or menopausal stages. Menopause, being associated with hypertension, might pose a potential confounding factor in this study.
In conclusion, in this study we have identified a set of metabolites associated with the progression of hypertension. Our study is exploratory in nature, aiming to shed light on the metabolic changes associated with hypertension. It serves as a foundation for further research necessary for the potential integration of metabolomics into clinical practice. Furthermore, our findings contribute to the development of novel diagnostic and predictive tools that could transform the way we approach and manage hypertension in the future.
The datasets presented in this study can be found in online in an online repository: https://doi.org/10.6084/m9.figshare.25093178.v1.
The studies involving humans were approved by The QBB institutional review board (E -2021-QF-QBB-RES-ACC-00021-0160). The studies were conducted in accordance with the local legislation and institutional requirements. The participants provided their written informed consent to participate in this study.
SA: Investigation, Methodology, Writing – original draft, Formal Analysis, Validation. NA: Formal Analysis, Methodology, Data curation, Writing – review & editing. GA: Data curation, Formal Analysis, Methodology, Writing – review & editing. SP: Investigation, Data curation, Writing – review & editing. ME: Data curation, Formal Analysis, Writing – review & editing. AZ: Writing – review & editing, Conceptualization, Funding acquisition, Investigation, Methodology, Project administration, Resources, Supervision, Writing – original draft.
The author(s) declare financial support was received for the research, authorship, and/or publication of this article.
This paper was made possible by Qatar University grants award UREP27-050-3-020 from Qatar National Research Fund (a member of Qatar Foundation) to AZ.
We would like to thank the director and the staff of Qatar Biobank for generously providing the data required for this study. We extend our sincere appreciation to all the participants of Qatar Biobank who made this research possible. Finally, we would like to acknowledge Qatar University for funding this study project.
The authors declare that the research was conducted in the absence of any commercial or financial relationships that could be construed as a potential conflict of interest.
All claims expressed in this article are solely those of the authors and do not necessarily represent those of their affiliated organizations, or those of the publisher, the editors and the reviewers. Any product that may be evaluated in this article, or claim that may be made by its manufacturer, is not guaranteed or endorsed by the publisher.
The Supplementary Material for this article can be found online at: https://www.frontiersin.org/articles/10.3389/fcvm.2024.1284114/full#supplementary-material
1. Zhou B, Carrillo-Larco RM, Danaei G, Riley LM, Paciorek CJ, Stevens GA, et al. Worldwide trends in hypertension prevalence and progress in treatment and control from 1990 to 2019: a pooled analysis of 1201 population-representative studies with 104 million participants. Lancet. (2021) 398(10304):957–80. doi: 10.1016/S0140-6736(21)01330-1
3. Aljefree N, Ahmed F. Prevalence of cardiovascular disease and associated risk factors among adult population in the gulf region: a systematic review. Adv Public Health. (2015) 2015:235101. doi: 10.1155/2015/235101
4. Al-Thani MH, Al-Mutawa KA, Alyafei SA, Ijaz MA, Khalifa SAH, Kokku SB, et al. Characterizing epidemiology of prediabetes, diabetes, and hypertension in Qataris: a cross-sectional study. PLoS One. (2021) 16(10):e0259152. doi: 10.1371/journal.pone.0259152
5. Lyu QS, Huang YQ. The relationship between serum total bilirubin and carotid intima-Media thickness in patients with prehypertension. Ann Clin Lab Sci. (2018) 48(6):757–63.30610046
6. Egan BM, Stevens-Fabry S. Prehypertension–prevalence, health risks, and management strategies. Nat Rev Cardiol. (2015) 12(5):289–300. doi: 10.1038/nrcardio.2015.17
7. Vasan RS, Larson MG, Leip EP, Kannel WB, Levy D. Assessment of frequency of progression to hypertension in non-hypertensive participants in the framingham heart study: a cohort study. Lancet. (2001) 358(9294):1682–6. doi: 10.1016/S0140-6736(01)06710-1
8. Booth JN, Li J, Zhang L, Chen L, Muntner P, Egan B. Trends in prehypertension and hypertension risk factors in US adults. Hypertension. (2017) 70(2):275–84. doi: 10.1161/HYPERTENSIONAHA.116.09004
9. Zhang W, Li N. Prevalence, risk factors, and management of prehypertension. Int J Hypertens. (2011) 2011:605359. doi: 10.4061/2011/605359
10. Song J, Chen X, Zhao Y, Mi J, Wu X, Gao H. Risk factors for prehypertension and their interactive effect: a cross- sectional survey in China. BMC Cardiovasc Disord. (2018) 18(1):182. doi: 10.1186/s12872-018-0917-y
11. Naidu B M, Yusoff MF M, Abdullah S, Musa KI, Yaacob NM, Mohamad MS, et al. Factors associated with the severity of hypertension among Malaysian adults. PLoS One. (2019) 14(1):e0207472. doi: 10.1371/journal.pone.0207472
12. Collier SR, Landram MJ. Treatment of prehypertension: lifestyle and/or medication. Vasc Health Risk Manag. (2012) 8:613–9. doi: 10.2147/VHRM.S29138
13. Unger T, Borghi C, Charchar F, Khan NA, Poulter NR, Prabhakaran D, et al. 2020 International society of hypertension global hypertension practice guidelines. Hypertension. (2020) 75(6):1334–57. doi: 10.1161/HYPERTENSIONAHA.120.15026
14. Mancia G, De Backer G, Dominiczak A, Cifkova R, Fagard R, Germano G, et al. 2007 Guidelines for the management of arterial hypertension: the task force for the management of arterial hypertension of the European society of hypertension (ESH) and of the European society of cardiology (ESC). Eur Heart J. (2007) 28(12):1462–536. doi: 10.1097/HJH.0b013e3281fc975a
15. Beevers G, Lip GY, O'Brien E. ABC Of hypertension: the pathophysiology of hypertension. Br Med J. (2001) 322(7291):912–6. doi: 10.1136/bmj.322.7291.912
16. Onuh JO, Qiu H. Metabolic profiling and metabolites fingerprints in human hypertension: discovery and potential. Metabolites. (2021) 11(10):687. doi: 10.3390/metabo11100687
17. Onuh JO, Aliani M. Metabolomics profiling in hypertension and blood pressure regulation: a review. Clin Hypertens. (2020) 26(1):23. doi: 10.1186/s40885-020-00157-9
18. Guo J, Guo X, Sun Y, Li Z, Jia P. Application of omics in hypertension and resistant hypertension. Hypertens Res. (2022) 45(5):775–88. doi: 10.1038/s41440-022-00885-5
19. Kim ER, Kwon HN, Nam H, Kim JJ, Park S, Kim Y-H. Urine-NMR metabolomics for screening of advanced colorectal adenoma and early stage colorectal cancer. Sci Rep. (2019) 9(1):4786. doi: 10.1038/s41598-019-41216-y
20. Clish CB. Metabolomics: an emerging but powerful tool for precision medicine. Cold Spring Harb Mol Case Stud. (2015) 1(1):a000588. doi: 10.1101/mcs.a000588
21. Qiu S, Cai Y, Yao H, Lin C, Xie Y, Tang S, et al. Small molecule metabolites: discovery of biomarkers and therapeutic targets. Signal Transduct Targeted Ther. (2023) 8(1):132. doi: 10.1038/s41392-023-01399-3
22. Al Kuwari H, Al Thani A, Al Marri A, Al Kaabi A, Abderrahim H, Afifi N, et al. The Qatar biobank: background and methods. BMC Public Health. (2015) 15:1208. doi: 10.1186/s12889-015-2522-7
23. Al Thani A, Fthenou E, Paparrodopoulos S, Al Marri A, Shi Z, Qafoud F, et al. Qatar Biobank cohort study: study design and first results. Am J Epidemiol. (2019) 188(8):1420–33. doi: 10.1093/aje/kwz084
24. Evans A, Bridgewater B, Liu Q, Mitchell M, Robinson R, Dai H, et al. High resolution mass spectrometry improves data quantity and quality as compared to unit mass resolution mass spectrometry in high-throughput profiling metabolomics. Metabolomics. (2014) 4:132. doi: 10.4172/2153-0769.1000132
25. Corey DD, Anne ME, Hongping D, Kay AL. Software techniques for enabling high-throughput analysis of metabolomic datasets. In: Ute R, editor. Metabolomics. Rijeka: IntechOpen (2012). Ch. 7.
26. Liang Y-Q, Isono M, Okamura T, Takeuchi F, Kato N. Alterations of lipid metabolism, blood pressure and fatty liver in spontaneously hypertensive rats transgenic for human cholesteryl ester transfer protein. Hypertens Res. (2020) 43(7):655–66. doi: 10.1038/s41440-020-0401-9
28. Zicha J, Kuneš J, Devynck M-A. Abnormalities of membrane function and lipid metabolism in hypertension*: a review. Am J Hypertens. (1999) 12(3):315–31. doi: 10.1016/S0895-7061(98)00178-2
29. Shahidi F, Ambigaipalan P. Omega-3 polyunsaturated fatty acids and their health benefits. Annu Rev Food Sci Technol. (2018) 9:345–81. doi: 10.1146/annurev-food-111317-095850
30. Guil-Guerrero JL. Stearidonic acid (18:4n-3): metabolism, nutritional importance, medical uses and natural sources. Eur J Lipid Sci Technol. (2007) 109(12):1226–36. doi: 10.1002/ejlt.200700207
31. Reikvam H, Bruserud Ø, Hatfield KJ. Pretransplant systemic metabolic profiles in allogeneic hematopoietic stem cell transplant recipients—identification of patient subsets with increased transplant-related mortality. Transplant Cell Ther. (2023) 29(6):375.e1–375.e14. doi: 10.1016/j.jtct.2023.03.020
32. Petriello MC, Brandon JA, Hoffman J, Wang C, Tripathi H, Abdel-Latif A, et al. Dioxin-like PCB 126 increases systemic inflammation and accelerates atherosclerosis in lean LDL receptor-deficient mice. Toxicol Sci. (2018) 162(2):548–58. doi: 10.1093/toxsci/kfx275
33. Burrage LC, Thistlethwaite L, Stroup BM, Sun Q, Miller MJ, Nagamani SCS, et al. Untargeted metabolomic profiling reveals multiple pathway perturbations and new clinical biomarkers in urea cycle disorders. Genet Med. (2019) 21(9):1977–86. doi: 10.1038/s41436-019-0442-0
34. Alexander D, Lombardi R, Rodriguez G, Mitchell MM, Marian AJ. Metabolomic distinction and insights into the pathogenesis of human primary dilated cardiomyopathy. Eur J Clin Invest. (2011) 41(5):527–38. doi: 10.1111/j.1365-2362.2010.02441.x
35. Fernandes Silva L, Vangipurapu J, Smith U, Laakso M. Metabolite signature of albuminuria involves amino acid pathways in 8661 Finnish men without diabetes. J Clin Endocrinol Metab. (2021) 106(1):143–52. doi: 10.1210/clinem/dgaa661
36. Roth EM, Harris WS. Fish oil for primary and secondary prevention of coronary heart disease. Curr Atheroscler Rep. (2010) 12:66–72. doi: 10.1007/s11883-009-0079-6
37. Pieters DJM, Mensink RP. Effects of stearidonic acid on serum triacylglycerol concentrations in overweight and obese subjects: a randomized controlled trial. Eur J Clin Nutr. (2015) 69(1):121–6. doi: 10.1038/ejcn.2014.193
38. Whelan J, Gouffon J, Zhao Y. Effects of dietary stearidonic acid on biomarkers of lipid Metabolism. J Nutr. (2012) 142(3):630S–4S. doi: 10.3945/jn.111.149138
39. Sung J, Jeon H, Kim IH, Jeong HS, Lee J. Anti-inflammatory effects of stearidonic acid mediated by suppression of NF-κB and MAP-kinase pathways in macrophages. Lipids. (2017) 52(9):781–7. doi: 10.1007/s11745-017-4278-6
40. PubChem Compound Summary for CID 86289175, (9Z,12Z)-hexadecadienoate. NCBI. (2023). Available online at: https://pubchem.ncbi.nlm.nih.gov/compound/9Z_12Z_-hexadecadienoate
41. Wang Y, Wang H, Howard AG, Tsilimigras MCB, Avery CL, Meyer KA, et al. Gut microbiota and host plasma metabolites in association with blood pressure in Chinese adults. Hypertension. (2021) 77(2):706–17. doi: 10.1161/HYPERTENSIONAHA.120.16154
42. Diboun I, Al-Mansoori L, Al-Jaber H, Albagha O, Elrayess MA. Metabolomics of lean/overweight insulin-resistant females reveals alterations in steroids and fatty acids. J Clin Endocrinol Metab. (2021) 106(2):e638–e49. doi: 10.1210/clinem/dgaa732
43. Al-Muraikhy S, Sellami M, Domling AS, Rizwana N, Agouni A, Al-Khelaifi F, et al. Metabolic signature of leukocyte telomere length in elite male soccer players. Front Mol Biosci. (2021) 8:727144. doi: 10.3389/fmolb.2021.727144
44. Aldred EM, Buck C, Vall K. Chapter 10—lipids. In: Aldred EM, Buck C, Vall K, editors. Pharmacology. Edinburgh: Churchill Livingstone (2009). p. 73–80.
45. Kapoor R, Huang Y-S. Gamma linolenic acid: an antiinflammatory Omega-6 fatty acid. Curr Pharm Biotechnol. (2006) 7(6):531–4. doi: 10.2174/138920106779116874
46. Abu-El-Ruz R, Abdel-Rahman ME, Atkin SL, Elrayess MA. Comparing levels of metabolic predictors of coronary heart disease between healthy lean and overweight females. Metabolites. (2021) 11(3):169. doi: 10.3390/metabo11030169
47. Wang Z, Zhu C, Nambi V, Morrison AC, Folsom AR, Ballantyne CM, et al. Metabolomic pattern predicts incident coronary heart disease. Arterioscler Thromb Vasc Biol. (2019) 39(7):1475–82. doi: 10.1161/ATVBAHA.118.312236
48. Smith CE, Parnell LD, Lai C-Q, Rush JE, Adin DB, Ordovás JM, et al. Metabolomic profiling in dogs with dilated cardiomyopathy eating non-traditional or traditional diets and in healthy controls. Sci Rep. (2022) 12(1):22585. doi: 10.1038/s41598-022-26322-8
49. Yuan Q, Xie F, Huang W, Hu M, Yan Q, Chen Z, et al. The review of alpha-linolenic acid: sources, metabolism, and pharmacology. Phytother Res. (2022) 36(1):164–88. doi: 10.1002/ptr.7295
50. Riccio S, Valentino MS, Passaro AP, Izzo M, Guarino S, Miraglia Del Giudice E, et al. New insights from metabolomics in pediatric renal diseases. Children (Basel). (2022) 9(1):118. doi: 10.1002/ptr.7295
51. Denburg MR, Xu Y, Abraham AG, Coresh J, Chen J, Grams ME, et al. Metabolite biomarkers of CKD progression in children. Clin J Am Soc Nephrol. (2021) 16(8):1178–89. doi: 10.2215/CJN.00220121
52. Peng H, Liu X, Aoieong C, Tou T, Tsai T, Ngai K, et al. Identification of metabolite markers associated with kidney function. J Immunol Res. (2022) 2022:6190333. doi: 10.1155/2022/6190333
53. De Bhailis ÁM, Kalra PA. Hypertension and the kidneys. Br J Hosp Med (Lond). (2022) 83(5):1–11. doi: 10.12968/hmed.2021.0440
54. Jankowski J, Floege J, Fliser D, Böhm M, Marx N. Cardiovascular disease in chronic kidney disease. Circulation. (2021) 143(11):1157–72. doi: 10.1161/CIRCULATIONAHA.120.050686
55. Tain YL, Hsu CN. Cardiovascular risks of hypertension: lessons from children with chronic kidney disease. Children (Basel). (2022) 9(11):1650. doi: 10.3390/children9111650
56. Lustgarten MS, Fielding RA. Metabolites associated with circulating interleukin-6 in older adults. J Gerontol A Biol Sci Med Sci. (2017) 72(9):1277–83. doi: 10.1093/gerona/glw039
57. Chamarthi B, Williams GH, Ricchiuti V, Srikumar N, Hopkins PN, Luther JM, et al. Inflammation and hypertension: the interplay of interleukin-6, dietary sodium, and the renin-angiotensin system in humans. Am J Hypertens. (2011) 24(10):1143–8. doi: 10.1038/ajh.2011.113
58. Vázquez-Oliva G, Fernández-Real JM, Zamora A, Vilaseca M, Badimón L. Lowering of blood pressure leads to decreased circulating interleukin-6 in hypertensive subjects. J Hum Hypertens. (2005) 19(6):457–62. doi: 10.1038/sj.jhh.1001845
59. Nieman DC, Shanely RA, Luo B, Meaney MP, Dew DA, Pappan KL. Metabolomics approach to assessing plasma 13- and 9-hydroxy-octadecadienoic acid and linoleic acid metabolite responses to 75-km cycling. Am J Physiol Regul Integr Comp Physiol. (2014) 307(1):R68–74. doi: 10.1152/ajpregu.00092.2014
60. Nayeem MA. Role of oxylipins in cardiovascular diseases. Acta Pharmacol Sin. (2018) 39(7):1142–54. doi: 10.1038/aps.2018.24
61. Wang D, Strandgaard S, Iversen J, Wilcox CS. Asymmetric dimethylarginine, oxidative stress, and vascular nitric oxide synthase in essential hypertension. Am J Physiol Regul Integr Comp Physiol. (2009) 296(2):R195–200. doi: 10.1152/ajpregu.90506.2008
62. Szczuko M, Kotlęga D, Palma J, Zembroń-Łacny A, Tylutka A, Gołąb-Janowska M, et al. Lipoxins, RevD1 and 9, 13 HODE as the most important derivatives after an early incident of ischemic stroke. Sci Rep. (2020) 10(1):12849. doi: 10.1038/s41598-020-69831-0
63. Touyz RM, Alves-Lopes R, Rios FJ, Camargo LL, Anagnostopoulou A, Arner A, et al. Vascular smooth muscle contraction in hypertension. Cardiovasc Res. (2018) 114(4):529–39. doi: 10.1093/cvr/cvy023
64. Ku G, Thomas CE, Akeson AL, Jackson RL. Induction of interleukin 1 beta expression from human peripheral blood monocyte-derived macrophages by 9-hydroxyoctadecadienoic acid. J Biol Chem. (1992) 267(20):14183–8. doi: 10.1016/S0021-9258(19)49695-6
65. Terkeltaub R, Banka CL, Solan J, Santoro D, Brand K, Curtiss LK. Oxidized LDL induces monocytic cell expression of interleukin-8, a chemokine with T-lymphocyte chemotactic activity. Arterioscler Thromb. (1994) 14(1):47–53. doi: 10.1161/01.ATV.14.1.47
66. Ogawa E, Owada Y, Ikawa S, Adachi Y, Egawa T, Nemoto K, et al. Epidermal FABP (FABP5) regulates keratinocyte differentiation by 13 (S)-HODE-mediated activation of the NF-κB signaling pathway. J Invest Dermatol. (2011) 131(3):604–12. doi: 10.1038/jid.2010.342
67. Nieman DC, Meaney MP, John CS, Knagge KJ, Chen H. 9- And 13-hydroxy-octadecadienoic acids (9 + 13 HODE) are inversely related to granulocyte colony stimulating factor and IL-6 in runners after 2 h running. Brain Behav Immun. (2016) 56:246–52. doi: 10.1016/j.bbi.2016.03.020
68. Rodrigo R, González J, Paoletto F. The role of oxidative stress in the pathophysiology of hypertension. Hypertens Res. (2011) 34(4):431–40. doi: 10.1038/hr.2010.264
69. Bajaj JS, Garcia-Tsao G, Reddy KR, O'Leary JG, Vargas HE, Lai JC, et al. Admission urinary and Serum metabolites predict renal outcomes in hospitalized patients with cirrhosis. Hepatology. (2021) 74(5):2699–713. doi: 10.1002/hep.31907
70. McClain KM, Friedenreich CM, Matthews CE, Sampson JN, Check DP, Brenner DR, et al. Body composition and metabolomics in the Alberta physical activity and breast cancer prevention trial. J Nutr. (2022) 152(2):419–28. doi: 10.1093/jn/nxab388
Keywords: hypertension, pre-hypertension, metabolic profiling, biomarkers, disease progression
Citation: Al Ashmar S, Anwardeen NR, Anlar GG, Pedersen S, Elrayess MA and Zeidan A (2024) Metabolomic profiling reveals key metabolites associated with hypertension progression. Front. Cardiovasc. Med. 11:1284114. doi: 10.3389/fcvm.2024.1284114
Received: 28 August 2023; Accepted: 17 January 2024;
Published: 8 February 2024.
Edited by:
Tlili Barhoumi, King Abdullah International Medical Research Center (KAIMRC), Saudi ArabiaReviewed by:
Rajarshi Banerjee, Perspectum Diagnostics, United Kingdom© 2024 Al Ashmar, Anwardeen, Anlar, Pedersen, Elrayess and Zeidan. This is an open-access article distributed under the terms of the Creative Commons Attribution License (CC BY). The use, distribution or reproduction in other forums is permitted, provided the original author(s) and the copyright owner(s) are credited and that the original publication in this journal is cited, in accordance with accepted academic practice. No use, distribution or reproduction is permitted which does not comply with these terms.
*Correspondence: Asad Zeidan YS56ZWlkYW5AcXUuZWR1LnFh
Disclaimer: All claims expressed in this article are solely those of the authors and do not necessarily represent those of their affiliated organizations, or those of the publisher, the editors and the reviewers. Any product that may be evaluated in this article or claim that may be made by its manufacturer is not guaranteed or endorsed by the publisher.
Research integrity at Frontiers
Learn more about the work of our research integrity team to safeguard the quality of each article we publish.