
95% of researchers rate our articles as excellent or good
Learn more about the work of our research integrity team to safeguard the quality of each article we publish.
Find out more
ORIGINAL RESEARCH article
Front. Cardiovasc. Med. , 19 December 2023
Sec. Cardiovascular Imaging
Volume 10 - 2023 | https://doi.org/10.3389/fcvm.2023.1282768
 Jie Hou1,2,†,‡
 Hui Jin1,3,†,‡
 Yongsheng Zhang4,‡
 Yuyun Xu1,‡Feng Cui4,‡Xue Qin3,‡Lu Han2,‡Zhongyu Yuan2,‡Guangying Zheng2,‡Jiaxuan Peng2,‡
 Zhenyu Shu1,‡Xiangyang Gong1*‡
Objective: To develop and validate a hybrid model incorporating CT-fractional flow reserve (CT-FFR), pericoronary fat attenuation index (pFAI), and radiomics signatures for predicting progression of white matter hyperintensity (WMH).
Methods: A total of 226 patients who received coronary computer tomography angiography (CCTA) and brain magnetic resonance imaging from two hospitals were divided into a training set (n = 116), an internal validation set (n = 30), and an external validation set (n = 80). Patients who experienced progression of WMH were identified from subsequent MRI results. We calculated CT-FFR and pFAI from CCTA images using semi-automated software, and segmented the pericoronary adipose tissue (PCAT) and myocardial ROI. A total of 1,073 features were extracted from each ROI, and were then refined by Elastic Net Regression. Firstly, different machine learning algorithms (Logistic Regression [LR], Support Vector Machine [SVM], Random Forest [RF], k-nearest neighbor [KNN] and eXtreme Gradient Gradient Boosting Machine [XGBoost]) were used to evaluate the effectiveness of radiomics signatures for predicting WMH progression. Then, the optimal machine learning algorithm was used to compare the predictive performance of individual and hybrid models based on independent risk factors of WMH progression. Receiver operating characteristic (ROC) curve analysis, calibration and decision curve analysis were used to evaluate predictive performance and clinical value of the different models.
Results: CT-FFR, pFAI, and radiomics signatures were independent predictors of WMH progression. Based on the machine learning algorithms, the PCAT signatures led to slightly better predictions than the myocardial signatures and showed the highest AUC value in the XGBoost algorithm for predicting WMH progression (AUC: 0.731 [95% CI: 0.603–0.838] vs.0.711 [95% CI: 0.584–0.822]). In addition, pFAI provided better predictions than CT-FFR (AUC: 0.762 [95% CI: 0.651–0.863] vs. 0.682 [95% CI: 0.547–0.799]). A hybrid model that combined CT-FFR, pFAI, and two radiomics signatures provided the best predictions of WMH progression [AUC: 0.893 (95%CI: 0.815–0.956)].
Conclusion: pFAI was more effective than CT-FFR, and PCAT signatures were more effective than myocardial signatures in predicting WMH progression. A hybrid model that combines pFAI, CT-FFR, and two radiomics signatures has potential use for identifying WMH progression.
White matter hyperintensity (WMH) is a neuroimaging feature in magnetic resonance imaging (MRI) that indicates small vascular lesions in the brain. The specific manifestation is signal hyperintensity in the periventricular or deep periventricular white matter on the T2-weighted or fluid-attenuated inversion recovery (FLAIR) images (1). Several previous studies concluded that WMH was associated with cognitive decline, depression, stroke, and even death (2, 3). In addition, the WMH volume may increase or decrease over time (4, 5). Accordingly, early identification of WMH and prediction of progression are essential for preventing the underlying diseases (6). Cardiovascular diseases may provide a pathophysiological background for several brain diseases, such as stroke (7), dementia (8), and cognitive impairment (9). Among them, coronary artery disease (CAD) is closely associated with cerebral white matter disease, but the specific mechanism responsible for their co-occurrence is still unclear (10). The heart and brain have blood vessels with similar anatomical structures, and each organ provides perfusion to tissues through a vascular network of arteries that run on the organ surface (11). Therefore, it is crucial to have a comprehensive understanding of the relationship between WMH and CAD (12).
Previous studies found significant associations of the presence and severity of WMH with cardiovascular health and age (12, 13). The incidence rate of WMH increases with age, and is also affected by cardiovascular risk factors (14). Other studies showed that the presence and a larger volume of coronary artery plaque were associated with a larger WMH volume (10). Coronary computed tomography angiography (CCTA) is a non-invasive method that can provide information on the characteristics of plaque and the severity of lumen stenosis, which was valuable in CAD detection. Vascular stiffness, atherosclerosis, calcification score, calcification plaque and cardiac blood perfusion all have certain influence factors on the occurrence and progress of cerebrovascular related diseases, especially the most common manifestation of cerebrovascular diseases—WMH (15). We can not only directly observe the related manifestations of cardiovascular diseases on CCTA images, but also use some derived markers to further analyze the correlation of WMH through the response to cardiovascular related risk factors. There are currently two CCTA-derived markers that can effectively indicate CAD: the percoronary fat attenuation index (pFAI), which reflects coronary inflammation, and the CT-derived fractional flow reserve (CT-FFR), which reflects hemodynamics (16). The pFAI represents the average attenuation index within the range of PCAT (range of−190 to−30 HU), which is not affected by calcified plaques and luminal stenosis and can accurately indicates vascular inflammation and cardiovascular risk (17, 18). By drawing spatial changes in perivascular fat attenuation on CCTA, pFAI reflects changes in the size and lipid content of local adipocytes around the coronary artery, directly visualizing and quantifying perivascular inflammation. Inflammation is another critical feature of atherosclerosis (19). Similarly, the “inflammatory theory” of brain disease proposes that the destruction of microcirculation leads to the formation of WMH (16). In addition to the common role of inflammation in the occurrence and development of these two diseases, the brain and the heart both rely on perfusion to meet their high metabolic needs. The regulation of resistance to cerebral microcirculation is a key to maintaining adequate local cerebral blood flow (12). Previous research showed a clear correlation between the CAC volume and poor integrity of white matter microstructure (20). Moreover, plaques with larger volumes in the coronary artery can affect image quality due to patchy and blooming artifacts, leading to errors in the calculation of lumen stenosis, calcification score, and hemodynamic evaluations (21–23). The FFR from invasive coronary angiography (ICA) is the reference standard for detecting disease-specific ischemia, but this test is costly and invasive (24). CT-FFR provides data similar that from invasive FFR, and is used to evaluate the degree of cardiac ischemia using CCTA (25, 26). Therefore, abnormal perfusion in these two organs appear to cause similar pathological changes.
Radiomics can extract quantitative features from images and aid in the diagnosis of multiple disorders, including cardiovascular and cerebrovascular diseases (27, 28). Thus, whole-brain white matter radiomics can be used to predict the progression of WMH (29). Radiomics features obtained from cardiovascular magnetic resonance (CMR) images can detect cardiac changes that are related to chronic cerebral ischemia (30). CCTA can also establish a relationship between the heart and brain. However, the pFAI measurements are only based on the voxel intensity value (31). It is also unclear whether PCAT and myocardial radiomics features can predict WMH progression.
The purpose of the study is to evaluate the value of CCTA-derived markers and radiomics in predicting WMH progression. We compared the predictive value of pFAI with CT-FFR and radiomics signatures and then used the pFAI and CT-FFR, and the radiomics signatures to develop and validate a hybrid model for predicting WMH progression.
The patients who over 60 years old received CCTA and brain MRI within one month from January 2019 to May 2022 at ZJP Hospital and January 2015 to May 2022 at TCM Hospital were examined. In order to accurately evaluate the WMH progression, patients who underwent second MRI examination after six months were subsequently included. After the application of the inclusion and exclusion criteria (see below), 146 patients from ZJP Hospital were randomly stratified into the training set (n = 116, 50 patients with WMH progression), internal validation set (n = 30, 13 patients with WMH progression), and 80 patients (51 patients with WMH progression) from TCM Hospital were included into the external validation set. The inclusion criteria were: (1) evidence of WMH based on T2 FAIR and T2-weighted MRI, (2) no lesion attributable to stroke on diffusion-weighted MRI, (3) no signs of Alzheimer's disease, multiple sclerosis, or traumatic brain injury, and (4) no history of myocardial infarction and revascularization. The exclusion criteria were: (1) the presence of a vascular white matter disease, (2) signs of cerebral hemorrhage, (3) no definite lesion signs of calcified or non—calcified plaques and luminal stenosis on CCTA, (4) previous revascularization or ACS, or (5) poor quality of CCTA and MRI images. The inclusion and exclusion process of the patients are shown in Figure 1. This research protocol was approved by the local Ethics Committee of two hospitals.
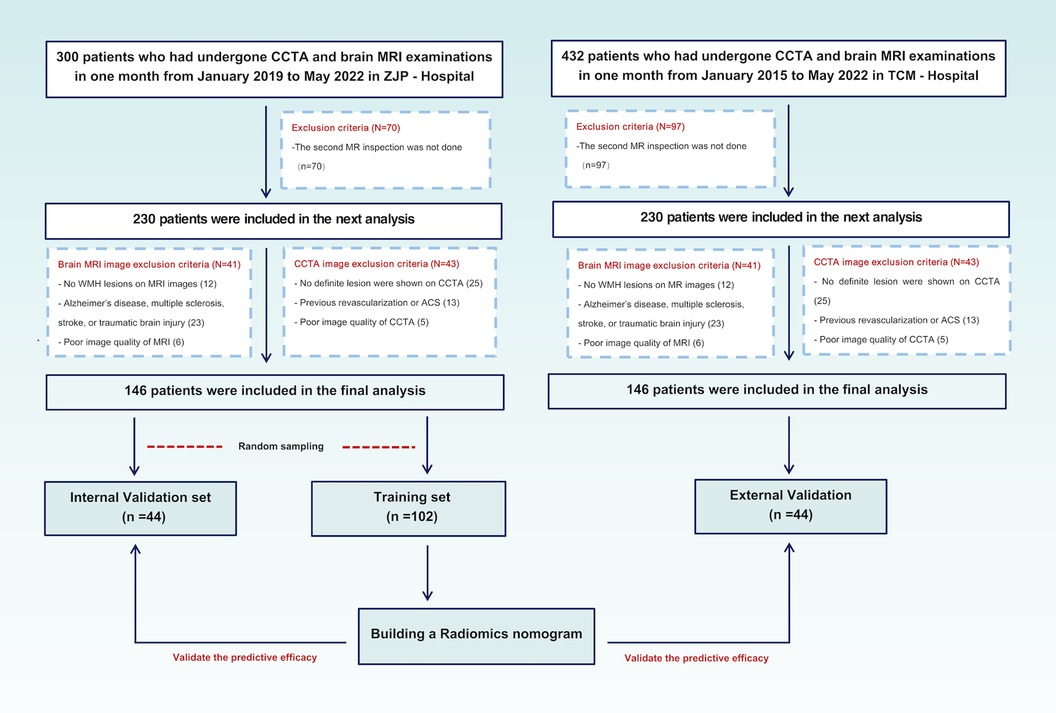
Figure 1. Patients disposition and research design. CCTA, coronary computed tomography angiography; MRI, magnetic resonance imaging; ACS, acute coronary syndrome.
Brain MRI was both performed using 3.0 T MRI scanner. All brain images were scanned and obtained using an 8-channel head coil 3.0 T MRI scanner (ZJP Hospital: Discovery MR 750, GE Healthcare; TCM Hospital: Siemens Trio 3.0 T) with the same parameter settings. The routine sequences of scanning included T1 weighted, T2 weighted, diffusion weighted imaging and fluid-attenuated inversion recovery (FLAIR). T2 FLAIR and T1 weighted images were used for WMH observation and calculation. The specific parameters and routine sequences of the brain MRI are provided in the Supplementary Material. T2 FLAIR and T1 weighted images were imported into MATLAB (The MathWorks, Inc, Natick, United States) for WMH segmentation and volume calculation. The WMH volume was measured using a 1 mm3 spatial dimension of a voxel in each MRI slice. During this process, further automatic segmentation and correction of WMH were carried out, including eliminating non-brain matter and refining WMH segmentation. Images that were considered by both radiologists to have significant segmentation errors were manually segmented and measured again using ITK—SNAP software (http://www.itksnap.org/pmwiki/pmwiki.php) again. The final corrected image was then used for calculation of WMH. The detailed description of the process are shown in Supplementary Figure S1A. Patients were divided into WMH progression and no WMH progression group based on changes of WMH volume. WMH volume progression was defined as an observed increase of more than 0.25 ml in WMH volume, a value derived from the 2015 study of Cho et al. (32). The schematic diagrams of two consecutive brain MRI images of the WMH progression and no-WMH progress groups were shown in Supplementary Figures S1B,C.
All CCTA examinations were performed with a CT scanner using 64 detector rows with prospective electrocardiogram (ECG) -gating (ZJP Hospital: Somatom Flash, Siemens Healthineers, Forchheim, Germany; TCM Hospital: Aquilion One, Toshiba Medical, Otawara, Japan) with the same parameter settings. Detailed information about the CCTA are in the Supplementary Material. Patients with high myocardial jeopardy, high grade angina pectoris, or two or three proximal vascular lesions are likely to receive surgical treatment during the follow-up period (33). These surgically treated vessels may affect the acquisition of the CT-FFR and pFAI and the extraction of radiomics features due to metal artifacts and vascular reconstruction. Therefore, we only included three-vessel (left anterior descending artery [LAD], left circumflex artery [LCX], and right coronary artery [RCA]) for patients who did not undergo surgical treatment and had definite lesions. The Gensini scores were used to evaluate the degree of coronary artery stenosis (34). This score was 0 (no stenosis), 1(1%–49% stenosis), 2 (50%–74% stenosis), 3 (75%–99% stenosis), or 4 (100% stenosis). Finally, the total scores of all segments was considered the final score. According to the Gensini scoring system, coronary artery stenosis was finally classified as mild stenosis (1–14 points) or severe stenosis (>14 points). The analysis of CCTA images were independently performed by two experienced radiologists who were unaware of the clinical data.
The two CCTA-derived biomarkers, pFAI and CT-FFR, can effectively reflect CAD from both vascular inflammation and hemodynamics. In our study, we used PHIgo workstations to measure CT-FFR and pFAI based on deep learning methods (version 1.5.1, GE Healthcare). Arterial phase images of CCTA in each patient were imported in DICOM format into the CQK analysis platform of PHIgo (version 1.5.1, GE Healthcare) software for automated segmentation of PCAT and whole myocardium. PCAT around the stenosis lesion on coronary segments (≥2 mm) can be accurately delineated according to the 18-segment guidelines on the arterial phase images. Radiologists A and B evaluated images of all patients for semi-automatic segmentation of PCAT, and manually corrected images with poor segmentation results and recognition errors for stenosis lesions. After the above steps are processed, the CT-FFR and pFAI at the target lesion are calculated using semi-automatic software. The detailed process is shown in the Supplementary Material and Figure 2. Based on threshold values for high risk of CAD (CT-FFR ≤ 0.80 and FAI ≥ −70.1 HU) (35), the minimum CT-FFR and maximum pFAI values of the three-vessel in the follow-up study were included.
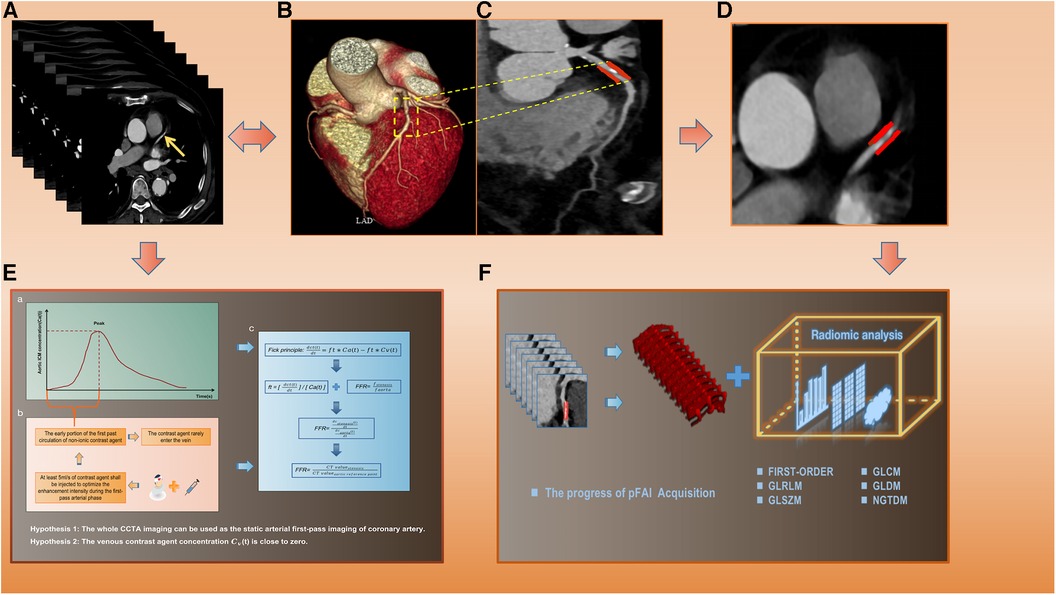
Figure 2. The specific calculation process of CT-FFR and pFAI and radiomics extraction. (A) Original CCTA images. (B,C) CCTA reconstruction images and lesion segments display. (D) PCAT ROI. (E) The calculation process and formula of CT-FFR. (F) pFAI acquisition and radiomics features analysis. CT-FFR, CT fractional flow reserve; pFAI, percoronary fat attenuation index; CCTA, coronary computed tomography angiography; PCAT, pericoronary adipose tissue.
PCAT was defined by voxels with CT attenuation in the range of −190 to −30 HU, and a distance from the outer wall of the coronary artery equal to the diameter of the corresponding horizontal coronary artery (36). When there are multiple vascular lesions, selecting only the largest pFAI among the three vessels for analysis can indicate a higher cardiovascular risk, but there are certain limitations in fully representing the pathological and physiological changes of all vascular lesions. In addition, pFAI is only calculated based on voxel intensity values, and higher-order statistical analysis of spatial relationships from features of radiomics texture can reflect more complex voxel relationships. This is a deeper level of image change that we cannot capture using only pFAI values (37). Therefore, the PCAT around the target segments and whole myocardium were selected as ROIs. If there were multiple lesions in one vessel, the lesion segment with the largest pFAI value was selected. When a patient had multiple vascular lesions, the lesion segment with each vessel's largest FAI value was jointly used as the PCAT-ROI. In order to minimize the central effect of CT images from different hospitals and scanners (38), all CCTA images were pre-processed. A software package that performs quantitative analysis (A.K. software, GE Healthcare) was used to preprocess the CCTA images before extracting the radiomics features. Each sequence of the images is resampled to a resolution of 1 × 1 × 1 mm3 through linear interpolation and the gray level of the images needs to be discretized and normalized to 32 orders. The preprocessing of images, automatic segmentation of ROIs and radiomics feature extraction were shown in the Supplementary Material. We first evaluated the the repeatability of features in the intra- and inter-observers during the feature extraction process using intraclass correlation coefficients(ICCs), retaining features with high reproducibility with ICCs greater than 0.75 (39). Then, we used ComBat to normalize and gather the data distributions to eliminate the central effects of two centers (Supplementary Figure S2). Next, Mann-Whitney U analysis and Elastic Net Regression were used to filter out redundant signatures. The specific formula for Elastic Net Regression and optimal signatures was shown in the Supplementary Material.
Univariate logistic regression analysis was used to select significant factors from potential predictors (age, gender, BMI, hypertension, diabetes mellitus, hyperlipidemia, smoking, alcohol intake, the number and grade of vascular stenosis, pFAI, CT-FFR, PCAT and myocardium radiomics signatures), and then the screened factors were included in the multivariate analysis to finally determine the independent predictors of WMH progression for model construction. We first used different machine learning algorithms [LR (Logistic Regression), SVM (Support Vector Machine), Random Forest (RF), k-nearest neighbor (KNN) and eXtreme Gradient Gradient Boosting Machine (XGBoost)] to construct radiomics models. LR was a mature and powerful supervised classification method. It could be considered as an extension of ordinary regression and could only model the outcome events of binary variables. However, it could help discover the possibility that new instances belong to a certain class (40). SVM algorithm could classify linear and non-linear data. It first maped each data item to an n-dimensional feature space, where n represented the number of features. Then, SVM recognized hyperplanes that divided the data items into two categories, while maximizing the edge distance between the two categories and minimizing classification errors (41). Random Forest (RF) was an ensemble classifier composed of many DTs, and deep growing DTs often led to overfitting of training data, resulting in small changes in input data and high changes in classification results. When using this algorithm, different parts of the training dataset needed to be used to train different DTs of RF. Since the RF algorithm considered the results of many different DTs, it could reduce the variance generated by considering a single DT for the same dataset (42). KNN algorithm was one of the earliest and very simple classification algorithms. The KNN algorithm did not need to consider probability values. KNN was particularly suitable for multi classification problems and was relatively easy to understand and implement (43). XGBoost was a supervised algorithm that belongs to ensemble learning algorithms. It was a scalable and convenient Gradient Boosting algorithm that could build models in parallel. The XGBoost algorithm had certain advantages in preventing model overfitting. Each algorithm had unique advantages, and we compared multiple algorithms to find the optimal algorithm for constructing unitary and hybrid models based on single and all independent risk factors of WMH progression. The area under the curve (AUC) from receiver operator characteristic curve (ROC) analysis was used to evaluate the accuracy of different models. Finally, the goodness-of-fit of the hybrid model was evaluated by using calibration curve and nonparametric test, and decision curve analysis (DCA) was used to evaluate the clinical value of different models. Figure 3 shows the workflow used for the radiomics analysis.
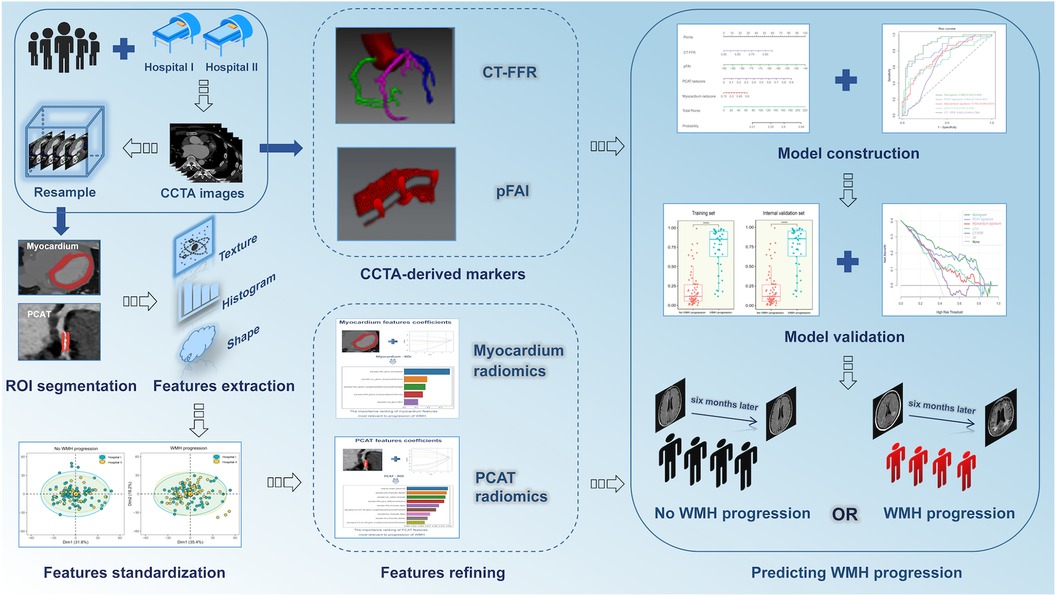
Figure 3. Procedures used for radiomics analysis. CCTA, coronary computed tomography angiography; CT-FFR, CT fractional flow reserve; pFAI, pericoronary fat attenuation index; WMH, white matter hyperintensity.
Statistical analyses were performed using R software (version 3.5.0), SPSS software(version 17.0, Armonk, NY) and Python (version 3.5). Continuous variables were expressed as means ± standard deviations. Categorical variables were compared using the chi-square test. The normality of distribution was assessed using the Kolmogorov-Smirnov test, and variables were then compared using the t-test (normal distributions) or the Mann-Whitney test (non-normal distributions). The intra- and inter-observer reproducibility of extracted features was evaluated using the ICCs. For features extracted from each ROI, the Mann-Whitney U test and Elastic Net Regression were used for filtering redundant and irrelevant signatures. The predictions of different models were evaluated according to AUC, accuracy, and specificity. Compare the ROC curves of different models by using the nonparametric method of DeLong test (44). A p-value below 0.05 was considered significant.
We finally enrolled 146 and 80 patients who had coronary artery stenosis and WMH in the two hospitals. We used the second MRI results to evaluate changes of WMH volume. The WMH volume progressed in 63 patients in ZJP Hospital and 51 patients in TCM Hospital (Supplementary Table S1). Gender, age, BMI, hypertension, diabetes mellitus, hypertension, tobacco smoking, alcohol use, and the number and degree of stenotic vessels were not significantly different between the “WMH progression” group and the “no WMH progression” group for the training set, internal validation set and external validation set. However, the CCTA-derived markers and the radiomics scores were significantly different for the “WMH progression” group and the “no WMH progression” group in the training set and external validation set (both p < 0.05; Table 1).
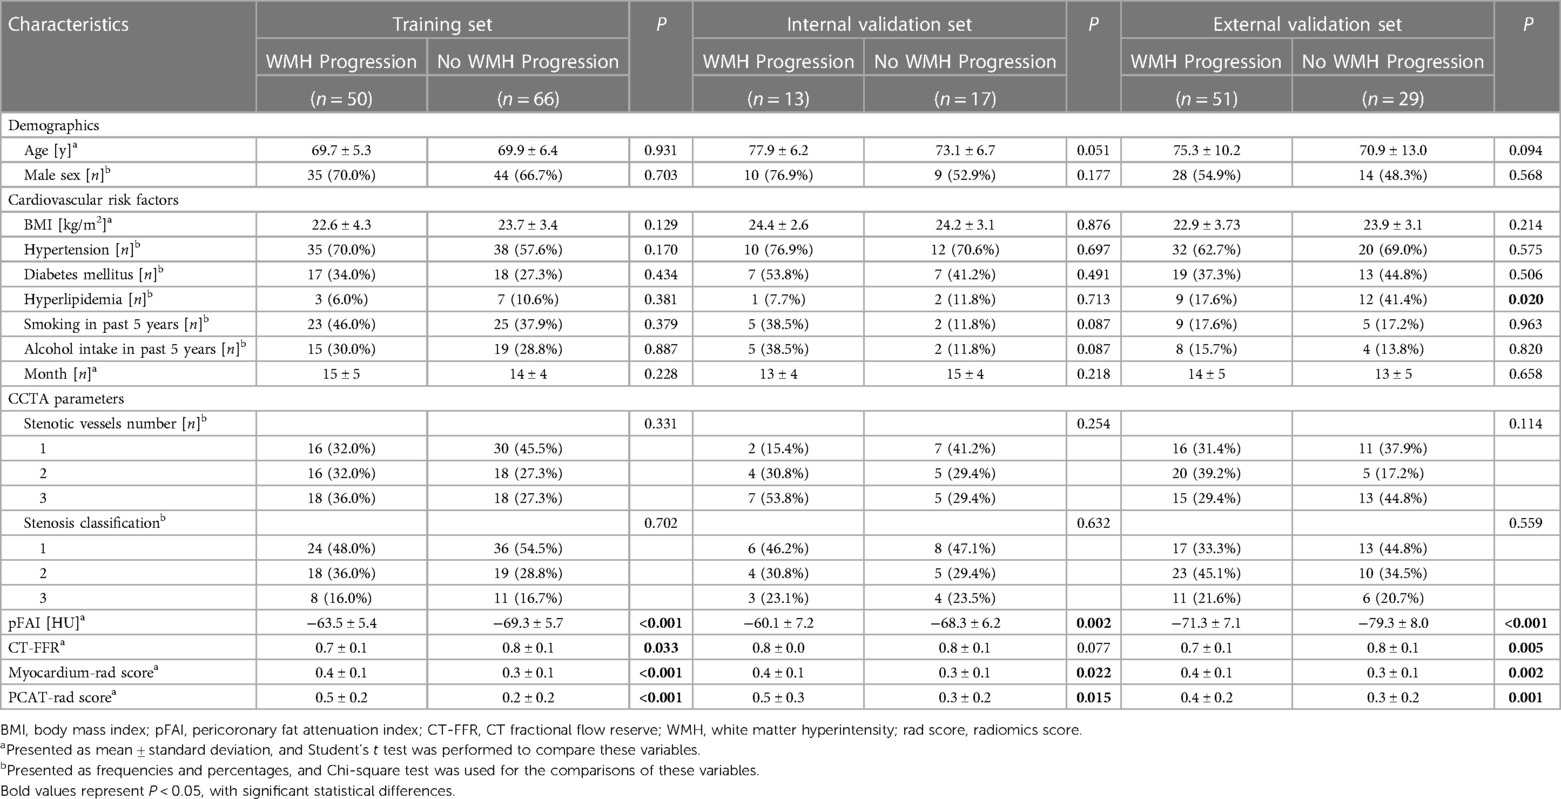
Table 1. Clinical characteristics and radiomics scores of the “WMH progression” group and the “no WMH progression group” in the training set, internal validation set, and external validation set.
We extracted 1,073 features from the PCAT-ROI and myocardium-ROI by PyRadiomics. After standardisation of scanner type and location and using specific feature reduction methods, we selected 5 myocardial and 9 PCAT radiomics signatures that were statistically different between those with and without WMH progression (Figure 4). The results indicated there were statistically significant differences in the radiomics scores for the “WMH progression” group and the “no WMH progression” group in the training, internal validation and external validation set (p < 0.05) (Figure 5). By comparing the AUC of myocardium and PCAT radiomics signatures constructed by different algorithms of LR, SVM, RF, KNN and XGBoost, it was demonstrated that PCAT radiomics signatures and XGBoost algorithm have better prediction efficiency in the training, internal validation and external validation set (AUC: 0.862 [95% CI: 0.788–0.924], 0.760 [95% CI: 0.570–0.923] and 0.731 [95% CI: 0.600–0.836]) in Supplementary Table S2 and Supplementary Figure S3.
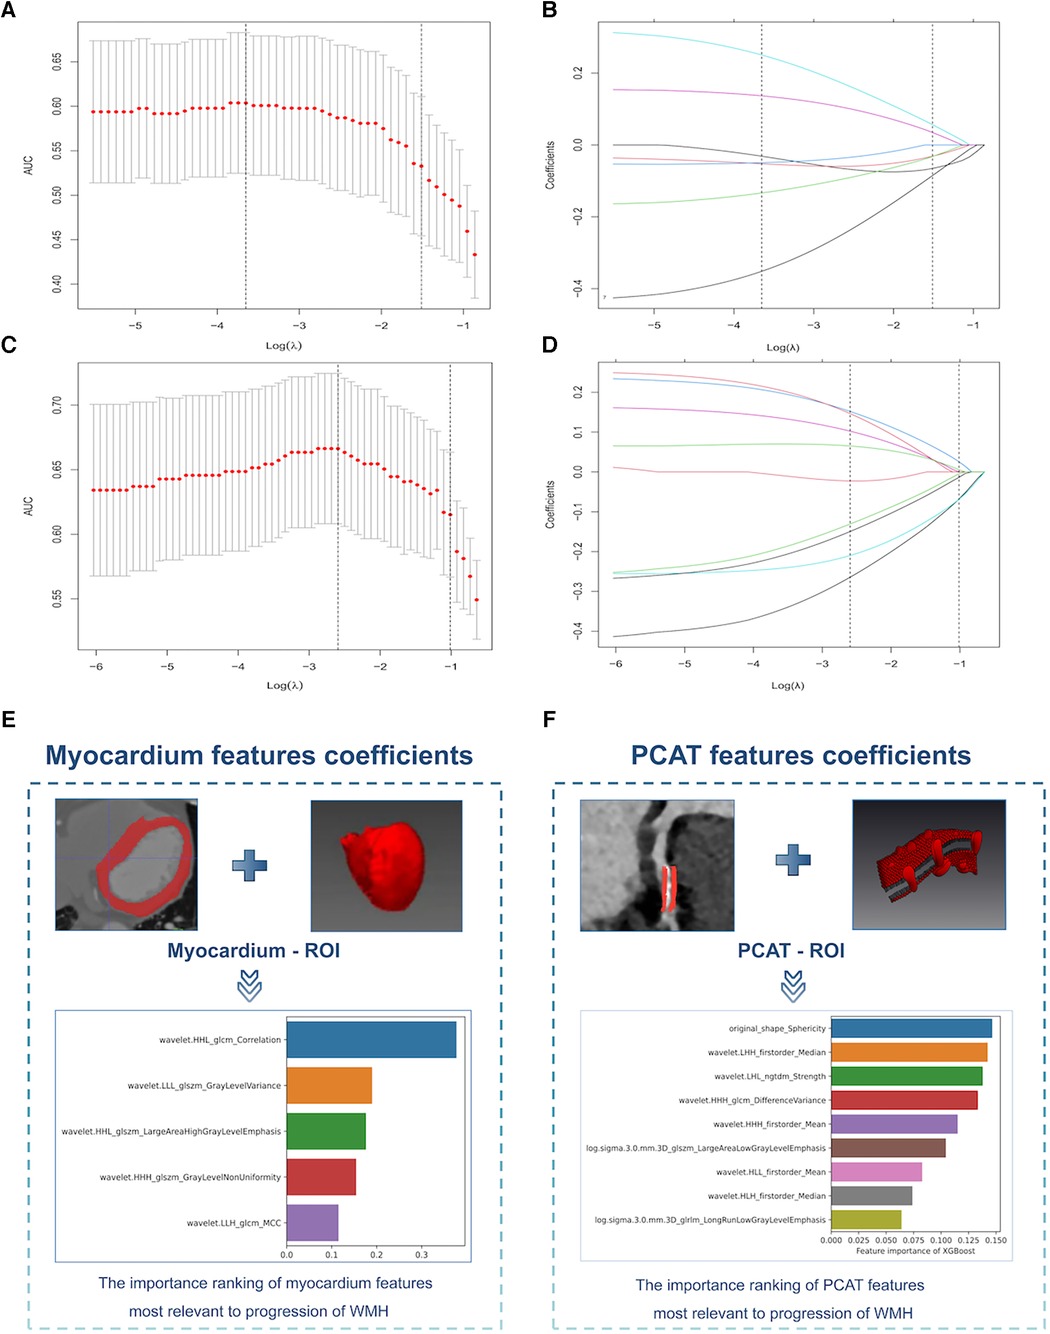
Figure 4. Selection of myocardium and PCAT radiomics signatures for the prediction models. (A,C) Myocardium (top) and PCAT (bottom) signatures selection by Elastic Net Regression with the optimal penalization coefficient lambda (λ) using 10-fold cross-validation and the minimal criteria process. The x-axis shows Lambda (λ), and the y-axis shows the model AUC. (B,D) Elastic Net Regression coefficient profiles of the myocardium signatures (top) and PCAT signatures (bottom). (E,F) Importance ranking of the myocardium signatures (left) and PCAT signatures (right) that had the greatest correlations with WMH progression. PCAT, pericoronary adipose tissue, WMH, white matter hyperintensity.
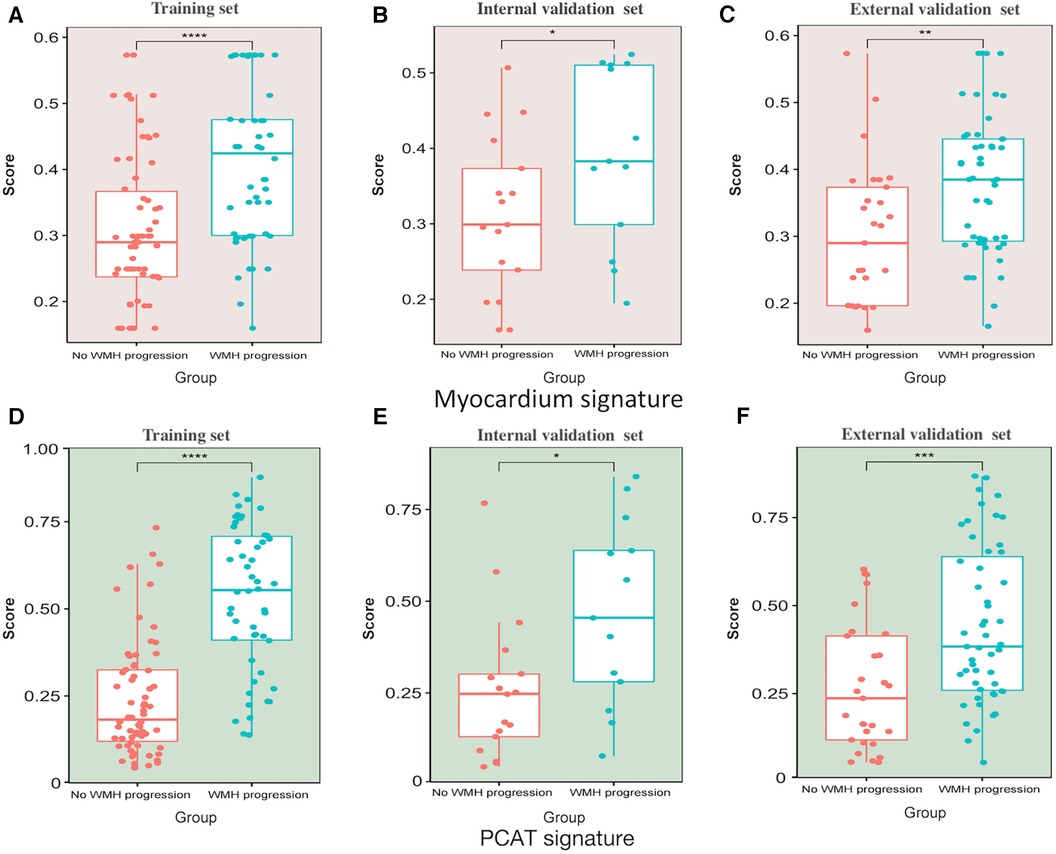
Figure 5. Scatter box plot of radiomics signatures scores. (A–C) Myocardium signatures radiomics scores in the “WMH progression” group and the “no WMH progression” group in the training set, internal validation set and external validation set. (D–F) PCAT signatures radiomics scores in the “WMH progression” group and the “no WMH progression” group in training set, internal validation set and external validation set. The horizontal line in the box represents the median of the signatures score, the upper and lower borders of the box represent the upper and lower quartiles of signatures score, and the scattered points around the box represent the distribution position of each radiomics signatures score. PCAT, pericoronary adipose tissue; WMH, white matter hyperintensity. *Represents p < 0.05, **represents p < 0.01, *** represents p < 0.001, and ***represents p < 0.0001.
The results demonstrated that CT-FFR, pFAI, PCAT and myocardium radiomics scores were independent predictors of WMH progression (all p < 0.05, Table 2).
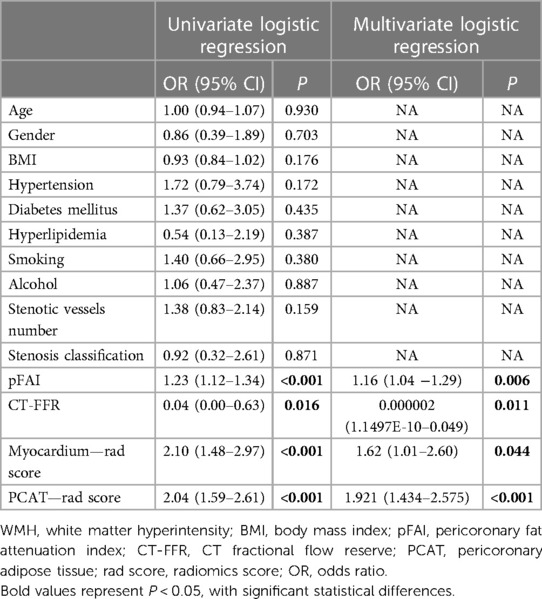
Table 2. Independent predictors of WMH progression based on logistic regression analysis.
After comparing different machine learning algorithms, we constructed a hybrid model using the XGBoost algorithm based on CT-FFR, pFAI, PCAT and myocardium radiomics scores. The weight scores of each independent predictors in the hybrid model were shown in a nomogram (Figure 6). To verify the accuracy of hybrid model, we plotted calibration curves and assessed the goodness of fit of the hybrid model. The results showed that the predictions of hybrid model were highly consistent with the observed values. The nonparametric test showed that prediction efficiency was not statistically different for the training set, internal validation set and external validation set (Figures 7A–C; p < 0.05). We observed significant differences between the “WMH progression” group and the “no WMH progression” group by assessing the predictive ability of hybrid model in the training, internal validation and external validation set (Figures 7D–F).
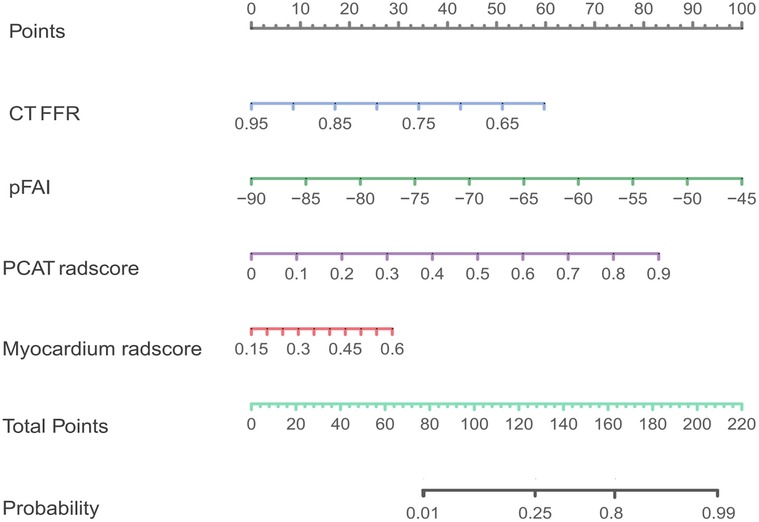
Figure 6. The variables included in the hybrid model are presented as a nomogram.
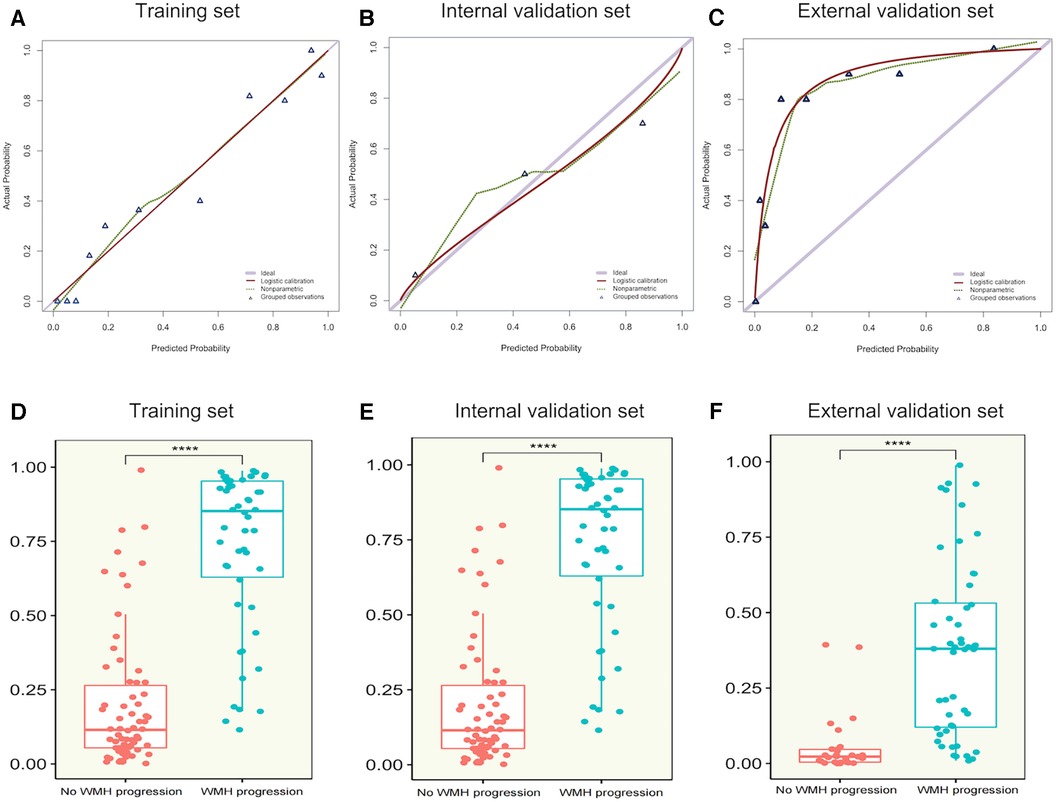
Figure 7. (A–C) calibration curves of hybrid model for WMH progression in the training set, internal validation set and external validation set. The x-axis represents the predicted probability of WMH progression estimated by the nomogram, and the y-axis represents the actual WMH progress probability. The red solid line represents logistic regression calibration, and the green dashed line represents nonparametric testing. The closer the red solid fit to the green dashed, the higher the accuracy of nomogram for predicting WMH progression. The triangle represents the grouped observations. (D–F) The predictive probability of the hybrid model in the “WMH progression” group and the “no WMH progression” group in the training set, internal validation set and external validation set. The horizontal line in the box represents the median of the predictive probability, the upper and lower borders of the box represent the upper and lower quartiles of predictive probability, and the scattered points around the box represent the distribution position of predictive probability. CT-FFR, CT fractional flow reserve; pFAI, pericoronary fat attenuation index; PCAT, pericoronary adipose tissue; radscore, radiomics score. *Represents p < 0.05, ** represents p < 0.01, ***represents p < 0.001, and ***represents p < 0.0001.
We also built unitary models based on the CCTA-derived markers and radiomics signatures in sequence. Analysis of the external validation set demonstrated that the pFAI had greater performance than the CT-FFR for predicting WMH progression (AUC: 0.762 [95% CI: 0.651–0.863] vs. 0.682 [95% CI: 0.547–0.799]; p < 0.05). Comparing the two radiomics signatures showed that the PCAT signatures had a slightly higher AUC value than myocardial signatures [AUC: 0.731 (95% CI: 0.603–0.838) vs. 0.711, 95% CI: 0.584–0.822]; p > 0.05) (Figures 8A–C). Then, we found that the hybrid model with all parameters can show the optimal prediction performance in the training set, internal validation set and external validation set (AUC: 0.918 [95% CI: 0.862–0.963, 0.846 [95% CI: 0.693–0.957 and 0.893 [95% CI: 0.815–0.956) (Figures 8A–C). Based on the DeLong test, we found significant differences between the hybrid model and unitary models (p < 0.001). The hybrid model also had high accuracy, sensitivity and specificity in the training, internal validation and external validation set (Table 3). Furthermore, DCA showed that the hybrid model provided more net benefit than the “all treatment” or “no treatment” options in the training, internal validation and external validation set (Figures 8D–F). When the high risk threshold was less than 0.82 (internal validation set) and 0.84 (external validation set), the hybrid model had a greater net benefit than other models.
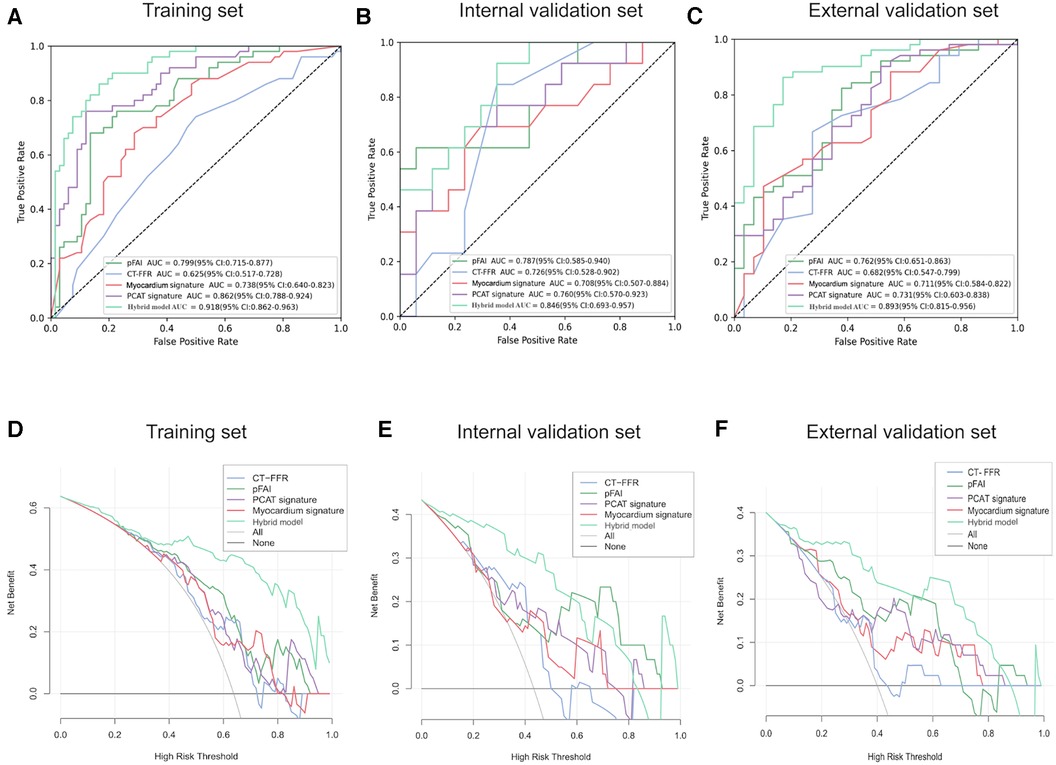
Figure 8. Diagnostic performance of different models in predicting WMH progression. (A–C) ROC curves for different models for prediction of WMH progression in the training set, internal validation set and external validation set. (D–F) DCA of different models from the training set, internal validation set and external validation set. The horizontal black line indicates the net benefit assuming that no patients have WMH progression and the smooth gray line indicates the net benefit assuming that all patients have WMH progression. PCAT, pericoronary adipose tissue; pFAI, pericoronary fat attenuation index; CT-FFR, CT fractional flow reserve; ROC, receiver operating characteristic; DCA, decision curve analysis.
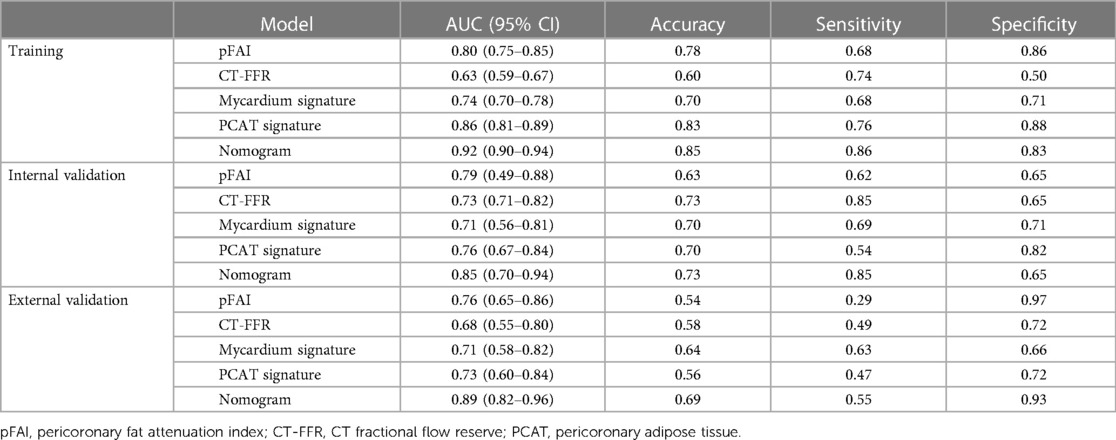
Table 3. The diagnostic performance of different models.
We compared the predictive performance of PCAT and mycocardium radiomics signatures by using different machine learning algorithms, and constructed a hybrid model for comprehensive comparison with pFAI, CT-FFR and radiomics signatures. The results indicate that CCTA-derived markers and radiomics signatures can effectively predict the WMH progression. The occurrence and progress of WMH can lead to a series of subsequent degenerative diseases such as fiber demyelination and cortical damage (45). These changes can cause irreversible damage to the microstructure of the brain and, to a certain extent, have certain indicators of poor prognosis for patients (46). An early analysis based on the UK Biobank suggested that lower left ventricular (LV) ejection fraction was associated with brain structural abnormalities such as lower gray matter volume and greater WMH volume (47). In fact, many vascular risk factors, including smoking, hypertension, diabetes, obesity and lack of exercise, have been proved to be related to poor performance in brain (48). Among cardiovascular risk factors, hypertension has a stronger correlation with WMH and may damage brain microcirculation (49). Another report from the Framingham cohort study also suggested that hypertension and smoking were associated with higher WMH burden (50). In a large Chinese cohort of 4,683 subjects, it was found that high low density lipoprotein (LDL) cholesterol was associated with high WMH (51). Therefore, it is essential to implement appropriate interventions that control vascular risk factors to prevent WMH progression, such as timely control of hypertension and dyslipidemia (16, 52). In CAD, pFAI is a marker of coronary arteritis and CT-FFR is an imaging marker of defective hemodynamics. The co-occurrence of inflammation and diminished blood perfusion has unique pathophysiological effects in the development of cerebrovascular diseases (53–55). Research has shown that poorer LV function and decreased arterial compliance were closely related to adverse brain characteristics, which can provide a research basis for the theory of vascular hypoperfusion, which is closely related to cerebral hypoperfusion and microvascular plaque accumulation (15). Our study showed that the pFAI had greater predictive value than the CT-FFR, suggesting a hidden inflammatory pathway between the cardio-cerebral diseases. This result is consistent with the interpretation of Moroni et al. (12), who concluded these two microcirculatory diseases were pathogenically connected. In fact, some common pathophysiological features of the brain and heart, such as inflammation theory and blood flow perfusion, may be mainly related to the vascular function of the two organ systems. There is indeed a certain comorbidity mechanism between the two diseases in terms of inflammation and blood flow perfusion.
Vascular lesions may cause multiple myocardial changes such as myocardial ischemia, decreased myocardial flow, and changes in myocardial contractile function, followed by indirect changes in some pathogenic pathways between the heart and brain (12, 56, 57). The pFAI can reflect perivascular inflammation and cardiovascular disease (18). However, the pFAI is only based on voxel intensity and does not consider the complex relationships among voxels (31). The key difference between machine learning algorithms and traditional methods was that machine learning algorithms can learn from observations, enabling perform the mapping from features to labels at the image level and create a model that can summarize information into a new, previously unseen inputs (58). Therefore, we used radiomics to extract quantitative information and then selected radiomics signatures that were related to the clinical results to build prediction models by different algorithms (59). After comparing the two kinds of radiomics signatures, the PCAT signatures were better than the myocardium signatures in predicting WMH progression, and the Xgboost algorithm showed superior predictive performance. When comparing CCTA-derived markers and radiomics signatures, we found that the PCAT signatures and pFAI both have similar performance in predicting WMH progression, both higher than myocardium signatures and CT-FFR.
Shu et al. previously predicted the progression of any WMH, periventricular WMH, and deep WMH using radiomics signatures (AUC: 0.714 [any WMH], 0.697 [periventricular WHH], and 0.717 [deep WMH]. By comparing the predictive effects of different signatures on WHH progression, we found that the predictive efficiency of radiomics features extracted from the entire white matter of the brain was higher than that extracted from the entire myocardium [AUC: 0.0.717 (95% CI: 0.603–0.838) vs. 0.711, 95% CI: 0.584–0.822]), but when compared with the PCAT signatures, the PCAT signatures showed a higher predictive ability [AUC: 0.731 (95% CI: 0.603–0.838)] for predicting WMH progression. Our study is the first to show that PCAT can be used to predict WMH progression. The another major innovation is the demonstration that a hybrid model constructed by CCTA was a tool for identifying WMH progression. In addition, we found that the pFAI was a better predictor of WMH progression than the CT-FFR, and the results suggested that heart-related inflammatory changes are more sensitive indicators of changes in WMH than hemodynamic markers. Another study that examined predictors of myocardial ischemia also found a difference between these two markers (60).
There are also many indicators that play an important role in reflecting perivascular inflammation and cardiovascular disease. Hypersensitive C-reactive protein (hs-CRP), which is currently a representative biomarker for detecting inflammation in CAD (61). hs-CRP mediated chronic inflammation is an independent predictor of coronary microvascular dysfunction in patients with ischemic heart disease (62). In addition, vulnerable plaques, as a characteristic inflammatory process of damage and anti-damage, are also closely related to vascular inflammation. Furthermore, there are also many factors related to cardiovascular disease. For example, indicators such as calcified plaque score, degree of luminal stenosis, and left ventricular ejection fraction (LVEF) all have a suggestive effect on cardiovascular risk factors (63, 64). There are also some basic physical indicators that are cardiovascular related risk factors. For example, obesity induces the aggregation of macrophages into perivascular adipose tissue, inhibits the release of vasodilators such as hydrogen sulfide from endothelial cells and smooth muscle cells, and can affect coronary microvascular dilation function, leading to cardiovascular disease (65). On the other hand, aging is also one of the important risk factors for cardiovascular diseases (66). Therefore, it is not enough for us to focus solely on exploring WMH progression based on two imaging markers obtained from CCTA, and further joint evaluation of multiple related factors is needed. In addition, as the impact of cerebral blood flow perfusion on WMH is crucial, we should further explore the correlation between cerebral blood flow perfusion and WMH.
Our study also had certain limitations. First, the population included in our study was relatively small. However, there was no significant difference in sample size between the WMH progression and no-WMH progression group in our study population, so the results had reference significance. Secondly, our determination of WMH progression was based on measurements at two time points. Ideally, this assessment should be based on many measurements over time. In addition, the time interval between two brain MRI examinations was determined to be no less than 6 months, which may have a certain bias in the evaluation of WMH progression due to the short interval time. Regardless, the hybrid model captured the presence of a pathogenic pathway. Thirdly, there were inevitably some biases in the semi-automatic segmentation and volume calculation of WMH using MATLAB software. However, all results were evaluated and corrected by physicians, and the method of obtaining WMH volume using MATLAB has been used multiple times in some other WMH related studies (29, 67). Therefore, the calculation of WMH volume in our study has some reliability. Finally, we used deep learning software and machine learning methods to build models. So it still needed some time to be promoted and applied in clinical practice.
The CCTA-derived markers and radiomics signatures were reliable indicators for predicting WMH progression. We found that the pFAI was superior to the CT-FFR, and the PCAT signatures was superior to the mycocardium signatures for predicting WMH progression. A hybrid model combining pFAI, CT-FFR, and radiomics features is a potential use for identifying patients with WMH progression in elder coronary heart disease populaiton.
The original contributions presented in the study are included in the article/Supplementary Material, further inquiries can be directed to the corresponding author.
The studies involving humans were approved by Institutional Review Board of the Zhejiang Provincial People's Hospital and Hangzhou TCM Hospital. The studies were conducted in accordance with the local legislation and institutional requirements. The participants provided their written informed consent to participate in this study.
JH: Writing – original draft. HJ: Conceptualization, Writing – original draft. YZ: Data curation, Writing – original draft. YX: Funding acquisition, Writing – original draft. FC: Investigation, Writing – original draft. XQ: Investigation, Writing – original draft. LH: Formal Analysis, Methodology, Writing – original draft. ZY: Project administration, Resources, Software, Writing – original draft. GZ: Formal Analysis, Investigation, Software, Writing – original draft. JP: Investigation, Methodology, Software, Writing – original draft. ZS: Supervision, Validation, Writing – review & editing. XG: Supervision, Validation, Writing – review & editing.
The author(s) declare financial support was received for the research, authorship, and/or publication of this article. This study was supported by grants from Health Commission for Zhejiang Province (2020KY402) and key Research and Development Project of Zhejiang Province (2020C01058).
The authors thank all of the participants, coordinators, and administrators for their support and help during the research.
The authors declare that the research was conducted in the absence of any commercial or financial relationships that could be construed as a potential conflict of interest.
All claims expressed in this article are solely those of the authors and do not necessarily represent those of their affiliated organizations, or those of the publisher, the editors and the reviewers. Any product that may be evaluated in this article, or claim that may be made by its manufacturer, is not guaranteed or endorsed by the publisher.
The Supplementary Material for this article can be found online at: https://www.frontiersin.org/articles/10.3389/fcvm.2023.1282768/full#supplementary-material
1. Wardlaw JM, Smith EE, Biessels GJ, Cordonnier C, Fazekas F, Frayne R, et al. Neuroimaging standards for research into small vessel disease and its contribution to ageing and neurodegeneration. Lancet Neurol. (2013) 12:822–38. doi: 10.1016/S1474-4422(13)70124-8
2. Wardlaw JM, Smith C, Dichgans M. Mechanisms of sporadic cerebral small vessel disease: insights from neuroimaging. Lancet Neurol. (2013b) 12:483–97. doi: 10.1016/S1474-4422(13)70060-7
3. Valdés Hernández Mdel C, Armitage PA, Thrippleton MJ, Chappell F, Sandeman E, Muñoz Maniega S, et al. Rationale, design and methodology of the image analysis protocol for studies of patients with cerebral small vessel disease and mild stroke. Brain Behav. (2015) 26:e00415. doi: 10.1002/brb3.415
4. Wardlaw JM, Chappell FM, Valdés Hernández MDC, Makin SDJ, Staals J, Shuler K, et al. White matter hyperintensity reduction and outcomes after minor stroke. Neurology. (2017) 89:1003–10. doi: 10.1212/WNL.0000000000004328
5. Van Leijsen EMC, de Leeuw FE, Tuladhar AM. Disease progression and regression in sporadic small vessel disease-insights from neuroimaging. Clin Sci (Lond). (2017) 131:1191–206. doi: 10.1042/CS20160384
6. Maillard P, Fletcher E, Harvey D, Carmichael O, Reed B, Mungas D, et al. White matter hyperintensity penumbra. Stroke. (2011) 42:1917–22. doi: 10.1161/STROKEAHA.110.609768
7. Gardener H, Wright CB, Rundek T, Sacco RL. Brain health and shared risk factors for dementia and stroke. Nat Rev Neurol. (2015) 11:651–7. doi: 10.1038/nrneurol.2015.195
8. Broce IJ, Tan CH, Fan CC, Jansen I, Savage JE, Witoelar A, et al. Dissecting the genetic relationship between cardiovascular risk factors and Alzheimer’s disease. Acta Neuropathol. (2019) 137:209–26. doi: 10.1007/s00401-018-1928-6
9. Zhao B, Li T, Fan Z, Yang Y, Shu J, Yang X, et al. Heart-brain connections: phenotypic and genetic insights from magnetic resonance images. Science. (2023) 380:abn6598. doi: 10.1126/science.abn6598
10. Johansen MC, Gottesman RF, Kral BG, Vaidya D, Yanek LR, Becker LC, et al. Association of coronary artery atherosclerosis with brain white matter hyperintensity. Stroke. (2021) 52:2594–600. doi: 10.1161/STROKEAHA.120.032674
11. GBD 2016 DALYs and HALE Collaborators. Global, regional, and national disability-adjusted life-years (DALYs) for 333 diseases and injuries and healthy life expectancy (HALE) for 195 countries and territories, 1990-2016: a systematic analysis for the global burden of disease study 2016. Lancet (2017) 390:1260–344. doi: 10.1016/S0140-6736(17)32130-X
12. Moroni F, Ammirati E, Hainsworth AH, Camici PG. Association of white matter hyperintensities and cardiovascular disease: the importance of microcirculatory disease. Circ Cardiovasc Imaging. (2020) 13:e010460. doi: 10.1161/CIRCIMAGING.120.010460
13. Taylor-Bateman V, Gill D, Georgakis M, Malik R, Munroe P, Traylor M; International Consortium of Blood Pressure (ICBP). Cardiovascular risk factors and MRI markers of cerebral small vessel disease: a mendelian randomization study. Neurology. (2021) 10.1212/WNL.0000000000013120. doi: 10.1212/WNL.0000000000013120
14. Wardlaw JM, Valdés Hernández MC, Muñoz-Maniega S. What are white matter hyperintensities made of? Relevance to vascular cognitive impairment. J Am Heart Assoc. (2015) 4:001140. doi: 10.1161/JAHA.114.001140
15. McCracken C, Raisi-Estabragh Z, Veldsman M, Raman B, Dennis A, Husain M, et al. Multi-organ imaging demonstrates the heart-brain-liver axis in UK biobank participants. Nat Commun. (2022) 21:7839. doi: 10.1038/s41467-022-35321-2
16. Moroni F, Ammirati E, Rocca MA, Filippi M, Magnoni M, Camici PG. Cardiovascular disease and brain health: focus on white matter hyperintensities. Int J Cardiol Heart Vasc. (2018) 19:63–9. doi: 10.1016/j.ijcha.2018.04.006
17. Oikonomou EK, West HW, Antoniades C. Cardiac computed tomography: assessment of coronary inflammation and other plaque features. Arterioscler Thromb Vasc Biol. (2019) 39:2207–19. doi: 10.1161/ATVBAHA.119.312899
18. Antonopoulos AS, Sanna F, Sabharwal N, Thomas S, Oikonomou EK, Herdman L, et al. Detecting human coronary inflammation by imaging perivascular fat. Sci Transl Med. (2017) 12:eaal2658. doi: 10.1126/scitranslmed.aal2658
19. Ross R. Atherosclerosis–an inflammatory disease. N Engl J Med. (1999) 340:115–26. doi: 10.1056/NEJM199901143400207
20. Bos D, Vernooij MW, Elias-Smale SE, Verhaaren BF, Vrooman HA, Hofman A, et al. Atherosclerotic calcification relates to cognitive function and to brain changes on magnetic resonance imaging. Alzheimers Dement. (2012) 8:104–11. doi: 10.1016/j.jalz.2012.01.008
21. Vavere AL, Arbab-Zadeh A, Rochitte CE, Dewey M, Niinuma H, Gottlieb I, et al. Coronary artery stenoses: accuracy of 64-detector row CT angiography in segments with mild, moderate, or severe calcification–a subanalysis of the CORE-64 trial. Radiology. (2011) 261:100–8. doi: 10.1148/radiol.11110537
22. Chen CC, Chen CC, Hsieh IC, Liu YC, Liu CY, Chan T, et al. The effect of calcium score on the diagnostic accuracy of coronary computed tomography angiography. Int J Cardiovasc Imaging. (2011) 27:37–42. doi: 10.1007/s10554-011-9955-6
23. Dharampal AS, Rossi A, de Feyter PJ. Computed tomography-coronary angiography in the detection of coronary artery disease. J Cardiovasc Med (Hagerstown). (2011) 12(8):554–61. doi: 10.2459/JCM.0b013e32834905dc
24. Zimmermann FM, Ferrara A, Johnson NP, van Nunen LX, Escaned J, Albertsson P, et al. Deferral vs. performance of percutaneous coronary intervention of functionally non-significant coronary stenosis: 15-year follow-up of the DEFER trial. Eur Heart J. (2015) 36:3182–8. doi: 10.1093/eurheartj/ehv452
25. Min JK, Taylor CA, Achenbach S, Koo BK, Leipsic J, Nørgaard BL, et al. Noninvasive fractional flow reserve derived from coronary CT angiography: clinical data and scientific principles. JACC Cardiovasc Imaging. (2015) 8:1209–22. doi: 10.1016/j.jcmg.2015.08.006
26. Zhuang B, Wang S, Zhao S, Lu M. Computed tomography angiography-derived fractional flow reserve (CT-FFR) for the detection of myocardial ischemia with invasive fractional flow reserve as reference: systematic review and meta-analysis. Eur Radiol. (2020) 30:712–25. doi: 10.1007/s00330-019-06470-8
27. Yip SS, Aerts HJ. Applications and limitations of radiomics. Phys Med Biol. (2016) 61:R150–66. doi: 10.1088/0031-9155/61/13/R150
28. Sun H, Chen Y, Huang Q, Lui S, Huang X, Shi Y, et al. Psychoradiologic utility of MR imaging for diagnosis of attention deficit hyperactivity disorder: a radiomics analysis. Radiology. (2018) 287:620–30. doi: 10.1148/radiol.2017170226
29. Shu Z, Xu Y, Shao Y, Pang P, Gong X. Radiomics from magnetic resonance imaging may be used to predict the progression of white matter hyperintensities and identify associated risk factors. Eur Radiol. (2020) 30:3046–58. doi: 10.1007/s00330-020-06676-1
30. Rauseo E, Izquierdo Morcillo C, Raisi-Estabragh Z, Gkontra P, Aung N, Lekadir K, et al. New imaging signatures of cardiac alterations in ischaemic heart disease and cerebrovascular disease using CMR radiomics. Front Cardiovasc Med. (2021) 8:716577. doi: 10.3389/fcvm.2021.716577
31. Lin A, Kolossváry M, Yuvaraj J, Cadet S, McElhinney PA, Jiang C, et al. Myocardial infarction associates with a distinct pericoronary adipose tissue radiomic phenotype: a prospective case-control study. JACC Cardiovasc Imaging. (2020) 13:2371–83. doi: 10.1016/j.jcmg.2020.06.033
32. Cho AH, Kim HR, Kim W, Yang DW. White matter hyperintensity in ischemic stroke patients: it may regress over time. J Stroke. (2015) 17:60–6. doi: 10.5853/jos.2015.17.1.60
33. Emond M, Mock MB, Davis KB, Fisher LD, Holmes DR Jr, Chaitman BR, et al. Long-term survival of medically treated patients in the coronary artery surgery study (CASS) registry. Circulation. (1994) 90:2645–57. doi: 10.1161/01.cir.90.6.2645
34. Gensini GG. A more meaningful scoring system for determining the severity of coronary heart disease. Am J Cardiol. (1983) 51:606. doi: 10.1016/s0002-9149(83)80105-2
35. Zhang R, Ju Z, Li Y, Gao Y, Gu H, Wang X. Pericoronary fat attenuation index is associated with plaque parameters and stenosis severity in patients with acute coronary syndrome: a cross-sectional study. J Thorac Dis. (2022) 14:4865–76. doi: 10.21037/jtd-22-1536
36. Yuki H, Sugiyama T, Suzuki K, Kinoshita D, Niida T, Nakajima A, et al. Coronary inflammation and plaque vulnerability: a coronary computed tomography and optical coherence tomography study. Circ Cardiovasc Imaging. (2023) 16:e014959. doi: 10.1161/CIRCIMAGING.122.014959
37. Si N, Shi K, Li N, Dong X, Zhu C, Guo Y, et al. Identification of patients with acute myocardial infarction based on coronary CT angiography: the value of pericoronary adipose tissue radiomics. Eur Radiol. (2022) 32:6868–77. doi: 10.1007/s00330-022-08812-5
38. Dissaux G, Visvikis D, Da-Ano R, Pradier O, Chajon E, Barillot I, et al. Pretreatment 18F-FDG PET/CT radiomics predict local recurrence in patients treated with stereotactic body radiotherapy for early-stage non-small cell lung cancer: a multicentric study. J Nucl Med. (2020) 61:814–20. doi: 10.2967/jnumed.119.228106
39. Wu J, Aguilera T, Shultz D, Gudur M, Rubin DL, Loo BW Jr, et al. Early-stage non-small cell lung cancer: quantitative imaging characteristics of (18)F fluorodeoxyglucose PET/CT allow prediction of distant metastasis. Radiology. (2016) 281:270–8. doi: 10.1148/radiol.2016151829
40. Wang QQ, Yu SC, Qi X, Hu YH, Zheng WJ, Shi JX, et al. Overview of logistic regression model analysis and application. Zhonghua Yu Fang Yi Xue Za Zhi. (2019) 6:955–60. doi: 10.3760/cma.j.issn.0253-9624.2019.09.018
41. Winters-Hilt S, Merat S. SVM Clustering. BMC Bioinformatics. (2007) 8 Suppl 7(Suppl 7):S18. doi: 10.1186/1471-2105-8-S7-S18
42. Mantero A, Ishwaran H. Unsupervised random forests. Stat Anal Data Min. (2021) 14:144–67. doi: 10.1002/sam.11498
43. Geva S, Sitte J. Adaptive nearest neighbor pattern classification. IEEE Trans Neural Netw. (1991) 2:318–22. doi: 10.1109/72.80344
44. DeLong ER, DeLong DM, Clarke-Pearson DL. Comparing the areas under two or more correlated receiver operating characteristic curves: a nonparametric approach. Biometrics. (1988) 44:837–45. doi: 10.2307/2531595
45. Maniega SM, Valdés Hernández MC, Clayden JD, Royle NA, Murray C, Morris Z, et al. White matter hyperintensities and normal-appearing white matter integrity in the aging brain. Neurobiol Aging. (2015) 36:909–18. doi: 10.1016/j.neurobiolaging.2014.07.048
46. Hu HY, Ou YN, Shen XN, Qu Y, Ma YH, Wang ZT, et al. White matter hyperintensities and risks of cognitive impairment and dementia: a systematic review and meta-analysis of 36 prospective studies. Neurosci Biobehav Rev. (2021) 120:16–27. doi: 10.1016/j.neubiorev.2020.11.007
47. van Hout MJP, Dekkers IA, Westenberg JJM, Schalij MJ, Scholte AJHA, Lamb HJ. Associations between left ventricular function, vascular function and measures of cerebral small vessel disease: a cross-sectional magnetic resonance imaging study of the UK biobank. Eur Radiol. (2021) 31:5068–76. doi: 10.1007/s00330-020-07567-1
48. Yano Y, Bakris GL, Inokuchi T, Ohba Y, Tamaki N, Nagata M, et al. Association of cognitive dysfunction with cardiovascular disease events in elderly hypertensive patients. J Hypertens. (2014) 32:423–31. doi: 10.1097/HJH.0000000000000025
49. Strassburger TL, Lee HC, Daly EM, Szczepanik J, Krasuski JS, Mentis MJ, et al. Interactive effects of age and hypertension on volumes of brain structures. Stroke. (1997) 28:1410–7. doi: 10.1161/01.str.28.7.1410
50. Jeerakathil T, Wolf PA, Beiser A, Massaro J, Seshadri S, D'Agostino RB, et al. Stroke risk profile predicts white matter hyperintensity volume: the Framingham study. Stroke. (2004) 35:1857–61. doi: 10.1161/01.STR.0000135226.53499.85
51. Lin Q, Huang WQ, Ma QL, Lu CX, Tong SJ, Ye JH, et al. Incidence and risk factors of leukoaraiosis from 4683 hospitalized patients: a cross-sectional study. Medicine (Baltimore). (2017) 96:e7682. doi: 10.1097/MD.0000000000007682
52. Godin O, Tzourio C, Maillard P, Mazoyer B, Dufouil C. Antihypertensive treatment and change in blood pressure are associated with the progression of white matter lesion volumes: the three-city (3C)-Dijon magnetic resonance imaging study. Circulation. (2011) 123:266–73. doi: 10.1161/CIRCULATIONAHA.110.961052
53. Nomura CH, Assuncao AN Jr, Guimarães PO, Liberato G, Morais TC, Fahel MG, et al. Association between perivascular inflammation and downstream myocardial perfusion in patients with suspected coronary artery disease. Eur Heart J Cardiovasc Imaging. (2020) 21:599–605. doi: 10.1093/ehjci/jeaa023
54. Camici PG, Crea F. Coronary microvascular dysfunction. N Engl J Med. (2007) 356:830–40. doi: 10.1056/NEJMra061889
55. Ihdayhid AR, Sakaguchi T, Linde JJ, Sørgaard MH, Kofoed KF, Fujisawa Y, et al. Performance of computed tomography-derived fractional flow reserve using reduced-order modelling and static computed tomography stress myocardial perfusion imaging for detection of haemodynamically significant coronary stenosis. Eur Heart J Cardiovasc Imaging. (2018) 19:1234–43. doi: 10.1093/ehjci/jey114
56. Mejia-Renteria H, Travieso A, Matías-Guiu JA, Yus M, Espejo-Paeres C, Finocchiaro F, et al. Coronary microvascular dysfunction is associated with impaired cognitive function: the cerebral-coronary connection study (C3 study). Eur Heart J. (2023) 44:113–25. doi: 10.1093/eurheartj/ehac521
57. Echavarria-Pinto M, Escaned J, Macías E, Medina M, Gonzalo N, Petraco R, et al. Disturbed coronary hemodynamics in vessels with intermediate stenoses evaluated with fractional flow reserve: a combined analysis of epicardial and microcirculatory involvement in ischemic heart disease. Circulation. (2013) 128:2557–66. doi: 10.1161/CIRCULATIONAHA.112.001345
58. Deo RC. Machine learning in medicine. Circulation. (2015) 17:1920–30. doi: 10.1161/CIRCULATIONAHA.115.001593
59. Kolossváry M, Kellermayer M, Merkely B, Maurovich-Horvat P. Cardiac computed tomography radiomics: a comprehensive review on radiomic techniques. J Thorac Imaging. (2018) 33:26–34. doi: 10.1097/RTI.0000000000000268
60. Hou J, Zheng G, Han L, Shu Z, Wang H, Yuan Z, et al. Coronary computed tomography angiography imaging features combined with computed tomography-fractional flow reserve, pericoronary fat attenuation index, and radiomics for the prediction of myocardial ischemia. J Nucl Cardiol. (2023) 30:1838–50. doi: 10.1007/s12350-023-03221-7
61. Inoue N. Vascular C-reactive protein in the pathogenesis of coronary artery disease: role of vascular inflammation and oxidative stress. Cardiovasc Hematol Disord Drug Targets. (2006) 6:227–31. doi: 10.2174/187152906779010719
62. Pang H, Han B, Li ZY, Fu Q. Identification of molecular markers in patients with hypertensive heart disease accompanied with coronary artery disease. Genet Mol Res. (2015) 14:93–100. doi: 10.4238/2015.January.15.12
63. Shang J, Ma S, Guo Y, Yang L, Zhang Q, Xie F, et al. Prediction of acute coronary syndrome within 3 years using radiomics signature of pericoronary adipose tissue based on coronary computed tomography angiography. Eur Radiol. (2022) 32:1256–66. doi: 10.1007/s00330-021-08109-z
64. Chen YY, Chung FP, Lin YJ, Chien KL, Chang WT. Exploring the risk factors of sudden cardiac death using an electrocardiography and medical ultrasonography for the general population without a history of coronary artery disease or left ventricular ejection fraction <35% and aged >35 years- a novel point-based prediction model based on the chin-shan community cardiovascular cohort. Circ J. (2022) 87:139–49. doi: 10.1253/circj.CJ-22-0322
65. Jahangir E, De Schutter A, Lavie CJ. The relationship between obesity and coronary artery disease. Transl Res. (2014) 164:336–44. doi: 10.1016/j.trsl.2014.03.010
66. Izzo C, Carrizzo A, Alfano A, Virtuoso N, Capunzo M, Calabrese M, et al. The impact of aging on cardio and cerebrovascular diseases. Int J Mol Sci. (2018) 19:481. doi: 10.3390/ijms19020481
Keywords: CT-fractional flow reserve, pericoronary fat attenuation index, white matter hyperintensity, radiomics, machine learning
Citation: Hou J, Jin H, Zhang Y, Xu Y, Cui F, Qin X, Han L, Yuan Z, Zheng G, Peng J, Shu Z and Gong X (2023) Hybrid model of CT-fractional flow reserve, pericoronary fat attenuation index and radiomics for predicting the progression of WMH: a dual-center pilot study. Front. Cardiovasc. Med. 10:1282768. doi: 10.3389/fcvm.2023.1282768
Received: 25 August 2023; Accepted: 27 November 2023;
Published: 19 December 2023.
Edited by:
Julian A. Luetkens, University Hospital Bonn, GermanyReviewed by:
Xiaochang Leng, ArteryFlow Technology Co., Ltd, China© 2023 Hou, Jin, Zhang, Xu, Cui, Qin, Han, Yuan, Zheng, Peng, Shu and Gong. This is an open-access article distributed under the terms of the Creative Commons Attribution License (CC BY). The use, distribution or reproduction in other forums is permitted, provided the original author(s) and the copyright owner(s) are credited and that the original publication in this journal is cited, in accordance with accepted academic practice. No use, distribution or reproduction is permitted which does not comply with these terms.
*Correspondence: Xiangyang Gong Z29uZy54eUB2aXAuMTYzLmNvbQ==
†These authors have contributed equally to this work
Abbreviations AUC, area under the curve; CAD, coronary arterial disease; CCTA, coronary computed tomography angiography; CT-FFR, CT-fractional flow reserve; DCA, decision curve analysis; pFAI, pericoronary fat attenuation index; ROC, receiver operating characteristic; WMH, white matter hyperintensity.
‡ORCID Jie Hou orcid.org/0009-0005-4009-1933 Hui Jin orcid.org/0009-0002-9414-6352 Yongsheng Zhang orcid.org/0000-0002-5827-8967 Yuyun Xu orcid.org/0000-0003-2818-852X Feng Cui orcid.org/0000-0001-8452-591X Xue Qin orcid.org/0009-0002-2373-4421 Lu Han orcid.org/0009-0007-5264-5934 Zhongyu Yuan orcid.org/0009-0003-5959-1052 Guangying Zheng orcid.org/0009-0005-0560-4668 Jiaxuan Peng orcid.org/0000-0002-1455-1706 Zhenyu Shu orcid.org/0000-0002-7529-2357 Xiangyang Gong orcid.org/0000-0002-2785-3308
Disclaimer: All claims expressed in this article are solely those of the authors and do not necessarily represent those of their affiliated organizations, or those of the publisher, the editors and the reviewers. Any product that may be evaluated in this article or claim that may be made by its manufacturer is not guaranteed or endorsed by the publisher.
Research integrity at Frontiers
Learn more about the work of our research integrity team to safeguard the quality of each article we publish.