 Michael Randazzo
 Francesco Maffessanti
 Alekhya Kotta3
 Julia Grapsa
 Karima Addetia
- 1Department of Medicine, Section of Cardiology, University of Chicago Heart and Vascular Center, Chicago, IL, United States
- 2Maria Cecilia Hospital, GVM Care & Research, Cotignola, Italy
- 3Department of Internal Medicine, Baylor College of Medicine, Houston, TX, United States
- 4Department of Cardiology, Guys and St Thomas NHS Trust, London, United Kingdom
Recent inroads into percutaneous-based options for the treatment of tricuspid valve disease has brought to light how little we know about the behavior of the right ventricle in both health and disease and how incomplete our assessment of right ventricular (RV) physiology and function is using current non-invasive technology, in particular echocardiography. The purpose of this review is to provide an overview of what three-dimensional echocardiography (3DE) can offer currently to enhance RV evaluation and what the future may hold if we continue to improve the 3D evaluation of the right heart.
Introduction
The diagnostic and prognostic importance of RV size and function is being increasingly appreciated owing both to the advent of percutaneous procedures targeted to pathologies involving the right heart and the growing interest in prognostication of various disease states that compromise the RV (1). In spite of this, reliable, non-invasive assessment of RV size and function remains elusive.
Despite being the current reference standard for RV size and function assessment, cardiovascular magnetic resonance imaging (CMR) suffers from several critical drawbacks which prevent its ubiquitous use in the clinical space. These drawbacks include, high cost, limited availability, non-portability, dependence on patient cooperation as well as numerous key contraindications and relative contraindications. Echocardiography, therefore, remains the workhorse for initial cardiac evaluation; it is cost-effective, safe, widely accessible, portable and without contraindications. It can be flexibly incorporated across multiple clinical settings. Accurate, reproducible evaluation of the RV, however, with current two-dimensional echocardiography (2DE) techniques is hindered by its anatomical location in the anterior mediastinum, irregular crescentic geometry, complex mechanics, and asymmetric remodeling. Recent advancements in 3DE have helped overcome many of these limitations by avoiding the geometrical assumptions inherent to 2D size and function assessments (2). Using 3DE, a pyramidal dataset of the RV which contains all of the structural components of the chamber including the inflow, outflow, body and apex as well as the tricuspid and pulmonary valves is acquired (Figure 1). Access to this data enables comprehensive, quantitative volumetric analysis of the RV (3). RV volume and ejection fraction (RVEF) derived from 3D datasets have been shown to strongly correlate with measurements obtained with CMR as well as adverse cardiopulmonary outcomes (4–6). These findings have recently prompted considerable exploration into the potential utility of 3DE in a vast array of clinical applications. The objective of this review is to describe 3DE acquisition and analysis methods for the RV, summarize their established diagnostic and prognostic value, and outline potential novel utilities for 3D RV imaging on the horizon and for the future.
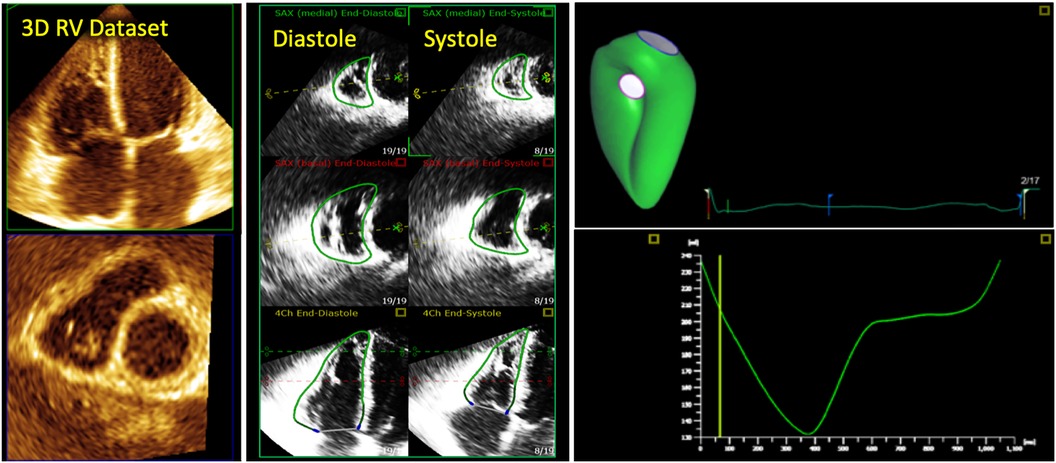
Figure 1. 3d echocardiographic analysis of the right ventricle. Far left, 3D dataset of the right ventricle depicting the apical four-chamber and short-axis planes using multi-planar reconstruction. Middle panel shows endocardial tracings overlying the diastolic and systolic phases of the 2D short and long-axis cut-planes obtained from the 3D right ventricular dataset. Far right, top panel shows the 3D endocardial rendered surface while bottom panel shows the volumes obtained after automated software analysis throughout the cardiac cycle.
2D echocardiography: analysis and limitations
2D echocardiographic evaluation of the RV requires integration of multiple imaging planes to enable optimal evaluation of RV size and function (Figure 2). Even when all views can be adequately acquired, quantitative analysis remains a regional assessment at best. RV chamber size is typically classified as normal or abnormal according to basal, mid-ventricular, and longitudinal dimensions obtained at end-diastole from the RV-focused apical 4-chamber view (Figure 3) (7). Despite this standardized approach, measurements can still vary widely based on minor differences in transducer positioning. Indeed, RV size and functional measurements have been shown to be consistently different in the RV focused view when compared with the apical 4-chamber view (8). Furthermore, volumetric estimations derived from geometric assumptions based on linear dimensions correlate poorly with volumes calculated from CMR and are discouraged (9).
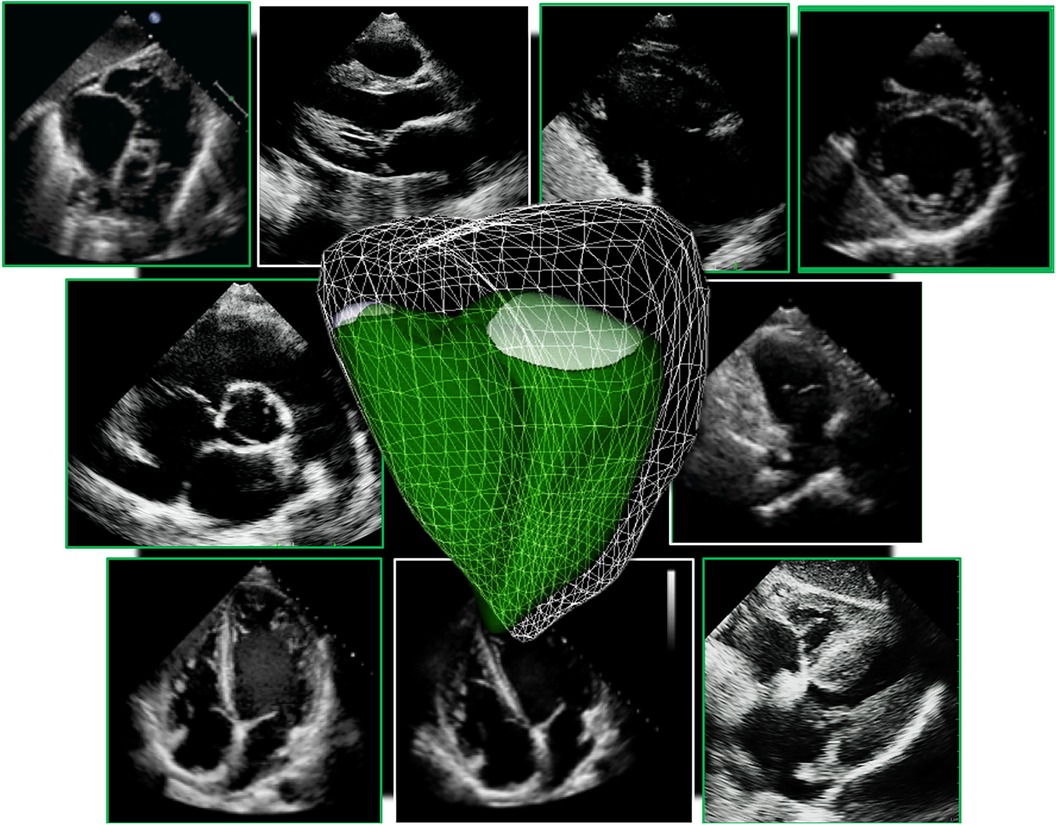
Figure 2. Collection of all 2D standard imaging planes used on routine transthoracic echocardiography to assess the right ventricle. A 3D right ventricle endocardial surface is superimposed on top (in green).
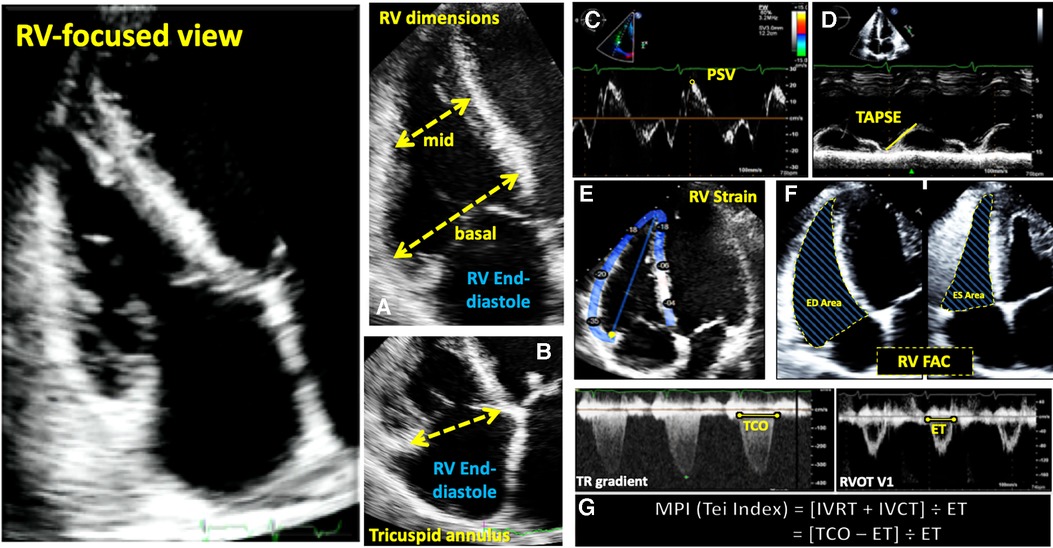
Figure 3. Guideline-recommended right ventricular size and function assessment. All measurements are performed in the RV focused apical 4-chamber view (far left panel). (A) RV mid-ventricular and basal dimensions obtained at end-diastole in the RV-focused view; (B) tricuspid annulus diameter obtained at end-diastole starting at the hinge-point of the non-septal TV leaflet and ending at hinge-point of the septal TV leaflet; (C) depiction of doppler-derived tricuspid lateral annular systolic velocity (S’) or peak systolic velocity (PSV); (D) m-mode is used to measure longitudinal displacement of the lateral tricuspid annulus in systole to yield tricuspid annular systolic excursion (TAPSE); (E) region of interest used to guide free-wall and global RV strain assessment; (F) RV areas obtained at end-diastole and end-systole to compute fractional area change; (G) Calculation of the myocardial performance index (MPI) defined as the sum of isovolumic contraction time the (IVCT) and isovolumic relaxation time (IVRT) divided by ejection time (ET) obtained from the right ventricular outflow tract initial velocity (RVOT V1). The sum of IVCT and IVRT is equal to the difference between the interval from cessation to onset of the tricuspid inflow (TCO) and ET.
Evaluation of RV systolic function on 2DE involves the integration of multiple parameters, of which the most commonly used include tricuspid annular systolic excursion (TAPSE), tissue Doppler-derived tricuspid lateral annular systolic velocity (S'), fractional area change (FAC), free-wall and four-chamber (free-wall + septal) longitudinal strain (FWS and 4CHLS respectively), and myocardial performance index (MPI) (7). Indeed, utilization of a single, global assessment of function is hindered by the complex mechanism of RV contraction that is unique from the left ventricle. In comparison to the left ventricle, the RV wall is thinner and composed of two muscular layers with longitudinally oriented myocytes in the sub-endocardium and circumferentially oriented myocytes in the sub-epicardial layer. Together, these layers contribute to RV contraction by respectively drawing the tricuspid annulus towards the apex and inwardly moving the free wall (2). Given that there is not one single accepted method for RV quantification, qualitative interpretation is often also used in clinical practice, characterizing dysfunction as mild, moderate, or severe despite poor sensitivity and notable interobserver variability (9). Routine metrics such as TAPSE and S' have demonstrated modest agreement with global RV systolic function obtained by CMR (10). These measures predominantly assess longitudinal excursion of the RV free-wall and thereby omit the contribution of other determinants of RV function. In many instances, longitudinal excursion is the most important determinant of systolic RV function. However, altered contraction mechanics and adverse remodeling in various disease states may result in under- or over-estimation of function using these methods such as in the setting of some types of pulmonary hypertension, post-cardiac surgery where systolic motion is concentrated in the transverse plane, or significant tricuspid regurgitation (TR) which produces exaggerated motion of the base (2). FAC provides a percentage estimate of global function, improving the correlation with CMR but it is highly dependent on identifying a suitable tomographic view that avoids cavity foreshortening. This limitation results in poor reproducibility. Additionally, since FAC is measured in the RV focused view, it excludes much of the RV body as well as the RV outflow tract which in itself contributes to 25%–30% of the RV volume (3, 7). Similar to FAC, FWS, a measure of myocardial shortening in the longitudinal plane, fails to incorporate the RV outflow tract and focuses on longitudinal deformation. Unlike TAPSE and RV S', FWS incorporates the entire RV free wall (or free and septal walls in the case of 4CHLS), and therefore correlates better with CMR measurements than either TAPSE or RV S' (11). Finally, MPI, or Tei index, defined as the sum of RV iso-volumetric contraction and relaxation times divided by the RV ejection time, has the ability to account for both systolic and diastolic components of RV function; however, situations such as tachycardia, elevated right atrial pressures, atrial fibrillation, and conduction system disorders prevent its consistent use (2). Overall, conventional 2D parameters (Figure 3) necessitate leveraging limited sections of the RV endocardial surface to extrapolate global function, which may subject these measures to inaccuracies. See Table 1 for an overview of advantages and disadvantages of each 2D parameter.
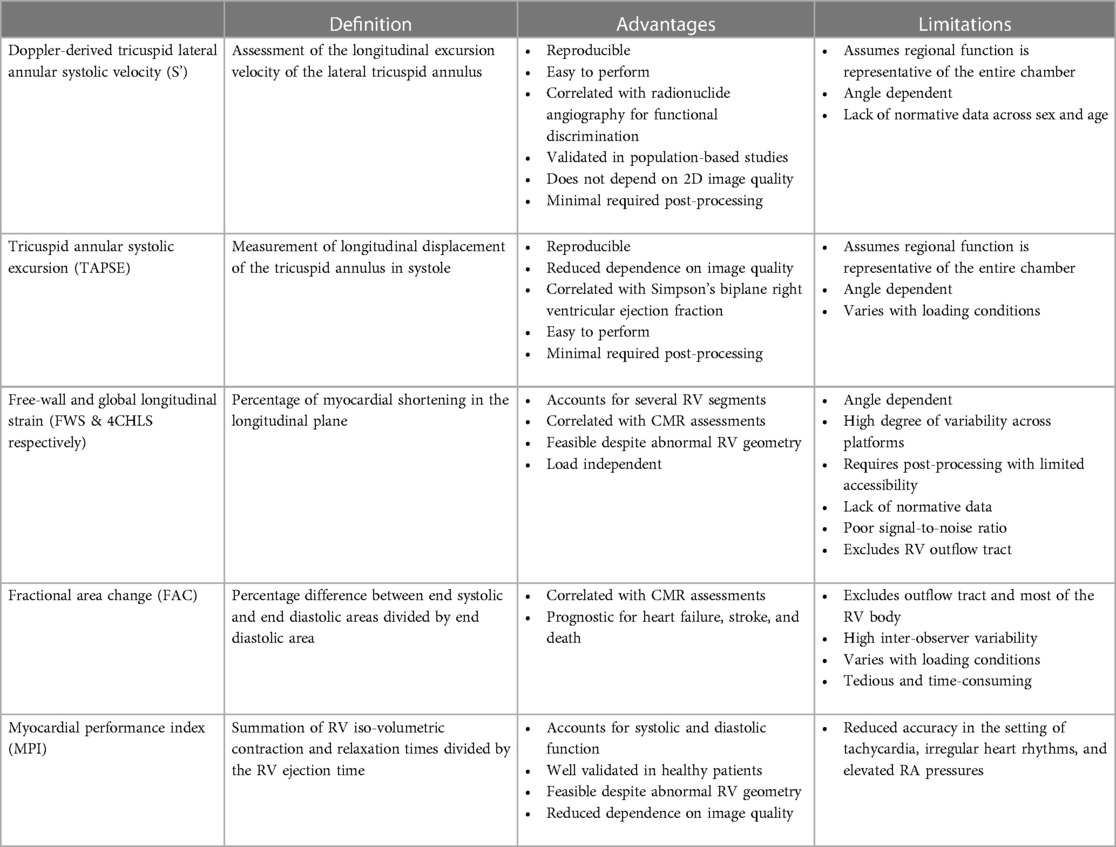
Table 1. Advantages and limitations of one- and two-dimensional analysis techniques for right ventricular functional assessment.
3D echocardiography of the right heart
Acquisition and analysis of the right ventricle
Acquisition of the 3D RV pyramidal dataset can be achieved using either a single or multi-beat approach from the RV-focused apical 4-chamber view (Figure 4). Notably, RV volumes and ejection fractions derived from 3D datasets acquired in the apical four-chamber view strongly correlate with measurements from the RV-focused view providing that the entire RV can be captured within the 3D dateset (12). Four to six beat acquisitions allow for higher temporal and spatial resolution enabling more optimal identification of end-diastolic and end-systolic phases for volumetric calculations (2). Prior validation studies with CMR in both children and adults have demonstrated sufficient frame rates ranging between 20 and 50 volumes per second to ensure reliable identification of cardiac timing (13, 14). Moreover, adequate patient cooperation with breath holding is critical to reduce stitch and dropout artifacts (2). Various clinical factors can adversely impact 3DE data collection including irregular cardiac rhythms, morbid obesity, inability to breath-hold, marked structurally abnormal RVs, mechanical ventilation, and mechanical support devices. In spite of these limitations on acoustic windows, transthoracic 3DE has exhibited exceptional feasibility in several large highly experienced cohorts ranging from 75% to 85% (15–17). The addition of ultrasound-enhancing agents has been shown to further augment performance with respect to reproducibility and correlation with CMR (18). In the World Alliance Society of Echocardiography (WASE) study, a worldwide cohort of centers with variable experience with 3D RV acquisition and analysis, feasibility of 3D RV acquisition dropped to 50%–60% with incomplete RV capture, typically anterior wall or apical drop-out being some of the main reasons for unanalyzable 3D RV data (Figure 5) (19). The ability to adequately capture the RV for 3D analysis is highly dependent on individual expertise to both acquire and analyze the 3D dataset. This expertise can vary widely from center to center as shown in the WASE study (Figure 6). According to this graph, the feasibility for RV analysis ranged anywhere from 20% to 95% and was dependent on the center in which the data was acquired, suggesting that it is possible to attain a level of expertise such that >80% of captured 3D RV data can be analyzed in patients with adequate 2D images. The major advantage of using 3D RV datasets for size and functional assessment is that this parameter represents the first echocardiography-based global method for RV functional assessment. Current 3D analysis software employs a volumetric approach to compute the total quantity of pixels within the RV endocardial surface in systole and diastole to obtain the respective volumes. This technique removes geometric assumptions and minimizes variability due to acquisition. Accordingly, volumes obtained from 3DE have demonstrated incremental improvements in accuracy and reproducibility compared to 2DE although they still underestimate volumes in comparison to CMR (5, 20). Fully automated methods of volumetric quantification based on machine-learning algorithms have been explored showing accurate, reproducible measurements following minimal revision (21).
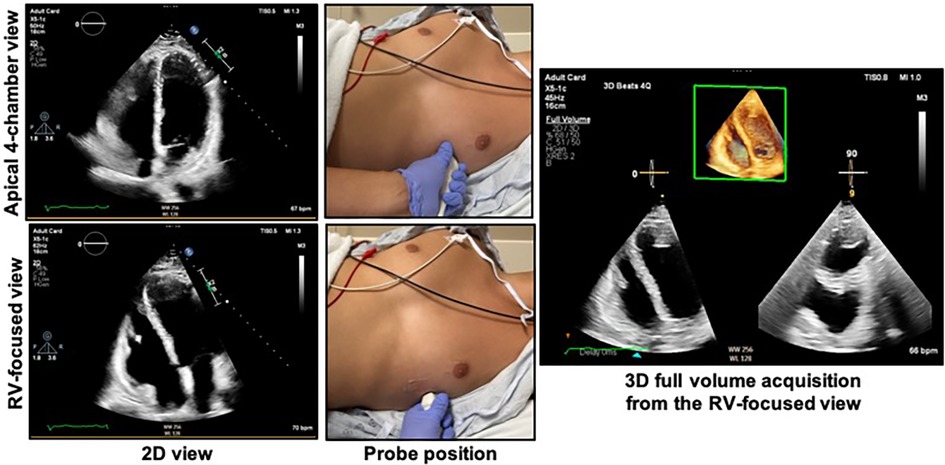
Figure 4. Obtaining the right ventricular focused view. The patient should be in the left lateral decubitus position with the left mid-clavicular, fifth intercostal region (approximate apex of the heart) positioned over the cut-out area of the bed if available. The top right shows the apical 4-chamber view as acquired from the probe position at top middle. The bottom left shows the RV-focused view as acquired from a more lateral location as shown in the bottom middle panel. The 3D dataset should be acquired from the RV-focused view to maximize capture of the RV free wall. See Figure 5 for the characteristics of an optimal 3D dataset. RV, right ventricle.
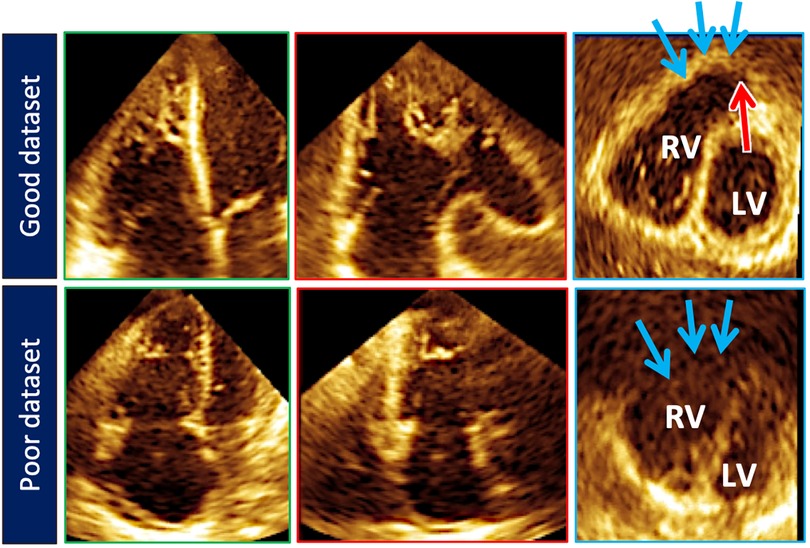
Figure 5. Top row illustrates cut planes through the optimal 3D right ventricular dataset. Note that the free-wall and right ventricular outflow tract borders (blue arrows) are well demarcated. Sometimes the pulmonary valve (red arrow) can be seen). Bottom row depicts a less than optimal 3D right ventricular dataset. The right ventricular outflow tract borders (blue arrows) are poorly seen.
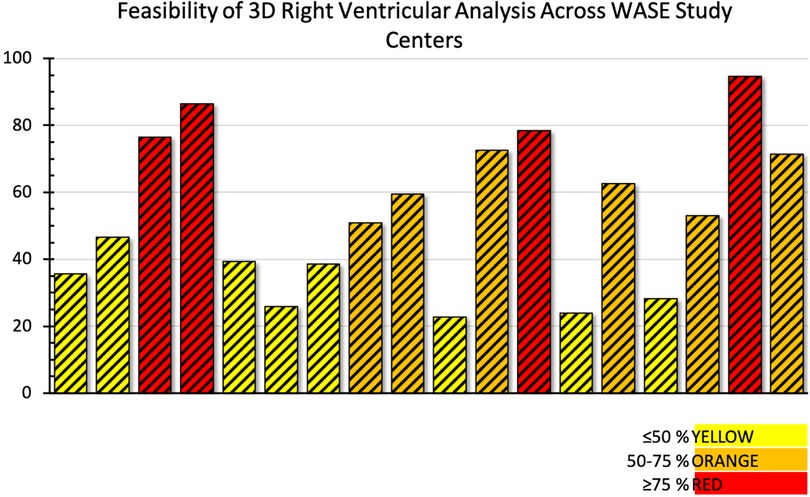
Figure 6. Feasibility of adequate 3D right ventricular dataset acquisition around the world. Data from the World Alliance Society of Echocardiography (WASE) study. Each bar represents one of the centers enrolled in the WASE study.
The volumetric dataset provides multiple opportunities for post-processing analysis. Particular regions of the wide-angle acquisition can be visualized and interrogated for wall motion abnormalities, hypertrophy, or masses (3). 3D RV datasets enable better characterization of the complex contraction pattern of the RV including alterations caused by various pathologies. One increasingly popular method of 3D RV functional analysis involves the decomposition of the RV ejection fraction into longitudinal, radial, and anteroposterior components in order to investigate modifications in RV function with disease, which cannot be appreciated when studying its longitudinal performance alone. These contraction components have been investigated in patients with left ventricular dysfunction (22), pulmonary hypertension (23), and systemic right ventricles due to transposition of the great arteries (24) using the ReVISION software package (Argus Cognitive Inc., Lebanon, NH) (25, 26).
Conventional echocardiographic measures of RV function including 2D RV functional parameters (TAPSE, S', FAC, RV strain) and 3D RVEF (even if obtained using CMR) are highly load dependent and do not provide a clinically useful assessment of RV function in patients with secondary tricuspid regurgitation or significant pulmonary hypertension. Recent data on outcomes have identified measures of right ventricle-to-pulmonary artery coupling, which better estimate the impact of loading conditions on the RV, as important prognostic markers in these patients. In a recent study, RV volumes from 3D echocardiography were used to compute a surrogate of right ventricle-to-pulmonary artery coupling using the formula total RV forward stroke volume/end-systolic volume. This measure, when applied to patients with more than moderate tricuspid regurgitation, successfully predicted outcomes (including all cause death and hospitalization for heart failure) with better accuracy than RV ejection fraction and other measures of right-ventricle-to-pulmonary artery coupling using combinations of 2D and Doppler parameters raising the possibility that this marker could have a role in the assessment of RV function in patients undergoing percutaneous procedures for the tricuspid valve (27).
Normal reference values for 3D right ventricular size and function parameters
Since its inception, numerous studies have sought to establish reference values for 3D chamber volumes and EF. Initial efforts displayed heterogenous findings, which could be attributed to inconsistencies in frame rates, volumetric analysis algorithms, and 3D imaging technology (28, 29). Recently, a large, multicenter investigation of 507 healthy volunteers evenly distributed across age and sex (17) showed for the first time, using 3DE, that men had larger right ventricular end-diastolic and end-systolic volumes compared to women even after indexation to body surface area, and that aging correlated with a consistent decline in volumes by decade. These results parallel those obtained from CMR in large populations of normal subjects (30, 31). From these findings, normative equations with allometric scaling were derived to assist with recognition of abnormal values. Even more recently, the World Alliance Society of Echocardiography (WASE) study also published normal values for 3D RV size and function parameters on 1,051 healthy volunteers, adding to the repertoire of 3D RV normal values with the added distinction of being the first 3D normal values study on a worldwide multi-ethnic cohort (19) (Table 2).
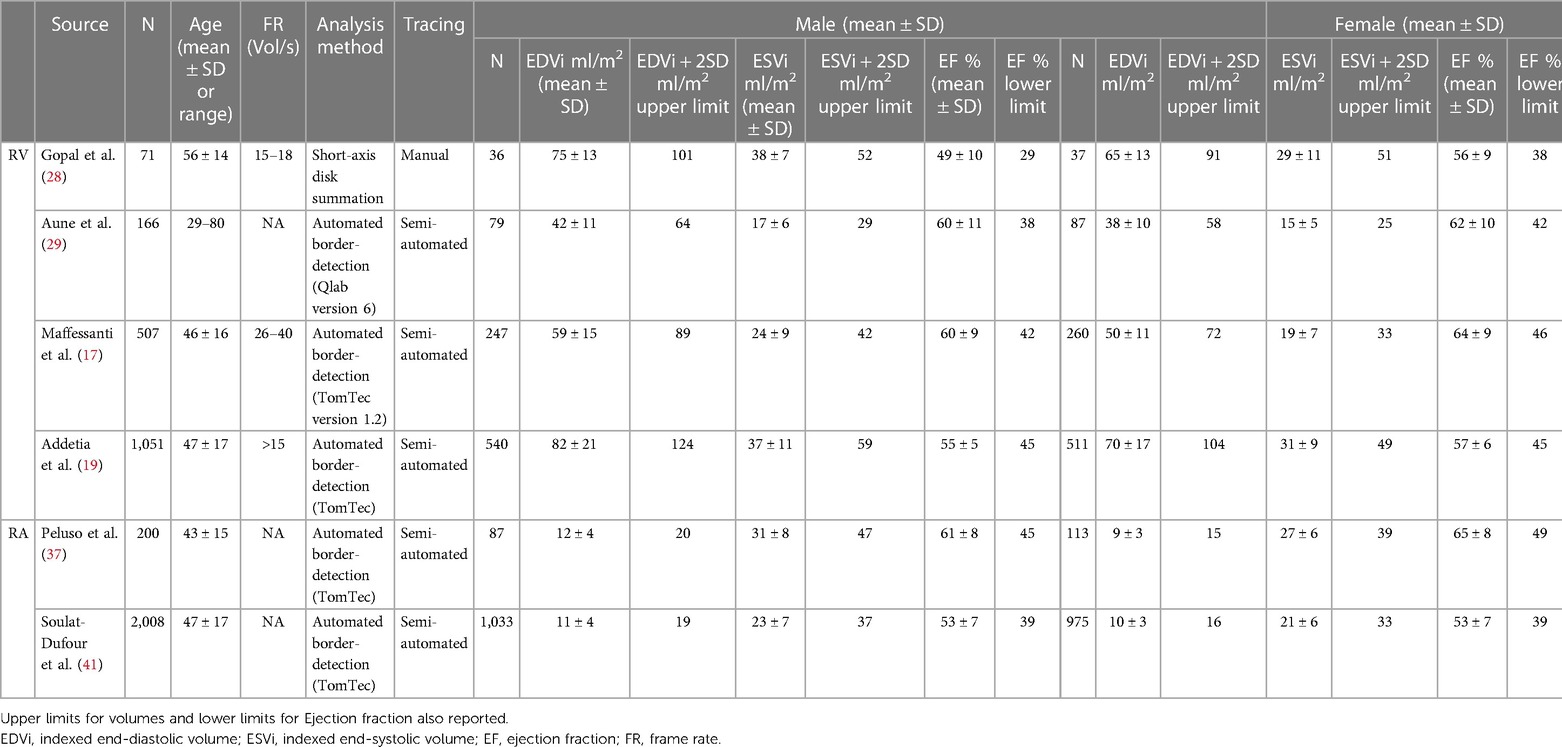
Table 2. Normal three-dimensional right ventricular and right atrial echocardiographic reference values.
3D tricuspid annulus imaging and analysis
The tricuspid annulus (TA) forms the junction between the right atrium and the right ventricle. Its complex anatomy and dynamic behavior preclude systematic characterization with 2DE. Current guidelines recommend that the TA be measured in the apical 4-chamber view on transthoracic echocardiography. TA size and dynamics, however, are much more complicated (32). With 3DE, comprehensive static and dynamic assessment of the TA is possible (33). Visualization of the TA with 3DE begins with optimization of the RV-focused apical view. Narrow-angle or full volume acquisition from this plane adequately captures the TA. Accurate measurement of TA size and function even with current multi-planar reconstruction techniques is difficult due to the nonplanarity of the annulus necessitating manual or automated initialization of the leaflet hinge points with automated interpretation throughout the cardiac cycle (33, 34). Various programs are in existence or in development to assist with this step. One commercially available 3DE software package dedicated to the tricuspid valve was validated and utilized to develop sex-specific reference ranges for the TA. Importantly, TA sizes were shown to be underestimated by 2DE (35). See Figure 7 for results from an example software package.
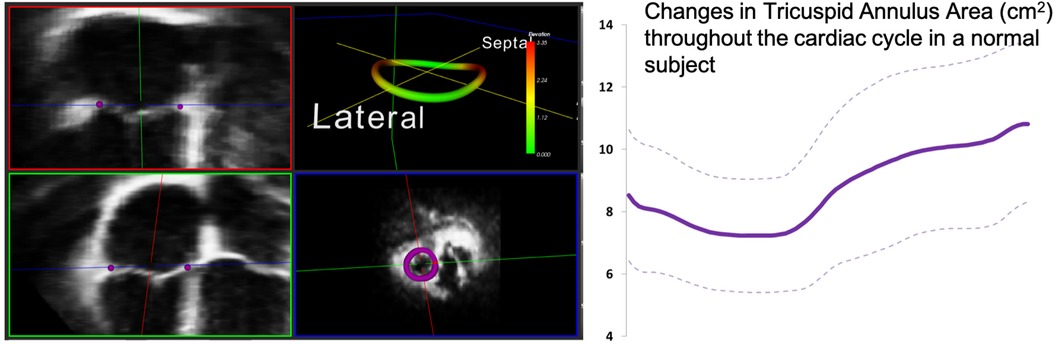
Figure 7. One example of customized software used to measure the 3D tricuspid annulus. Purple dots represent the initialization points from which the 3D annulus depiction (left panel, top right) is derived. The annulus is non-planar and therefore better assessed using 3D echocardiography. Dynamic analysis of the annulus allows calculation of changes in area and other parameters throughout the cardiac cycle (see graph right). Images courtesy of Federico Veronesi, PhD.
3D of the right atrium
Right atrial (RA) assessment is of paramount importance in patients with diseases affecting the RV including pulmonary hypertension, heart failure (both reduced and preserved etiologies), and tricuspid regurgitation. The RA has been heralded as both “first chamber to live and the last to die” (36). With 3DE, it is possible to assess RA volumes, phasic function, and even remodelling (36, 37). In one study, increasing 3D RA sphericity index was found to be associated with clinical deterioration in patients with pulmonary arterial hypertension (36). Similar to the left atrium, RA physiology can be divided into 3 parts: (1) the reservoir phase, which corresponds to tricuspid valve closure and ventricular systole; (2) the conduit phase which corresponds to tricuspid valve opening and early ventricular diastole, and (3) the contractile or booster phase which reflects right atrial contraction (38). 3D RA volumes have been shown to be larger than the corresponding 2D volumes (37, 39, 40). Normal vales for 3D RA volumes are summarized in Table 2 (41).
Diagnostic value of 3D echocardiography of the right ventricle
Characterization of tricuspid valve disease
Etiology of tricuspid regurgitation (TR) is closely coupled with right atrial and RV remodeling. Secondary or functional TR represents greater than 80% of TR in clinical practice and can be associated with or without pulmonary hypertension (PH) (42). These two TR categories have distinctive RV remodeling patterns which can be characterized using 3DE. Increases in RV afterload due to elevated pulmonary pressures can lead to spherical RV remodeling, papillary muscle displacement, tricuspid valve leaflet tethering, diminished leaflet coaptation surface, and tricuspid valve incompetence. The TA in these patients is often minimally dilated and may in some cases be normal in size. Flattening of the interventricular septum, a finding often seen in significant PH, likely also contributes to distortion of the tricuspid apparatus and TR. RV eccentricity index, quantified as the ratio between the long and perpendicular short-axis lengths at the mid- ventricular level in short-axis view has been shown to predict TR severity with high accuracy (43). Functional TR with PH has also been called ventricular functional TR, because the morphological changes in the right heart which sustain TR are seen mostly in the RV (Figure 8) (44, 45).
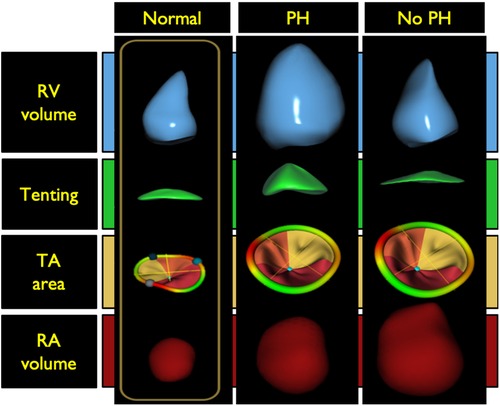
Figure 8. Right ventricular morphology changes associated with functional tricuspid regurgitation with and without pulmonary hypertension compared with a normal right ventricle (left panel). Middle panel illustrates the spherical right ventricular remodeling seen in patients with tricuspid regurgitation and pulmonary hypertension. In these patients there is often tricuspid valve leaflet tethering with some right atrial dilatation. The tricuspid annulus is typically minimally dilated and may in some cases be normal in size. The right panel illustrates ventricular remodeling in patients without pulmonary hypertension. This type of remodeling is typically seen in older adults with atrial fibrillation. There is notable right atrial and tricuspid annulus dilatation without leaflet tethering. Tricuspid annular dilation results in a diminished leaflet coaptation surface and increased rates of leaflet malcoaptation. In these patients, the RV dilates at the base, a phenomenon known as conical remodeling. PH, pulmonary hypertension; RV, right ventricle; TA, tricuspid annulus; RA right atrium. (Modified from Muraru D et al. Eur Heart J Cardiovasc Imaging. (2021) May 10;22(6):660−669).
Functional TR without PH is typically seen in older adults with a high incidence of associated atrial fibrillation resulting in RA dilatation with subsequent TA dilatation without leaflet tethering (Figure 8). TA dilation results in a diminished leaflet coaptation surface and increased rate of leaflet malcoaptation. In these patients, the RV maintains its normal length but dilates at the base loosely labeled as conical remodeling (42, 44–46). Restoration of sinus rhythm has been shown to improve the degree of TR in some of these patients (47).
Detailed analysis of functional and morphologic changes associated with RV remodeling with 3DE can help to differentiate between the different causes of functional TR and the impact on the RV (44–46). Regional quantitative curvature analysis has previously been implemented to characterize alterations in RV shape attributed to PH using a quantitative approach, demonstrating bulging of the interventricular septum into the left ventricle and greater convexity of the RV free wall throughout the cardiac cycle compared to normal controls. This bulging phenomenon is also known as the “D-shaped left ventricle” or “D-sign”, a finding that can also be appreciated on the 2D parasternal short-axis view (Figure 8) (48).
Implantable device lead complications
Device-lead related interference with the tricuspid valve apparatus is a potential complication that is incompletely described by 2DE as the device-lead is really only seen in its entirety in less than 20% of cases (49). The addition of 3D RV imaging has improved non-invasive assessment of the relationship between the tricuspid apparatus and device leads enabling direct visualization of the both the TV leaflets and the sub-tricuspid apparatus making it possible to determine the presence or absence of interference in select cases (50–52). According to one study, leads demonstrating leaflet impingement on 3DE were associated with a greater degree of TR with a median vena contracta of 0.62 cm compared to 0.27 cm in patients without 3DE evidence of lead-related leaflet interference. Importantly, positioning of the lead in the commissure resulted in less frequent interaction, suggesting that echocardiographic guidance of or follow-up after lead placement may be beneficial in some cases (52). More recent data suggests that lead-related tricuspid valve interference can be associated with the tricuspid valve leaflet(s) alone, the sub-tricuspid apparatus alone, or both the leaflet(s) and the sub-tricuspid apparatus (Figure 9) (53).
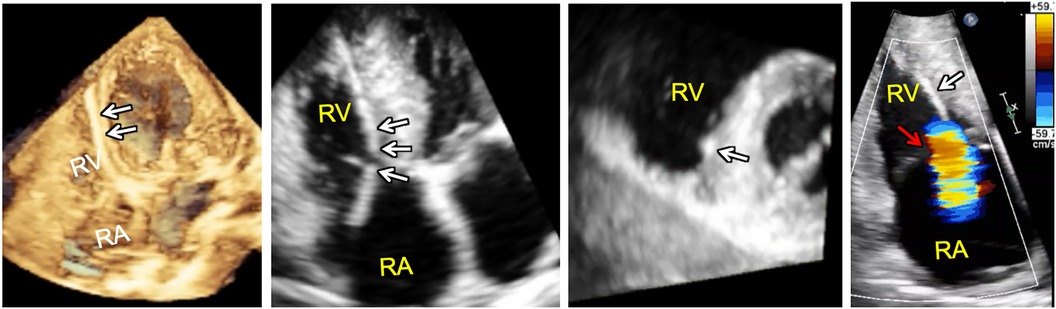
Figure 9. 3D full volume dataset of the right ventricle (far left) and adjacent cut planes through the 3D dataset (left, middle and right, middle) showing device-lead (white arrows) impinging on the septal leaflet and sub-tricuspid apparatus in the region of the right ventricular septum resulting in tricuspid regurgitation (far right). Note that the tricuspid leaflet coaptation zone (red arrow) is not the origin of tricuspid regurgitation in this case. In fact, tricuspid regurgitation is originating at the point of device-lead contact with the septal leaflet.
Given the increasing interest in percutaneous tricuspid valve repair in patients with heart failure, it is likely that there will be a parallel need to better diagnose lead-related interference with the tricuspid valve apparatus as any associated interference may impact the success of any procedure chosen to repair the tricuspid valve. 3DE shows promise in this area of diagnosis.
Arrhythmogenic right ventricular cardiomyopathy (ARVC)
Echocardiography represents a common first-line imaging modality for both diagnosis and follow-up of ARVC (54). Although CMR is considered the gold standard for meeting the imaging criteria for diagnosis, recent investigations have demonstrated a high concordance in diagnostic performance between 3DE and CMR when either is combined with 2DE. Moreover, 3DE enhances the ability to diagnose wall motion abnormalities and aneurysms which are critical to meeting imaging criteria for the diagnosis of the disease (Figure 10) (55, 56). 3DE specifically outperformed 2DE in detection of wall motion abnormalities and exhibited comparable detection rates to CMR (56). These suggest the possibility of 3D echocardiography-guided diagnosis and follow-up of these patients especially in those instances where CMR is not easy to obtain.
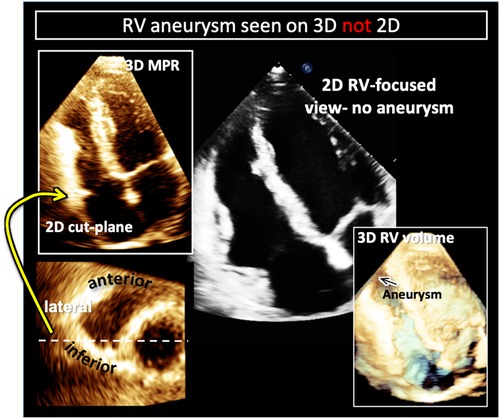
Figure 10. Example of right ventricular free-wall aneurysm detection with 3D (left) compared to 2DE in a patient with arrhythmogenic right ventricular cardiomyopathy (ARVC). Two-dimensional cut-planes from a full-volume 3D dataset enables visualization of the apical aneurysm (left) with targeted interrogation of the right ventricular free-wall (left, top) on short-axis imaging planes (left bottom). Here the aneurysm is noted to be on the infero-lateral free wall (white dotted line and yellow arrow). In the same patient the aneurysm is not visualized in the 2D right-ventricular focused view (right, top). Cropping into the 3D full volume also allows visualization of the apical aneurysm (black arrow on right, bottom).
Congenital heart disease
The asymmetrical remodeling of the RV often observed in patients with congenital heart disease can limit the efficacy of conventional 2D size and function assessment of the RV due to inaccurate geometric assumptions. These geometric assumptions may be overcome by 3DE. Volumes and ejection fractions acquired from 3DE datasets have been shown to correlate well with CMR measurements in addition to demonstrating lower interobserver variability than corresponding measurements obtained on 2DE (57, 58). However, in conditions with progressive RV enlargement including repaired tetralogy of Fallot (TOF) and transposition of the great arteries 3DE has been shown to systematically underestimate volumes while overestimating RVEF (59, 60). These studies were notably performed using earlier software versions that may impact their current applicability. More recent versions of the 3D RV analysis software are easier to use and provide short-axis cut-planes for tracing volumes. A recent investigation in patients with systemic RVs, revealed alterations in contractile mechanisms between patients with transposition of the great arteries (TGA) and congenitally corrected TGA, with motion along the anteroposterior plane dominating RV contraction in TGA and while all components (anteroposterior, longitudinal and radial) contribute equally to ventricular ejection fraction in congenitally corrected TGA (24, 61). 3DE has also facilitated characterization of RV shape and strain changes in conditions that result in chronic pressure and/or volume overload. Patients with TOF exhibited less curvature of the free wall, a more convex intraventricular septum, and significantly impaired RV strain compared to controls (62, 63).
Prognostic value of 3D echocardiography of the RV
Mixed population studies
RV function is reported to have prognostic significance in a variety of cardiovascular diseases including heart failure, PH, and coronary artery disease (Table 3) (1, 64–70). Importantly, 2D RV functional assessment can sometimes be inaccurate when used in these disease states. In post-cardiac surgery patients, for instance, due in part to geometrical changes associated with RV protection during bypass or alterations in interventricular septal motion after surgery, the longitudinal excursion of the RV is typically reduced despite preservation of overall RV function (71–74). TAPSE and RV S', therefore, underestimate RV function in this population and cannot be used to assess RV function. This phenomenon extends to at least 1 year post operatively. Global assessment of RV function with 3DE, however, can more accurately measure RV function in these patients suggesting that 3D RV assessment likely has wider applicability than 2DE in the remodeled or abnormal RV (75). 3D RV size and function parameters have been shown to have incremental value in the prediction of outcomes independent of left ventricular ejection fraction (67). In one study, the prevalence of patients with systolic LV dysfunction (left ventricular ejection fraction <52%) increased with worsening 3D RV ejection fraction across a population of consecutive patients with various cardiac conditions who had 3D RV acquisitions performed (68). In another retrospective study of 446 patients over a median follow up of 4.1 years, the authors showed that 3D RV ejection fraction offered incremental value over clinical risk factors and other echocardiographic parameters, including left ventricular systolic and diastolic function, for predicting future adverse outcomes including cardiac death and major adverse cardiac events (MACE) (1). The 3D RV ejection fraction cut-off values to stratify worsened prognosis were 35% for cardiac death and 41% for MACE. A prospective study of 50 patients, with a median follow-up of 16 months, found that 3D RV ejection fraction remained the only independent predictor of MACE after controlling for both clinical and echocardiographic variables, including age, New York Heart Association class, E/e' ratio, and left atrial volume index. By ROC analysis, the optimal RV ejection fraction cut-off value for event prediction was 43.4% (AUC = 0.77, p = 0.001), and RV ejection fraction remained an independent predictor in multivariable models when treated as a categorical variable using the cut-off of 43.4%. Categorization of 3D RV ejection fraction into the following partition values: 45%, 40%, and 30% (i.e., very low risk for mortality (RV ejection fraction >45%), low risk (40%< RV ejection fraction ≤45%), moderate risk (30%< RV ejection fraction ≤40%), and high risk (RV ejection fraction ≤30%), stratified the population into high, moderate, and low risk of cardiac death and MACE (68). Furthermore, a recent meta-analysis of ten studies including 1,928 patients identified a robust association between a one standard-deviation reduction in 3D RV ejection fraction and adverse outcomes that was stronger than 2D measures including TAPSE, FAC, and FWS (6).
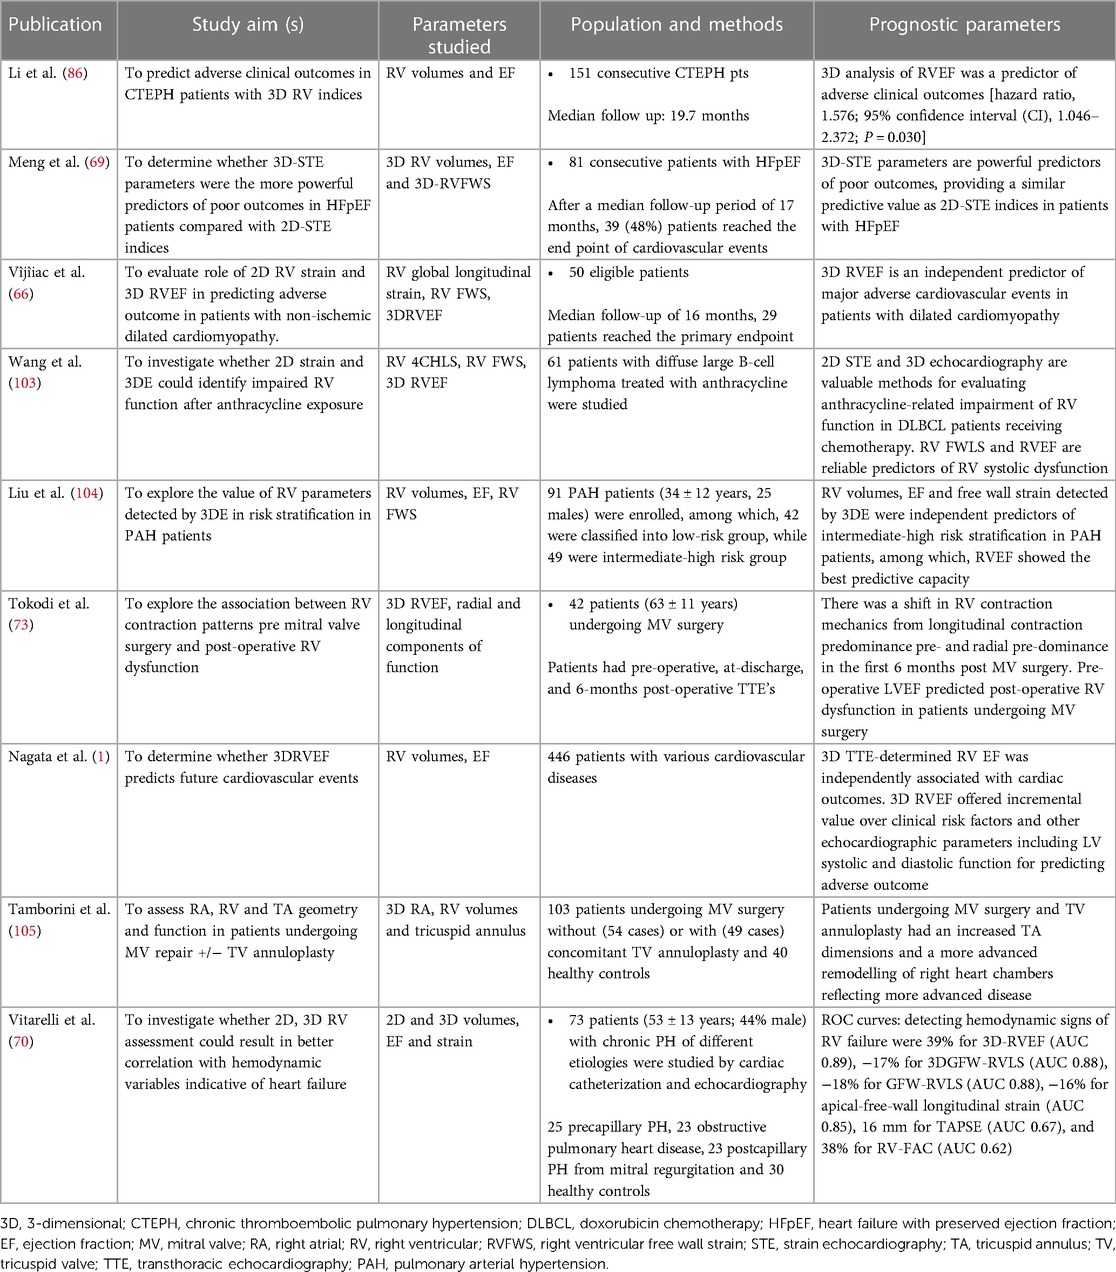
Table 3. Studies using RV volumes, EF and strain as prognostic indices.
3D RV parameters have also been shown to have utility in predicting adverse events in patients with heart failure with preserved ejection fraction. Meng et al. found that lower RV ejection fraction and 3D RV longitudinal strain of free wall were associated with heart failure, hospitalization, or death (69).
Pulmonary hypertension
Pulmonary hypertension has garnered a great deal of interest in the study of 3D RV applications, because the entire spectrum of RV remodelling can be documented in this cohort of patients (76). Together with 3D volumes, 3D deformation indices have an important role in the prognosis of PH patients. Specifically, changes in RV function and 3D RV area strain have been shown to be of prognostic importance and correlate more strongly with hemodynamics in RV failure than conventional echo indices (77, 78). In the pediatric PH population, 3D volumes, 3D RV ejection fraction, FAC, and free wall RV longitudinal strain were significantly associated with outcome (79). The ratio of 3D RV stroke volume to end-systolic volume (ESV) ratio as an estimate of RV-arterial coupling correlated with RV strain and was found to be a strong predictor of adverse clinical events in pediatric patients with PH (80).
Secondary tricuspid regurgitation
The ability of 3DE to characterize patterns of chamber remodelling resulting in secondary TR has prompted investigation into the prognostic impact of atrial and ventricular TR. In a population of patients with moderate-severe TR, patients with atrial TR comparably exhibited a lower rate of all-cause death and hospitalization due to heart failure (81). Categorization of TR severity as mild, moderate, and severe based on 3DE-derived regurgitant volume and effective regurgitant orifice area (82) revealed progressively higher rates of all-cause death and hospitalization due to heart failure with increasing TR severity, imparting the importance of the severity grading (81, 83). As aforementioned, estimation of right ventricular-to-pulmonary artery coupling in these patients can be challenging and therefore surrogate measures derived from 3DE have been investigated. In one study, a ratio between RV forward stroke volume and end-systolic volume less than 0.40 was associated with a higher risk of death and heart failure hospitalization (27).
It is important to note that structural tricuspid valve procedures and trials do not yet employ 3D indices of the right ventricle or tricuspid valve for decision-making (84). Data on the utility of 3D RV analysis in this space should become available shortly from the TRILUMINATE trial imaging sub-study. Additionally, there are two other studies incorporating 3D of the tricuspid valve which are currently recruiting patients: NCT05130775 and NCT05747404. The results of these studies are highly anticipated.
Pulmonary embolism/chronic thromboembolic pulmonary hypertension
Understanding the impact of a pulmonary embolism on the RV is essential in determining severity and in assessing recovery in follow-up. Here, 3DE of the RV has been shown to have the potential to serve as a useful adjunctive tool in both the acute and chronic settings. In the case of acute sub-massive pulmonary embolism, a reduced 3D RV ejection fraction was noted to be the most sensitive predictor of adverse events and signified a longer time for recovery of function at follow-up compared to 2D parameters (85). In an adult population of patients with chronic thromboembolic disease, a machine learning-based calculation of RV ejection fraction from 3D RV datasets, with a determined cut-off of approximately 31%, was a significant predictor of adverse events these in patients (86). Multiple studies utilizing 3DE have sought to characterize RV function before and after pulmonary thromboendarterectomy for management of chronic thromboembolic pulmonary hypertension. Findings revealed a consistent trend of significantly reduced chamber volume and improved systolic performance post-operatively that persisted at long-term follow-up (87–89).
Future directions
While, in the last decade, speckle tracking analysis of left ventricular performance has significantly fueled the investigation of LV mechanics and its prognostic value, the exploration of 3D RV strain has not advanced. The complex morphology of the RV chamber, the difficulty associated with imaging this chamber and the lack of dedicated software are all factors that have contributed to the sparse interest in 3D RV mechanics. More recently, with the development of different software solutions, characterization of 3D RV mechanics in healthy volunteers (90), and a variety of cardiac diseases (91) has been initiated by some investigators. 3D RV strain has been shown to be independently associated with short-term outcomes in patients undergoing cardiac surgery (73, 92), the severity of obstructive sleep apnea (93), prognostication in heart failure with preserved ejection fraction (69) and pulmonary hypertension (94, 95).
Studies performed on the left ventricle have indicated that its shape carries information independent from conventional functional measurements and is related to prognosis (96, 97). Alterations in 3D left ventricular shape have also been cited as an early manifestation of remodeling in patients with severe mitral regurgitation and normal left ventricular ejection fraction (98). Unlike the left ventricle, the peculiar morphology of the RV does not allow its shape to be simplified to resemble a simple geometrical model. For this reason, RV shape has largely been studied in terms of regional curvedness. Subtle changes in the physiological condition is reflected by local adaptation of the RV wall which can be quantitatively measured by its curvature, for example, a more locally convex or concave wall. RV curvature is altered as a consequence of the remodeling induced by pathological conditions, such as pulmonary hypertension (48, 99), volume overload (62), but also in the settings of congenital heart disease (63) and in patients with mechanical circulatory support (100).
While it has been established that 3D RV measurements are more accurate and prognostic than 2D parameters, it is notable that in the vast majority of centers around the world 3D RV dataset acquisition is not able to meet the requirements to perform a reliable quantitative analysis (19). Indeed, even when data is adequate, quantitative analysis is usually time consuming and requires well-trained echocardiographers to ensure adequate accuracy and reproducibility. This paradox produces a challenge for image-guided artificial intelligence systems of the future to predict, display, and guide echocardiographers and sonographers during image acquisition with the goal to increase the feasibility rate of subsequent 3D RV analysis. This ability already exists in a rudimentary form to guide novices to acquire and display diagnostic quality 2D images (101). Artificial intelligence solutions could also be developed with the potential to fully automate the identification and segmentation of the RV. Fusion of data obtained from different imaging planes/probe positions could theoretically be used to, for instance, address the problem of acquiring a complete dataset in abnormal and large RVs. Deep learning algorithms have already shown promise in accurately predicting 3D RV ejection fractions from two-dimensional images, identifying RV dysfunction with an accuracy equivalent to an expert (78%) and with the additional potential to predict major adverse cardiac events (102). If this combination of AI-guided algorithm allowing quality controlled acquisition, automated segmentation and multiparametric—functional, morphological and mechanical and even hemodynamic (if acquisition of invasive RV pressures and 3D echocardiographic datasets could be acquired simultaneously to develop pressure-volume loops)—quantitative analysis becomes available, it would become an important, accurate and reproducible tool for the assessment and understanding of RV pathophysiology (Figure 11).
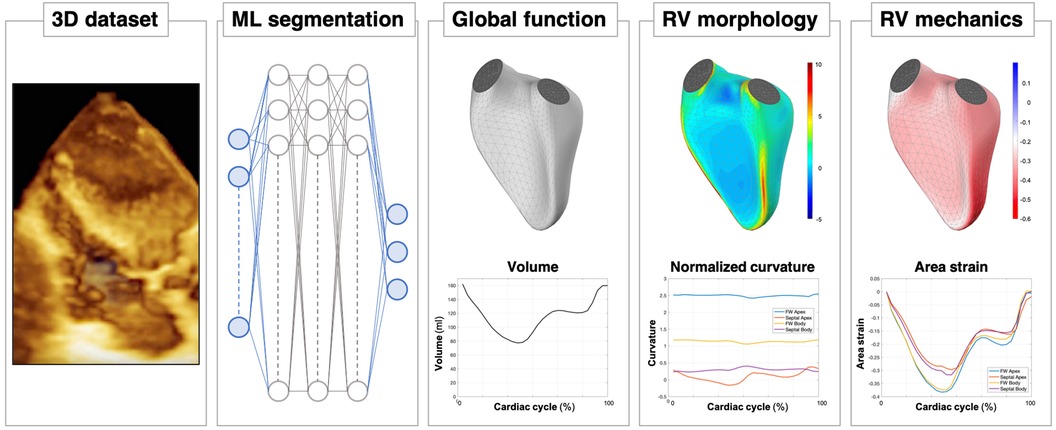
Figure 11. A look into the future of right ventricular assessment by 3D echocardiography: after the acquisition of the 3D dataset of the RV chamber, eventually supported by artificial intelligence (AI)-guided systems, a machine learning (ML) algorithm will be able to obtain a rapid, accurate and reproducible segmentation of the RV cavity. Based on these time-evolving surfaces, a comprehensive analysis of the RV will be automatically carried out, from conventional functional analysis (volumes and ejection fraction) to more sophisticated quantitative analyses, including morphological analysis in terms of local curvature or local mechanical function, as assessed by displacement and strain measurements.
Conclusions
3D echocardiography offers substantial advantages for comprehensively evaluating the right ventricle compared to conventional 2D echocardiographic assessment. The growth of 3DE has corresponded with an increasing number of diagnostic applications requiring global chamber assessments as well as considerable investigation into the prognostic significance of 3DE measures. Novel analysis techniques including RV strain and shape combined with automated interpretations may further expand the role of 3DE in clinical practice.
Author contributions
MR: Conceptualization, Data curation, Methodology, Writing – original draft, Writing – review & editing. FM: Conceptualization, Methodology, Writing – review & editing, Visualization. AK: Methodology, Writing – review & editing, Data curation. JG: Writing – review & editing, Conceptualization, Writing – original draft. RL: Conceptualization, Writing – original draft, Writing – review & editing, Methodology. KA: Conceptualization, Methodology, Writing – original draft, Writing – review & editing, Data curation, Resources, Supervision, Visualization.
Funding
The author(s) declare that no financial support was received for the research, authorship, and/or publication of this article.
Conflict of interest
The authors declare that the research was conducted in the absence of any commercial or financial relationships that could be construed as a potential conflict of interest.
The author(s) declared that they were an editorial board member of Frontiers, at the time of submission. This had no impact on the peer review process and the final decision.
Publisher's note
All claims expressed in this article are solely those of the authors and do not necessarily represent those of their affiliated organizations, or those of the publisher, the editors and the reviewers. Any product that may be evaluated in this article, or claim that may be made by its manufacturer, is not guaranteed or endorsed by the publisher.
References
1. Nagata Y, Wu VCC, Kado Y, Otani K, Lin FC, Otsuji Y, et al. Prognostic value of right ventricular ejection fraction assessed by transthoracic 3D echocardiography. Circ Cardiovasc Imaging. (2017) 10:1–10. doi: 10.1161/CIRCIMAGING.116.005384
2. Addetia K, Muraru D, Badano LP, Lang RM. New directions in right ventricular assessment using 3-dimensional echocardiography. JAMA Cardiol. (2019) 4:936–44. doi: 10.1001/jamacardio.2019.2424
3. Badano LP, Addetia K, Pontone G, Torlasco C, Lang RM, Parati G, et al. Advanced imaging of right ventricular anatomy and function. Heart. (2020) 106:1469–76. doi: 10.1136/heartjnl-2019-315178
4. Sugeng L, Mor-Avi V, Weinert L, Niel J, Ebner C, Steringer-Mascherbauer R, et al. Multimodality comparison of quantitative volumetric analysis of the right ventricle. JACC Cardiovasc Imaging. (2010) 3:10–8. doi: 10.1016/j.jcmg.2009.09.017
5. Shimada YJ, Shiota M, Siegel RJ, Shiota T. Accuracy of right ventricular volumes and function determined by three-dimensional echocardiography in comparison with magnetic resonance imaging: a meta-analysis study. J Am Soc Echocardiogr. (2010) 23:943–53. doi: 10.1016/j.echo.2010.06.029
6. Sayour AA, Tokodi M, Celeng C, Takx RAP, Fábián A, Lakatos BK, et al. Association of right ventricular functional parameters with adverse cardiopulmonary outcomes: a meta- analysis. J Am Soc Echocardiogr. (2023) 36:624–33.e8. doi: 10.1016/j.echo.2023.01.018
7. Rudski LG, Lai WW, Afilalo J, Hua L, Handschumacher MD, Chandrasekaran K, et al. Guidelines for the echocardiographic assessment of the right heart in adults: a report from the American society of echocardiography. Endorsed by the European association of echocardiography, a registered branch of the European society of cardiology, and the Canadian society of echocardiography. J Am Soc Echocardiogr. (2010) 23:685–713. doi: 10.1016/j.echo.2010.05.010
8. Genovese D, Mor-Avi V, Palermo C, Muraru D, Volpato V, Kruse E, et al. Comparison between four-chamber and right ventricular–focused views for the quantitative evaluation of right ventricular size and function. J Am Soc Echocardiogr. (2019) 32:484–94. doi: 10.1016/j.echo.2018.11.014
9. Mertens LL, Friedberg MK. Imaging the right ventricleg-current state of the art. Nat Rev Cardiol. (2010) 7:551–63. doi: 10.1038/nrcardio.2010.118
10. Anavekar NS, Gerson D, Skali H, Kwong RY, Kent Yucel E, Solomon SD. Two-dimensional assessment of right ventricular function: an echocardiographic-MRI correlative study. Echocardiography. (2007) 24:452–6. doi: 10.1111/j.1540-8175.2007.00424.x
11. Focardi M, Cameli M, Carbone SF, Massoni A, De Vito R, Lisi M, et al. Traditional and innovative echocardiographic parameters for the analysis of right ventricular performance in comparison with cardiac magnetic resonance. Eur Heart J Cardiovasc Imaging. (2015) 16:47–52. doi: 10.1093/ehjci/jeu156
12. Namisaki H, Nabeshima Y, Kitano T, Otani K, Takeuchi M. Prognostic value of the right ventricular ejection fraction, assessed by fully automated three-dimensional echocardiography: a direct comparison of analyses using right ventricular–focused views versus apical four-chamber views. J Am Soc Echocardiogr. (2021) 34:117–26. doi: 10.1016/j.echo.2020.09.016
13. Laser KT, Karabiyik A, Körperich H, Horst JP, Barth P, Kececioglu D, et al. Validation and reference values for three-dimensional echocardiographic right ventricular volumetry in children: a multicenter study. J Am Soc Echocardiogr. (2018) 31:1050–63. doi: 10.1016/j.echo.2018.03.010
14. Muraru D, Spadotto V, Cecchetto A, Romeo G, Aruta P, Ermacora D, et al. New speckle-tracking algorithm for right ventricular volume analysis from three-dimensional echocardiographic data sets: validation with cardiac magnetic resonance and comparison with the previous analysis tool. Eur Heart J Cardiovasc Imaging. (2016) 17:1279–89. doi: 10.1093/ehjci/jev309
15. Medvedofsky D, Addetia K, Patel AR, Sedlmeier A, Baumann R, Mor-Avi V, et al. Novel approach to three-dimensional echocardiographic quantification of right ventricular volumes and function from focused views. J Am Soc Echocardiogr. (2015) 28:1222–31. doi: 10.1016/j.echo.2015.06.013
16. Tamborini G, Brusoni D, Torres Molina JE, Galli CA, Maltagliati A, Muratori M, et al. Feasibility of a new generation three-dimensional echocardiography for right ventricular volumetric and functional measurements. Am J Cardiol. (2008) 102:499–505. doi: 10.1016/j.amjcard.2008.03.084
17. Maffessanti F, Muraru D, Esposito R, Gripari P, Ermacora D, Santoro C, et al. Age-, body size-, and sex-specific reference values for right ventricular volumes and ejection fraction by three-dimensional echocardiography: a multicenter echocardiographic study in 507 healthy volunteers. Circ Cardiovasc Imaging. (2013) 6:700–10. doi: 10.1161/CIRCIMAGING.113.000706
18. Medvedofsky D, Mor-Avi V, Kruse E, Guile B, Ciszek B, Weinert L, et al. Quantification of right ventricular size and function from contrast-enhanced three-dimensional echocardiographic images. J Am Soc Echocardiogr. (2017) 30:1193–202. doi: 10.1016/j.echo.2017.08.003
19. Addetia K, Miyoshi T, Amuthan V, Citro R, Daimon M, Gutierrez Fajardo P, et al. Normal values of three-dimensional right ventricular size and function measurements: results of the world alliance societies of echocardiography study. J Am Soc Echocardiogr. (2023) 36:858–66.e1. doi: 10.1016/j.echo.2023.04.011
20. van der Zwaan HB, Geleijnse ML, McGhie JS, Boersma E, Helbing WA, Meijboom FJ, et al. Right ventricular quantification in clinical practice: two-dimensional vs. Three-dimensional echocardiography compared with cardiac magnetic resonance imaging. Eur J Echocardiogr. (2011) 12:656–64. doi: 10.1093/ejechocard/jer107
21. Genovese D, Rashedi N, Weinert L, Narang A, Addetia K, Patel AR, Prater D, et al. Machine learning–based three-dimensional echocardiographic quantification of right ventricular size and function: validation against cardiac magnetic resonance. J Am Soc Echocardiogr. (2019) 32:969–77. doi: 10.1016/j.echo.2019.04.001
22. Surkova E, Kovács A, Tokodi M, Lakatos BK, Merkely B, Muraru D, et al. Contraction patterns of the right ventricle associated with different degrees of left ventricular systolic dysfunction. Circ Cardiovasc Imaging. (2021) 14:E012774. doi: 10.1161/CIRCIMAGING.121.012774
23. Rako ZA, Yogeswaran A, Lakatos BK, Fábián A, Yildiz S, da Rocha BB, et al. Clinical and functional relevance of right ventricular contraction patterns in pulmonary hypertension. J Heart Lung Transplant. (2023) 42:1518–28. doi: 10.1016/j.healun.2023.07.004
24. Surkova E, Kovács A, Lakatos BK, Tokodi M, Fábián A, West C, et al. Contraction patterns of the systemic right ventricle: a three-dimensional echocardiography study. Eur Heart J Cardiovasc Imaging. (2022) 23:1654–62. doi: 10.1093/ehjci/jeab272
25. Tokodi M, Staub L, Budai Á, Lakatos BK, Csákvári M, Suhai FI, et al. Partitioning the right ventricle into 15 segments and decomposing its motion using 3D echocardiography- based models: the updated ReVISION method. Front Cardiovasc Med. (2021) 8:1–18. doi: 10.3389/fcvm.2021.622118
26. Lakatos B, Tősér Z, Tokodi M, Doronina A, Kosztin A, Muraru D, et al. Quantification of the relative contribution of the different right ventricular wall motion components to right ventricular ejection fraction: the ReVISION method. Cardiovasc Ultrasound. (2017) 15:1–9. doi: 10.1186/s12947-017-0100-0
27. Gavazzoni M, Badano LP, Cascella A, Heilbron F, Tomaselli M, Caravita S, et al. Clinical value of a novel three-dimensional echocardiography–derived index of right ventricle–pulmonary artery coupling in tricuspid regurgitation. J Am Soc Echocardiogr. (2023) 36:1154–66.e3. doi: 10.1016/j.echo.2023.06.014
28. Gopal AS, Chukwu EO, Iwuchukwu CJ, Katz AS, Toole RS, Schapiro W, et al. Normal values of right ventricular size and function by real-time 3-dimensional echocardiography: comparison with cardiac magnetic resonance imaging. J Am Soc Echocardiogr. (2007) 20:445–55. doi: 10.1016/j.echo.2006.10.027
29. Aune E, Baekkevar M, Rodevand O, Otterstad JE. The limited usefulness of real-time 3-dimensional echocardiography in obtaining normal reference ranges for right ventricular volumes. Cardiovasc Ultrasound. (2009) 7:1–9. doi: 10.1186/1476-7120-7-35
30. Xie E, Yu R, Ambale-Venkatesh B, Bakhshi H, Heckbert SR, Soliman EZ, et al. Association of right atrial structure with incident atrial fibrillation: a longitudinal cohort cardiovascular magnetic resonance study from the multi-ethnic study of atherosclerosis (MESA). J Cardiovasc Magn Reson. (2020) 22:1–10. doi: 10.1186/s12968-020-00631-1
31. Kawel-Boehm N, Maceira A, Valsangiacomo-Buechel ER, Vogel-Claussen J, Turkbey EB, Williams R, et al. Normal values for cardiovascular magnetic resonance in adults and children. J Cardiovasc Magn Reson. (2015) 17:1–34. doi: 10.1186/s12968-015-0111-7
32. Naser JA, Kucuk HO, Ciobanu AO, Jouni H, Oguz D, Thaden JJ, et al. Atrial fibrillation is associated with large beat-to-beat variability in mitral and tricuspid annulus dimensions. Eur Heart J Cardiovasc Imaging. (2021) 22:1362–73. doi: 10.1093/ehjci/jeab033
33. Addetia K, Muraru D, Veronesi F, Jenei C, Cavalli G, Besser SA, et al. 3-dimensional echocardiographic analysis of the tricuspid Annulus provides new insights into tricuspid valve geometry and dynamics. JACC Cardiovasc Imaging. (2019) 12:401–12. doi: 10.1016/j.jcmg.2017.08.022
34. Muraru D, Hahn RT, Soliman OI, Faletra FF, Basso C, Badano LP. 3-dimensional echocardiography in imaging the tricuspid valve. JACC Cardiovasc Imaging. (2019) 12:500–15. doi: 10.1016/j.jcmg.2018.10.035
35. Muraru D, Gavazzoni M, Heilbron F, Mihalcea DJ, Guta AC, Radu N, et al. Reference ranges of tricuspid annulus geometry in healthy adults using a dedicated three-dimensional echocardiography software package. Front Cardiovasc Med. (2022) 9:1–15. doi: 10.3389/fcvm.2022.1011931
36. Grapsa J, Gibbs JSR, Cabrita IZ, Watson GF, Pavlopoulos H, Dawson D, et al. The association of clinical outcome with right atrial and ventricular remodelling in patients with pulmonary arterial hypertension: study with real-time three-dimensional echocardiography. Eur Heart J Cardiovasc Imaging. (2012) 13:666–72. doi: 10.1093/ehjci/jes003
37. Peluso D, Badano LP, Muraru D, Dal Bianco L, Cucchini U, Kocabay G, et al. Right atrial size and function assessed with three-dimensional and speckle-tracking echocardiography in 200 healthy volunteers. Eur Heart J Cardiovasc Imaging. (2013) 14:1106–14. doi: 10.1093/ehjci/jet024
38. Lang RM, Cameli M, Sade LE, Faletra FF, Fortuni F, Rossi A, et al. Imaging assessment of the right atrium: anatomy and function. Eur Heart J Cardiovasc Imaging. (2022) 23:867–84. doi: 10.1093/ehjci/jeac011
39. Ferrara F, Gargani L, Ruohonen S, Vriz O, Scalese M, Russo V, et al. Reference values and correlates of right atrial volume in healthy adults by two-dimensional echocardiography. Echocardiography. (2018) 35:1097–107. doi: 10.1111/echo.14015
40. Kou S, Caballero L, Dulgheru R, Voilliot D, De Sousa C, Kacharava G, et al. Echocardiographic reference ranges for normal cardiac chamber size: results from the NORRE study. Eur Heart J Cardiovasc Imaging. (2014) 15:680–90. doi: 10.1093/ehjci/jet284
41. Soulat-Dufour L, Addetia K, Miyoshi T, Citro R, Daimon M, Fajardo PG, et al. Normal values of right atrial size and function according to age, sex, and ethnicity: results of the world alliance societies of echocardiography study. J Am Soc Echocardiogr. (2021) 34:286–300. doi: 10.1016/j.echo.2020.11.004
42. Prihadi EA, Delgado V, Leon MB, Enriquez-Sarano M, Topilsky Y, Bax JJ. Morphologic types of tricuspid regurgitation: characteristics and prognostic implications. JACC Cardiovasc Imaging. (2019) 12:491–9. doi: 10.1016/j.jcmg.2018.09.027
43. Kim HK, Kim YJ, Park JS, Kim KH, Kim KB, Ahn H, et al. Determinants of the severity of functional tricuspid regurgitation. Am J Cardiol. (2006) 98:236–42. doi: 10.1016/j.amjcard.2006.01.082
44. Florescu DR, Muraru D, Florescu C, Volpato V, Caravita S, Perger E, et al. Right heart chambers geometry and function in patients with the atrial and the ventricular phenotypes of functional tricuspid regurgitation. Eur Heart J Cardiovasc Imaging. (2022) 23:930–40. doi: 10.1093/ehjci/jeab211
45. Topilsky Y, Khanna A, Le Toumeau T, Park S, Michelena H, Suri R, et al. Clinical context and mechanism of functional tricuspid regurgitation in patients with and without pulmonary hypertension. Circ Cardiovasc Imaging. (2012) 5:314–23. doi: 10.1161/CIRCIMAGING.111.967919
46. Utsunomiya H, Itabashi Y, Mihara H, Berdejo J, Kobayashi S, Siegel RJ, et al. Functional tricuspid regurgitation caused by chronic atrial fibrillation: a real-time 3-dimensional transesophageal echocardiography study. Circ Cardiovasc Imaging. (2017) 10:1–11. doi: 10.1161/CIRCIMAGING.116.004897
47. Soulat-Dufour L, Lang S, Addetia K, Ederhy S, Adavane-Scheuble S, Chauvet-Droit M, et al. Restoring sinus rhythm reverses cardiac remodeling and reduces valvular regurgitation in patients with atrial fibrillation. J Am Coll Cardiol. (2022) 79:951–61. doi: 10.1016/j.jacc.2021.12.029
48. Addetia K, Maffessanti F, Yamat M, Weinert L, Narang A, Freed BH, et al. Three-dimensional echocardiography-based analysis of right ventricular shape in pulmonary arterial hypertension. Eur Heart J Cardiovasc Imaging. (2016) 17:564–75. doi: 10.1093/ehjci/jev171
49. Seo Y, Ishizu T, Nakajima H, Sekiguchi Y, Watanabe S, Aonuma K. Clinical utility of 3-dimensional echocardiography in the evaluation of tricuspid regurgitation caused by pacemaker leads. Circ J. (2008) 72:1465–70. doi: 10.1253/circj.CJ-08-0227
50. Cheng Y, Gao H, Tang L, Li J, Yao L. Clinical utility of three-dimensional echocardiography in the evaluation of tricuspid regurgitation induced by implantable device leads. Echocardiography. (2016) 33:1689–96. doi: 10.1111/echo.13314
51. Poorzand H, Tayyebi M, Hosseini S, Bakavoli AH, Keihanian F, Jarahi L, et al. Predictors of worsening TR severity after right ventricular lead placement: any added value by post-procedural fluoroscopy versus three–dimensional echocardiography? Cardiovasc Ultrasound. (2021) 19:1–9. doi: 10.1186/s12947-021-00267-w
52. Mediratta A, Addetia K, Yamat M, Moss JD, Nayak HM, Burke MC, et al. 3D echocardiographic location of implantable device leads and mechanism of associated tricuspid regurgitation. JACC Cardiovasc Imaging. (2014) 7:337–47. doi: 10.1016/j.jcmg.2013.11.007
53. Henry M, Abutaleb AR, Jeevanandam V, Smith H, Belkin M, Husain A, et al. Anatomic description of tricuspid apparatus interference from implantable intracardiac devices. JACC Cardiovasc Imaging. (2022) 15:361–5. doi: 10.1016/j.jcmg.2020.12.016
54. Malik N, Mukherjee M, Wu KC, Zimmerman SL, Zhan J, Calkins H, et al. Multimodality imaging in arrhythmogenic right ventricular cardiomyopathy. Circ Cardiovasc Imaging. (2022) 15:e013725. doi: 10.1161/CIRCIMAGING.121.013725
55. Prakasa KR, Dalal D, Wang J, Bomma C, Tandri H, Dong J, et al. Feasibility and variability of three dimensional echocardiography in arrhythmogenic right ventricular dysplasia/cardiomyopathy. Am J Cardiol. (2006) 97:703–9. doi: 10.1016/j.amjcard.2005.11.020
56. Addetia K, Mazzanti A, Maragna R, Monti L, Yamat M, Kukavica D, et al. Value of 3D echocardiography in the diagnosis of arrhythmogenic right ventricular cardiomyopathy. Eur Heart J Cardiovasc Imaging. (2023) 24:664–77. doi: 10.1093/ehjci/jeac172
57. van der Zwaan HB, Helbing WA, McGhie JS, Geleijnse ML, Luijnenburg SE, Roos-Hesselink JW, et al. Clinical value of real-time three-dimensional echocardiography for right ventricular quantification in congenital heart disease: validation with cardiac magnetic resonance imaging. J Am Soc Echocardiogr. (2010) 23:134–40. doi: 10.1016/j.echo.2009.12.001
58. Grewal J, Majdalany D, Syed I, Pellikka P, Warnes CA. Three-dimensional echocardiographic assessment of right ventricular volume and function in adult patients with congenital heart disease: comparison with magnetic resonance imaging. J Am Soc Echocardiogr. (2010) 23:127–33. doi: 10.1016/j.echo.2009.11.002
59. Dragulescu A, Grosse-Wortmann L, Fackoury C, Mertens L. Echocardiographic assessment of right ventricular volumes: a comparison of different techniques in children after surgical repair of tetralogy of fallot. Eur Heart J Cardiovasc Imaging. (2012) 13:596–604. doi: 10.1093/ejechocard/jer278
60. Crean AM, Maredia N, Ballard G, Menezes R, Wharton G, Forster J, et al. 3D echo systematically underestimates right ventricular volumes compared to cardiovascular magnetic resonance in adult congenital heart disease patients with moderate or severe RV dilatation. J Cardiovasc Magn Reson. (2011) 13:1–9. doi: 10.1186/1532-429X-13-78
61. Surkova E, Kovács A, Lakatos BK, Li W. Anteroposterior contraction of the systemic right ventricle: underrecognized component of the global systolic function. JACC Case Rep. (2021) 3:728–30. doi: 10.1016/j.jaccas.2021.02.029
62. Bidviene J, Muraru D, Maffessanti F, Ereminiene E, Kovács A, Lakatos B, et al. Regional shape, global function and mechanics in right ventricular volume and pressure overload conditions: a three-dimensional echocardiography study. Int J Cardiovasc Imaging. (2021) 37:1289–99. doi: 10.1007/s10554-020-02117-8
63. Moceri P, Duchateau N, Gillon S, Jaunay L, Baudouy D, Squara F, et al. Three-dimensional right ventricular shape and strain in congenital heart disease patients with right ventricular chronic volume loading. Eur Heart J Cardiovasc Imaging. (2021) 22:1174–81. doi: 10.1093/ehjci/jeaa189
64. Magunia H, Dietrich C, Langer HF, Schibilsky D, Schlensak C, Rosenberger P, et al. 3D echocardiography derived right ventricular function is associated with right ventricular failure and mid-term survival after left ventricular assist device implantation. Int J Cardiol. (2018) 272:348–55. doi: 10.1016/j.ijcard.2018.06.026
65. Kiernan MS, French AL, Denofrio D, Parmar YJ, Pham DT, Kapur NK, et al. Preoperative three-dimensional echocardiography to assess risk of right ventricular failure after left ventricular assist device surgery. J Card Fail. (2015) 21:189–97. doi: 10.1016/j.cardfail.2014.12.009
66. Vîjîiac A, Onciul S, Guzu C, Verinceanu V, Bătăilă V, Deaconu S, et al. The prognostic value of right ventricular longitudinal strain and 3D ejection fraction in patients with dilated cardiomyopathy. Int J Cardiovasc Imaging. (2021) 37:3233–44. doi: 10.1007/s10554-021-02322-z
67. Surkova E, Muraru D, Genovese D, Aruta P, Palermo C, Badano LP. Relative prognostic importance of left and right ventricular ejection fraction in patients with cardiac diseases. J Am Soc Echocardiogr. (2019) 32:1407–15.e3. doi: 10.1016/j.echo.2019.06.009
68. Muraru D, Badano LP, Nagata Y, Surkova E, Nabeshima Y, Genovese D, et al. Development and prognostic validation of partition values to grade right ventricular dysfunction severity using 3D echocardiography. Eur Heart J Cardiovasc Imaging. (2020) 21:10–21. doi: 10.1093/ehjci/jez233
69. Meng Y, Zhu S, Xie Y, Zhang Y, Qian M, Gao L, et al. Prognostic value of right ventricular 3D speckle-tracking strain and ejection fraction in patients with HFpEF. Front Cardiovasc Med. (2021) 8:1–10. doi: 10.3389/fcvm.2021.694365
70. Vitarelli A, Mangieri E, Terzano C, Gaudio C, Salsano F, Rosato E, et al. Three-dimensional echocardiography and 2D-3D speckle-tracking imaging in chronic pulmonary hypertension: diagnostic accuracy in detecting hemodynamic signs of right ventricular (RV) failure. J Am Heart Assoc. (2015) 4:1–14. doi: 10.1161/JAHA.114.001584
71. Keyl C, Schneider J, Beyersdorf F, Ruile P, Siepe M, Pioch K, et al. Right ventricular function after aortic valve replacement: a pilot study comparing surgical and transcatheter procedures using 3D echocardiography. Eur J Cardiothorac Surg. (2016) 49:966–71. doi: 10.1093/ejcts/ezv227
72. Raina A, Vaidya A, Gertz ZM, Chambers S, Forfia PR. Marked changes in right ventricular contractile pattern after cardiothoracic surgery: implications for post-surgical assessment of right ventricular function. J Heart Lung Transplant. (2013) 32:777–83. doi: 10.1016/j.healun.2013.05.004
73. Tokodi M, Németh E, Lakatos BK, Kispál E, Tősér Z, Staub L, et al. Right ventricular mechanical pattern in patients undergoing mitral valve surgery: a predictor of post-operative dysfunction? ESC Heart Fail. (2020) 7:1246–56. doi: 10.1002/ehf2.12682
74. Lakatos BK, Tokodi M, Assabiny A, Tősér Z, Kosztin A, Doronina A, et al. Dominance of free wall radial motion in global right ventricular function of heart transplant recipients. Clin Transplant. (2018) 32:1–10. doi: 10.1111/ctr.13192
75. Tamborini G, Muratori M, Brusoni D, Celeste F, Maffessanti F, Caiani EG, et al. Is right ventricular systolic function reduced after cardiac surgery? A two- and three-dimensional echocardiographic study. Eur J Echocardiogr. (2009) 10:630–4. doi: 10.1093/ejechocard/jep015
76. Grapsa J, Gibbs JSR, Dawson D, Watson G, Patni R, Athanasiou T, et al. Morphologic and functional remodeling of the right ventricle in pulmonary hypertension by real time three dimensional echocardiography. Am J Cardiol. (2012) 109:906–13. doi: 10.1016/j.amjcard.2011.10.054
77. Moceri P, Duchateau N, Baudouy D, Squara F, Bun SS, Ferrari E, et al. Additional prognostic value of echocardiographic follow-up in pulmonary hypertension-role of 3D right ventricular area strain. Eur Heart J Cardiovasc Imaging. (2022) 23:1562–72. doi: 10.1093/ehjci/jeab240
78. Smith BCF, Dobson G, Dawson D, Charalampopoulos A, Grapsa J, Nihoyannopoulos P. Three-dimensional speckle tracking of the right ventricle: toward optimal quantification of right ventricular dysfunction in pulmonary hypertension. J Am Coll Cardiol. (2014) 64:41–51. doi: 10.1016/j.jacc.2014.01.084
79. Jone PN, Schäfer M, Pan Z, Bremen C, Ivy DD. 3D echocardiographic evaluation of right ventricular function and strain: a prognostic study in paediatric pulmonary hypertension. Eur Heart J Cardiovasc Imaging. (2018) 19:1026–33. doi: 10.1093/ehjci/jex205
80. Jone PN, Schäfer M, Pan Z, Ivy DD. Right ventricular-arterial coupling ratio derived from 3-dimensional echocardiography predicts outcomes in pediatric pulmonary hypertension. Circ Cardiovasc Imaging. (2019) 12:e008176. doi: 10.1161/CIRCIMAGING.118.008176
81. Gavazzoni M, Heilbron F, Badano LP, Radu N, Cascella A, Tomaselli M, et al. The atrial secondary tricuspid regurgitation is associated to more favorable outcome than the ventricular phenotype. Front Cardiovasc Med. (2022) 9:1–11. doi: 10.3389/fcvm.2022.1022755
82. Tomaselli M, Badano LP, Menè R, Gavazzoni M, Heilbron F, Radu N, et al. Impact of correcting the 2D PISA method on the quantification of functional tricuspid regurgitation severity. Eur Heart J Cardiovasc Imaging. (2022) 23:1459–70. doi: 10.1093/ehjci/jeac104
83. Muraru D, Previtero M, Ochoa-Jimenez RC, Guta AC, Figliozzi S, Gregori D, et al. Prognostic validation of partition values for quantitative parameters to grade functional tricuspid regurgitation severity by conventional echocardiography. Eur Heart J Cardiovasc Imaging. (2021) 22:155–65. doi: 10.1093/ehjci/jeaa282
84. Sorajja P, Whisenant B, Hamid N, Naik H, Makkar R, Tadros P, et al. Transcatheter repair for patients with tricuspid regurgitation. N Engl J Med. (2023) 388:1833–42. doi: 10.1056/NEJMoa2300525
85. Vitarelli A, Barillà F, Capotosto L, D’Angeli I, Truscelli G, De Maio M, et al. Right ventricular function in acute pulmonary embolism: a combined assessment by three-dimensional and speckle-tracking echocardiography. J Am Soc Echocardiogr. (2014) 27:329–38. doi: 10.1016/j.echo.2013.11.013
86. Li Y, Liang L, Guo D, Yang Y, Gong J, Zhang X, et al. Right ventricular function predicts adverse clinical outcomes in patients with chronic thromboembolic pulmonary hypertension: a three-dimensional echocardiographic study. Front Med. (2021) 8:1–11. doi: 10.3389/fmed.2021.697396
87. Waziri F, Mellemkjær S, Clemmensen TS, Hjortdal VE, Ilkjær LB, Nielsen SL, et al. Long-term changes of resting and exercise right ventricular systolic performance in patients with chronic thromboembolic pulmonary hypertension following pulmonary thromboendarterectomy – A two-dimensional and three-dimensional echocardiographic study. Echocardiography. (2019) 36:1656–65. doi: 10.1111/echo.14456
88. Cronin B, O’Brien EO, Gu W, Banks D, Maus T. Intraoperative 3-dimensional echocardiography–derived right ventricular volumetric analysis in chronic thromboembolic pulmonary hypertension patients before and after pulmonary thromboendarterectomy. J Cardiothorac Vasc Anesth. (2019) 33:1498–503. doi: 10.1053/j.jvca.2018.09.038
89. Menzel T, Kramm T, Brückner A, Mohr-Kahaly S, Mayer E, Meyer J. Quantitative assessment of right ventricular volumes in severe chronic thromboembolic pulmonary hypertension using transthoracic three-dimensional echocardiography: changes due to pulmonary thromboendarterectomy. Eur J Echocardiogr. (2002) 3:67–72. doi: 10.1053/euje.2001.0129
90. Lakatos BK, Nabeshima Y, Tokodi M, Nagata Y, Tősér Z, Otani K, et al. Importance of nonlongitudinal motion components in right ventricular function: three-dimensional echocardiographic study in healthy volunteers. J Am Soc Echocardiogr. (2020) 33:995–1005.e1. doi: 10.1016/j.echo.2020.04.002
91. Kitano T, Kovács A, Nabeshima Y, Tokodi M, Fábián A, Lakatos BK, et al. Prognostic value of right ventricular strains using novel three-dimensional analytical software in patients with cardiac disease. Front Cardiovasc Med. (2022) 9:1–12. doi: 10.3389/fcvm.2022.837584
92. Keller M, Heller T, Duerr MM, Schlensak C, Nowak-Machen M, Feng YS, et al. Association of three-dimensional mesh-derived right ventricular strain with short-term outcomes in patients undergoing cardiac surgery. J Am Soc Echocardiogr. (2022) 35:408–18. doi: 10.1016/j.echo.2021.11.008
93. Chetan IM, Gergely-Domokos B, Beyer R, Tomoaia R, Cabau G, Vulturar D, et al. The role of 3D speckle tracking echocardiography in the diagnosis of obstructive sleep apnea and its severity. Sci Rep. (2022) 12:1–11. doi: 10.1038/s41598-022-26940-2
94. Satriano A, Pournazari P, Hirani N, Helmersen D, Thakrar M, Weatherald J, et al. Characterization of right ventricular deformation in pulmonary arterial hypertension using three-dimensional principal strain analysis. J Am Soc Echocardiogr. (2019) 32:385–93. doi: 10.1016/j.echo.2018.10.001
95. Jone PN, Duchateau N, Pan Z, Ivy DD, Moceri P. Right ventricular area strain from 3-dimensional echocardiography: mechanistic insight of right ventricular dysfunction in pediatric pulmonary hypertension. J Heart Lung Transplant. (2021) 40:138–48. doi: 10.1016/j.healun.2020.11.005
96. Douglas PS, Morrow R, Ioli A, Reichek N. Left ventricular shape, afterload and survival in idiopathic dilated cardiomyopathy. JACC. (1989) 13:311–5. doi: 10.1016/0735-1097(89)90504-4
97. Tischler MD, Niggel J, Borowski DT, Lewinter MM. Relation between left ventricular shape and exercise capacity in patients with left ventricular dysfunction. J Am Coll Cardiol. (1993) 22:751–7. doi: 10.1016/0735-1097(93)90187-6
98. Maffessanti F, Caiani EG, Tamborini G, Muratori M, Sugeng L, Weinert L, et al. Serial changes in left ventricular shape following early mitral valve repair. Am J Cardiol. (2010) 106:836–42. doi: 10.1016/j.amjcard.2010.04.044
99. Sciancalepore MA, Maffessanti F, Patel AR, Gomberg-Maitland M, Chandra S, Freed BH, et al. Three-dimensional analysis of interventricular septal curvature from cardiac magnetic resonance images for the evaluation of patients with pulmonary hypertension. Int J Cardiovasc Imaging. (2012) 28:1073–85. doi: 10.1007/s10554-011-9913-3
100. Addetia K, Uriel N, Maffessanti F, Sayer G, Adatya S, Kim GH, et al. 3D morphological changes in LV and RV during LVAD ramp studies. JACC Cardiovasc Imaging. (2018) 11:159–69. doi: 10.1016/j.jcmg.2016.12.019
101. Narang A, Bae R, Hong H, Thomas Y, Surette S, Cadieu C, et al. Utility of a deep-learning algorithm to guide novices to acquire echocardiograms for limited diagnostic use. JAMA Cardiol. (2021) 6:624–32. doi: 10.1001/jamacardio.2021.0185
102. Tokodi M, Magyar B, Soós A, Takeuchi M, Tolvaj M, Lakatos BK, et al. Deep learning-based prediction of right ventricular ejection fraction using 2D echocardiograms. JACC Cardiovasc Imaging. (2023) 16:1005–18. doi: 10.1016/j.jcmg.2023.02.017
103. Wang B, Yu Y, Zhang Y, Hao X, Yang S, Zhao H, et al. Right ventricular dysfunction in patients with diffuse large B-cell lymphoma undergoing anthracycline-based chemotherapy: a 2D strain and 3D echocardiography study. Int J Cardiovasc Imaging. (2021) 37:1311–9. doi: 10.1007/s10554-020-02120-z
104. Liu K, Zhang C, Chen B, Li M, Zhang P. Association between right atrial area measured by echocardiography and prognosis among pulmonary arterial hypertension: a systematic review and meta-analysis. BMJ Open. (2020) 10:1–8. doi: 10.1136/bmjopen-2019-031316
105. Tamborini G, Fusini L, Muratori M, Gripari P, Ghulam Ali S, Fiorentini C, et al. Right heart chamber geometry and tricuspid annulus morphology in patients undergoing mitral valve repair with and without tricuspid valve annuloplasty. Int J Cardiovasc Imaging. (2016) 32:885–94. doi: 10.1007/s10554-016-0846-8
Keywords: 3D echocardiography, right ventricle, prognosis, echocardiography, tricuspid valve
Citation: Randazzo M, Maffessanti F, Kotta A, Grapsa J, Lang RM and Addetia K (2023) Added value of 3D echocardiography in the diagnosis and prognostication of patients with right ventricular dysfunction. Front. Cardiovasc. Med. 10:1263864. doi: 10.3389/fcvm.2023.1263864
Received: 20 July 2023; Accepted: 22 November 2023;
Published: 21 December 2023.
Edited by:
Márton Tokodi, Semmelweis University, HungaryReviewed by:
Réka Faludi, University of Pécs, HungaryTetsuji Kitano, University of Occupational and Environmental Health, Japan
Luigi P. Badano, University of Milano Bicocca, Italy
Csaba Jenei, University of Debrecen, Hungary
© 2023 Randazzo, Maffessanti, Kotta, Grapsa, Lang and Addetia. This is an open-access article distributed under the terms of the Creative Commons Attribution License (CC BY). The use, distribution or reproduction in other forums is permitted, provided the original author(s) and the copyright owner(s) are credited and that the original publication in this journal is cited, in accordance with accepted academic practice. No use, distribution or reproduction is permitted which does not comply with these terms.
*Correspondence: Karima Addetia a2FkZGV0aWFAYnNkLnVjaGljYWdvLmVkdQ==