 Yifan Chen1,†Sisi Zhang2,†Yecheng Tao3,4,†Wenyi Hu2Duanbin Li3,4Xiaohua Shen3,4Ya Li3,4Maoning Lin3,4Wenbin Zhang3,4*Xianglan Liu3,4*
 DaQi Xie2*
- 1Department of Cardiology, Zhongda Hospital, School of Medicine, Southeast University, Nanjing, China
- 2Department of Cardiology, Ningbo Ninth Hospital, Ningbo, China
- 3Department of Cardiology, Sir Run Run Shaw Hospital, School of Medicine, Zhejiang University, Hangzhou, China
- 4Key Laboratory of Cardiovascular Intervention and Regenerative Medicine of Zhejiang Province, Hangzhou, China
Background: Lowering lipid variability may be a potential strategy for improving the inflammatory state in patients with coronary heart disease (CHD). This study investigated the association between the variability of non-high-density lipoprotein cholesterol (non-HDL-C) and the neutrophil-to-lymphocyte ratio (NLR).
Methods: This study enrolled 2,711 CHD patients subjected to percutaneous coronary intervention (PCI). During the 1-year follow-up period after PCI, the variability of non-HDL-C was assessed using standard deviation (SD), coefficient of variation (CV), and variability independent of mean (VIM). NLR was calculated as the ratio of absolute neutrophil count to absolute lymphocyte count. The relationship between the non-HDL-C variability and the average NLR level during follow-ups was examined using a linear regression analysis.
Results: The mean age of the patients was 64.4 ± 10.8 years, with 72.4% being male. The average NLR level was 2.98 (2.26–4.14) during the follow-up (1 year after PCI). The variability of non-HDL-C was 0.42 (0.26–0.67) for SD, 0.17 (0.11–0.25) for CV, and 0.02 (0.01–0.03) for VIM. A locally weighted scatterplot smoothing curve indicates that the average levels of NLR increased with increasing variability of non-HDL-C. Regardless of the variability assessment method used, non-HDL-C variability was significantly positively associated with the average NLR level during follow-ups: SD [β (95% CI) = 0.681 (0.366–0.996)], CV [β (95% CI) = 2.328 (1.458–3.197)], and VIM [β (95% CI) = 17.124 (10.532–23.715)]. This association remained consistent across subgroups stratified by age, gender, diabetes, and hypertension.
Conclusion: The variability of non-HDL-C was positively associated with NLR in patients with CHD, suggesting that reducing non-HDL-C variability may improve the low-grade inflammatory state in CHD patients.
Background
Coronary heart disease (CHD) is a major health concern that significantly impacts the quality of life of the patients (1). The pathogenesis of atherosclerosis, the primary underlying cause of CHD, is driven by the fundamental theories of lipid deposition and inflammation (1).
Numerous clinical trials have provided substantial evidence supporting the role of lowering low-density lipoprotein cholesterol (LDL-C) in reducing the development of atherosclerotic plaques and thereby mitigating the incidence of cardiovascular diseases (2–4). Despite achieving the target LDL-C level following the lipid-lowering therapy, CHD patients may still be exposed to a substantial risk of cardiovascular diseases (5). This suggests that LDL-C alone is not the sole determinant of atherosclerotic cardiovascular disease (ASCVD) risk. In recent years, non-high-density lipoprotein cholesterol (non-HDL-C), which encompasses all cholesterol except HDL-C, has garnered increasing attention in research studies (6). A meta-analysis of statin-treated patients has demonstrated that non-HDL-C levels exhibit a superior predictive ability for future major cardiovascular events compared with LDL-C levels (7). Several guidelines also suggest targeting non-HDL-C as a secondary approach in preventing and treating ASCVD (7).
The inflammatory response plays a persistent role in the pathogenesis of CHD and atherosclerosis. While C-reactive protein (CRP) serves as the established marker of inflammation, there is an increasing recognition of the neutrophil-to-lymphocyte ratio (NLR). The NLR, derived from peripheral blood, is a significant indicator of inflammation, reflecting the balance between neutrophils and lymphocytes. Neutrophils are associated with non-specific inflammation processes, whereas lymphocytes indicate immune regulation. A decrease in lymphocyte levels has been linked to the progression of atherosclerosis (8). Moreover, elevated levels of NLR have been identified as prognostic markers for cardiovascular disease (9).
Numerous studies have demonstrated a strong link between lipid metabolism abnormalities and inflammatory conditions, but they primarily focus on the absolute levels of blood lipids (10, 11). The variability of lipids could provide an alternative characteristic of lipids in patients with CHD. Our previous research revealed that variability in the serum levels of HDL-C and LDL-C is predictive of NLR, an inflammatory indicator (12). However, limited attention has been given to the variability of non-HDL-C.
This study aimed to investigate the association between the variability of non-HDL-C and the average level of NLR during the 1-year follow-up period in patients with CHD after undergoing percutaneous coronary intervention (PCI).
Methods
Study population
This retrospective, multicenter observational study was conducted at Sir Run Run Shaw Hospital and its medical consortium hospitals. Eligible CHD patients who received PCI between 2010 and 2019 were systematically enrolled. The inclusion criteria required a diagnosis of CHD with elective PCI, a minimum of three visits during the first-year follow-ups, and comprehensive information about baseline and follow-ups. The exclusion criteria included severe valvular heart disease, peripheral artery disease, congenital heart disease, heart failure with New York Heart Association (NYHA) class IV, hematological disorders, malignant tumors, severe liver and kidney dysfunction, immunological disorder, and severe acute/chronic infection. Skilled interventional cardiologists performed all PCI procedures in accordance with the current guidelines (13) using either the femoral or radial artery approach. All patients underwent their initial PCI and commenced lipid-lowering therapy in the perioperative period to maintain a consistent lipid-lowering regimen throughout the 1-year follow-up period. The Ethics Committee of Sir Run Run Shaw Hospital of Zhejiang University approved the current study (No. 20201217-36).
Neutrophil-to-lymphocyte ratio
Baseline information was obtained by collecting blood samples from the patients 24 h before undergoing PCI. Follow-ups were scheduled in the first year after PCI, and at least three follow-up visits were conducted. Blood samples were taken from the anterior cubital vein after an overnight fast to perform routine laboratory assessments. The counts of neutrophils and lymphocytes in blood were analyzed using an automated blood cell counter. The NLR was calculated as the ratio of the absolute neutrophil count to the absolute lymphocyte count.
Variability of non-HDL-C
Lipid measurements, including total cholesterol (TC), triglycerides (TGs), LDL-C, HDL-C, and very-low-density lipoprotein (VLDL) cholesterol, were performed using a blood chemistry analyzer (Hitachi 747, Tokyo, Japan).
The variability of non-HDL-C was evaluated using three methods: (1) standard deviation (SD) method, the standard deviation of multiple measurements of non-HDL-C during the follow-up; (2) coefficient of variation (CV) method, CV = (SD/mean) × 100(%); and (3) variability independent of mean (VIM) method, VIM = (SD/meanβ) × 100(%), where β is derived from curve fitting based on coefficients of the natural logarithm of SD (14). Based on the variability of non-HDL-C, the participants were categorized into high-, medium-, and low-variability groups.
Definition of covariates
The Health Information System (HIS) provides data on patient demographics and blood biochemistry tests. Patients who were smokers or had quit smoking within 3 months were classified as having a smoking history. Hypertension was defined as three separate instances of diastolic blood pressure at ≥90 mmHg and/or systolic blood pressure at ≥140 mmHg in the absence of antihypertensive medication. Diabetes was diagnosed based on typical symptoms of diabetes (polydipsia, polyuria, unexplained weight loss) with a fasting blood glucose of ≥7.0 mmol/L or a random blood glucose level of ≥11.1 mmol/L.
Statistical analysis
Normally distributed continuous variables were expressed as mean ± standard deviation and compared using the t-test. Non-normally distributed continuous variables were expressed as median (interquartile range) and compared using the Mann–Whitney U test. Categorical variables were expressed as counts (percentages) and compared using the chi-squared test.
A locally weighted scatterplot smoothing (LOESS) curve (span = 1) was employed to depict the relationship between the variability of non-HDL-C and the average level of NLR. The Spearman correlation test was used to assess the correlation among the non-HDL-C variability and the NLR level, with the correlation coefficient ρ being shown.
A linear regression model was used to assess the association between the variability of non-HDL-C and the average level of NLR during follow-ups. The covariates with a univariable analysis (P-value < 0.1) were further adjusted in multivariable regression analysis. Restricted cubic spline analysis with four knots was used to assess the association between the variability of non-HDL-C and the high level of NLR (average NLR of >3), with variability distributions outside the range of 5%–95% being excluded. The covariates with a univariable analysis (P-value < 0.1) were also adjusted in the restricted cubic spline analysis. Subgroup analyses were conducted by using the multivariable linear regression model in patients stratified by age (≥65 or <65 years old), gender (male or female), diabetes (presence or absence), and hypertension (presence or absence).
All statistical analyses were conducted using R software. A significance level of P < 0.05 was considered statistically significant.
Results
Baseline characteristic
This study included a total of 2,711 CHD participants who received elective PCI. The mean age of the participants was 64 years, with 72% being male. Among the patients, 27% reported smoking, 65% had hypertension, and 25% had diabetes. At baseline, the mean levels of NLR and non-HDL-C were 2.63 (1.94–3.96) and 3.32 ± 1.20 mmol/L, respectively. During follow-ups, the mean levels of NLR and non-HDL-C were 2.98 (2.26–4.14) and 2.59 ± 0.74 mmol/L, respectively. Detailed population characteristics, such as demographic information, laboratory test results, and medication details, are presented in Table 1.

Table 1. Population characteristics at baseline and follow-ups.
Trend in average NLR according to non-HDL-C variability
The LOESS curve (span = 1) depicts the trend in the average level of NLR according to non-HDL-C variability. In Figure 1, the average levels of NLR increased with increasing non-HDL-C variability, regardless of the method used for variability assessment. Density plots indicate a right-skewed distribution of non-HDL-C variability.

Figure 1. Trend in the average level of NLR according to non-HDL-C variability. A locally weighted scatterplot smoothing (LOESS) curve (span = 1) was employed to depict the trend in the average level of NLR according to non-HDL-C variability. Non-HDL-C variability was assessed using three measures: standard deviation (A), coefficient of variation (B), and variability independent of the mean (C). The upper density plot illustrates the distribution of lipid variability among patients. Refer to Table 1 for abbreviations.
Correlation matrix among non-HDL-C variability and levels
In the correlation matrix (Figure 2), all P-values for the Spearman tests were less than 0.05. During follow-ups, the average level of non-HDL-C was positively associated with non-HDL-C variability for SD (ρ = 0.48), CV (ρ = 0.13), and VIM (ρ = 0.13), whereas the three variability indicators were highly correlated with each other (SD and CV: ρ = 0.92; SD and VIM: ρ = 0.92; CV and VIM: ρ = 1.00).
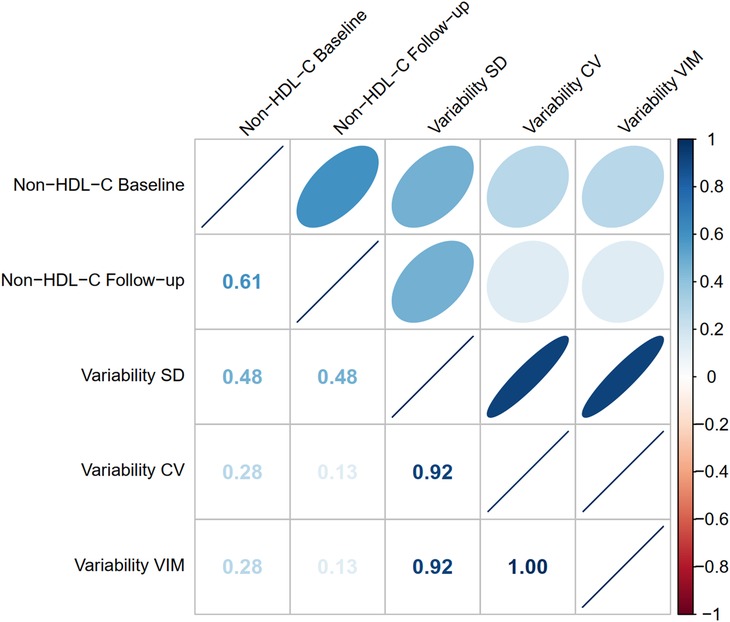
Figure 2. Correlation matrix among non-HDL-C variability and levels. The Spearman method was used to assess the correlation among non-HDL-C variability and levels. The P-values for all Spearman correlation tests were less than 0.05. The correlation coefficient ρ is shown on the lower left. When ρ is +1, it indicates a perfectly positive correlation; when ρ is −1, it indicates a perfectly negative correlation. Refer to Table 1 for abbreviations
Association between bon-HDL-C variability and average NLR levels
Univariable linear regression analysis revealed that several patient characteristics (confounders), such as age, gender, BMI, diabetes, hypertension, history of PCI, follow-up levels of non-HDL-C and HDL-C, hemoglobin, estimated glomerular filtration rate (eGFR), NT-proBNP, uric acid, fasting blood glucose, beta-blocker, statin, ezetimibe, and intensive statin, were associated with the average levels of NLR (P-value < 0.1). These confounders were thus adjusted in the multivariable regression model. In Table 2, the results suggested that increased variability of non-HDL-C was associated with a higher average level of NLR, regardless of the non-HDL-C variability assessed using SD [β (95% CI) = 0.681 (0.366–0.996)], CV [β (95% CI) = 2.328 (1.458–3.197)], or VIM [β (95% CI) = 17.124 (10.532–23.715)].

Table 2. Linear regression analyses between the variability of non-HDL-C and the average level of NLR during follow-ups.
Association between non-HDL-C variability and high inflammatory state
A high inflammatory state is defined as an average NLR level of >3. Based on the adjusted logistic regression model, the restricted cubic spline plot (four knots) reveals that the risk of a high inflammatory state increases with non-HDL-C variability (Figure 3). This association is consistent across the three variability assessment methods. These models were adjusted for potential confounders identified in Table 2 and excluded potential outliers with variability distributed outside the 5%–95% range.
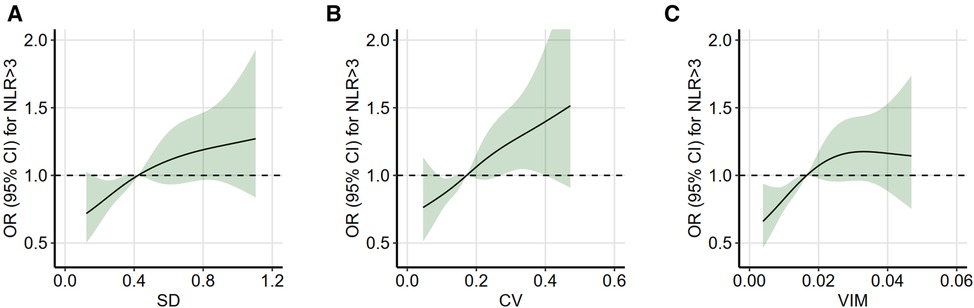
Figure 3. Restricted cubic spline analysis between non-HDL-C variability and high inflammatory state. Restricted cubic spline analysis with four knots was used to assess the association between non-HDL-C variability and high inflammatory state (average NLR of >3), which was based on the logistic regression model. Non-HDL-C variability was assessed using three measures: standard deviation (A), coefficient of variation (B), and variability independent of the mean (C). Variability distributions outside the range of 5%–95% were considered as potential outliers and excluded. The model was adjusted for the significant confounders (P-value of <0.1) identified in the univariable analysis (in Table 2). OR indicates odds ratio; refer to Table 1 for other abbreviations.
Subgroup analysis
Based on the linear regression model, subgroup analysis confirmed a consistent result with the main findings in patients stratified by age (<65 or ≥65 years), gender (male or female), diabetes mellitus (no or yes), and hypertension (no or yes) (Figure 4). The P-values of the regression analysis for all subgroups were less than 0.05. The robustness of this result was also assessed using different variability assessment methods, such as SD, CV, and VIM.
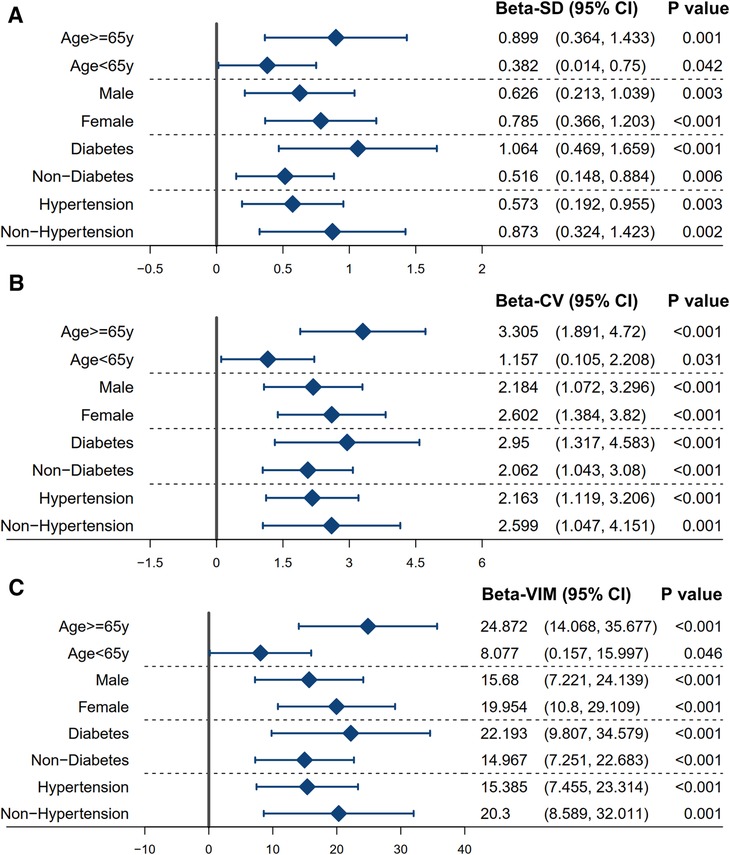
Figure 4. Subgroup analysis between the variability of non-HDL-C and the average level of NLR. The linear regression model was used to assess the association between the variability of non-HDL-C and the average level of NLR in a stratified population. The model was adjusted for the significant confounders (P-value of <0.1) identified in the univariable analysis (in Table 2). The variability of non-HDL-C is measured using the standard deviation (A), coefficient of variation (B), and variability independent of the mean (C). Refer to Table 1 for abbreviations.
Discussion
This study identified a significant association between the variability of non-HDL-C and the average level of NLR during the 1-year follow-up of elective PCI patients, irrespective of age, gender, hypertension, or diabetes.
Atherosclerosis is fundamentally influenced by lipid levels (15). The non-HDL-C and LDL-C parameters have been implicated in the pathogenesis and progression of cardiovascular complications, atherosclerosis, and chronic inflammation (16, 17). Non-HDL-C is a more direct and accurate marker of all atherogenic lipoprotein particles compared with LDL-C. The Bypass Angioplasty Revascularization Investigation (BARI) study found non-HDL-C to be the most traditional lipid parameter with the most prognostic predictive value for CHD patients during 5-year follow-ups (18). In patients with hypertriglyceridemia, the level of LDL-C could be underestimated as a result of enhanced exchange, whereas the levels of non-HDL-C remain unaffected, providing a continuous risk estimate (19). Hence, non-HDL-C is a superior metric for tracking atherosclerotic lipid indicators and overall lipid status during follow-up.
Most research primarily considers the absolute value of the lipid metabolism index, neglecting its variability. However, recent evidence indicates that lipid metabolism variability is equally important to its average level. Previous research had linked LDL-C variability to inflammation (12), whereas another study identified LDL-C variability as a key factor in coronary atherosclerosis progression (20). The variability in the remaining lipids, for instance, Lp(a), TG, and VLDL, has a significant impact on post-PCI CHD patients. This investigation emphasizes non-HDL-C as a comprehensive measure of lipid metabolism characteristics, revealing the correlation between atherogenic cholesterol and inflammatory status. We discovered a significant correlation between the variability of non-HDL-C and the level of NLR, suggesting non-HDL-C variability as an independent predictor of chronic inflammatory status in post-PCI CHD individuals (21).
The specific mechanism by which increased non-HDL-C variability promotes inflammation remains unclear. However, lowering the lipid variability could potentially affect the level of NLR and improve post-PCI patient prognosis. LDL-C, Lp(a), and VLDL in blood might infiltrate and oxidize the arterial wall endothelium, inducing inflammation and endothelial damage. Increased variability of non-HDL-C possibly destabilizes plaque stability mechanisms, resulting in pro-inflammatory factor release and plaque vulnerability. In addition, high variability could indicate a longer duration in which lipids are outside the targeted range, leading to worsened prognosis. Other metabolic and genetic mechanisms may also be involved, such as polymorphism in 3-hydroxy-3-methylglutaryl coenzyme A (HMG-CoA) reductase, VLDL receptor, and LDL-C receptor (22–25). This study observed an underlying influence of non-HDL-C variability on NLR, an inflammatory indicator, in post-PCI CHD patients, irrespective of age, sex, hypertension, and diabetes. The three variability analysis methods employed in this study revealed a robust link, emphasizing the significant, stable inflammatory feedback effect of non-HDL-C unaffected by other factors.
The well-established association between NLR and adverse outcomes in patients undergoing PCI is noteworthy. For instance, Hong et al. (26) demonstrated that among individuals with acute myocardial infarction undergoing PCI, a high level of NLR post-PCI was linked to an elevated risk of large-sized infarctions and unfavorable clinical outcomes. Furthermore, a meta-analysis (27) has corroborated NLR as a predictive factor for both hospitalization rates and long-term prognosis in patients experiencing acute ST-segment elevation myocardial infarction post-PCI. In addition, Kim et al. (28) provided compelling evidence that a high level of NLR reliably predicts cardiac mortality following PCI, particularly in patients with pre-existing heart failure or myocardial injury. These collective findings underscore the significant prognostic value of NLR in evaluating the outcomes of coronary artery disease (CAD) patients undergoing PCI.
This study contributes several notable strengths to the field of cardiovascular research. First, it sheds light on an understudied dimension of non-HDL-C variability and its relationship with inflammation levels, as measured by NLR, in patients undergoing elective PCI. By focusing on non-HDL-C as a comprehensive lipid measure, the study expands our understanding beyond traditional markers like LDL-C, providing a more comprehensive assessment of atherogenic lipoprotein particles. Moreover, the analysis considers the variability and stability of lipid levels, moving beyond average values and deepening our knowledge of lipid metabolism in cardiovascular health. In addition, the study encompasses diverse patient subgroups, such as age, gender, and individuals with hypertension and diabetes, thus enhancing the generalizability of the findings. Finally, the inclusion of three different methods for variability analysis strengthens the robustness of the results. This innovative approach may pave the way for future research, encouraging exploration beyond conventional lipid measures and emphasizing the significance of lipid variability in studying cardiovascular diseases.
Among patients undergoing PCI, Lee et al. conducted a study investigating the relationship between non-HDL-C variability and cardiovascular outcomes (29). Notably, the patient characteristics in their study closely resemble those in our cohort [mean follow-up non-HDL-C: 2.72 ± 0.69 vs. 2.59 ± 0.74 mmol/L; visit-to-visit non-HDL-C variability (standard deviation): 0.44 vs. 0.42 mmol/L]. The Kaplan–Meier analysis revealed a significant increase in the risk of major adverse cardiovascular events in the highest quartile (Q4) compared with the lower three quartiles (Q1–Q3). Based on these findings, we posit that non-HDL-C variability should be restricted to levels below the 75th percentile within the PCI population to mitigate the risk of cardiovascular events.
Despite its contributions, this study has several limitations. First, its retrospective design may have introduced a selection bias. Second, the focus on post-PCI inflammation levels without follow-up on endpoint event outcomes limits the comprehensive assessment of the study. Third, using NLR as an inflammatory indicator may not capture the full complexity of the inflammatory response. Future studies incorporating molecular biology techniques to evaluate additional inflammatory markers such as tumor necrosis factors and interleukins would provide a more comprehensive understanding. Fourth, some characteristics of lipid-lowering therapy that are difficult to assess may still influence the variability of lipids. Finally, the relatively short follow-up period may not capture long-term interactions between lipid metabolism and inflammation. To address these limitations, future prospective randomized controlled trials with larger sample sizes are recommended.
Conclusion
The variability of non-HDL-C is positively associated with NLR in patients with CHD, suggesting that reducing non-HDL-C variability may improve the low-grade inflammatory state in patients with CHD.
Data availability statement
The raw data supporting the conclusions of this article will be made available by the authors, without undue reservation.
Ethics statement
This study was approved by the Ethics Committee of Sir Run Run Shaw Hospital of Zhejiang University (No. 20201217-36).
Author contributions
YC: Data curation, Software, Writing – original draft. SZ: Software, Validation, Writing – original draft. YT: Data curation, Software, Writing – original draft. WH: Writing – review & editing. DL: Funding acquisition, Writing – review & editing. XS: Software, Writing – review & editing. YL: Writing – review & editing. ML: Supervision, Writing – review & editing. WZ: Funding acquisition, Methodology, Supervision, Writing – review & editing. XL: Data curation, Funding acquisition, Methodology, Writing – review & editing. DX: Funding acquisition, Software, Supervision, Writing – review & editing.
Funding
This study was supported by grants from the National Natural Science Foundation of China (82100421), the Natural Science Foundation of Zhejiang Province (LQ21H020006), the Health and Technology Plan of Zhejiang Province (2022KY345, 2018KY460), and the Medical Science and Technology Project of Ningbo (2020Y34).
Conflict of interest
The authors declare that the research was conducted in the absence of any commercial or financial relationships that could be construed as a potential conflict of interest.
Publisher's note
All claims expressed in this article are solely those of the authors and do not necessarily represent those of their affiliated organizations, or those of the publisher, the editors and the reviewers. Any product that may be evaluated in this article, or claim that may be made by its manufacturer, is not guaranteed or endorsed by the publisher.
References
1. Rahman MS, Woollard K. Atherosclerosis. Adv Exp Med Biol. (2017) 1003:121–44. doi: 10.1007/978-3-319-57613-8_7
2. Li D, Xu T, Xie D, Wang M, Sun S, Wang M, et al. Efficacy of mobile-based cognitive behavioral therapy on lowering low-density lipoprotein cholesterol levels in patients with atherosclerotic cardiovascular disease: multicenter, prospective randomized controlled trial. J Med Internet Res. (2023) 25:e44939. doi: 10.2196/44939
3. Ference BA, Yoo W, Alesh I, Mahajan N, Mirowska KK, Mewada A, et al. Effect of long-term exposure to lower low-density lipoprotein cholesterol beginning early in life on the risk of coronary heart disease: a Mendelian randomization analysis. J Am Coll Cardiol. (2012) 60:2631–9. doi: 10.1016/j.jacc.2012.09.017
4. Li D, Chen Z, Shan Y, Hu T, Hong X, Zhu J, et al. Liver enzymes mediate the association between aldehydes co-exposure and hypertriglyceridemia. Ecotoxicol Environ Saf. (2023) 263:115346. doi: 10.1016/j.ecoenv.2023.115346
5. Cholesterol Treatment Trialists Collaboration, Baigent C, Blackwell L, Emberson J, Holland LE, Reith C, Bhala N, et al. Efficacy and safety of more intensive lowering of LDL cholesterol: a meta-analysis of data from 170,000 participants in 26 randomised trials. Lancet. (2010) 376:1670–81. doi: 10.1016/S0140-6736(10)61350-5
6. Levinson SS. Non-high-density lipoprotein cholesterol and guidelines for cholesterol lowering in recent history. Lab Med. (2020) 51:14–23. doi: 10.1093/labmed/lmz032
7. Ramjee V, Sperling LS, Jacobson TA. Non-high-density lipoprotein cholesterol versus apolipoprotein B in cardiovascular risk stratification: do the math. J Am Coll Cardiol. (2011) 58:457–63. doi: 10.1016/j.jacc.2011.05.009
8. Oncel RC, Ucar M, Karakas MS, Akdemir B, Yanikoglu A, Gulcan AR, et al. Relation of neutrophil-to-lymphocyte ratio with GRACE risk score to in-hospital cardiac events in patients with ST-segment elevated myocardial infarction. Clin Appl Thromb Hemost. (2015) 21:383–8. doi: 10.1177/1076029613505763
9. Paul AM, Mhatre SD, Cekanaviciute E, Schreurs AS, Tahimic CGT, Globus RK, et al. Neutrophil-to-lymphocyte ratio: a biomarker to monitor the immune Status of astronauts. Front Immunol. (2020) 11:564950. doi: 10.3389/fimmu.2020.564950
10. Zhang C, Wang K, Yang L, Liu R, Chu Y, Qin X, et al. Lipid metabolism in inflammation-related diseases. Analyst. (2018) 143:4526–36. doi: 10.1039/C8AN01046C
11. Naka KK, Bechlioullis A, Marini A, Sionis D, Vakalis K, Triantis G, et al. Interleukin-1 genotypes modulate the long-term effect of lipoprotein(a) on cardiovascular events: the Ioannina study. J Clin Lipidol. (2018) 12:338–47. doi: 10.1016/j.jacl.2017.12.004
12. Zhao L, Xu T, Li Y, Luan Y, Lv Q, Fu G, et al. Variability in blood lipids affects the neutrophil to lymphocyte ratio in patients undergoing elective percutaneous coronary intervention: a retrospective study. Lipids Health Dis. (2020) 19:124. doi: 10.1186/s12944-020-01304-9
13. Levine GN, Bates ER, Blankenship JC, Bailey SR, Bittl JA, Cercek B, et al. 2011 ACCF/AHA/SCAI guideline for percutaneous coronary intervention: executive summary: a report of the American College of Cardiology Foundation/American Heart Association Task Force on Practice Guidelines and the Society for Cardiovascular Angiography and Interventions. Catheter Cardiovasc Interv. (2012) 79:453–95. doi: 10.1002/ccd.23438
14. Rothwell PM, Howard SC, Dolan E, O'Brien E, Dobson JE, Dahlöf B, et al. Prognostic significance of visit-to-visit variability, maximum systolic blood pressure, and episodic hypertension. Lancet. (2010) 375:895–905. doi: 10.1016/S0140-6736(10)60308-X
15. Carr SS, Hooper AJ, Sullivan DR, Burnett JR. Non-HDL-cholesterol and apolipoprotein B compared with LDL-cholesterol in atherosclerotic cardiovascular disease risk assessment. Pathology. (2019) 51:148–54. doi: 10.1016/j.pathol.2018.11.006
16. Wu MF, Xu KZ, Guo YG, Yu J, Wu Y, Lin LM. Lipoprotein(a) and atherosclerotic cardiovascular disease: current understanding and future perspectives. Cardiovasc Drugs Ther. (2019) 33:739–48. doi: 10.1007/s10557-019-06906-9
17. Shoji T, Masakane I, Watanabe Y, Iseki K, Tsubakihara Y. Committee of Renal Data Registry, Japanese Society for Dialysis Therapy. Elevated non-high-density lipoprotein cholesterol (non-HDL-C) predicts atherosclerotic cardiovascular events in hemodialysis patients. Clin J Am Soc Nephrol. (2011) 6:1112–20. doi: 10.2215/CJN.09961110
18. Bittner V, Hardison R, Kelsey SF, Weiner BH, Jacobs AK, Sopko G, et al. Non-high-density lipoprotein cholesterol levels predict five-year outcome in the bypass angioplasty revascularization investigation (BARI). Circulation. (2002) 106:2537–42. doi: 10.1161/01.CIR.0000038496.57570.06
19. Davidson MH. Low-density lipoprotein cholesterol, non-high-density lipoprotein, apolipoprotein, or low-density lipoprotein particle: what should clinicians measure? J Am Coll Cardiol. (2012) 60:2616–7. doi: 10.1016/j.jacc.2012.06.065
20. Clark D 3rd, Nicholls SJ, St John J, Elshazly MB, Kapadia SR, Tuzcu EM, et al. Visit-to-visit cholesterol variability correlates with coronary atheroma progression and clinical outcomes. Eur Heart J. (2018) 39:2551–8. doi: 10.1093/eurheartj/ehy209
21. Zou X, Wang H, Cai L, Li K, Zhang W, Ding Y, et al. Effects of serum lipid smoothness on the progression and vulnerability of atherosclerotic plaques in rabbits. PLoS One. (2014) 9:e93686. doi: 10.1371/journal.pone.0093686
22. Couture P, Brun LD, Szots F, Lelievre M, Gaudet D, Despres JP, et al. Association of specific LDL receptor gene mutations with differential plasma lipoprotein response to simvastatin in young French Canadians with heterozygous familial hypercholesterolemia. Arterioscler Thromb Vasc Biol. (1998) 18:1007–12. doi: 10.1161/01.ATV.18.6.1007
23. Heath KE, Gudnason V, Humphries SE, Seed M. The type of mutation in the low density lipoprotein receptor gene influences the cholesterol-lowering response of the HMG-CoA reductase inhibitor simvastatin in patients with heterozygous familial hypercholesterolaemia. Atherosclerosis. (1999) 143:41–54. doi: 10.1016/S0021-9150(98)00274-3
24. Kronenberg F. Human genetics and the causal role of lipoprotein(a) for various diseases. Cardiovasc Drugs Ther. (2016) 30:87–100. doi: 10.1007/s10557-016-6648-3
25. Hiltunen TP, Luoma JS, Nikkari T, Yla-Herttuala S. Expression of LDL receptor, VLDL receptor, LDL receptor-related protein, and scavenger receptor in rabbit atherosclerotic lesions: marked induction of scavenger receptor and VLDL receptor expression during lesion development. Circulation. (1998) 97:1079–86. doi: 10.1161/01.CIR.97.11.1079
26. Hong D, Choi KH, Song YB, Lee JM, Park TK, Yang JH, et al. Prognostic implications of post-percutaneous coronary intervention neutrophil-to-lymphocyte ratio on infarct size and clinical outcomes in patients with acute myocardial infarction. Sci Rep. (2019) 9:9646. doi: 10.1038/s41598-019-46117-8
27. Zhang S, Diao J, Qi C, Jin J, Li L, Gao X, et al. Predictive value of neutrophil to lymphocyte ratio in patients with acute ST segment elevation myocardial infarction after percutaneous coronary intervention: a meta-analysis. BMC Cardiovasc Disord. (2018) 18:75. doi: 10.1186/s12872-018-0812-6
28. Kim SC, Sun KH, Choi DH, Lee YM, Choi SW, Kang SH, et al. Prediction of long-term mortality based on neutrophil-lymphocyte ratio after percutaneous coronary intervention. Am J Med Sci. (2016) 351:467–72. doi: 10.1016/j.amjms.2015.12.022
Keywords: variability, lipid, percutaneous coronary intervention, neutrophil-to-lymphocyte ratio, coronary heart disease
Citation: Chen Y, Zhang S, Tao Y, Hu W, Li D, Shen X, Li Y, Lin M, Zhang W, Liu X and Xie D (2023) Association between the variability of non-high-density lipoprotein cholesterol and the neutrophil-to-lymphocyte ratio in patients with coronary heart disease. Front. Cardiovasc. Med. 10:1254125. doi: 10.3389/fcvm.2023.1254125
Received: 6 July 2023; Accepted: 9 October 2023;
Published: 22 November 2023.
Edited by:
Tommaso Gori, Johannes Gutenberg University Mainz, GermanyReviewed by:
Alvaro Aceña, University Hospital Fundación Jiménez Díaz, SpainAlessia D'Aiello, Agostino Gemelli University Polyclinic (IRCCS), Italy
© 2023 Chen, Zhang, Tao, Hu, Li, Shen, Li, Lin, Zhang, Liu and Xie. This is an open-access article distributed under the terms of the Creative Commons Attribution License (CC BY). The use, distribution or reproduction in other forums is permitted, provided the original author(s) and the copyright owner(s) are credited and that the original publication in this journal is cited, in accordance with accepted academic practice. No use, distribution or reproduction is permitted which does not comply with these terms.
*Correspondence: Wenbin Zhang MzMxMzAxMUB6anUuZWR1LmNu Xianglan Liu bGl1eGxAemp1LmVkdS5jbg== DaQi Xie WERRMTI3QDE2My5jb20=
†These authors have contributed equally to this work