
95% of researchers rate our articles as excellent or good
Learn more about the work of our research integrity team to safeguard the quality of each article we publish.
Find out more
ORIGINAL RESEARCH article
Front. Cardiovasc. Med. , 26 July 2023
Sec. Cardiovascular Epidemiology and Prevention
Volume 10 - 2023 | https://doi.org/10.3389/fcvm.2023.1216693
 Yi Zheng1
 Tianyi Huang1,2Marta Guasch-Ferre3,4,5Jaime Hart1,6Francine Laden1,6,7
 Jorge Chavarro1,3,7Eric Rimm1,3,7Brent Coull6,8
 Hui Hu1*
Background: The American Heart Association's Life's Essential 8 (LE8) is an updated construct of cardiovascular health (CVH), including blood pressure, lipids, glucose, body mass index, nicotine exposure, diet, physical activity, and sleep health. It is challenging to simultaneously measure all eight metrics at multiple time points in most research and clinical settings, hindering the use of LE8 to assess individuals' overall CVH trajectories over time.
Materials and methods: We obtained data from 5,588 participants in the Nurses' Health Studies (NHS, NHSII) and Health Professionaĺs Follow-up Study (HPFS), and 27,194 participants in the 2005–2016 National Health and Nutrition Examination Survey (NHANES) with all eight metrics available. Individuals' overall cardiovascular health (CVH) was determined by LE8 score (0–100). CVH-related factors that are routinely collected in many settings (i.e., demographics, BMI, smoking, hypertension, hypercholesterolemia, and diabetes) were included as predictors in the base models of LE8 score, and subsequent models further included less frequently measured factors (i.e., physical activity, diet, blood pressure, and sleep health). Gradient boosting decision trees were trained with hyper-parameters tuned by cross-validations.
Results: The base models trained using NHS, NHSII, and HPFS had validated root mean squared errors (RMSEs) of 8.06 (internal) and 16.72 (external). Models with additional predictors further improved performance. Consistent results were observed in models trained using NHANES. The predicted CVH scores can generate consistent effect estimates in associational studies as the observed CVH scores.
Conclusions: CVH-related factors routinely measured in many settings can be used to accurately estimate individuals' overall CVH when LE8 metrics are incomplete.
Cardiovascular disease (CVD) is the top cause of death both in the United States (US) and globally (1). It is estimated that 80% of CVD is preventable (2). Conventional CVD prevention strategies emphasize the optimizations of classical risk factors such as blood pressure and lipids. However, it is challenging to communicate CVD risk to young individuals with a low absolute 10-year CVD risk. To address this, the American Heart Association (AHA) introduced the Life's Simple 7 (LS7) in 2010, to assess and promote cardiovascular health (CVH) (3), which anchors CVD prevention in health rather than disease to prompt attention to primordial prevention across life course (4). The AHA defined ideal CVH based on seven metrics (LS7), including blood pressure, total cholesterol, glucose, body mass index (BMI), cigarette smoking, diet, and physical activity (3). To better account for factors predictive of CVH, the AHA recently introduced Life's Essential 8 (LE8), an updated construct of CVH with revised quantitative assessment of the 7 existing metrics as well as one new metric focusing on sleep health (5). Previous studies have shown that CVH is not only associated with CVD (6, 7), but also non-CVD outcomes such as cancer (8), cognitive impairment (9), depression (10), and all-cause mortality (11).
In 2016, the AHA announced an ambitious initiative, One Brave Idea (12), with the goal to end coronary heart disease and its consequences. An interim target called “50 × 50 × 50” was proposed in 2018, with the goal of achieving ideal CVH among “≥50% segments of the population ≤50 years old by 2050 or sooner” (13). Previous estimates based on LS7 showed that the prevalence of ideal CVH in the US population is around 50% at 10 years of age and declines to less than 10% by 50 years of age (14, 15). Similarly, recent estimates based on LE8 showed that compared with individuals aged 12–19 years, the mean CVH score is 13.9% lower among those aged 40–64 years (16). Therefore, it is important to understand population-level CVH trajectories and identify factors contributing to different CVH trajectories to promote and preserve CVH. However, to date, population-level CVH estimates are mainly cross-sectional (14, 17–22). Very few studies have examined individuals' CVH trajectories over time (23–28). Among these existing studies, CVH trajectories were determined based on either CVH status sparsely measured over time (e.g., 3 time points in ≥10 years) (23–25), or modified versions of LS7 where not all CVH metrics were considered (25–28). This is mainly due to the challenges of having all CVH metrics simultaneously measured at multiple time points, which substantially hindered the adoption of LE8 to promote and preserve CVH across life course. It remains unclear regarding the performance of a subset of LE8 metrics in estimating overall CVH defined by the full LE8 metrics.
To address this limitation, leveraging data from the Nurses' Health Study (NHS), the Nurses' Health Study II (NHSII), the Health Professional's Follow-up Study (HPFS), and the 2005–2016 National Health and Nutrition Examination Survey (NHANES), we developed and validated models to estimate individuals' overall CVH using CVH-related factors that are routinely collected in many research and clinical settings to enable longitudinal assessment of CVH trajectories even when not all eight CVH metrics are available simultaneously.
We obtained data from three large nationwide prospective cohorts in the U.S., including NHS and NHSII, with 121,700 and 116,429 female registered nurses recruited in 1976 and 1989, respectively, as well as HPFS, with 51,529 male health professionals recruited in 1986. We also obtained data from the 2005–2016 NHANES, a complex survey with nationally representative samples of noninstitutionalized U.S. adults. A total of 5,588 participants from the cohorts (i.e., 4,114 from NHS, 676 from NHSII, and 798 from HPFS) and 27,194 participants aged 18 and older from the 2005–2016 NHANES with all eight CVH metrics measured.
Blood samples were collected in NHS in 1989–1990 (n = 32,826), NHSII in 1996–1999 (n = 29,611), and HPFS in 1993–1995 (n = 18,159). Among them, a total of 5,030, 785, and 1,388 participants in NHS, NHSII, and HPFS, respectively, had both hemoglobin A1c (HbA1c) and blood lipids measured in the same blood sample. In the 2005–2016 NHANES, HbA1c was measured in whole blood biospecimen using chromatogram, and blood lipids was measured in serum sample using an enzymatic assay (29). Measures of the other six metrics (i.e., BMI, nicotine exposure, blood pressure, diet, physical activity, and sleep health) were obtained in NHS, NHSII, and HPFS based on self-reports from questionnaires closest to blood sample collections (Supplementary Table S1). Previous validation studies showed that these self-reported measures are highly accurate (30–44). Participants in NHS, NHSII, HPFS cohorts were asked about their typical systolic and diastolic blood pressure (i.e., systolic pressure: <105, 105–114, 115–124, 125–134, 135–144, 145–154, 155–164, 165–174, and ≥175 mmHg; diastolic pressure: <65, 65–74, 75–84, 85–89, 90–94, 95–104, and ≥105 mmHg). In NHANES, participants' blood pressures were consecutively measured multiple times with at least 5 min of break between measurements, and the average blood pressure was used. Self-reported history of medications on hypertension (i.e., thiazide diuretics, alpha blockers, beta blockers, calcium channel blockers, angiotensin-converting enzyme inhibitors, Lasix, and other anti-hypertensive medications), diabetes (i.e., insulin, and oral hypoglycemic medications), and hypercholesterolemia (i.e., statin and other cholesterol-lowering medications) was used to determine controlled treatments in both the cohorts and NHANES. BMI was calculated based on self-reported weight and height in the cohorts, while in NHANES, weight and height were measured by physical examinations. Nicotine exposure was assessed by self-reports in both the cohorts and NHANES. In the cohorts, physical activity was computed by summing up the metabolic equivalent of task (MET) hours of each individual activity per week according to corresponding MET score and self-reported hours of the activity (43, 45). In NHANES, physical activity was determined based on self-reported frequency and duration of moderate- and vigorous-intensity leisure time activities, with 4 MET scores assigned to each minute of moderate activities and 8 MET scores assigned to each minute of vigorous activities. Diet was assessed by a >130-item validated food frequency questionnaire in the cohorts (36, 38–42), and by 24-hour dietary recall in NHANES. Sleep health was assessed by self-reported average sleep hours during a 24-hours period in both NHANES and the cohorts.
The eight individual CVH metrics (i.e., blood pressure, lipids, glucose, BMI, nicotine exposure, diet, physical activity, and sleep health) were scored with a range from 0 to 100. Table 1 shows the detailed scoring criteria for each metric. Specifically, we used the same criteria recommended by the AHA to assess blood lipids, nicotine exposure, and physical activity (3, 5). For blood pressure, we used a slightly different sets of cut points because (1) these were the cut-points used in the questionnaires for NHS, NHSII, and HPFS, (2) although the American College of Cardiology (ACC)/AHA hypertension clinical practice guideline set 130/80 mmHg as the cut point for hypertension diagnosis (46), the International Society of Hypertension Global Hypertension Practice Guidelines set average day time ambulatory blood pressures or home blood pressure >135/85 mmHg as the criteria for hypertension diagnosis (47), and (3) it has been shown that any blood pressure over 115/75 increases the risk of CVD (48–50). HbA1c was used to assess the glucose metric since fasting blood glucose was not collected in NHS, NHSII, and HPFS. Moreover, HbA1c test is recommended and clinically used to detect diabetes with high validity and cost-effectiveness (51, 52), and widely used in other studies to assess CVH (53–56). In addition, alternative healthy eating index 2010 (AHEI-2010) was used to measure adherence to a healthy diet pattern based on foods and nutrients that are predictive of chronic disease risk and has been used to assess diet-disease associations in many published studies (57–59). Percentiles of AHEI-2010 scores were used to assess status of diet.

Table 1. Scoring criteria of CVH metrics based on life's essential 8.
The outcome in the study is the overall CVH based on all eight LE8 metrics. We generated both a continuous and two binary measures of overall CVH. The continuous overall CVH score was calculated by averaging scores of all eight LE8 metrics (range: 0–100). In addition, we also categorized the continuous CVH score into three categories (i.e., ≥80: high, 50–80: moderate, and <50: low), and two binary outcomes were generated comparing individuals with (1) high CVH vs. moderate or low CVH and (2) low CVH vs. moderate or high CVH.
Supplementary Figure S1 shows the availabilities of each predictor in NHS, NHSII, and HPFS. We first included predictors that are widely available in NHS, NHSII, and HPFS. These predictors included (1) demographic factors such as age (years), sex (female or male), race/ethnicity (non-Hispanic white, non-Hispanic black, Hispanic, and others), (2) CVH-related factors (measured biennially) such as self-reported hypertension (yes or no), self-reported diabetes (yes or no), and self-reported hypercholesterolmia (yes or no), and (3) CVH metrics (measured biennially) including BMI (both the original BMI value and BMI score defined by LE8) and nicotine exposure (defined by LE8). We further included other CVH metrics that are less frequently collected (i.e., approximately every 4 years) in NHS, NHSII, and HPFS as predictors (Supplementary Figure S1), including self-reported blood pressure, physical activity, diet, and sleep health assessed based on LE8.
Descriptive analyses were conducted to examine the distribution of participants' demographics, individual CVH metrics, and overall CVH. Two groups of models were trained separately using data from the cohorts (i.e., NHS, NHSII, and HPFS) and NHANES. Figure 1 shows the model training and testing pipelines. Each group of models contain 16 sets of models each with different predictors: we start by training the base models which included predictors that are routinely collected in NHS, NHSII, and HPFS, such as demographic factors (i.e., age, sex, race/ethnicity), CVH-related factors (i.e., hypertension, hypercholesterolemia, and diabetes), as well as CVH metrics (i.e., BMI and nicotine exposure). We then further included CVH metrics (i.e., blood pressure, physical activity, diet, and sleep health) that are less frequently collected as predictors in additional models (15 sets of models). Of note, percentiles of AHEI-2010 scores were generated separately in the cohorts (i.e., NHS, NHSII, and HPFS) and NHANES for model trainings, and the corresponding cut-points were used to determine diet status in external validations. All models were trained using gradient boosting decision trees implemented by CatBoost (gradient boosting with categorical features support), a highly efficient ensemble-based machine learning model (60). Following the best practice in the field, we randomly split the data into a training set (80%) and a testing set (20%). The training sets were used to tune hyperparameters (i.e., number of iterations, number of trees, learning rate, L2 regularization, tree depth, and border count) using grid searches based on 4-fold cross-validated RMSEs (root mean square errors) for the continuous overall CVH score and AUCs (areas under the receiver operator characteristic curve) for the two binary outcomes (i.e., high CVH vs. moderate/low CVH and low CVH vs. moderate/high CVH). The testing set was then used to perform internal validation. External validations were also conducted using external testing data (e.g., models trained using NHS, NHSII, and HPFS data were externally validated using NHANES data and vice versa). To examine the robustness of model performance in different cohorts, we also generated stratified internal validation results in NHS, NHSII, and HPFS, separately.
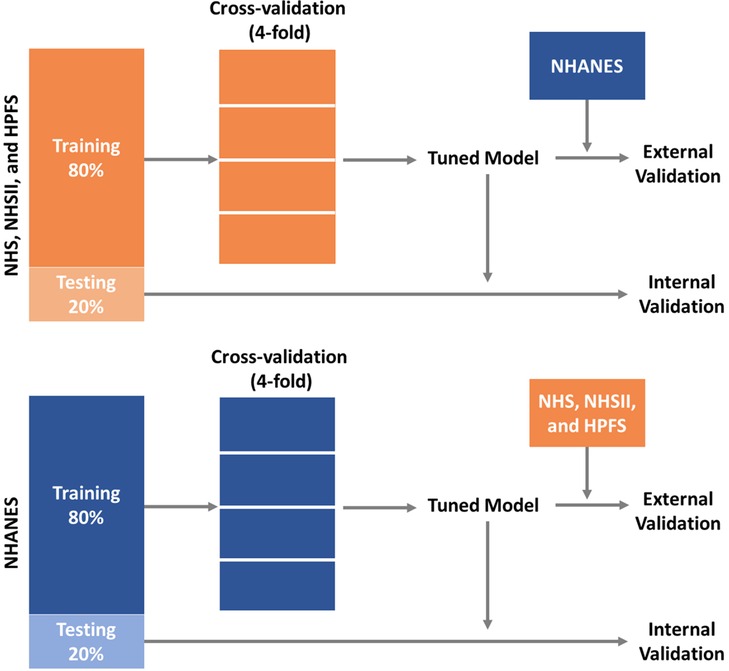
Figure 1. Training and validation pipelines for prediction models of CVH using data from NHS, NHSII, and HPFS, and the 2005–2016 NHANES. CVH, cardiovascular health; HPFS, Health Professional's Follow-up Study; NHANES, the National Health and Nutrition Examination Survey; NHS, Nurses’ Health Study; NHSII, Nurses’ Health Study II.
To further examine the performance of this approach in real world settings, we conducted sensitivity analyses by assessing whether the predicted CVH scores can generate consistent effect estimates in associational studies. Cox proportional hazards models were used to assess the associations between all-cause mortality and both the observed and predicted LE8 scores in the internal testing sets in NHS, NHSII, and HPFS as well as the NHANES. Hazard ratios (HR) with 95% confidence intervals (CIs) were generated. To account for the complex survey design of the NHANES, a 12-year weight was calculated by dividing the original 2-year weight by 6 for each individual. Models were adjusted for age (continuous), sex (female and male), and race/ethnicity (non-Hispanic White, non-Hispanic Black, Hispanic, and others), and marital status (never married, married or living with partner, and previously married). In addition, in the NHANES, we further adjusted for education (<high school, high school or equivalent, some college, college/graduate or above) and family poverty income ratio (PIR: <1, 1–2, and ≥2).
It has been suggested that the newly introduced LE8 score (0–100 points) is highly correlated with the previous LS7 score (0–14 points) (16). To assess the robustness of our approach, we have conducted sensitivity analyses using CVH measures based on LS7 as the outcomes (Supplementary Table S2). Specifically, the seven individual LS7 metrics (i.e., blood pressure, HbA1c, total cholesterol, smoking, BMI, physical activity, and diet) were categorized into 3 levels: poor (0 point), intermediate (1 point), and ideal (2 points). A continuous CVH score was then calculated by summing up scores of all the seven metrics (range: 0–14). We also generated seven binary measures of overall CVH based on the number of ideal CVH metrics. We used the same modelling pipeline for LS7, with a total of 8 sets of predictors. Similarly, Cox proportional hazards models were also fitted in the internal testing sets to assess the associations between all-cause mortality and both the observed and predicted LS7 scores.
All analyses were conducted using R version 4.1.0 with CatBoost models implemented using the “catboost” R package (61).
A total of 5,588 and 27,194 participants from the NHS, NHSII, and HPFS cohorts and the 2005–2016 NHANES with complete information on all eight CVH metrics were included in this study, respectively. Table 2 shows the distributions of participants' demographic characteristics, medical history, overall LE8 score, and individual LE8 metric scores. Compared with participants in the NHANES, participants in NHS, NHSII, and HPFS were older, more likely to be non-Hispanic White, less likely to have hypertension, diabetes, and hypercholesterolemia, and more likely to have better overall CVH. In addition, participants in NHS, NHSII, and HPFS were also more likely to have more optimal individual CVH metrics including BMI, nicotine exposure, physical activity, diet, and sleep health, while those in the NHANES were more likely to have better status in blood pressure, HbA1c, and blood lipids (all p < 0.001).
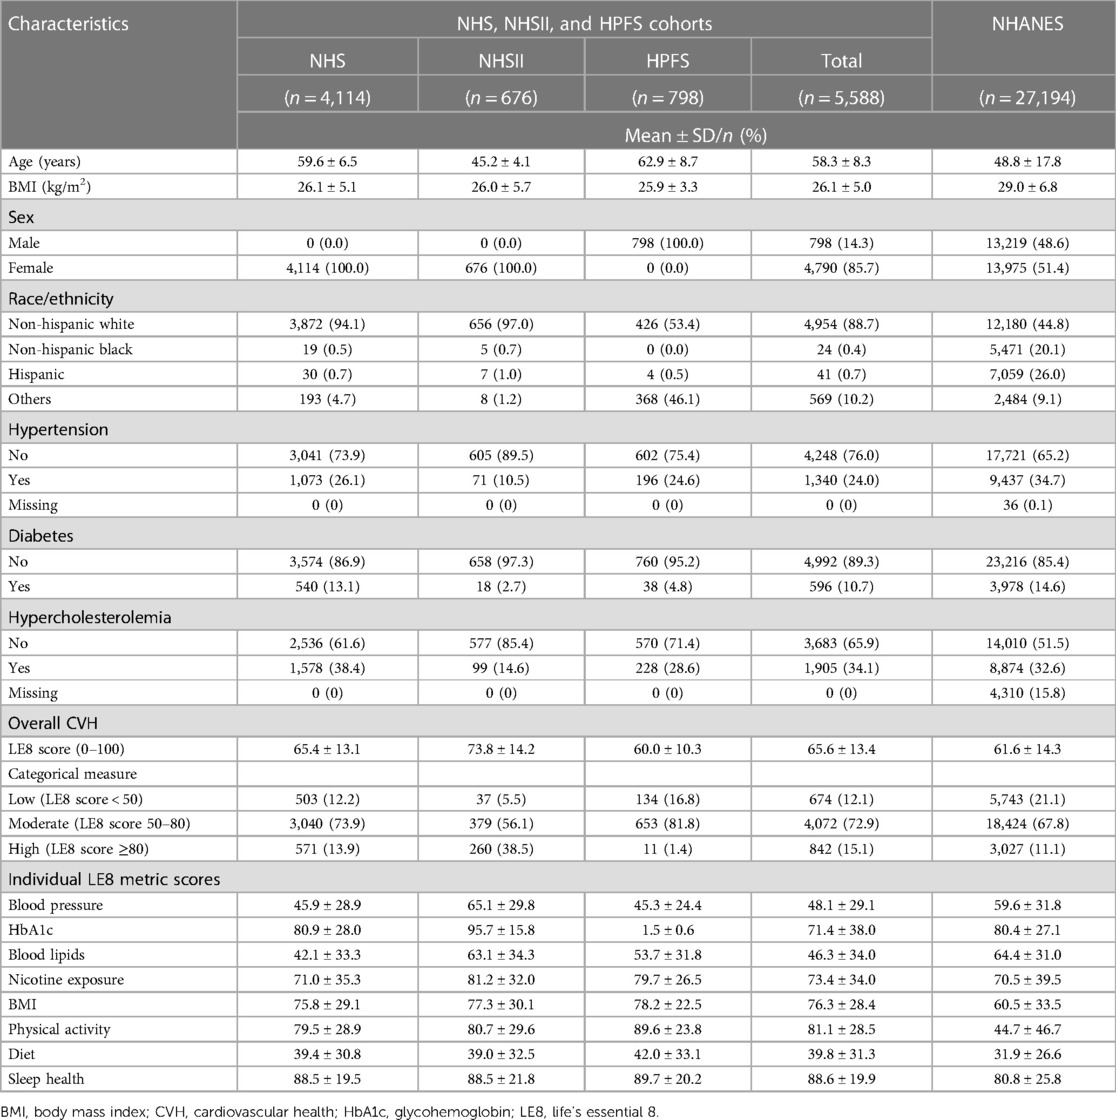
Table 2. Characteristics of participants in NHS, NHSII, and HPFS, and the 2005–2016 NHANES included in developing prediction models of life's essential 8 score.
Hyperparameters tuned based on grid searches are presented in Supplementary Tables S3, S4 for the models trained using the cohorts and NHANES, respectively. Figure 2 shows the performance of models to estimate the continuous overall CVH score based on LE8. Internally and externally validated RMSEs of 8.06 and 16.72 were observed, respectively, in base models trained using the cohorts. Similarly, in base models trained using NHANES, internally and externally validated RMSEs of 9.21 and 18.33 were observed. Models additionally including physical activity, diet, blood pressure, and sleep health had the best internally validated RMSEs (3.94 in the best model trained using the cohorts, and 4.24 in the best model trained using NHANES). Models trained using the cohorts with additional predictors including blood pressure and sleep health had the best externally validated RMSE of 14.25, while models trained using NHANES had best externally validated RMSE of 10.39 with additional predictors including physical activity, diet, blood pressure, and sleep health.
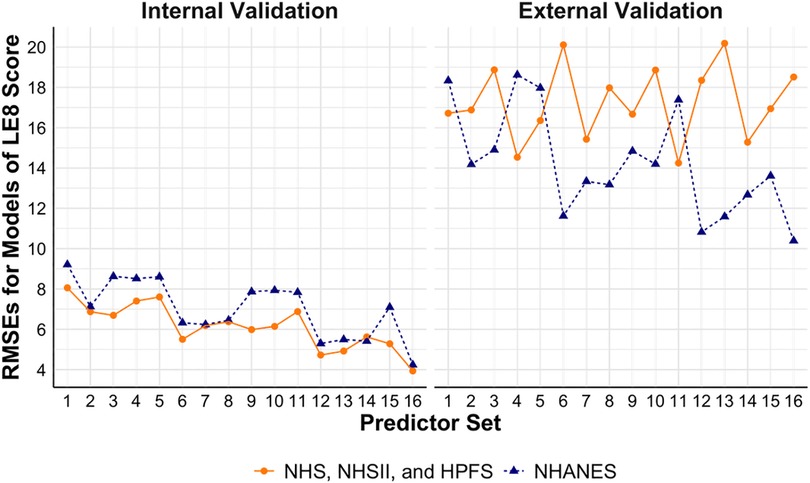
Figure 2. Performance of models to estimate continuous LE8 score using NHS, NHSII, and HPFS (n = 5,588), and NHANES (n = 27,194). Set 1 (i.e., base model): age, sex, race/ethnicity, BMI, smoking, hypertension, hypercholesterolemia, and diabetes; Set 2: +physical activity; Set 3: +diet; Set 4: +blood pressure; Set 5: +sleep health; Set 6: +physical activity + diet; Set 7: +physical activity + blood pressure; Set 8: +physical activity + sleep health; Set 9: +diet + blood pressure; Set 10: +diet + sleep health; Set 11: +blood pressure + sleep health; Set 12: +physical activity + diet + blood pressure; Set 13: +physical activity + diet + sleep health; Set 14: +physical activity + blood pressure + sleep health; Set 15: +diet + blood pressure + sleep health; Set 16: +physical activity + diet + blood pressure + sleep health. BMI, body mass index; CVH, cardiovascular health; HPFS, Health Professional's Follow-up Study; LE8, life's essential 8; NHANES, the National Health and Nutrition Examination Survey; NHS, Nurses’ Health Study; NHSII, Nurses’ Health Study II; RMSE, root mean square error.
Figure 3 shows the performance of models to estimate binary CVH outcomes. In models trained using the cohorts, the base models had validated AUCs of 0.91 and 0.92 (internal) and 0.56 and 0.60 (external) for high vs. moderate/low CVH and low vs. moderate/high CVH, respectively. Similarly, the base models trained using NHANES had internally validated AUCs of 0.91 and 0.89 and externally validated AUCs of 0.70 and 0.51 for the two binary CVH outcomes, respectively. Models with additional predictors such as physical activity, diet, blood pressure, and sleep health had better performance, with the best validated AUCs of 0.98 and 0.98 (internal) and 0.89 and 0.78 (external) in models trained using the cohorts, and 0.99 and 0.97 (internal) and 0.89 and 0.77 (external) in models trained using NHANES for the two binary CVH outcomes, respectively.
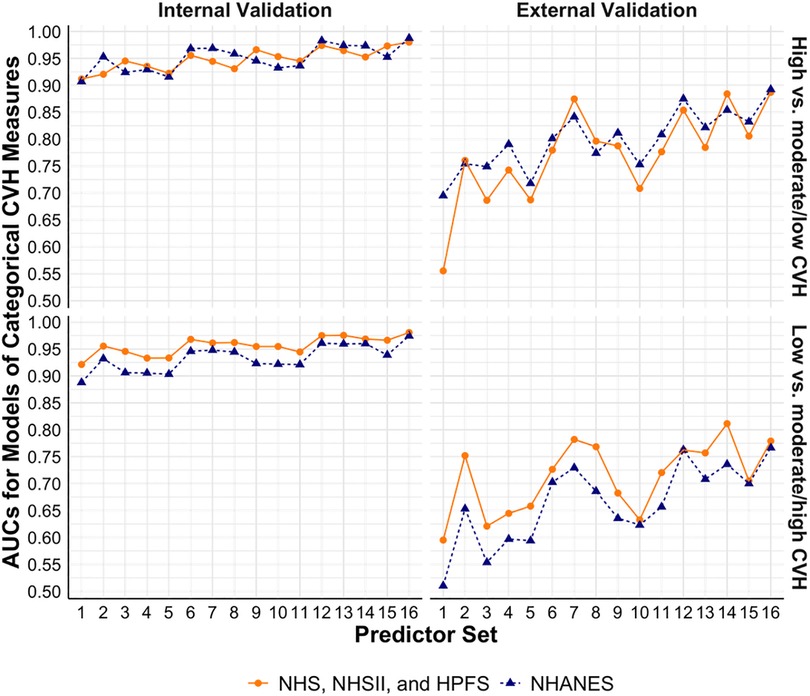
Figure 3. Performance of models to estimate categorical CVH measures based on LE8 score using NHS, NHSII, and HPFS (n = 5,588), and NHANES (n = 27,194). Set 1 (i.e., base model): age, sex, race/ethnicity, BMI, smoking, hypertension, hypercholesterolemia, and diabetes; Set 2: +physical activity; Set 3: +diet; Set 4: +blood pressure; Set 5: +sleep health; Set 6: +physical activity + diet; Set 7: +physical activity + blood pressure; Set 8: +physical activity + sleep health; Set 9: +diet + blood pressure; Set 10: +diet + sleep health; Set 11: +blood pressure + sleep health; Set 12: +physical activity + diet + blood pressure; Set 13: +physical activity + diet + sleep health; Set 14: +physical activity + blood pressure + sleep health; Set 15: +diet + blood pressure + sleep health; Set 16: +physical activity + diet + blood pressure + sleep health. AUC, area under the receiver operator characteristic curve; BMI, body mass index; CVH, cardiovascular health; HPFS, Health Professional's Follow-up Study; LE8, Life's Essential 8; NHANES, the National Health and Nutrition Examination Survey; NHS, Nurses’ Health Study; NHSII, Nurses’ Health Study II.
Supplementary Tables S5, S6 show the detailed results for each model. Consistent results were observed in internal validations by cohort (Supplementary Table S7).
Figure 4 presents the HRs and 95% CIs for all-cause mortality. In the cohorts, one unit increase in the observed LE8 score was associated with significantly lower hazards of all-cause mortality (HR: 0.982, 95% CI: 0.976–0.989). Consistent results were observed in models using predicted LE8 scores based on different sets of predictors. Similarly, in the NHANES, no statistically significant difference was found between the associations of all-cause mortality with the observed and predicted LE8 scores.
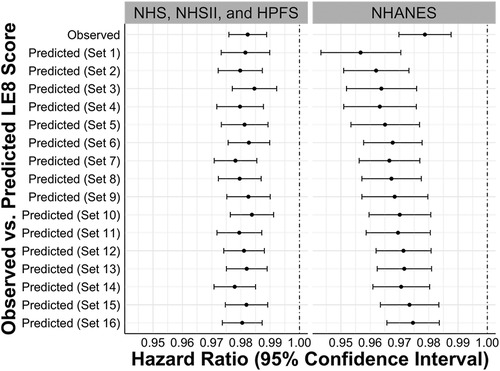
Figure 4. Hazard ratios and 95% confidence intervals for the associations between observed vs. predicted LE8 scores and all-cause mortality in internal testing sets of NHS, NHSII, and HPFS (n = 5,588), and NHANES (n = 27,194). Set 1 (i.e., base model): age, sex, race/ethnicity, BMI, smoking, hypertension, hypercholesterolemia, and diabetes; Set 2: +physical activity; Set 3: +diet; Set 4: +blood pressure; Set 5: +sleep health; Set 6: +physical activity + diet; Set 7: +physical activity + blood pressure; Set 8: +physical activity + sleep health; Set 9: +diet + blood pressure; Set 10: +diet + sleep health; Set 11: +blood pressure + sleep health; Set 12: +physical activity + diet + blood pressure; Set 13: +physical activity + diet + sleep health; Set 14: +physical activity + blood pressure + sleep health; Set 15: +diet + blood pressure + sleep health; Set 16: +physical activity + diet + blood pressure + sleep health. BMI, body mass index; CVH, cardiovascular health; HPFS, Health Professional's Follow-up Study; LE8, life's essential 8; NHANES, the National Health and Nutrition Examination Survey; NHS, Nurses’ Health Study; NHSII, Nurses’ Health Study II.
To further assess the robustness of our approach, we conducted sensitivity analyses using CVH measures based on LS7 (Supplementary Table S2). Supplementary Table S8 shows the distributions of demographic characteristics, medical history, overall LS7 CVH, and individual LS7 metrics. Data from 1999 to 2004 NHANES were not used in the main analyses based on LE8 since sleep health was not available, however, they were included in the sensitivity analyses. A total of 8,500 and 39,933 participants from the cohorts and the 1999–2016 NHANES with complete information on all seven LS7 metrics were included in this study, respectively. Consistent with findings for LE8, participants in the cohorts were less likely to have hypertension, diabetes, and hypercholesterolemia and had better overall CVH, compared with participants in the NHANES. Participants in the cohorts were also more likely to have ideal status for individual CVH metrics including BMI, cigarette smoking, physical activity, and diet, while those in the NHANES were more likely to have ideal blood pressure and total cholesterol (all p < 0.001).
Supplementary Tables S9, S10 show tuned hyperparameters for the models trained using the cohorts and NHANES, respectively. Supplementary Figures S2, S3 show the performance of models for the continuous CVH score and binary overall CVH measures assessed by LS7. In base models trained using the cohorts, validated RMSEs of 1.47 (internal) and 2.37 (external) and validated AUCs ranging from 0.85 to 0.98 (internal) and 0.74 to 0.90 (external) were observed. Similarly, the base models trained using NHANES had validated RMSEs of 1.55 (internal) and 3.19 (external) and validated AUCs ranging from 0.85 to 0.97 (internal) and 0.77 to 0.87 (external). Models with additional predictors such as physical activity, diet, and/or blood pressure had better performance, with the best validated RMSEs of 0.86 (internal) and 1.81 (external) and validated AUCs ranging from 0.96 to 0.99 (internal) and 0.79 to 0.94 (external) in models trained using the cohorts, and the best validated RMSEs of 0.82 (internal) and 1.92 (external) and validated AUCs ranging from 0.95 to 0.99 (internal) and 0.89 to 0.98 (external) in models trained using NHANES. Supplementary Tables S11, S12 shows the detailed results for each model. Results of stratified internal validations for models of LS7 in each of the cohorts are shown in Supplementary Table S13.
Supplementary Figure S4 presents associations between all-cause mortality and the observed and predicted LS7 scores. Similar to the results observed for the LE8 scores, no statistically significant difference was observed in the associations based on the observed vs. predicted LE7 scores.
Leveraging data from three nationwide prospective cohorts (i.e., NHS, NHSII, and HPFS) and a series of cross-sectional nationally representative data from the NHANES, we developed and validated several sets of models to estimate individuals' overall CVH status defined by LE8 when not all eight metrics are available. We found that information routinely collected and widely available in many research studies and clinical settings (e.g., age, sex, race/ethnicity, BMI, nicotine exposure, hypertension, hypercholesterolemia, and diabetes) can be used to accurately estimate individuals' overall CVH status. Consistent results were observed in sensitivity analyses defining CVH outcomes based on LS7. In addition, the predicted CVH scores can generate consistent effect estimates in associational studies as the observed CVH scores.
Both the original LS7 and the recently updated LE8 metrics introduced by the AHA emphasize primordial prevention, and have great potential to guide and improve CVD prevention (3, 5). It has been shown that individuals' overall CVH declines with age (14–16). A recent pooled cohort analysis on trajectories of clinical CVH scores (based on BMI, blood pressure, cholesterol, and blood glucose) identified two inflection points in late adolescence (i.e., 16.9 years) and early middle age (i.e., 37.2 years) during which the decline of CVH accelerates (28). It is thus important to identify and understand factors contributing to CVH declines at different stages of life. However, due to the challenges to simultaneously measure all eight LE8 (or seven LS7) CVH metrics over time, most existing studies on CVH are cross-sectional (14, 17–22), and the few longitudinal studies which examined individuals' CVH trajectories over time either only had CVH sparsely measured over time (e.g., ≤3 time points in ≥10 years) or used modified versions of LE8 or LS7 (e.g., the clinical CVH score) (23–28). The models developed and validated in this study provide a cost-effective and feasible solution to enable longitudinal assessment of CVH trajectories in multiple settings when not all eight LE8 (or seven LS7) CVH metrics are available.
In this study, we observed great model performance in internal validations for different predictors-outcome pairs in models either trained using the cohorts (i.e., NHS, NHSII, and HPFS) or the NHANES. This is not unexpected as many of the CVH metrics included in LE8 and LS7 are highly correlated, and therefore, it is plausible to use some but not all eight LE8 (or seven LS7) metrics along with other CVH-related factors to estimate individuals' overall CVH. This is supported by results from a recent study, which used 13-year electronic health records with measures of five CVH metrics (i.e., smoking, BMI, blood pressure, glucose, and cholesterol) and found that future individual CVH metrics can be reliably predicted using previous measures of these metrics (27). In addition, we also showed that the predicted CVH scores can generate consistent effect estimates in associational studies as the observed CVH scores. Our findings suggest that in research and clinical settings without all eight LE8 (or seven LS7) CVH metrics measured at every time point, using the few CVH metrics and related factors routinely collected can accurately estimate individuals' overall CVH, making it feasible to examine trajectories of overall CVH over time.
Compared with the results from internal validations, the models performed relatively worse in external validations, which may be mainly caused by differences between the data used in internal and external validations, including (1) different study populations (e.g., NHS, NHSII, and HPFS included only health professions and participants are older, while the NHANES included the general population), and (2) different measurement methods of individual CVH metrics and predictors (e.g., blood pressures were based on self-report in NHS, NHSII, and HPFS, while the NHANES used the average blood pressure from consecutive measurements). These results suggest that while directly using off-the-shelf models pretrained using other data sources (e.g., NHANES) are feasible, when possible, it is ideal to retrain and validate models for specific research or clinical settings, especially when the targeted populations or measurement methods are different from the original data source used to develop the pretrained models.
There are several strengths and some limitations to note. This is the first effort to estimate individuals' overall CVH when not all eight LE8 (or seven LS7) CVH metrics are available. We showed that the few CVH metrics and related factors routinely collected in many research and clinical settings can be used to accurately estimate individuals' overall CVH. This is especially valuable to longitudinal studies focusing on CVH trajectories as it enables inclusions of data from more time points to better characterize longitudinal changes in overall CVH. It is also clinically relevant by providing a cost-effective and feasible way to track individuals' CVH over time. In addition, using three large nationwide prospective cohorts (NHS, NHSII, and HPFS) and the nationally representative NHANES, the results observed, and implications drawn from this study are generalizable to other populations and study settings. One limitation to note is the relatively worse model performance in external validations, which suggested that directly applying off-the-shelf models pretrained using data from other population or setting may yield less accurate estimations. However, the consistently great model performance observed in internal validations using both the cohorts (i.e., NHS, NHSII, and HPFS) and NHANES data provide strong evidence suggesting that individuals’ overall CVH can be accurately estimated with retrained and fine-tuned models for specific research or clinical settings.
Using data from three large nationwide prospective cohorts (i.e., NHS, NHSII, and HPFS) and a nationally representative survey (i.e., NHANES), we showed that CVH-related factors routinely measured in many research and clinical settings can be used to accurately estimate individuals' overall CVH even when not all eight LE8 (or seven LS7) metrics are available. In summary, the approach introduced in this study provides a cost-effective and feasible way to estimate individuals' overall CVH in multiple settings and is especially valuable to characterize individuals' CVH trajectories over time.
Publicly available datasets were analyzed in this study. This data can be found here: Nurses’ Health Studies: https://nurseshealthstudy.org/ Health Professionals Follow-Up Study: https://www.hsph.harvard.edu/hpfs/ NHANES: https://www.cdc.gov/nchs/nhanes/index.htm.
The studies involving human participants were reviewed and approved by Mass General Brigham IRB. The patients/participants provided their written informed consent to participate in this study.
HH and YZ contributed to conception and design of the study. YZ extracted the data and performed analysis. TH contributed to data extraction. YZ and HH wrote the first draft of the manuscript. TH, MG-F, JH, FL, JC, ER, and BC contributed to interpretation of data and critical revision. All authors contributed to the article and approved the submitted version.
Research reported in this publication was supported in part by the National Heart, Lung, and Blood Institute under award number K01HL153797, R01HL034594, and R01HL35464, the National Cancer Institute under award number UM1CA186107, U01CA176726, U01CA167552, R01CA49449, and R01CA67262, the National Institute for Environmental Health Sciences under award number P30ES000002, and Novo Nordisk Research grant NNF18CC0034900. The content is solely the responsibility of the authors and does not necessarily represent the official views of the National Institutes of Health.
The authors declare that the research was conducted in the absence of any commercial or financial relationships that could be construed as a potential conflict of interest.
All claims expressed in this article are solely those of the authors and do not necessarily represent those of their affiliated organizations, or those of the publisher, the editors and the reviewers. Any product that may be evaluated in this article, or claim that may be made by its manufacturer, is not guaranteed or endorsed by the publisher.
The Supplementary Material for this article can be found online at: https://www.frontiersin.org/articles/10.3389/fcvm.2023.1216693/full#supplementary-material
ACC, American College of Cardiology; AHEI-2010, alternative healthy eating index 2010; CI, confidence interval; CVD, cardiovascular disease; CVH, cardiovascular health; HPFS, health professionals follow-up study; HR, hazard ratio; LE8, life's essential 8; LS7, life's simple 7; MET, metabolic equivalent of task; NHANES, National Health and Nutrition Examination Survey; NHS, Nurses' Health Study; NHSII, Nurses' Health Study II.
1. American Heart Association Council on Epidemiology. Heart disease and stroke statistics-2019 update: a report from the American heart association. Circulation. (2019) 139(10):e56–528. doi: 10.1161/cir.0000000000000659
2. AHA. CDC prevention programs. www.heart.org (2022). Available at: https://www.heart.org/en/get-involved/advocate/federal-priorities/cdc-prevention-programs (Accessed April 21, 2022).
3. Lloyd-Jones DM, Hong Y, Labarthe D, Mozaffarian D, Appel LJ, Van Horn L, et al. Defining and setting national goals for cardiovascular health promotion and disease reduction: the American heart Association’s Strategic impact goal through 2020 and beyond. Circulation. (2010) 121(4):586–613. doi: 10.1161/CIRCULATIONAHA.109.192703
4. Bambs C, Reis SE. Embracing primordial prevention for ideal cardiovascular health. Future Cardiol. (2011) 7(4):447–50. doi: 10.2217/fca.11.38
5. Lloyd-Jones DM, Allen NB, Anderson CAM, Black T, Brewer LC, Foraker RE, et al. Life’s essential 8: updating and enhancing the American heart association’s construct of cardiovascular health: a presidential advisory from the American heart association. Circulation. (2022) 146(5):e18–43. doi: 10.1161/CIR.0000000000001078
6. Yang Q, Cogswell ME, Flanders WD, Hong Y, Zhang Z, Loustalot F, et al. Trends in cardiovascular health metrics and associations with all-cause and CVD mortality among US adults. J Am Med Assoc. (2012) 307(12):1273–83. doi: 10.1001/jama.2012.339
7. Kulshreshtha A, Vaccarino V, Judd SE, Howard VJ, McClellan WM, Muntner P, et al. Life’s simple 7 and risk of incident stroke: the reasons for geographic and racial differences in stroke study. Stroke. (2013) 44(7):1909–14. doi: 10.1161/STROKEAHA.111.000352
8. Ogunmoroti O, Allen NB, Cushman M, Michos ED, Rundek T, Rana JS, et al. Association between life’s simple 7 and noncardiovascular disease: the multi-ethnic study of atherosclerosis. J Am Heart Assoc. (2016) 5(10):e003954. doi: 10.1161/JAHA.116.003954
9. Thacker EL, Gillett SR, Wadley VG, Unverzagt FW, Judd SE, McClure LA, et al. The American heart association life’s simple 7 and incident cognitive impairment: the reasons for geographic and racial differences in stroke (REGARDS) study. J Am Heart Assoc. (2014) 3(3):e000635. doi: 10.1161/JAHA.113.000635
10. Kronish IM, Carson AP, Davidson KW, Muntner P, Safford MM. Depressive symptoms and cardiovascular health by the American heart association’s definition in the reasons for geographic and racial differences in stroke (REGARDS) study. PLoS One. (2012) 7(12):e52771. doi: 10.1371/journal.pone.0052771
11. Del Brutto OH, Mera RM, Recalde BY, Rumbea DA, Sedler MJ. Life’s simple 7 and all-cause mortality. A population-based prospective cohort study in middle-aged and older adults of amerindian ancestry living in rural Ecuador. Prev Med Rep. (2022) 25(101668):101668. doi: 10.1016/j.pmedr.2021.101668
12. Cranley J, MacRae CA. A new approach to an old problem: one brave idea. Circ Res. (2018) 122(9):1172–5. doi: 10.1161/CIRCRESAHA.118.310941
13. Labarthe D, Lloyd-Jones DM. 50×50×50: cardiovascular health and the cardiovascular disease endgame. Circulation. (2018) 138(10):968–70. doi: 10.1161/CIRCULATIONAHA.118.035985
14. Shay CM, Ning H, Allen NB, Carnethon MR, Chiuve SE, Greenlund KJ, et al. Status of cardiovascular health in US adults: prevalence estimates from the national health and nutrition examination surveys (NHANES) 2003-2008. Circulation. (2012) 125(1):45–56. doi: 10.1161/CIRCULATIONAHA.111.035733
15. Ning H, Labarthe DR, Shay CM, Daniels SR, Hou L, Van Horn L, et al. Status of cardiovascular health in US children up to 11 years of age: the national health and nutrition examination surveys 2003-2010. Circ Cardiovasc Qual Outcomes. (2015) 8:164–71. doi: 10.1161/circoutcomes.114.001274
16. Lloyd-Jones DM, Ning H, Labarthe D, Brewer L, Sharma G, Rosamond W, et al. Status of cardiovascular health in US adults and children using the American heart association’s new “life’s essential 8” metrics: prevalence estimates from the national health and nutrition examination survey (NHANES), 2013 through 2018. Circulation. (2022) 146(11):822–35. doi: 10.1161/CIRCULATIONAHA.122.060911
17. Shay CM, Ning H, Daniels SR, Rooks CR, Gidding SS, Lloyd-Jones DM. Status of cardiovascular health in US adolescents: prevalence estimates from the national health and nutrition examination surveys (NHANES) 2005-2010. Circulation. (2013) 127(13):1369–76. doi: 10.1161/CIRCULATIONAHA.113.001559
18. Folsom AR, Olson NC, Lutsey PL, Roetker NS, Cushman M. American heart association’s life’s simple 7 and incidence of venous thromboembolism. Am J Hematol. (2015) 90(5):E92. doi: 10.1002/ajh.23950
19. Fretts AM, Howard BV, McKnight B, Duncan GE, Beresford SAA, Mete M, et al. Life’s simple 7 and incidence of diabetes among American Indians: the strong heart family study. Diabetes Care. (2014) 37(8):2240–5. doi: 10.2337/dc13-2267
20. Gebreab SY, Davis SK, Symanzik J, Mensah GA, Gibbons GH, Diez-Roux AV. Geographic variations in cardiovascular health in the United States: contributions of state- and individual-level factors. J Am Heart Assoc. (2015) 4:45. doi: 10.1161/jaha.114.001673
21. Pool LR, Ning H, Lloyd-Jones DM, Allen NB. Trends in racial/ethnic disparities in cardiovascular health among US adults from 1999 to 2012. J Am Heart Assoc. (2017) 6(9):e006027. doi: 10.1161/JAHA.117.006027
22. Djoussé L, Petrone AB, Blackshear C, Griswold M, Harman JL, Clark CR, et al. Prevalence and changes over time of ideal cardiovascular health metrics among African–Americans: the Jackson heart study. Prev Med. (2015) 74:111–6. doi: 10.1016/j.ypmed.2015.02.006
23. Wu S, An S, Li W, Lichtenstein AH, Gao J, Kris-Etherton PM, et al. Association of trajectory of cardiovascular health score and incident cardiovascular disease. JAMA Netw Open. (2019) 2(5):e194758. doi: 10.1001/jamanetworkopen.2019.4758
24. Ruiz-Ramie JJ, Barber JL, Lloyd-Jones DM, Gross MD, Rana JS, Sidney S, et al. Cardiovascular health trajectories and elevated C-reactive protein: the CARDIA study. J Am Heart Assoc. (2021) 10(17):e019725. doi: 10.1161/JAHA.120.019725
25. Allen NB, Krefman AE, Labarthe D, Greenland P, Juonala M, Kähönen M, et al. Cardiovascular health trajectories from childhood through middle age and their association with subclinical atherosclerosis. JAMA Cardiol. (2020) 5(5):557–66. doi: 10.1001/jamacardio.2020.0140
26. Zhang R, Xie J, Yang R, Li R, Chong M, Zhang X, et al. Association between ideal cardiovascular health score trajectories and arterial stiffness: the Kailuan study. Hypertens Res. (2020) 43(2):140–7. doi: 10.1038/s41440-019-0341-4
27. Guo A, Beheshti R, Khan YM, Langabeer J2, Foraker RE. Predicting cardiovascular health trajectories in time-series electronic health records with LSTM models. BMC Med Inform Decis Mak. (2021) 21(1):5. doi: 10.1186/s12911-020-01345-1
28. Krefman AE, Labarthe D, Greenland P, Pool L, Aguayo L, Juonala M, et al. Influential periods in longitudinal clinical cardiovascular health scores. Am J Epidemiol. (2021) 190(11):2384–94. doi: 10.1093/aje/kwab149
29. Centers for Disease Control and Prevention (CDC), National Center for Health Statistics (NCHS). National health and nutrition examination survey MEC laboratory procedures manual. Hyattsville, MD: U.S. Department of Health and Human Services, Centers for Disease Control and Prevention (2016). Available at: https://wwwn.cdc.gov/nchs/data/nhanes/2015-2016/manuals/2016_MEC_Laboratory_Procedures_Manual.pdf.
30. Dhana K, Haines J, Liu G, Zhang C, Wang X, Field AE, et al. Association between maternal adherence to healthy lifestyle practices and risk of obesity in offspring: results from two prospective cohort studies of mother-child pairs in the United States. Br Med J. (2018) 362:k2486. doi: 10.1136/bmj.k2486
31. Sun Q, van Dam RM, Spiegelman D, Heymsfield SB, Willett WC, Hu FB. Comparison of dual-energy x-ray absorptiometric and anthropometric measures of adiposity in relation to adiposity-related biologic factors. Am J Epidemiol. (2010) 172(12):1442–54. doi: 10.1093/aje/kwq306
32. Colditz GA, Martin P, Stampfer MJ, Willett WC, Sampson L, Rosner B, et al. Validation of questionnaire information on risk factors and disease outcomes in a prospective cohort study of women. Am J Epidemiol. (1986) 123(5):894–900. doi: 10.1093/oxfordjournals.aje.a114319
33. Ascherio A, Rimm EB, Giovannucci EL, Colditz GA, Rosner B, Willett WC, et al. A prospective study of nutritional factors and hypertension among US men. Circulation. (1992) 86(5):1475–84. doi: 10.1161/01.CIR.86.5.1475
34. Forman JP, Curhan GC, Taylor EN. Plasma 25-hydroxyvitamin D levels and risk of incident hypertension among young women. Hypertension. (2008) 52(5):828–32. doi: 10.1161/HYPERTENSIONAHA.108.117630
35. Manson JE, Colditz GA, Stampfer MJ, Willett WC, Krolewski AS, Rosner B, et al. A prospective study of maturity-onset diabetes mellitus and risk of coronary heart disease and stroke in women. Arch Intern Med. (1991) 151(6):1141–7. doi: 10.1001/archinte.1991.00400060077013
36. Willett WC, Sampson L, Stampfer MJ, Rosner B, Bain C, Witschi J, et al. Reproducibility and validity of a semiquantitative food frequency questionnaire. Am J Epidemiol. (1985) 122(1):51–65. doi: 10.1093/oxfordjournals.aje.a114086
37. Salvini S, Hunter DJ, Sampson L, Stampfer MJ, Colditz GA, Rosner B, et al. Food-based validation of a dietary questionnaire: the effects of week-to-week variation in food consumption. Int J Epidemiol. (1989) 18(4):858–67. doi: 10.1093/ije/18.4.858
38. Willett WC, Sampson L, Browne ML, Stampfer MJ, Rosner B, Hennekens CH, et al. The use of a self-administered questionnaire to assess diet four years in the past. Am J Epidemiol. (1988) 127(1):188–99. doi: 10.1093/oxfordjournals.aje.a114780
39. Willett W. Reproducibility and validity of food-frequency questionnaires. In: Willett WC, editor. Nutritional epidemiology. New York, NY: Oxford University Press (1998). p. 101–47.
40. Yuan C, Spiegelman D, Rimm EB, Rosner BA, Stampfer MJ, Barnett JB, et al. Validity of a dietary questionnaire assessed by comparison with multiple weighed dietary records or 24-hour recalls. Am J Epidemiol. (2017) 185(7):570–84. doi: 10.1093/aje/kww104
41. Yuan C, Spiegelman D, Rimm EB, Rosner BA, Stampfer MJ, Barnett JB, et al. Relative validity of nutrient intakes assessed by questionnaire, 24-hour recalls, and diet records as compared with urinary recovery and plasma concentration biomarkers: findings for women. Am J Epidemiol. (2018) 187(5):1051–63. doi: 10.1093/aje/kwx328
42. Wilson KM, Vesper HW, Tocco P, Sampson L, Rosén J, Hellenäs K-E, et al. Validation of a food frequency questionnaire measurement of dietary acrylamide intake using hemoglobin adducts of acrylamide and glycidamide. Cancer Causes Control. (2009) 20(3):269–78. doi: 10.1007/s10552-008-9241-7
43. Wolf AM, Hunter DJ, Colditz GA, Manson JE, Stampfer MJ, Corsano KA, et al. Reproducibility and validity of a self-administered physical activity questionnaire. Int J Epidemiol. (1994) 23(5):991–9. doi: 10.1093/ije/23.5.991
44. Al-Shaar L, Pernar CH, Chomistek AK, Rimm EB, Rood J, Stampfer MJ, et al. Reproducibility, validity, and relative validity of self-report methods for assessing physical activity in epidemiologic studies: findings from the women’s lifestyle validation study. Am J Epidemiol. (2022) 191(4):696–710. doi: 10.1093/aje/kwab294
45. Ainsworth BE, Haskell WL, Leon AS, Jacobs DJ, Montoye HJ, Sallis JF, et al. Compendium of physical activities: classification of energy costs of human physical activities. Med Sci Sports Exerc. (1993) 25(1):71–80. doi: 10.1249/00005768-199301000-00011
46. Whelton PK, Carey RM, Aronow WS, Casey DJ, Collins KJ, Dennison Himmelfarb C, et al. 2017 ACC/AHA/AAPA/ABC/ACPM/AGS/APHA/ASH/ASPC/NMA/PCNA guideline for the prevention, detection, evaluation, and management of high blood pressure in adults: a report of the American college of cardiology/American heart association task force on clinical practice guidelines. Hypertension. (2018) 71(6):e13–115. doi: 10.1161/HYP.0000000000000065
47. Unger T, Borghi C, Charchar F, Khan NA, Poulter NR, Prabhakaran D, et al. International society of hypertension global hypertension practice guidelines. Hypertension. (2020) 75(6):1334–57. doi: 10.1161/HYPERTENSIONAHA.120.15026
48. National High Blood Pressure Education Program. Blood pressure and cardiovascular risk. Bethesda, MD: National Heart, Lung, and Blood Institute (US) (2004).
49. Law MR, Morris JK, Wald NJ. Use of blood pressure lowering drugs in the prevention of cardiovascular disease: meta-analysis of 147 randomised trials in the context of expectations from prospective epidemiological studies. Br Med J. (2009) 338:b1665. doi: 10.1136/bmj.b1665
50. Gaciong Z, Siński M, Lewandowski J. Blood pressure control and primary prevention of stroke: summary of the recent clinical trial data and meta-analyses. Curr Hypertens Rep. (2013) 15(6):559–74. doi: 10.1007/s11906-013-0401-0
51. American Diabetes Association. Diagnosis and classification of diabetes mellitus. Diabetes Care. (2010) 33(Suppl 1):S62–9. doi: 10.2337/dc10-S062
52. International Expert Committee. International expert committee report on the role of the A1C assay in the diagnosis of diabetes. Diabetes Care. (2009) 32(7):1327–34. doi: 10.2337/dc09-9033
53. Lachman S, Peters RJ, Lentjes MA, Mulligan AA, Luben RN, Wareham NJ, et al. Ideal cardiovascular health and risk of cardiovascular events in the EPIC-norfolk prospective population study. Eur J Prev Cardiol. (2016) 23(9):986–94. doi: 10.1177/2047487315602015
54. König M, Drewelies J, Norman K, Spira D, Buchmann N, Hülür G, et al. Historical trends in modifiable indicators of cardiovascular health and self-rated health among older adults: cohort differences over 20 years between the Berlin aging study (BASE) and the Berlin aging study II (BASE-II). PLoS One. (2018) 13(1):e0191699. doi: 10.1371/journal.pone.0191699
55. Saiz AM Jr, Aul AM, Malecki KM, Bersch AJ, Bergmans RS, LeCaire TJ, et al. Food insecurity and cardiovascular health: findings from a statewide population health survey in Wisconsin. Prev Med. (2016) 93:1–6. doi: 10.1016/j.ypmed.2016.09.002
56. Alman AC, Maahs DM, Rewers MJ, Snell-Bergeon JK. Ideal cardiovascular health and the prevalence and progression of coronary artery calcification in adults with and without type 1 diabetes. Diabetes Care. (2014) 37(2):521–8. doi: 10.2337/dc13-0997
57. Kershaw KN, Giacinto RE, Gonzalez F, Isasi CR, Salgado H, Stamler J, et al. Relationships of nativity and length of residence in the U.S. with favorable cardiovascular health among hispanics/latinos: the hispanic community health study/study of latinos (HCHS/SOL). Prev Med. (2016) 89:84–9. doi: 10.1016/j.ypmed.2016.05.013
58. Alonso-Pedrero L, Ojeda-Rodríguez A, Zalba G, Razquin C, Martínez-González MÁ, Bes-Rastrollo M, et al. Association between ideal cardiovascular health and telomere length in participants older than 55 years old from the SUN cohort. Rev Esp Cardiol. (2022) 75(4):308–15. doi: 10.1016/j.recesp.2021.04.003
59. Gooding HC, Shay CM, Ning H, Gillman MW, Chiuve SE, Reis JP, et al. Optimal lifestyle components in young adulthood are associated with maintaining the ideal cardiovascular health profile into middle age. J Am Heart Assoc. (2015) 4(11):e002048. doi: 10.1161/JAHA.115.002048
60. Prokhorenkova L, Gusev G, Vorobev A, Dorogush AV, Gulin A. Catboost: unbiased boosting with categorical features. Adv Neural Inf Process Syst. (2018) 31:1–11.
61. R Core Team. R: a language and environment for statistical computing (2013). Available at: https://cran.microsoft.com/snapshot/2014-09-08/web/packages/dplR/vignettes/xdate-dplR.pdf
Keywords: cardiovascular health, life’s essential 8, life’s simple 7, machine learning, prediction model
Citation: Zheng Y, Huang T, Guasch-Ferre M, Hart J, Laden F, Chavarro J, Rimm E, Coull B and Hu H (2023) Estimation of life's essential 8 score with incomplete data of individual metrics. Front. Cardiovasc. Med. 10:1216693. doi: 10.3389/fcvm.2023.1216693
Received: 4 May 2023; Accepted: 14 July 2023;
Published: 26 July 2023.
Edited by:
Elsayed Z. Soliman, Wake Forest University, United StatesReviewed by:
Mubashir Ayaz Ahmed, AMITA Health St Joseph Hospital, United States© 2023 Zheng, Huang, Guasch-Ferre, Hart, Laden, Chavarro, Rimm, Coull and Hu. This is an open-access article distributed under the terms of the Creative Commons Attribution License (CC BY). The use, distribution or reproduction in other forums is permitted, provided the original author(s) and the copyright owner(s) are credited and that the original publication in this journal is cited, in accordance with accepted academic practice. No use, distribution or reproduction is permitted which does not comply with these terms.
*Correspondence: Hui Hu aHVpLmh1QGNoYW5uaW5nLmhhcnZhcmQuZWR1
Disclaimer: All claims expressed in this article are solely those of the authors and do not necessarily represent those of their affiliated organizations, or those of the publisher, the editors and the reviewers. Any product that may be evaluated in this article or claim that may be made by its manufacturer is not guaranteed or endorsed by the publisher.
Research integrity at Frontiers
Learn more about the work of our research integrity team to safeguard the quality of each article we publish.