
95% of researchers rate our articles as excellent or good
Learn more about the work of our research integrity team to safeguard the quality of each article we publish.
Find out more
ORIGINAL RESEARCH article
Front. Cardiovasc. Med. , 10 July 2023
Sec. Intensive Care Cardiovascular Medicine
Volume 10 - 2023 | https://doi.org/10.3389/fcvm.2023.1211600
 Jahan C. Penny-Dimri1*
 Christoph Bergmeir2,3Christopher M. Reid1,4Jenni Williams-Spence1,4Luke A. Perry5
 Julian A. Smith1
Objectives: Machine learning (ML) classification tools are known to accurately predict many cardiac surgical outcomes. A novel approach, ML-based survival analysis, remains unstudied for predicting mortality after cardiac surgery. We aimed to benchmark performance, as measured by the concordance index (C-index), of tree-based survival models against Cox proportional hazards (CPH) modeling and explore risk factors using the best-performing model.
Methods: 144,536 patients with 147,301 surgery events from the Australian and New Zealand Society of Cardiac and Thoracic Surgeons (ANZSCTS) national database were used to train and validate models. Univariate analysis was performed using Student's T-test for continuous variables, Chi-squared test for categorical variables, and stratified Kaplan-Meier estimation of the survival function. Three ML models were tested, a decision tree (DT), random forest (RF), and gradient boosting machine (GBM). Hyperparameter tuning was performed using a Bayesian search strategy. Performance was assessed using 2-fold cross-validation repeated 5 times.
Results: The highest performing model was the GBM with a C-index of 0.803 (0.002), followed by RF with 0.791 (0.003), DT with 0.729 (0.014), and finally CPH with 0.596 (0.042). The 5 most predictive features were age, type of procedure, length of hospital stay, drain output in the first 4 h (ml), and inotrope use greater than 4 h postoperatively.
Conclusion: Tree-based learning for survival analysis is a non-parametric and performant alternative to CPH modeling. GBMs offer interpretable modeling of non-linear relationships, promising to expose the most relevant risk factors and uncover new questions to guide future research.
The extraordinary physiologically stress of cardiac surgery carries a high risk of adverse postoperative outcomes (1). An important component of surgical decision-making is determining which patients will ultimately benefit after overcoming the initial insult of surgery. Overall survival is an important, albeit complex, metric for understanding the overall benefit of a surgery (2, 3). It is a layered outcome that captures the impact of peri-procedural complications and the new functional baseline achieved after the operation (2, 3). Developing interpretable tools that map a patient's physiological, operative, and early postoperative variables to their long term survival could provide novel insights into who truly benefits most from cardiac surgery.
Previous ML research modeling survival converts time-to-event to a binary outcome such as 5-year mortality, which sacrifices potentially useful information (4). Survival data is typically studied using linear models such as Cox proportional hazards (CPH) regression (5, 6). It is increasingly recognized, however, that surgical risk is non-linear (7). Novel machine learning (ML) approaches continue to be developed for survival analysis with potentially attractive non-linear properties (8, 9). Modeling relationships between variables in this way could uncover unique risk factors, assist decision-making, and improve the delivery of care.
Many important ML concepts have been translated into a survival analysis domain including neural networks, support vector machines, gradient boosting machines (GBM), and random forests (RF) (8, 10). In the context of tabular datasets, tree-based methods such as gradient boosting and RF consistently outperform deep learning methods (11). Tree-based methods tend to be more robust to uninformative features and learn non-smooth functions (11). Survival analysis in healthcare is a tabular dataset problem and therefore tree-based machine learning may provide better model fit and feature explanations.
Tree-based learners are a class of models which expand on the decision tree, whereby strong models are constructed from ensembles of weak decision trees such as the random forest (8, 12). Additionally, in gradient boosting, the optimization of the ensemble model can be improved by minimizing a residual term using the gradient of the error of the weak learner (9). Regardless of the tree-based model, survival and hazard functions are then estimated using non-parametric methods based on the data in the terminal nodes (13).
Firstly, we aimed to compare model fit of tree-based machine learning to Cox proportional hazards modeling. Secondly, we aimed to use the best-performing model to determine the key predictor variables for long-term mortality. We hypothesized that tree-based ML provides better model fit and explanations compared with CPH modeling.
The Australian and New Zealand Society of Cardiac and Thoracic Surgeons (ANZSCTS) Database registry recorded 153,944 cardiac surgery events in 151,089 unique patients from April 2001 to December 2019, captured at 42 centers in Australia (14). The database is not publicly available as it stores sensitive patient information. Inclusion in the database was for any patient undergoing cardiac surgery, other thoracic surgery using cardiopulmonary bypass, and pericardiectomy for constrictive pericarditis, regardless of cardiopulmonary bypass. The dataset includes a linkage with the National Death Index (NDI), which is a national program recording all deaths that have occurred since 1980 (15).
Long-term mortality was defined as any death that was recorded after a procedure. Patients were followed from the date of surgery to their death as recorded in either the database or the NDI. The date of the last linkage with the NDI, the “follow-up time”, was the 1st of August, 2019.
All perioperative variables in the database were considered for inclusion. Any variables which were missing 90% or more data were excluded from the analysis. Preliminary data analysis was conducted by comparing the univariate distribution of each variable between survivors and non-survivors at the last follow-up. Hypothesis testing for distributional differences were performed using a student's T-test for continuous variables and a Chi-Squared test for categorical variables. For fitting models, non-binary categorical variables were converted to a set of dummy variables.
A Kaplan-Meier (KM) estimator was fitted to plot the survival function in order to visualize the univariate effects of sex, indigenous status, and type of operation on long-term survival.
Time-to-event regression differs from standard regression as for a subset of cases the time of an event occurring has not been observed, and is thus censored. Rather than learning a direct relationship between input variables and the time of an event, survival analysis seeks to estimate the survival and cumulative hazard functions based on input covariates.
One of the oldest and most widely used methods for regressing censored data is the CPH model (6, 13). It uses a semi-parametric approach to learn the effects of covariates on the hazard function (6). The assumption of proportional hazards derives from the relationship between the baseline hazard function and the covariates and requires that the ratio between two patients hazard function is constant across time (6). The potential of co-linearity to degrade the performance of this model was addressed by developing a pipeline that filtered the input dataset to remove co-linearity. This was achieved by checking the correlation coefficient between features and if the coefficient exceeded 0.6 then only the feature with the highest mutual information with respect to mortality was included (16).
Tree-based machine learning incorporates decision tree and ensemble decision tree methods. These models are non-parametric and make no proportional hazards assumptions.
Survival trees are simple models that learn decision rules derived from input features, that is often represented as an expanding set of branching paths (17). These models are non-parametric, simple to understand, and computationally efficient (17).
Random survival forests are ensembles of decision trees that are trained on bootstrapped samples of training data and a random subset of input variables (12, 13). Unlike decision trees, however, RF models do not have a simple interpretation to explain their predictions. Methods do exist, however, to determine the most important features (18).
Similar to random forests, gradient boosting machines are an ensemble of decision trees, however, the model fits an additional term to minimize the residual error of the weak learner using the gradient of the error (13). Survival and hazard functions are estimated using non-parametric methods (13).
For each candidate model, a hyper-parameter search was conducted using a Bayesian search strategy (19). The parameters and ranges searched are available in the supplementary materials.
Performance was measured using the Concordance index (C-index) which is measured on a scale between 0.5 and 1.0, where 1.0 indicated perfect model fit and 0.5 indicates performance no better than random chance. In order to benchmark the algorithms' performance, a 2-fold cross-validation scheme repeated 5 times was used (20). Imbalanced data, where an extreme minority of samples had very long-term outcomes recorded, was handled with stratified minority class oversampling. Multiple imputation with random forests was used to impute missing data. Both imputation and oversampling were applied only to the training set of each cross-validation fold to ensure no data leak across the training and test sets. A schematic representation of training and benchmarking is presented in Figure 1.
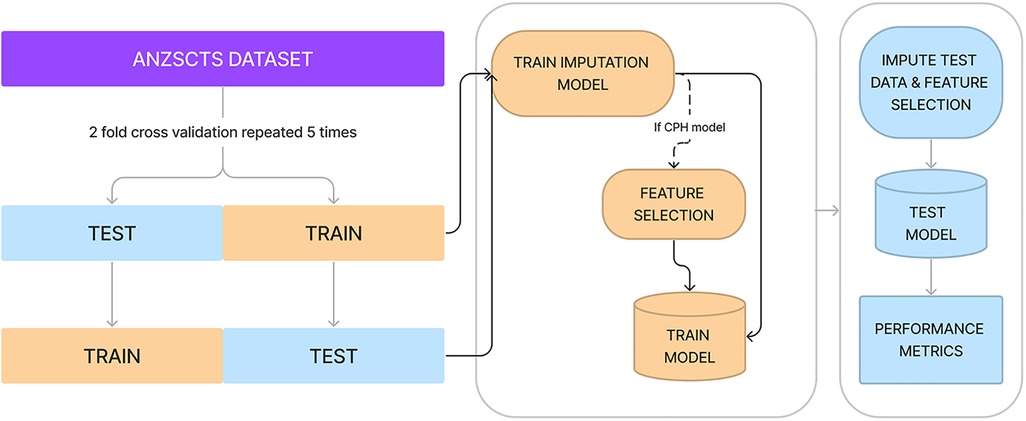
Figure 1. Diagrammatic representation of cross-validation, data imputation, feature selection, and measuring performance. Processes in yellow represent actions on or using the training set, whereas processes in blue are with the test set.
The assessment of machine learning bias was achieved by stratifying the test set of each cross-validation fold by important characteristics and measuring the performance on the stratified subsets. Bias was assessed for the characteristics of sex and indigenous status.
After benchmarking performance, the best-performing model was used to assess which features were the most important for predicting the hazard function for long-term mortality (18).
This project was conducted in concordance with the National Health and Medical Research Council (NHMRC) National Statement on Ethical Conduct in Human Research, with approval from the Monash University Human Research Ethics Committee (HREC) approval number 2020-24850-45439.
144,536 patients were included in the final analysis with 147,301 surgery events (Figure 2). A summary of patient characteristics, stratified by survival at follow-up, are reported in Table 1. All patient characteristics included in the analysis are reported in supplementary Tables S1 and S2. The average age of the cohort was 65.6 years (SD 12.9), 26.8% of patients were female, and 2.6% of the cohort was indigenous. Mortality events represented 24.37% of the cohort with the longest recorded mortality 17.9 years after the first operation, and the longest survivor at follow-up was 18.2 years.
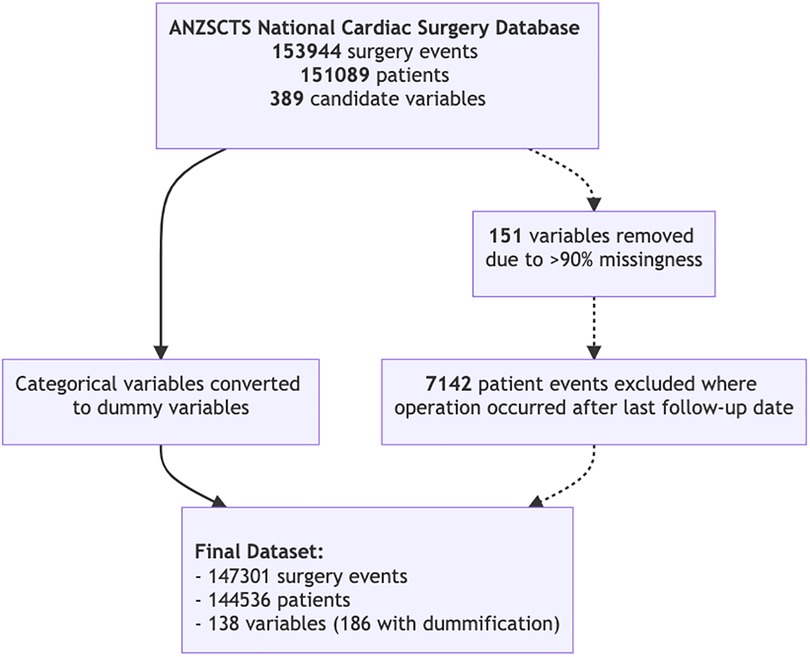
Figure 2. Flow diagram depicting data processing and the final subset.
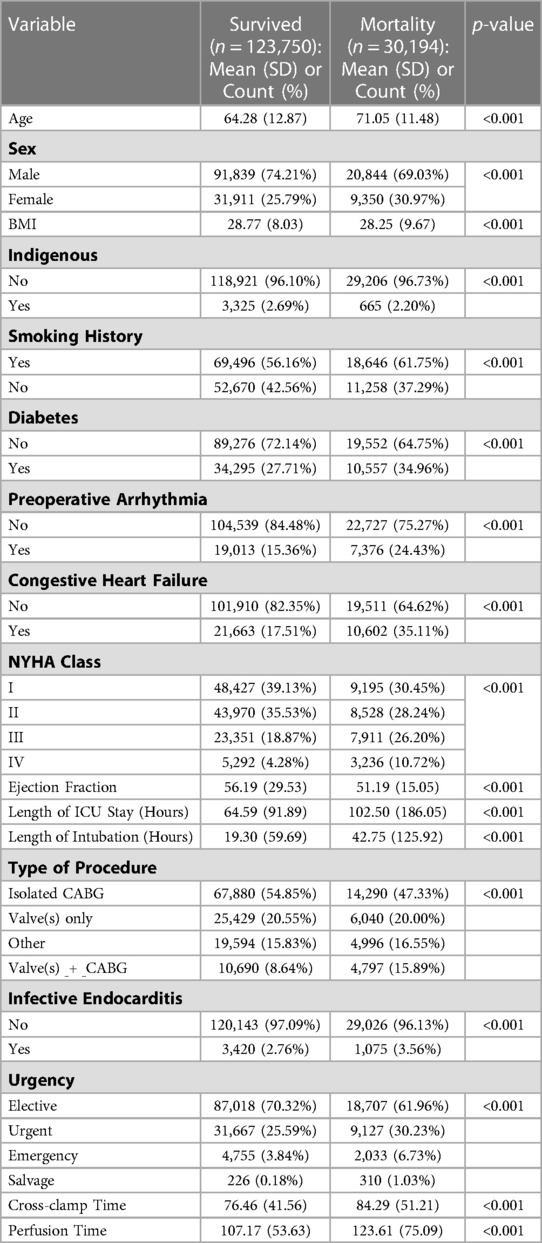
Table 1. Patient characteristics.
Stratified survival functions as estimated by the Kaplan-Meier estimator are shown in Figure 3. Women undergoing cardiac surgery had worse long-term survival. Indigenous people undergoing cardiac surgery had worse survival early after surgery, however, this effect reversed with very long-term (>10 years) survival. The combination of a coronary artery bypass and valve in the same operation conferred the worst long term mortality.
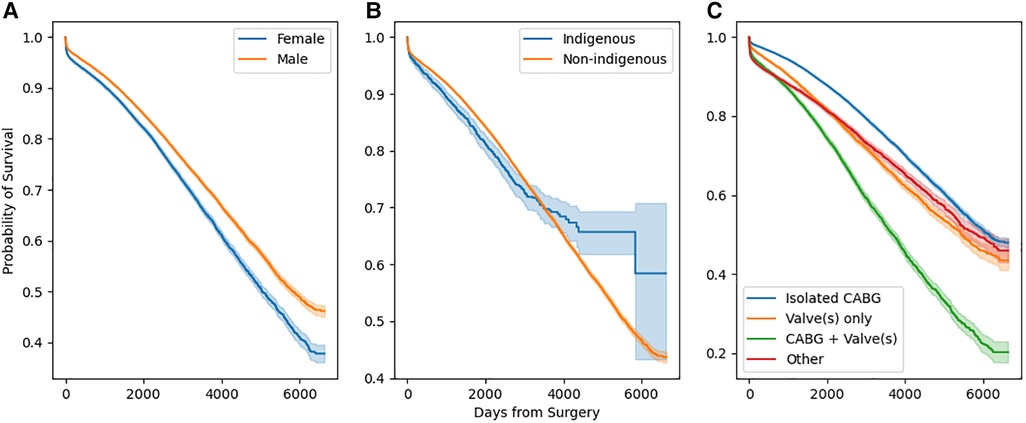
Figure 3. Stratified survival functions as defined by Kaplan-Meier estimators. Stratification by sex is depicted in (a), by race in (b), and by operation type in (c).
The best performing model was the GBM, with a C-index of 0.803 (0.002), compared with CPH modeling with 0.596 (0.042). The performance of the GBM on female patients was 0.800 (0.004) and for indigenous patients was 0.773 (0.012). All performance scores for each benchmarked model, including their bias assessment are reported in Table 2.
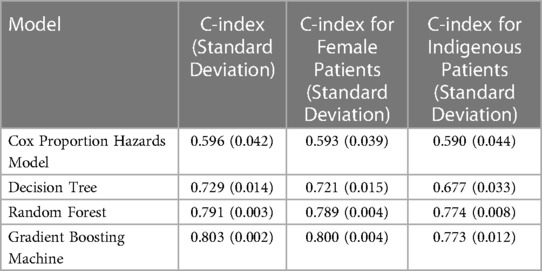
Table 2. Performance and bias Assessment.
As gradient boosting machines had the highest performance, feature importance was extracted from its weights. Table 3 reports the top 15 most important variables along with their feature importance score (higher is more significant). Age was the most significant risk factor, followed by operation type, length of hospital stay, and drain output in the first 4 h.
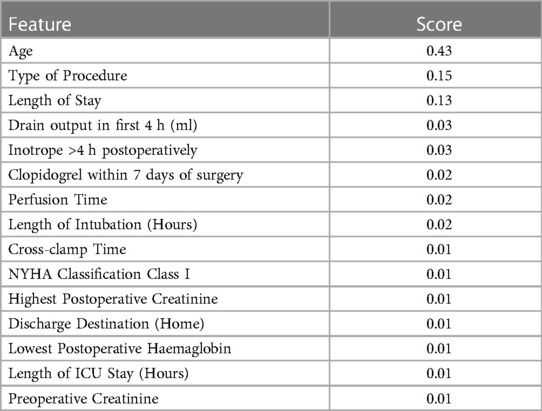
Table 3. Top 15 most important features. A higher value indicates a more important feature for predicting time to mortality.
This is the first study to investigate tree-based time-to-event models to predict survival. It is also the first to study machine learning bias in this context. Our results show that machine learning outperforms the current gold standard in medical research, the Cox proportional hazards model. Additionally, we have shown that high performing machine learning approaches can be used to determine the most important features for predicting long-term mortality.
The initial data exploration included a univariate analysis with a Kaplan-Meier estimator, which indicated sex differences in long-term mortality. The finding that there is an association between female sex and higher long-term mortality has been previously identified (21). Women who undergo cardiac surgery tend to be older, have greater comorbities, and need emergency or urgent surgery (22, 23). The existing literature on whether female sex is an independent risk factor for long-term mortality is mixed with analyses usually conducted using linear modeling (21, 24). Sex was not ranked as a significant variable in the gradient boosting model, which adds evidence to the argument that the sex difference is mostly explained by other covariates associated with female sex.
Indigenous mortality is less studied, however, a recent analysis of patients undergoing coronary artery bypass grafting found they were younger but suffering from a higher prevalence of comorbidities (25). As age is the most predictive feature for mortality, the younger indigenous cohort could account for later equalization and gain in survival for these patients.
Similar to the pre-existing literature of tree-based methods in cardiac surgery, GBM are often as good or better than pre-existing methods (4, 26). The effectiveness of these GBM and RF models in healthcare has been shown across many domains and forms the basis of many clinical support tools (27, 28). The basis for the effectiveness of these models has recently been empirically determined with several attractive inductive biases of tree-based models. They are robust to uninformative features, preserve dataset orientation, and capable of learning non-smooth functions (11). This is in contrast to linear models, such as CPH, that do not share these properties.
An important feature of any predictive model in healthcare is explainability (29). We have demonstrated that a trained model can provide global feature importance which provides insight into risk factors that may have been previously overlooked. One interesting predictive feature the GBM learned was clopidogrel use within 7 days preoperatively. While recent evidence does not find that clopidogrel use impacted short or long-term mortality, this analysis was performed using CPH modeling (30). The predictive importance of clopidogrel in this analysis is interesting, however, it serves to underscore the importance of novel ML methods for hypothesis-generating research.
The impact of ML in the clinical domain has been slow, however, tree-based risk stratification tools and apps, such as predictive optimal trees in emergency surgery (POTTER), have introduced clinicians to their routine use (7). Further potential exists for these models to provide automated feedback and risk modeling in electronic medical systems. Tree-based survival analysis could provide additional depth to modeling in both clinician facing and automated systems.
There are a number of limitations to our study. Firstly, we made the assumption that data was either missing completely at random, or missing at random. While we believe this is a safe assumption, there may be instances where data is missing not at random that biases our imputation approach. Additionally, compared to CPH and decision tree methods, RF and GBM were significantly more computationally expensive. In settings with very large datasets and limited computational resources they may not be appropriate choices. The use of less computationally intensive algorithms, such as light gradient boosting machine, could improve computational performance however the gain in this analysis would be marginal (31). Furthermore, feature importance rankings derived from GBM or RF do not provide a direction. In CPH models, the coefficients are easily interpretable and provide a direction for the features effect. Where this is important, alternative explanatory methods should be considered. Finally, in our bias analysis, while there was no difference in performance for female sex, there was a noticeable but small drop in performance for the indigenous patients. Where these models are used in clinical settings, consideration should be made to ensure separate machine learning models are trained for this important cohort to address the potential for bias (32).
Tree-based learning for survival analysis is a non-parametric and performant alternative to Cox proportional hazards modeling. Within the tree-based learning methods, gradient boosting machines perform the best as measured by the C-index. These models can provide risk profiles to guide clinical reasoning and uncover new questions for future research.
The datasets presented in this article are not readily available because The ANZSCTS National Audit Database contains confidential patient information and is therefore not publicly available. It is accessible through application to the ANZSCTS Database research committee. Requests to access the datasets should be directed to https://anzscts.org/database/. Further enquiries can be directed to the corresponding author.
JD contributed to the concept, data extraction and analysis, and manuscript writing. CB contributed to the concept, supervision, and manuscript editing. JS contributed to the concept, supervision, and manuscript editing. CR and JW contributed to database curation, analysis guidance, and manuscript editing. LAP contributed to manuscript editing, supervision. All authors contributed to the article and approved the submitted version.
The ANZSCTS National Cardiac Surgery Database Program is funded by the Department of Health (Victoria), the Clinical Excellence Commission (NSW), Queensland Health (QLD), and funding from individual cardiac surgical units participating in the registry. ANZSCTS Database Research activities are supported through a National Health and Medical Research Council Principal Research Fellowship (APP 1136372) and Program Grant (APP 1092642) awarded to C.M. Reid. The Database thanks all of the investigators, data managers, and institutions that participate in the Program.
The ANZSCTS National Cardiac Surgery Database Program is funded by the Department of Health (Victoria), the Clinical Excellence Commission (NSW), Queensland Health (QLD), and funding from individual cardiac surgical units participating in the registry. ANZSCTS Database Research activities are supported through a National Health and Medical Research Council Principal Research Fellowship (APP 1136372) and Program Grant (APP 1092642) awarded to C.M. Reid. The Database thanks all of the investigators, data managers, and institutions that participate in the Program.
The authors declare that the research was conducted in the absence of any commercial or financial relationships that could be construed as a potential conflict of interest.
All claims expressed in this article are solely those of the authors and do not necessarily represent those of their affiliated organizations, or those of the publisher, the editors and the reviewers. Any product that may be evaluated in this article, or claim that may be made by its manufacturer, is not guaranteed or endorsed by the publisher.
The Supplementary Material for this article can be found online at: https://www.frontiersin.org/articles/10.3389/fcvm.2023.1211600/full#supplementary-material
ANZSCTS: Australia and New Zealand Society for Cardiac and Thoracic Surbery; C-index: Concordance Index; CPH: Cox Proportional Hazards; DT: Decision Tree; GBM: Gradient Boosting Machine; HREC: Human Research Ethics Committee; KM: Kaplan-Meier; ML: Machine Learning; NDI: National Death Index; NHMRC: National Health and Medical Research Council; RF: Random Forest.
1. Crawford TC, Magruder JT, Grimm JC, Suarez-Pierre A, Sciortino CM, Mandal K, et al. Complications after cardiac operations: all are not created equal. Ann Thorac. (2017) 103(1):32–40. doi: 10.1016/j.athoracsur.2016.10.022
2. Khuri SF, Henderson WG, DePalma RG, Mosca C, Healey NA, Kumbhani DJ. Determinants of long-term survival after major surgery and the adverse effect of postoperative complications. Ann Surg. (2005) 242(3):326–43. doi: 10.1097/01.sla.0000179621.33268.83
3. Adelborg K, Horváth-Puhó E, Schmidt M, Munch T, Pedersen L, Nielsen PH, et al. Thirty-year mortality after coronary artery bypass graft surgery. Circ Cardiovasc Qual Outcomes. [Internet]. (2017) 10(5):e002708. doi: 10.1161/circoutcomes.116.002708
4. Benedetto U, Dimagli A, Sinha S, Cocomello L, Gibbison B, Caputo M, et al. Machine learning improves mortality risk prediction after cardiac surgery: systematic review and meta-analysis. J Thorac Cardiovasc Surg. [Internet]. (2020) 163(6):2075–87. doi: 10.1016/j.jtcvs.2020.07.105
5. Armitage P, Berry G, Matthews JNS. Statistical methods in medical research. Oxford (UK): John Wiley & Sons (2008).
6. Cox DR. Regression models and life-tables. J R Stat Soc Series B Stat Methodol. (1972) 34(2):187–220. doi: 10.1111/j.2517-6161.1972.tb00899.x
7. Bertsimas D, Dunn J, Velmahos GC, Kaafarani HMA. Surgical risk is not linear: derivation and validation of a novel, user-friendly, and machine-learning-based predictive OpTimal trees in emergency surgery risk (POTTER) calculator. Ann Surg. (2018) 268(4):574–83. doi: 10.1097/sla.0000000000002956
8. Pölsterl S. Scikit-survival: a library for time-to-event analysis built on top of scikit-learn. J Mach Learn Res. (2020) 21(212):1–6. Available at: http://jmlr.org/papers/v21/20-729.html
9. Chen T, Guestrin C. XGBoost: a scalable tree boosting system. Proceedings of the 22nd ACM SIGKDD international conference on knowledge discovery and data mining. New York, NY, USA: ACM (2016). p. 785–94. (KDD ‘16). doi: 10.1145/2939672.2939785
10. Ranganath R, Perotte A, Elhadad N, Blei D. Deep survival analysis. In: Doshi-Velez F, Fackler J, Kale D, Wallace B, Wiens J, editors. Proceedings of the 1st machine learning for healthcare conference. Northeastern University, Boston, MA, USA: PMLR (2016). p. 101–14. (Proceedings of machine learning research; vol. 56). Available at: https://proceedings.mlr.press/v56/Ranganath16.html
11. Grinsztajn L, Oyallon E, Varoquaux G. Why do tree-based models still outperform deep learning on tabular data?. arXiv. (2022). Available at: https://arxiv.org/abs/2207.08815
12. Ishwaran H, Kogalur UB, Blackstone EH, Lauer MS. Random survival forests. Ann Appl Stat. (2008) 2(3):841–60. doi: 10.1214/08-AOAS169
13. Hothorn T, Bühlmann P, Dudoit S, Molinaro A, Van Der Laan MJ. Survival ensembles. Biostatistics. (2005) 7(3):355–73. doi: 10.1093/biostatistics/kxj011
14. Database NCS. Data definitions manual version 4. Melbourne, Australia: Australia: New Zealand Society for Cardiac; Thoracic Surgeons (2018).
15. Health AI for, Welfare. National death index (NDA), data quality statement. Canberra, Australia: Australian Government (2012). Available at: https://meteor.aihw.gov.au/content/480010
16. Dormann CF, Elith J, Bacher S, Buchmann C, Carl G, Carré G, et al. Collinearity: a review of methods to deal with it and a simulation study evaluating their performance. Ecography. (2013) 36(1):27–46. doi: 10.1111/j.1600-0587.2012.07348.x
17. LeBlanc M, Crowley J. Survival trees by goodness of split. J Am Stat Assoc. (1993) 88(422):457–67. doi: 10.1080/01621459.1993.10476296
18. Saarela M, Jauhiainen S. Comparison of feature importance measures as explanations for classification models. SN Appl Sci. [Internet]. (2021) 3(2):272. doi: 10.1007/s42452-021-04148-9
19. Biewald L. Experiment tracking with weights and biases. (2020). Available at: https://www.wandb.com/
20. Dietterich TG. Approximate statistical tests for comparing supervised classification learning algorithms. Neural Comput. (1998) 10(7):1895–923. doi: 10.1162/089976698300017197
21. Johnston A, Mesana TG, Lee DS, Eddeen AB, Sun LY. Sex differences in long–term survival after major cardiac surgery: a population–based cohort study. J Am Heart Assoc. (2019) 8(17):e013260. doi: 10.1161/JAHA.119.013260
22. Sun LY, Tu JV, Bader Eddeen A, Liu PP. Prevalence and long-term survival after coronary artery bypass grafting in women and men with heart failure and preserved versus reduced ejection fraction. J Am Heart Assoc. (2018) 7(12):e008902. doi: 10.1161/JAHA.118.008902
23. Hamed O, Persson P, Engel AM, McDonough S, Smith JM. Gender differences in outcomes following aortic valve replacement surgery. Int J Surg. (2009) 7(3):214–7. doi: 10.1016/j.ijsu.2009.03.005
24. Faerber G, Zacher M, Reents W, Boergermann J, Kappert U, Boening A, et al. Female sex is not a risk factor for post procedural mortality in coronary bypass surgery in the elderly: a secondary analysis of the GOPCABE trial. PLoS One. (2017) 12(8):e0184038. doi: 10.1371/journal.pone.0184038
25. Nellipudi JA, Baker RA, Prabhakaran S, Klebe S, Krieg BM, Bennetts JS. The long-term mortality of an aboriginal and torres strait islander Australian population after isolated coronary artery bypass graft surgery. ANZ J Surg. (2022) 92(7–8):1839–44. doi: 10.1111/ans.17817
26. Penny-Dimri JC, Bergmeir C, Reid CM, Williams-Spence J, Cochrane AD, Smith JA. Machine learning algorithms for predicting and risk profiling of cardiac surgery-associated acute kidney injury. Semin Thorac Cardiovasc Surg. (2021) 33(3):735–45. doi: 10.1053/j.semtcvs.2020.09.028
27. Yun T-G, Yi G-S. Application of random forest algorithm for the decision support system of medical diagnosis with the selection of significant clinical test. Trans Korean Inst Electr Eng. (2008) 57:1058–62.
28. McWilliams CJ, Lawson DJ, Santos-Rodriguez R, Gilchrist ID, Champneys A, Gould TH, et al. Towards a decision support tool for intensive care discharge: machine learning algorithm development using electronic healthcare data from MIMIC-III and Bristol, UK. BMJ Open. [Internet]. (2019) 9(3):e025925. Available at: https://bmjopen.bmj.com/content/9/3/e02592530850412
29. Štrumbelj E, Kononenko I. Explaining prediction models and individual predictions with feature contributions. Knowl Inf Syst. (2013) 41(3):647–65. doi: 10.1007/s10115-013-0679-x
30. Seese L, Sultan I, Gleason TG, Navid F, Wang Y, Kilic A. The impact of preoperative clopidogrel on outcomes after coronary artery bypass grafting. Ann Thorac Surg. (2019) 108(4):1114–20. doi: 10.1016/j.athoracsur.2019.03.082
31. Ke G, Meng Q, Finley T, Wang T, Chen W, Ma W, et al. Lightgbm: a highly efficient gradient boosting decision tree. Adv Neural Inf Process Syst. (2017) 30:3146–54.
Keywords: machine learning, tree-based machine learning, cardiac surgery, mortality, survival analaysis
Citation: Penny-Dimri JC, Bergmeir C, Reid CM, Williams-Spence J, Perry LA and Smith JA (2023) Tree-based survival analysis improves mortality prediction in cardiac surgery. Front. Cardiovasc. Med. 10:1211600. doi: 10.3389/fcvm.2023.1211600
Received: 24 April 2023; Accepted: 16 June 2023;
Published: 10 July 2023.
Edited by:
Sara Moccia, Sant'Anna School of Advanced Studies, ItalyReviewed by:
Liam Butler, Wake Forest University, United States© 2023 Penny-Dimri, Bergmeir, Reid, Williams-Spence, Perry and Smith. This is an open-access article distributed under the terms of the Creative Commons Attribution License (CC BY). The use, distribution or reproduction in other forums is permitted, provided the original author(s) and the copyright owner(s) are credited and that the original publication in this journal is cited, in accordance with accepted academic practice. No use, distribution or reproduction is permitted which does not comply with these terms.
*Correspondence: Jahan C. Penny-Dimri amFoYW4ucGVubnktZGltcmlAbW9uYXNoLmVkdQ==
Disclaimer: All claims expressed in this article are solely those of the authors and do not necessarily represent those of their affiliated organizations, or those of the publisher, the editors and the reviewers. Any product that may be evaluated in this article or claim that may be made by its manufacturer is not guaranteed or endorsed by the publisher.
Research integrity at Frontiers
Learn more about the work of our research integrity team to safeguard the quality of each article we publish.