 Shuo Yang1
 Nanxiang Zhang1
 Zichao Liang1
 Yuduan Han1
 Hao Luo1Yingfeng Ge1Jianan Yin1Chonglong Ding1
 Chao Li2Qitong Zhang2
 Jinxin Zhang1*
- 1Department of Medical Statistics, School of Public Health, Sun Yat-sen University, Guangzhou, China
- 2Department of Clinical Medicine, Zhongshan School of Medicine, Sun Yat-sen University, Guangzhou, China
Background: Observational studies have suggested U-shaped relationships between sleep duration and systolic blood pressure (SBP) with risks of many cardiovascular diseases (CVDs), but the cut-points that separate high-risk and low-risk groups have not been confirmed. We aimed to examine the U-shaped relationships between sleep duration, SBP, and risks of CVDs and confirm the optimal cut-points for sleep duration and SBP.
Methods: A retrospective analysis was conducted on NHANES 2007–2016 data, which included a nationally representative sample of participants. The maximum equal-odds ratio (OR) method was implemented to obtain optimal cut-points for each continuous independent variable. Then, a novel “recursive gradient scanning method” was introduced for discretizing multiple non-monotonic U-shaped independent variables. Finally, a multivariable logistic regression model was constructed to predict critical risk factors associated with CVDs after adjusting for potential confounders.
Results: A total of 26,691 participants (48.66% were male) were eligible for the current study with an average age of 49.43 ± 17.69 years. After adjusting for covariates, compared with an intermediate range of sleep duration (6.5–8.0 h per day) and SBP (95–120 mmHg), upper or lower values were associated with a higher risk of CVDs [adjusted OR (95% confidence interval) was 1.20 (1.04–1.40) for sleep duration and 1.17 (1.01–1.36) for SBP].
Conclusions: This study indicates U-shaped relationships between SBP, sleep duration, and risks of CVDs. Both short and long duration of sleep/higher and lower BP are predictors of cardiovascular outcomes. Estimated total sleep duration of 6.5–8.0 h per day/SBP of 95–120 mmHg is associated with lower risk of CVDs.
1. Introduction
Cardiovascular diseases (CVDs) continue to be the foremost cause of both morbidity and mortality on a global scale (1). Recent studies have suggested that there may be U-shaped associations between systolic blood pressure (SBP), sleep duration, and CVDs (2–8). Thus, determining the optimal range of SBP and sleep duration is crucial for reducing the risk of CVDs.
When examining the relationships between continuous explanatory variables and health-related outcomes in medical research, it is commonly recommended to investigate U-shaped relationships when non-linear effects are suspected (9–11). If we make the simplifying assumption that these continuous variables exhibit a linear correlation with prognosis and directly incorporate them into the construction of regression models, this approach will lead to a significant increase in the residuals of regression analysis. On the other hand, the epidemiologists consequently may fail to find a fundamental clue to formulate intervention measures. Although Cox regression models supplemented by flexible smoothing techniques (12–14), such as penalized splines and restricted cubic splines, can handle the U-shaped effects of continuous variables, many clinical and epidemiological researchers prefer to categorize continuous explanatory variables into high-risk and low-risk groups (15, 16). Optimal cut-points can identify crucial predictor thresholds, facilitate the development of patient classification schemes, and assist in clinical treatment strategies. However, determining appropriate cut-points becomes critical when clinical reference ranges are unavailable or cannot be directly applied to populations with distinct characteristics (17–21).
Two methods are utilized to discretize continuous independent variables in biostatistical analysis. One of them is the data-oriented cut-points approach (22, 23), which involves utilizing percentiles like median or quartiles based on the distribution of continuous variables. Although this method is easy to implement, it can produce arbitrary cut-points that do not consider the relationship with survival outcomes and may lead to inaccurate estimates of the actual effects (24). The other approach is the maximum statistic or minimum p-value approach (25), which chooses a cut-point with maximum χ2 statistic as the optimal cut-point for binary outcomes. However, the above two discretization approaches have a high probability of dividing individuals with similar risk into different groups, leading to inconsistent discretization results for high- and low-risk groups.
To address the limitations of conventional discretization methods and fulfill the requirement of identifying optimal cut-points for continuous predictors that exhibit a U-shaped relationship with outcomes, our team proposed two novel methods to discretize the single non-monotonic continuous variable, namely, “two cut-points with maximum odds ratio (OR) value method” (26) and “optimal equal-hazard ratio with minimum Akaike information criterion (AIC) value method” (27), which have been widely validated by peer review consensus. The OR or RR values obtained by our original methods not only directly respond to clinical needs but also optimize the evaluation from a statistical methodology perspective. Due to the universality of our proposed methods, the methods were quickly applied by domestic and foreign scholars to solve their practical problems, such as optimal cut-points identification of biomarkers (i.e., red blood cell distribution width for prognostic significance, serum creatinine for kidney injury after lung transplantation, and hemoglobin for surgical coronary revascularization). However, extending this discretization method to multiple non-monotonic independent variables can be challenging, as it requires a more complex consideration on either theoretical assumption or algorithm implementation. Currently, our team has developed a novel “recursive gradient scanning method” for the discretization of multiple non-monotonic independent variables simultaneously. This approach enables us to prioritize critical intervention measures and achieve targeted goals efficiently. The proposed method will provide a theoretical basis and algorithmic support for identifying significant influencing factors and constructing intervention programs.
This study utilized data from the National Health and Nutrition Examination Surveys (NHANES) covering 12 years to examine the relationships between sleep duration, SBP, and risks of CVDs. In addition, this study aimed to identify the optimal cut-points for sleep duration and SBP with CVDs as the outcome of interest, test the new method on real-world data, and compare its performance with other existing methods for discretizing multiple non-monotonic independent variables.
2. Materials and methods
2.1. Sample and design
The NHANES surveys use a complex, multistage, probability sampling design to create a representative sample of the civilian, non-institutionalized US population, and are conducted in a series of cross-sectional population-based surveys. Each year, about 5,000 individuals are examined, and data are released to the public in 2-year cycles. NHANES datasets have detailed information on data collection procedures and analytic guidelines provided elsewhere (28, 29). To gather information on CVDs, questionnaires were added to the surveys from 2007 to 2016, and this study used a total of five cycles (NHANES 2007–2016).
2.2. Definition of outcome
The presence of CVDs was ascertained using a combination of self-reported physician diagnoses and standardized medical status questionnaires, which were completed during individual interviews. The participants were specifically asked if a healthcare professional had ever informed them of having congestive heart failure (CHF), coronary heart disease (CHD), angina pectoris, heart attack, or stroke. Those who answered “yes” to any of the above were considered as having CVDs, and the outcome was converted to a dichotomous variable. Participants who responded with “did not know” were excluded from the analysis.
2.3. Sleep duration and SBP assessment (ascertainment of exposure)
NHANES datasets use responses to the question “How much sleep do you usually get at night on weekdays or workdays?” to obtain information on sleep duration. In cases where individuals reported a sleep duration of ≥12 h, this value was coded as 12. To minimize the risk of inaccurate sleep duration data and the potential impact of poor health on the study results, we opted to exclude individuals with missing sleep duration and those who reported sleeping less than 4 h. An average of three consecutive blood pressure measurements taken after resting quietly for 5 min was used to determine the SBP and diastolic blood pressure (DBP).
2.4. Covariate data collection
In our analysis, sociodemographic and lifestyle characteristics were considered covariates based on previously published studies (30–32). The study took multiple sociodemographic factors into account, such as gender, age, race (Mexican American, Other Hispanic, Non-Hispanic White, Non-Hispanic Black, and Other Race), poverty income ratio (PIR) (≤130%, 131%–185%, and ≥186%) (33), marital status (unmarried, married or living with partners, divorced or separated), and educational level (≤9th grade, 9–11th grade, high school grade, college and above). In this study, lifestyle characteristics were defined as physical activity, calculated in metabolic equivalents (METs) minutes per week and classified as <600 MET-min/week or ≥600 MET-min/week (34), smoking status (never, ever, and current), and alcohol consumption (never, ever, moderate, and excessive intake).
2.5. Statistical analysis
All statistical analyses in this study were adjusted for the complex sampling design of NHANES.
2.5.1. Descriptive analysis and modeling
Participant characteristics were summarized using weighted means and standard deviations for continuous variables and weighted counts and percentages for categorical variables. Differences between participants with and without CVDs were assessed using Rao–Scott χ2 for categorical variables and independent t-tests for continuous variables. A multivariable logistic regression model was used to examine the association between sleep duration, SBP, and the risk of CVDs, with the lower risk group serving as the reference category.
2.5.2. Graphical diagnostic plot
The semiparametric models with penalized B-splines (P-splines) were fitted using the R package “SemiPar” (35). This approach balances the goodness of fit and variance to curve the relationship and assess the statistical significance of the non-linear term.
2.5.3. Find two optimal cut-points for each continuous explanatory variable as original cut-points
If the visual representation of the curve indicates a U-shaped relationship (df > 2 using semiparametric regression analysis), then the “two cut-points with maximum OR value method (26)” was used to identify the original upper and lower cut-points of the continuous explanatory variable at which the OR reaches its maximum.
2.5.4. The recursive gradient scanning method for the discretization of multiple non-monotonic independent variables
The details of the methods raised by us to discretize multiple non-monotonic independent variables simultaneously are described as follows (depicted in Figure 1).
(1) If the curve depicted in the plot implies U-shaped associations between multiple independent variables and corresponding lnOR, we used the “two cut-points with maximum OR value method” for each variable to identify its optimal cut-points as their starting points for scanning, respectively.
(2) Find the percentile rankings of the estimated lnOR values for each independent variable, which are represented as Qk, k = 1, 2, …, 100. Subsequently, draw a horizontal line (known as “gradient”) parallel to the x-axis for each percentile between the 5th and the 95th percentile of the estimated lnOR. The y-value for each of these lines is set to Qk, k = 5, 6, …, 95. These lines intersect the fitted U-shaped curve at two points.
(3) Interpolation: The R-function spline interpolation technique is utilized to generate new data points as candidate cut-points, resulting in a smooth curve that maintains equal lnOR values across candidate cut-points (with a constraint for candidate cut-points that ).
(4) The recursive gradient scanning method: we set up a loop program to refine the boundary points and improve the discretization accuracy. Scanning starts from original cut-points of each variable and then moves up or down vertically in each gradient by the step of lnOR × 1/100. If the model fits increasingly well during the upward or downward scan, the model stops at the P95 of lnOR for the upward scan and at the P5 for the downward scan. If the model fits increasingly worse during the upward or downward scan, the current scan is suspended and the scan continues in the opposite direction. The number of independent variables determines the scanning method (e.g., if the number of variables is k, there are 2k scanning methods). Specifically, if k = 2, there are four scanning methods: (1) Scanning upward for X1 combined with downward for X2; (2) Scanning downward for X1 combined with upward for X2; (3) Scanning upward for both X1 and X2 simultaneously; (4) Scanning downward for both X1 and X2 simultaneously (illustrated in Figure 2).
(5) Select the best cut-points according to model fitness: We scan and calculate from the original cut-points in each program loop until the desired results are achieved. Then the goodness of fit index of the model under hyperparametric scenarios was obtained, such as AIC, Nagelkerke R2, and −2 log-likelihood. Select the respective variable cut-points corresponding to the best-fit model under each parameter combination as the final cut-points, place the discretized classified variables into the regression model, and rank the influencing factors according to the magnitude of OR values.
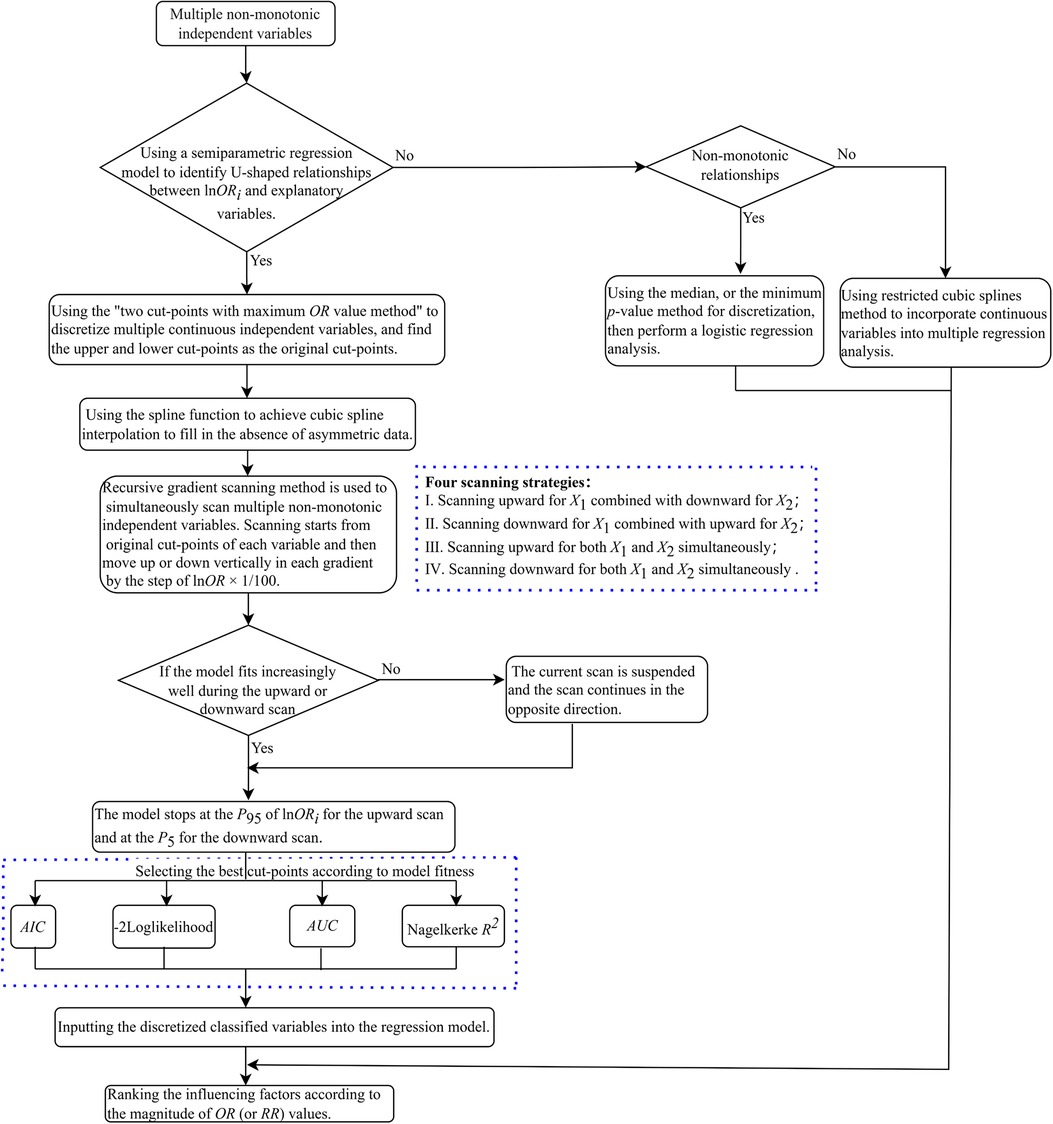
Figure 1. The process of calculation implementation.
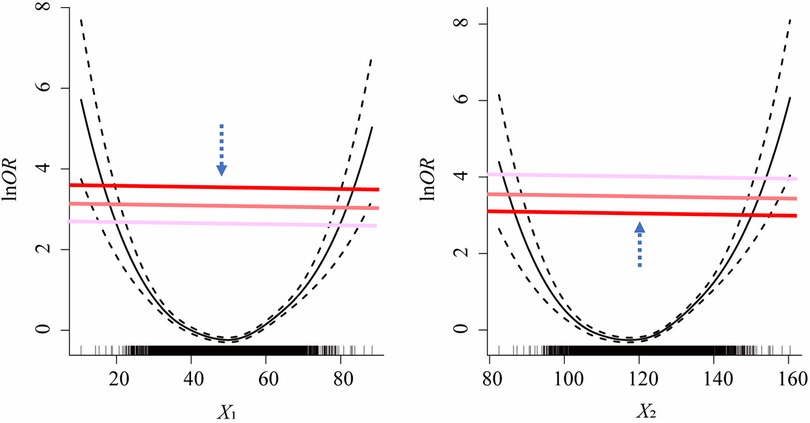
Figure 2. One of the scenarios of the scanning strategies for recursive gradient scanning method (i.e., scanning downward for X1 combined with upward for X2).
2.5.5. Measures of predictive ability
The predictive performance of logistic regression models fitted with covariates discretized by different approaches was evaluated. The areas under the curve (AUC) constructed by receiver operating characteristic (ROC) analysis were calculated to compare different model's predictive capability.
2.5.6. Implementation in R
The minimum p-value method with log-rank statistics was implemented using the R package “maxstat.” The freely available R package “SemiPar” was applied to fit logistic regression models with splines. The two-sided significance level for all tests was set at 0.05, and any p-values less than this threshold were deemed statistically significant. The R programming language, version 4.1.2 (R Foundation for Statistical Computing, http://www.R-project.org), was utilized for conducting the statistical analyses.
3. Results
3.1. Study population
This study included a total of 26,691 participants from NHANES 2007–2016, with an average age of 49.4 years and 51.3% being female. Subjects younger than 20 years of age (n = 21,387) and those having missing data on SBP (n = 2,194), sleep duration (n = 74), and CVDs (n = 242) were excluded. Thus, 26,691 participants were included in the final list (Figure 3).

Figure 3. Flow chart for population selection. This figure represents the sample selection for the analysis of sleep duration as well as SBP with CVDs.
3.2. Characteristics of participants
The characteristics of study participants are presented in Table 1. Among all participants, 10.44% (2,786/26,991) reported having CVDs (826 CHF, 1,039 CHD, 636 angina pectoris, 1,062 heart attack, and 990 stroke). Compared with those without CVDs, participants with CVDs were more likely to be older, lacked physical activities, had higher levels of sedentary time, had higher prevalence of comorbidities, had more treatment, and had low income (all p < 0.0001). In addition, participants with CVDs had significantly higher SBP, fasting blood glucose, triglyceride, CRP and body mass index (BMI) (all p < 0.0001), indicating poor cardiometabolic risk profiles.
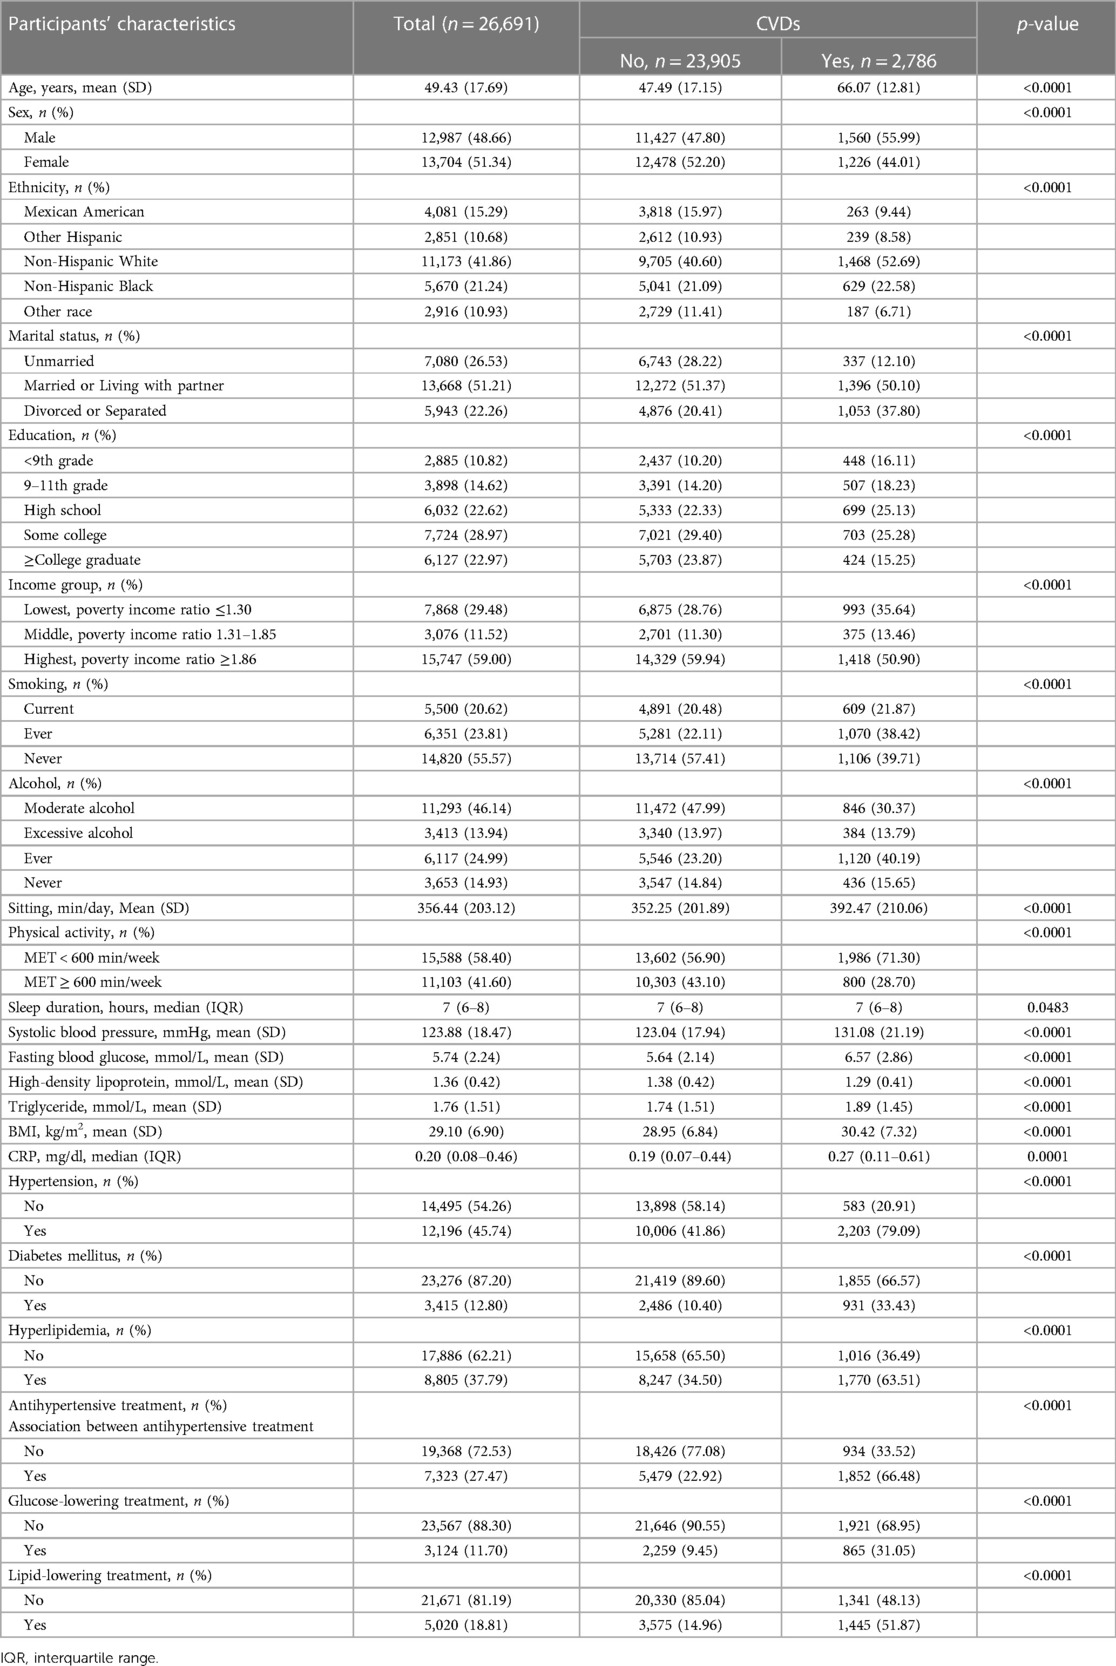
Table 1. The characteristics of participants in the NHANES 2007–2016 according to CVDs.
3.3. The analyses of U-shaped relationship
As depicted in Figure 4, the results of the semiparametric regression analysis found a U-shaped association between sleep duration, SBP, and risks of CVDs. This U-shaped relationship suggested that individuals who sleep for intermediate duration and had healthier SBP levels were at a lower risk for CVDs. To better illustrate the relationships between all continuous variables and CVDs, we plotted the curve in Supplementary Figure S1.
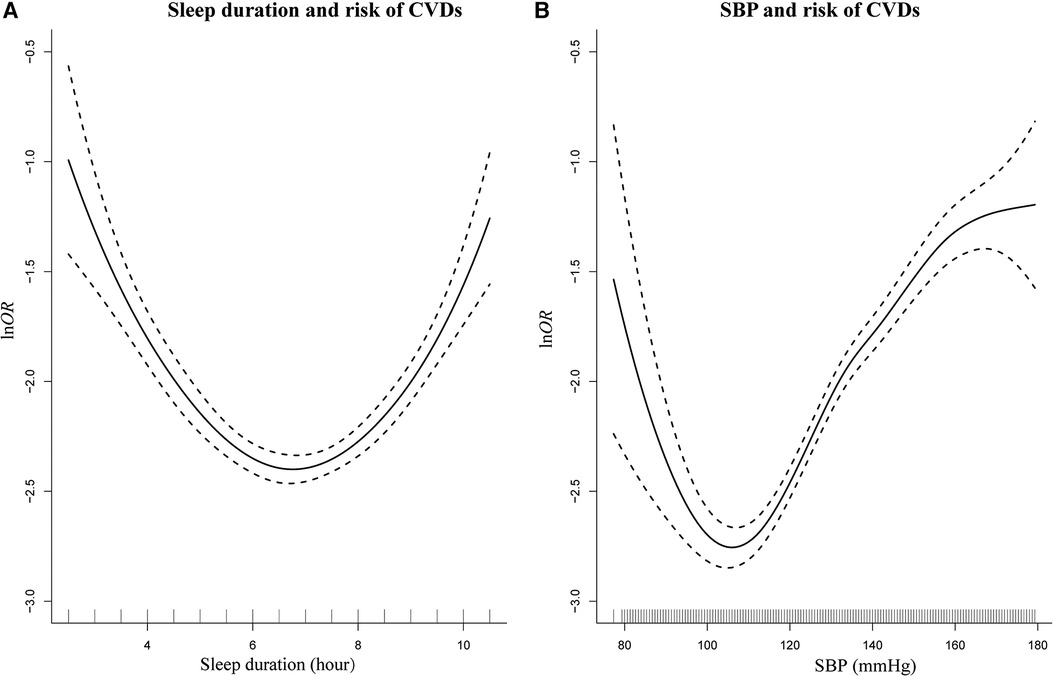
Figure 4. Smoothing plot for sleep duration and SBP with risks of CVDs by semiparametric regression analysis. U-shaped relationships were shown between sleep duration (A), SBP (B), and risks of CVDs [The solid line indicates the point estimation for ln odds ratios (lnOR) of CVDs, and the dotted lines represent 95% confidence intervals (CIs)].
3.4. Relationship between sleep duration, SBP, and CVDs by univariate logistic regression
The performance of logistic regression models for various estimated cut-points is illustrated in Table 2. The original method used to identify cut-points in the semiparametric regression analysis may not have been accurate. A new method, the recursive gradient scanning method, was used and significantly improved the model fitting effect (the new model had larger value in Nagelkerke R2 and smaller values in AIC and −2Loglikelihood). Our findings suggested that categorizing individuals into high-risk and low-risk groups based on the optimal cut-points of the U-shaped curve may offer a more precise depiction of the relationships between sleep duration and the risk of CVDs, as well as between SBP and the risk of CVDs.
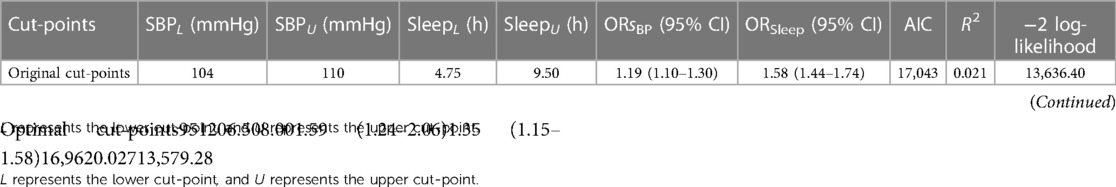
Table 2. Performance of different estimated cut-points in logistic regression.
Finally, we chose 6.5 and 8.0 h as optimal cut-points for sleep duration and chose 95 and 120 mmHg as optimal cut-points for SBP. Short and long sleep duration [OR = 1.35, 95% confidence interval (CI) = 1.15–1.58] was associated with a higher risk of CVDs (p < 0.0001). Participants with healthier SBP levels were at a lower risk for CVDs (OR = 1.59, 95% CI = 1.24–2.06).
3.5. Logistic regression model results after adjusting for covariates
As shown in Table 3, after adjustment for other risk factors, the OR for those with SBP greater than 120 or less than 95 mmHg was found to be 1.17 times greater than for those with SBP between 95 and 120 mmHg (OR = 1.17, 95% CI = 1.01–1.36; p = 0.0375). Similarly, individuals who slept more than 8.0 h per day or less than 6.5 h per day also had a higher risk for CVDs than those who slept between 6.5 and 8.0 h (OR = 1.20, 95% CI = 1.04–1.40; p = 0.0138).
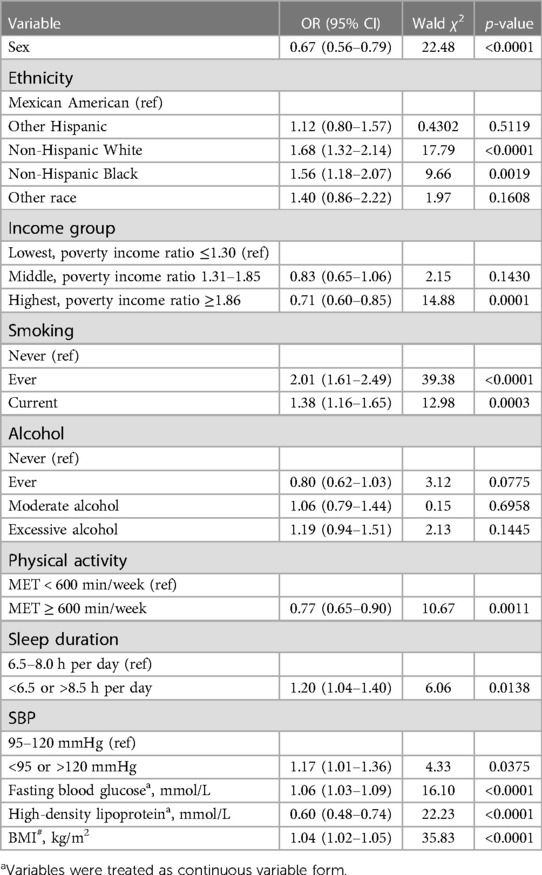
Table 3. Multivariable logistic regression for the final model.
3.6. Predictive ability and goodness-of-fit among different methods
The present study evaluated the predictive capacity of traditional discretization methods and compared it with an optimal model using ROC curve analysis. The results showed that the recursive gradient scanning method has a higher AUC value of 0.8344, indicating a better predictive capacity than traditional discretization methods. Moreover, the adjusted R2 value, which measured how well the model fits the data, was calculated and found to be 0.27812 for the recursive gradient scanning method, higher than the other traditional discretization methods, indicating a better fit of the model to the data. In addition, the goodness-of-fit index AIC was evaluated for all the methods. It was found that the recursive gradient scanning method had the lowest AIC value (AIC = 5,519.389), indicating that it provided an ideal compromise between model complexity and goodness of fit (Table 4).
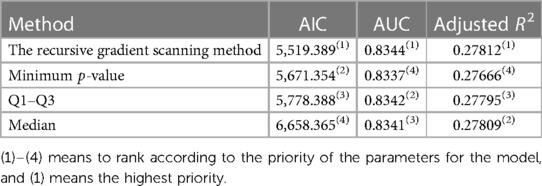
Table 4. The predictive capacity and goodness-of-fit among different methods.
3.7. Association patterns when covariates included
The following charts illustrated that additional adjustments for other covariates did not change the majority of our results. Furthermore, the associations and U-shaped trends between sleep duration, SBP, and CVD remained similar to our main results (Supplementary Figure S2).
4. Discussion
In this nationally representative survey of American adults, among 26,691 participants, 10.44% (sample n = 2,786) of the total reported having CVDs. This study suggested that a U-shaped relationship between sleep duration, SBP, and risk of CVDs, where both extremes of SBP and sleep duration are associated with an elevated risk of CVDs. Consequently, these results provide valuable insight into the potential impact of sleep duration and blood pressure on cardiovascular health.
In medical research, non-monotonic U-shaped dose–response relationships are increasingly common, and predictive models often involve multiple non-monotonic independent variables. If such kinds of explanatory variables are considered directly as candidate independents with a form of continuous variables in the regression model, their non-monotonic features may probably make themselves be eliminated in the followed selection, e.g., a stepwise selection. Therefore, the corresponding factors cannot be mentioned in the design of interventions. This study suggests to discretize factors according to their association with prognosis and to manifest their importance in assessing prognosis. Our previous pioneering research has garnered citations from experts in the field, highlighting the significance of our contributions. These citations from esteemed colleagues underscore the relevance and impact of our work, positioning it at the forefront of scholarly discourse. This recognition encourages us to continue our pursuit of advancing knowledge and making meaningful contributions to the field.
Unfortunately, there is a limited amount of research on discretization methods for multiple continuous variables, particularly in cases where there are U-shaped relationships between outcomes and explanatory variables. Choosing the appropriate discretization method is essential to obtain accurate predictions from statistical models. Therefore, it is critical to develop effective strategies for discretizing multiple continuous variables to ensure that these models are reliable and can be used to guide medical research and clinical decision-making. In this regard, it is essential to compare the predictive capacity of traditional discretization methods with optimal models. The results of our research showed that the recursive gradient scanning method had a higher AUC and adjusted R2 than other traditional discretization methods (including median, minimum p-value, and Q1–Q3), indicating its superior predictive capacity. Moreover, the goodness-of-fit index AIC remained the minimum for the recursive gradient scanning method in all the methods, further highlighting its efficacy in accurately predicting the outcomes of the statistical models. Overall, the results suggested that the recursive gradient scanning method was a promising approach for discretizing multiple non-monotonic independent variables, with potential applications in various fields. Further study is needed to explore the method's full potential and to compare it with other emerging discretization techniques, such as Bayesian classification (36, 37) and decision trees (38, 39).
Our study showed that having high or low SBP levels was associated with a 17% higher risk of CVDs compared to those with SBP within 95–120 mmHg intervals. Our study reinforces the importance of maintaining stable BP levels in managing CVDs. The concept of a U-shaped association between targeted SBP and the risk of morbidity and mortality has been long suggested (40). This hypothesis is based on the assumption of an SBP threshold for autoregulation of organ blood flow, and the potential role of BP as a compensatory mechanism for preserving organ function (41). The observed link between lower SBP and increased risk of CVDs supports the previous concerns about the intensity of antihypertensive treatment in older adults (42). Notably, low blood pressure can not only be harmful in itself but can also indicate poor health status (43). Even in physically fit individuals, low SBP was found to be associated with CVDs (44). However, the currently prevailing paradigm of “the lower, the better” in hypertension management has been challenged by recent randomized clinical trials (RCTs). The ACCORD trial involving diabetic patients (45) revealed that intensive blood pressure lowering (to 120 mmHg SBP) did not result in a decreased risk of cardiovascular outcomes compared to the standard therapy group (to 140 mmHg SBP). In contrast, the link between higher SBP and CVDs has been consistent in epidemiological studies. According to published studies, hypertension was found to be linked with a greater proportion of CVDs when compared to other common risk factors like smoking, obesity, hypercholesterolemia, and diabetes (46, 47). Taking into account the overall evidence, adopting a less aggressive treatment approach may be the optimal approach to manage hypertension (48). Our study expands upon these findings by showing that maintaining a stable SBP level is crucial in reducing the risk of CVDs.
Similarly, individuals who slept for more than 8 h or less than 6.5 h had a higher risk for CVDs than those who slept for 6.5–8 h. The OR for this group was 1.20, indicating that individuals who sleep beyond the normal range have a 20% higher risk of CVDs than those who sleep for the recommended duration (6.5–8.0 h). This finding supported the notion that maintaining optimal sleep durations were critical in reducing the risk of CVDs. Short sleep duration has been consistently associated with increased risks of CVDs in observational studies (6, 49, 50). The pathophysiological mechanisms underlying this association involve abnormalities in the sympathetic nervous system, acceleration of arterial stiffening and atherosclerosis, increased inflammation, and cardiac dysfunction (5, 51, 52). Recent studies have suggested that extended sleep duration could improve cardiovascular health, particularly in college students or prehypertension participants who are often sleep-deprived (53, 54). Therefore, increasing sleep duration among individuals with short sleep may be a promising strategy to reduce the risk of CVDs. On the contrary, some studies have proposed that a longer duration of sleep is linked to a higher risk of developing cardiovascular disease and cardiometabolic disease (55, 56). Physiological changes that could happen include elevated blood pressure (57), impaired glucose metabolism (58), and a rise in cortisol levels (59). Furthermore, there was evidence indicating that a longer duration of sleep is linked to an increase in carotid intima-media thickness (60). Therefore, it may be clinically recommended to advise individuals with prolonged sleep duration to reduce their sleep time.
The current study has several strengths, including the utilization of the recursive gradient scanning method to discretize multiple non-monotonic independent variables. This method provides valuable insights into the relationship between sleep duration, SBP, and the risk of CVDs. Another strength is that we screened multiple influencing factors and then sorted them according to the size of the OR value, which corresponds to the risk level of each influencing factor. It will be helpful to indicate priorities for formulating intervention measures. People at a greater risk of CVDs may benefit significantly from public health campaigns promoting good sleep hygiene in the future.
To properly evaluate the outcomes of this study, it is crucial to recognize several limitations. First of all, the cross-sectional design of NHANES imposes restrictions on establishing causality or accurately determining the direction of the relationship. Thus, it is important to acknowledge the limitations of observational data and the potential for reverse causation when drawing conclusions about causality. Whenever possible, randomized trials and prospective studies can provide more robust evidence for establishing causal relationships. Second, our understanding of the associations may have been underestimated due to the absence of information about the changes over time in sleep duration and SBP, as we only had baseline assessments of these markers. The approach of utilizing mean values from short-term repeated BP measurements to assess CVD risk fails to account for BP variability and inadequately addresses masked hypertension and white coat hypertension. Instead, 24-h ambulatory blood pressure monitoring (ABPM) provides continuous readings, capturing natural fluctuations, nighttime levels, and patterns such as non-dipping. Consideration of a combined approach involving clinic-based and periodic ABPM may yield a more comprehensive evaluation of BP dynamics and CVD risk in certain cases. Third, the study relied solely on self-reported sleep duration data, which could lead to measurement errors and potentially impact the precision of the findings. Future research could benefit from using objective measures of sleep duration, such as polysomnography or actigraphy, to improve data reliability. Furthermore, despite careful adjustment for many potential confounding factors to ensure the validity of the key findings, residual confounding may still exist due to unmeasured risk factors. Therefore, additional research is required to replicate these associations and investigate the mechanisms underlying the results.
5. Conclusion
U-shaped relationships were identified between sleep duration, BP, and risk of CVDs. Both shorter and longer sleep duration/higher and lower SBP are significant predictors of CVDs in large population studies. One should consider duration of sleep and blood pressure control as additional behavioral risk factors that are heavily influenced by environmental factors and can potentially be modified through education, counseling, and public health interventions.
Data availability statement
Publicly available datasets were analyzed in this study. These data can be found here: Centers for Disease Control and Prevention (CDC), National Center for Health Statistics (NCHS), National Health and Nutrition Examination Survey (NHANES), https://wwwn.cdc.gov/nchs/nhanes/default.aspx.
Ethics statement
Ethical review and approval was not required for the study on human participants in accordance with the local legislation and institutional requirements. Written informed consent from the patients/participants or patients/participants' legal guardian/next of kin was not required to participate in this study in accordance with the national legislation and the institutional requirements.
Author contributions
SY was involved in the conception of the article, analyzing the data, interpreting the outcomes, and preparing the initial manuscript. NZ, YH, ZL, HL, YG, JY, and CD assisted in the critical review of the manuscript and interpretation of the outcomes. JZ contributed to the conception of the article and critically reviewed the manuscript. All authors contributed to the article and approved the submitted version.
Funding
This work was supported by the Natural Science Foundation of Guangdong Province, China (grant nos. 2022A1515011237 and 2023A1515011951).
Acknowledgments
The authors acknowledge the selfless work of individuals who assisted with the design of the research and provided guidance for writing the paper.
Conflict of interest
The authors declare that the research was conducted in the absence of any commercial or financial relationships that could be construed as a potential conflict of interest.
Publisher's note
All claims expressed in this article are solely those of the authors and do not necessarily represent those of their affiliated organizations, or those of the publisher, the editors and the reviewers. Any product that may be evaluated in this article, or claim that may be made by its manufacturer, is not guaranteed or endorsed by the publisher.
Supplementary material
The Supplementary Material for this article can be found online at: https://www.frontiersin.org/articles/10.3389/fcvm.2023.1210171/full#supplementary-material
Abbreviations
RCTs, randomized controlled trials; BP, blood pressure; SBP, systolic blood pressure; CVDs, cardiovascular diseases; BMI, body mass index; CI, confidence interval; AIC, Akaike information criterion; OR, odds ratio; Min-P, the minimum
References
1. Lavie CJ. Progress in cardiovascular diseases statistics 2022. Prog Cardiovasc Dis. (2022) 73:94–5. doi: 10.1016/j.pcad.2022.08.005
2. Wang C, Bangdiwala SI, Rangarajan S, Lear SA, AlHabib KF, Mohan V, et al. Association of estimated sleep duration and naps with mortality and cardiovascular events: a study of 116 632 people from 21 countries. Eur Heart J. (2019) 40(20):1620–9. doi: 10.1093/eurheartj/ehy695
3. McEvoy JW, Chen Y, Rawlings A, Hoogeveen RC, Ballantyne CM, Blumenthal RS, et al. Diastolic blood pressure, subclinical myocardial damage, and cardiac events: implications for blood pressure control. J Am Coll Cardiol. (2016) 68(16):1713–22. doi: 10.1016/j.jacc.2016.07.754
4. Cappuccio FP, Cooper D, D’Elia L, Strazzullo P, Miller MA. Sleep duration predicts cardiovascular outcomes: a systematic review and meta-analysis of prospective studies. Eur Heart J. (2011) 32(12):1484–92. doi: 10.1093/eurheartj/ehr007
5. Daghlas I, Dashti HS, Lane J, Aragam KG, Rutter MK, Saxena R, et al. Sleep duration and myocardial infarction. J Am Coll Cardiol. (2019) 74(10):1304–14. doi: 10.1016/j.jacc.2019.07.022
6. Yin J, Jin X, Shan Z, Li S, Huang H, Li P, et al. Relationship of sleep duration with all-cause mortality and cardiovascular events: a systematic review and dose-response meta-analysis of prospective cohort studies. J Am Heart Assoc. (2017) 6(9):e005947. doi: 10.1161/JAHA.117.005947
7. Mancia G, Grassi G. Aggressive blood pressure lowering is dangerous: the J-curve: pro side of the arguement. Hypertension. (2014) 63(1):29–36. doi: 10.1161/HYPERTENSIONAHA.113.01922
8. Messerli FH, Panjrath GS. The J-curve between blood pressure and coronary artery disease or essential hypertension: exactly how essential? J Am Coll Cardiol. (2009) 54(20):1827–34. doi: 10.1016/j.jacc.2009.05.073
9. Knüppel L, Hermsen O. Median split, k-group split, and optimality in continuous populations. AStA Adv Stat Anal. (2010) 94:53–74. doi: 10.1007/s10182-010-0122-5
10. Schellingerhout JM, Heymans MW, de Vet HCW, Koes BW, Verhagen AP. Categorizing continuous variables resulted in different predictors in a prognostic model for nonspecific neck pain. J Clin Epidemiol. (2009) 62(8):868–74. doi: 10.1016/j.jclinepi.2008.10.010
11. Miaskowski C, Paul SM, Harris CS, Shin J, Oppegaard K, Conley YP, et al. Determination of cutpoints for symptom burden in oncology patients receiving chemotherapy. J Pain Symptom Manage. (2022) 63(1):42–51. doi: 10.1016/j.jpainsymman.2021.07.018
12. Govindarajulu U, Tarpey T. Optimal partitioning for the proportional hazards model. J Appl Stat. (2022) 49(4):968–87. doi: 10.1080/02664763.2020.1846690
13. Roshani D, Ghaderi E. Comparing smoothing techniques for fitting the nonlinear effect of covariate in Cox models. Acta Inform Med. (2016) 24(1):38. doi: 10.5455/aim.2016.24.38-41
14. Lin H, Zelterman D. Modeling survival data: Extending the cox model. Technometrics (2002) 44(1):85–6. doi: 10.1198/tech.2002.s656
15. Shen S, Yan X, Xu B. The blood urea nitrogen/creatinine (BUN/cre) ratio was U-shaped associated with all-cause mortality in general population. Renal Fail. (2022) 44(1):184–90. doi: 10.1080/0886022X.2022.2030359
16. He K, Pang T, Huang H. The relationship between depressive symptoms and BMI: 2005–2018 NHANES data. J Affect Disord. (2022) 313:151–7. doi: 10.1016/j.jad.2022.06.046
17. López-Ratón M, Rodríguez-Álvarez MX, Cadarso-Suárez C, Gude-Sampedro F. Optimalcutpoints: an R package for selecting optimal cutpoints in diagnostic tests. J Stat Softw. (2014) 61(8):1–36. doi: 10.18637/jss.v061.i08
18. Williams B, Mandrekar J, Mandrekar S, Cha S, Furth A. Finding optimal cutpoints for continuous covariates with binary and time-to-event outcomes. Rochester, MN: Department of Health Sciences Research, Mayo Clinic (2006). Technical Report Series #79.
19. Tunes-da-Silva G, Klein JP. Cutpoint selection for discretizing a continuous covariate for generalized estimating equations. Comput Stat Data Anal. (2011) 55(1):226–35. doi: 10.1016/j.csda.2010.02.016
20. White KT, Moorthy MV, Akinkuolie AO, Demler O, Ridker PM, Cook NR, et al. Identifying an optimal cutpoint for the diagnosis of hypertriglyceridemia in the nonfasting state. Clin Chem. (2015) 61(9):1156–63. doi: 10.1373/clinchem.2015.241752
21. Nelson SP, Ramakrishnan V, Nietert PJ, Kamen DL, Ramos PS, Wolf BJ. An evaluation of common methods for dichotomization of continuous variables to discriminate disease status. Commun Stat Theory Methods. (2017) 46(21):10823–34. doi: 10.1080/03610926.2016.1248783
22. Bornmann L, Leydesdorff L, Mutz R. The use of percentiles and percentile rank classes in the analysis of bibliometric data: opportunities and limits. J Informetr. (2013) 7(1):158–65. doi: 10.1016/j.joi.2012.10.001
23. MacCallum RC, Zhang S, Preacher KJ, Rucker DD. On the practice of dichotomization of quantitative variables. Psychol Methods. (2002) 7(1):19. doi: 10.1037/1082-989X.7.1.19
24. Mabikwa OV, Greenwood DC, Baxter PD, Fleming SJ. Assessing the reporting of categorised quantitative variables in observational epidemiological studies. BMC Health Serv Res. (2017) 17(1):1–8. doi: 10.1186/s12913-016-1943-z
25. Woo SY, Kim S. Determination of cutoff values for biomarkers in clinical studies. Precis Future Med. (2020) 4(1):2–8. doi: 10.23838/pfm.2019.00135
26. He X. Comparison of the effects of discretization methods of continuous explanatory variables based on logistic regression. Chin J Hosp Stat. (2022) 29(4):312–7. doi: 10.3969/j.issn.1006-5253.2022.04.016
27. Chen Y, Huang J, He X, Gao Y, Mahara G, Lin Z, et al. A novel approach to determine two optimal cut-points of a continuous predictor with a U-shaped relationship to hazard ratio in survival data: simulation and application. BMC Med Res Methodol. (2019) 19(1):96. doi: 10.1186/s12874-019-0738-4
28. Wang S, Fan C, Zhu Y, Tang X, Ling L. The obesity-related dietary pattern is associated with higher risk of sleep disorders: a cross-sectional study from NHANES. Nutrients. (2022) 14(19):3987. doi: 10.3390/nu14193987
29. Johnson CL, Paulose-Ram R, Ogden CL, Carroll MD, Kruszon-Moran D, Dohrmann SM, et al. National health and nutrition examination survey: analytic guidelines, 1999–2010. Vital Health Stat. (2013) 2(161):1–24. https://stacks.cdc.gov/view/cdc/21305
30. Castro-Diehl C, Wood AC, Redline S, Reid M, Johnson DA, Maras JE, et al. Mediterranean diet pattern and sleep duration and insomnia symptoms in the multi-ethnic study of atherosclerosis. Sleep. (2018) 41(11):zsy158. doi: 10.1093/sleep/zsy158
31. Kurotani K, Kochi T, Nanri A, Eguchi M, Kuwahara K, Tsuruoka H, et al. Dietary patterns and sleep symptoms in Japanese workers: the Furukawa nutrition and health study. Sleep Med. (2015) 16(2):298–304. doi: 10.1016/j.sleep.2014.09.017
32. Yu C, Shi Z, Lv J, Guo Y, Bian Z, Du H, et al. Dietary patterns and insomnia symptoms in Chinese adults: the China Kadoorie biobank. Nutrients. (2017) 9(3):232. doi: 10.3390/nu9030232
33. Kirkpatrick SI, Dodd KW, Reedy J, Krebs-Smith SM. Income and race/ethnicity are associated with adherence to food-based dietary guidance among US adults and children. J Acad Nutr Diet. (2012) 112(5):624–35. doi: 10.1016/j.jand.2011.11.012
34. Saint-Maurice PF, Graubard BI, Troiano RP, Berrigan D, Galuska DA, Fulton JE, et al. Estimated number of deaths prevented through increased physical activity among US adults. JAMA Intern Med. (2022) 182(3):349–52. doi: 10.1001/jamainternmed.2021.7755
35. Wand M, Coull B, French J, Ganguli B, Kammann E, Staudenmayer J, et al. SemiPar 1.0. R package (2005). Available at: http://cran.r-project.org/web/packages/SemiPar (Accessed 1 July 2022).
36. Ropero RF, Renooij S, Van der Gaag LC. Discretizing environmental data for learning Bayesian-network classifiers. Ecol Model. (2018) 368:391–403. doi: 10.1016/j.ecolmodel.2017.12.015
37. Scalco E, Mastropietro A, Bodini A, Marzi S, Rizzo G. A multi-variate framework to assess reliability and discrimination power of Bayesian estimation of intravoxel incoherent motion parameters. Phys Med. (2021) 89:11–9. doi: 10.1016/j.ejmp.2021.07.025
38. Priyanka KD. Decision tree classifier: a detailed survey. Int J Inf Decis Sci. (2020) 12(3):246–69. doi: 10.1504/IJIDS.2020.108141
39. Le Ray I, Lee B, Wikman A, Reilly M. Evaluation of a decision tree for efficient antenatal red blood cell antibody screening. Epidemiology. (2018) 29(3):453–7. doi: 10.1097/EDE.0000000000000805
40. Hua Q, Fan L, Li J. 2019 Chinese guideline for the management of hypertension in the elderly. J Geriatr Cardiol. (2019) 16(2):67–99. doi: 10.11909/j.issn.1671-5411.2019.02.001
41. Zanchetti A. Blood pressure targets of antihypertensive treatment: up and down the J-shaped curve. Eur Heart J. (2010) 31(23):2837–40. doi: 10.1093/eurheartj/ehq281
42. Benetos A, Bulpitt CJ, Petrovic M, Ungar A, Agabiti Rosei E, Cherubini A, et al. An expert opinion from the European Society of Hypertension–European Union Geriatric Medicine Society Working Group on the management of hypertension in very old, frail subjects. Hypertension. (2016) 67(5):820–5. doi: 10.1161/HYPERTENSIONAHA.115.07020
43. Makin S, Stott DJ. Managing blood pressure in older adults. Br Med J. (2018) 362:k2912. doi: 10.1136/bmj.k2912
44. Ravindrarajah R, Hazra NC, Hamada S, Charlton J, Jackson SHD, Dregan A, et al. Systolic blood pressure trajectory, frailty, and all-cause mortality >80 years of age: cohort study using electronic health records. Circulation. (2017) 135(24):2357–68. doi: 10.1161/CIRCULATIONAHA.116.026687
45. Cushman WC, Evans GW, Byington RP, Goff DC, Grimm RH, Cutler JA, et al. Effects of intensive blood-pressure control in type 2 diabetes mellitus. N Engl J Med. (2010) 362(17):1575–85. doi: 10.1056/NEJMoa1001286
46. Cheng S, Claggett B, Correia AW, Shah AM, Gupta DK, Skali H, et al. Temporal trends in the population attributable risk for cardiovascular disease: the atherosclerosis risk in communities study. Circulation. (2014) 130(10):820–8. doi: 10.1161/CIRCULATIONAHA.113.008506
47. Howard G, Cushman M, Kissela BM, Kleindorfer DO, McClure LA, Safford MM, et al. Traditional risk factors as the underlying cause of racial disparities in stroke: lessons from the half-full (empty?) glass. Stroke. (2011) 42(12):3369–75. doi: 10.1161/STROKEAHA.111.625277
48. Benetos A, Petrovic M, Strandberg T. Hypertension management in older and frail older patients. Circ Res. (2019) 124(7):1045–60. doi: 10.1161/CIRCRESAHA.118.313236
49. Anujuo K, Agyemang C, Snijder MB, Jean-Louis G, van den Born BJ, Peters RJ, et al. Contribution of short sleep duration to ethnic differences in cardiovascular disease: results from a cohort study in the Netherlands. BMJ open. (2022) 7(11):e017645. doi: 10.1136/bmjopen-2017-017645
50. Wang ZY, Yang WZ, Li XR, Qi XY, Pan KY, Xu WL. Association of sleep duration, napping, and sleep patterns with risk of cardiovascular diseases: A Nationwide twin study. J Am Heart Assoc. (2022) 11(15):e025969. doi: 10.1161/JAHA.122.025969
51. Ai S, Zhang J, Zhao G, Wang N, Li G, So HC, et al. Causal associations of short and long sleep durations with 12 cardiovascular diseases: linear and nonlinear Mendelian randomization analyses in UK biobank. Eur Heart J. (2021) 42(34):3349–57. doi: 10.1093/eurheartj/ehab170
52. Wang YX, Zhang L, Li CJ, Qi X, Fan YQ, He JS, et al. Predicted 10-year cardiovascular disease risk and its association with sleep duration among adults in Beijing-Tianjin-Hebei region, China. Biomed Environ Sci. (2021) 34(10):803–13. doi: 10.3967/bes2021.109
53. Stock AA, Lee S, Nahmod NG, Chang A-M. Effects of sleep extension on sleep duration, sleepiness, and blood pressure in college students. Sleep Health. (2020) 6(1):32–9. doi: 10.1016/j.sleh.2019.10.003
54. Haack M, Serrador J, Cohen D, Simpson N, Meier-Ewert H, Mullington JM. Increasing sleep duration to lower beat-to-beat blood pressure: a pilot study. J Sleep Res. (2013) 22(3):295–304. doi: 10.1111/jsr.12011
55. Aziz M, Ali SS, Das S, Younus A, Malik R, Latif MA, et al. Association of subjective and objective sleep duration as well as sleep quality with non-invasive markers of sub-clinical cardiovascular disease (CVD): a systematic review. J Atheroscler Thromb. (2017) 24(3):208–26. doi: 10.5551/jat.36194
56. Kwok CS, Kontopantelis E, Kuligowski G, Gray M, Muhyaldeen A, Gale CP, et al. Self-reported sleep duration and quality and cardiovascular disease and mortality: a dose-response meta-analysis. J Am Heart Assoc. (2018) 7(15):e008552. doi: 10.1161/JAHA.118.008552
57. Gangwisch JE, Heymsfield SB, Boden-Albala B, Buijs RM, Kreier F, Pickering TG, et al. Short sleep duration as a risk factor for hypertension: analyses of the first national health and nutrition examination survey. Hypertension. (2006) 47(5):833–9. doi: 10.1161/01.HYP.0000217362.34748.e0
58. Tasali E, Leproult R, Spiegel K. Reduced sleep duration or quality: relationships with insulin resistance and type 2 diabetes. Prog Cardiovasc Dis. (2009) 51(5):381–91. doi: 10.1016/j.pcad.2008.10.002
59. Balbo M, Leproult R, Van Cauter E. Impact of sleep and its disturbances on hypothalamo-pituitary-adrenal axis activity. Int J Endocrinol. (2010) 2010:759234. doi: 10.1155/2010/759234
Keywords: sleep duration, systolic blood pressure, cardiovascular diseases, U-shape, retrospective study
Citation: Yang S, Zhang N, Liang Z, Han Y, Luo H, Ge Y, Yin J, Ding C, Li C, Zhang Q and Zhang J (2023) Examining the U-shaped relationship of sleep duration and systolic blood pressure with risk of cardiovascular events using a novel recursive gradient scanning model. Front. Cardiovasc. Med. 10:1210171. doi: 10.3389/fcvm.2023.1210171
Received: 16 May 2023; Accepted: 31 August 2023;
Published: 14 September 2023.
Edited by:
Pietro Scicchitano, ASLBari—Azienda Sanitaria Localedella provincia di Bari (ASL BA), ItalyReviewed by:
William Lumu, Uganda Christian University, UgandaNing Ding, Changsha Central Hospital, China
Arcady A. Putilov, Federal Research Center of Fundamental and Translational Medicine, Russia
© 2023 Yang, Zhang, Liang, Han, Luo, Ge, Yin, Ding, Li, Zhang and Zhang. This is an open-access article distributed under the terms of the Creative Commons Attribution License (CC BY). The use, distribution or reproduction in other forums is permitted, provided the original author(s) and the copyright owner(s) are credited and that the original publication in this journal is cited, in accordance with accepted academic practice. No use, distribution or reproduction is permitted which does not comply with these terms.
*Correspondence: Jinxin Zhang emhqaW54QG1haWwuc3lzdS5lZHUuY24=