
95% of researchers rate our articles as excellent or good
Learn more about the work of our research integrity team to safeguard the quality of each article we publish.
Find out more
ORIGINAL RESEARCH article
Front. Cardiovasc. Med. , 30 June 2023
Sec. Cardiovascular Epidemiology and Prevention
Volume 10 - 2023 | https://doi.org/10.3389/fcvm.2023.1153926
 Haitao Huang1
 Jianhong Liu1,2,†Xiao Liang1,2,†Lingyan Fang1Chenhui Yang3Kangling Ke1,2Hemanyun Bai1,2Weize Xu1,2Weiyan Li1,2Fanji Meng1Can Chen1*
Background: An accurate assessment of current trends in cardiovascular risks could inform public health policy. This study aims to determine 20-year trends in the prevalence of elevated cardiovascular risk and its risk factors' control among US adults.
Methods: In this serial cross-sectional analysis of 23,594 adults, aged 40–79 years, without clinical atherosclerotic cardiovascular disease (ASCVD) in the National Health and Nutrition Examination Survey from 2001 to 2020, we calculated the prevalence of elevated cardiovascular risk (10-year ASCVD risk ≥ 7.5%) for all participants and subgroups with their risk factors controlled for diabetes, hypertension, or dyslipidemia.
Results: The age- and sex-adjusted prevalence of elevated cardiovascular risk slightly decreased from 41.5% (95% CI, 39.7–43.3%) in 2001–2004 to 38.6% (95% CI, 36.1–41.1%) in 2017–2020 (P for trend = 0.169) while the respective sex-adjusted prevalence significantly increased from 34.4% (95% CI, 32.8–36.0%) to 39.5% (95% CI, 37.0–42.0%; P for trend <0.001). Sex and race continued to show disparities in cardiovascular risk. Furthermore, a worsening disparity in age- and sex-adjusted prevalence of elevated cardiovascular risk between young and old and a narrowing gap among different education and poverty index levels (all P trend for interaction <0.05). Differential decomposition analysis found that demographic changes (primarily population aging) led to an 8.8% increase in the prevalence of elevated cardiovascular risk from 2001 to 2004 to 2017–2020, while risk factor control led to a 3.8% decrease. The rate of individuals receiving treatment for diabetes, hypertension, or dyslipidemia increased significantly between 2001 and 2020 (all P for trend <0.05). The rate of participants with hypertension who achieved blood pressure under 130/80 mmHg and those with dyslipidemia who achieved a non-high-density lipoprotein cholesterol level under 130 mg/dl increased significantly (all P for trend <0.001).
Conclusions: There is a slight reduction in the prevalence of age- and sex-adjusted elevated cardiovascular risk among US adults without clinical ASCVD between 2001 and 2020, while the sex-adjusted prevalence significantly increased. The decrease in elevated cardiovascular risk prevalence was mainly attributed to risk factor control, while demographic changes contributed to an increase.
Although cardiovascular outcomes have improved due to advances in medical care and clinical management, cardiovascular disease (CVD) remains the leading cause of morbidity and mortality in the US (1). Furthermore, the total CVD mortality decline rate slowed considerably to under 1% annually in 2011–2018 but increased for age-adjusted stroke mortality in 2016–2017 (2–4). The American Heart Association estimates that 40.5% of the US population will experience CVD by 2030, resulting in total direct medical costs of $818 billion, triple the cost in 2010 (5). CVD prevention is presently a public health priority.
Risk assessment of atherosclerotic cardiovascular disease (ASCVD) is key to CVD prevention and clinical management (6). Estimation using traditional CVD risk factors, including age, sex, race, blood pressure (BP), cholesterol, smoking, and history of diabetes, has been widely used, e.g., in the Pooled Cohort Equations (PCE) (7). PCE is a sex- and race-specific equation that estimates the 10-year ASCVD risk, stratifying the score into four risk groups (<5, 5–7.5, 7.5–20, and ≥20%) (7, 8). Multiple risk stratifications are conducive to good management, but inconvenient for clinical application. A PCE score of 7.5% is a significant threshold for primary prevention. Lipid management guidelines defined adults with PCE score ≥7.5% as “elevated-risk populations” that should consider initiating cost-effective statin therapy for primary prevention (8–12). Understanding the long-term trends in the prevalence of elevated-risk populations and their risk factors' control in ASCVD-free populations by racial and sociodemographic subgroups could help develop evidence-based healthcare policies, programs, and resource allocation.
The purpose of this study was to assess 20-year trends in the prevalence of elevated cardiovascular risk (PCE score ≥ 7.5%) in ASCVD-free US adults and investigate their risk factors' control in individuals with diabetes, hypertension, and dyslipidemia from 2001 to 2020.
This study utilized data collected from the National Health and Nutrition Examination Survey (NHANES), an ongoing survey that provides health and nutritional information to noninstitutionalized civilians in the US. We included eight 2-year NHANES cycles (2001–2016) and a 4-year pre-pandemic cycle (2017–2020). To minimize the small sample size impact and improve estimates precision, we pooled the survey years into five 4-year periods (13–15). Participants aged 40–79 without clinical ASCVD (any event of coronary heart disease, heart attack, angina, or stroke) were included. Participants with missing data on BP, anti-hypertensive medication use, total cholesterol (TC), high-density lipoprotein cholesterol (HDL-C), smoking status, or a history of diabetes were excluded. The National Center for Health Statistics Institutional Review Board approved the study protocol.
Information about age, sex, race/ethnicity, poverty index, insurance, smoking status, current medication use, and medical conditions was collected during in-home interviews. Mobile examination centers were used to measure weight, height, and BP using standardized techniques. BP was measured three consecutive times using an auscultatory (mercury sphygmomanometer) in 2001–2016 and a digital oscillometer (Omron HEM-907XL, Omron Healthcare) in 2017–2020. We calculated mean systolic and diastolic BP using all available readings. On the basis of the difference between auscultatory and oscillometric devices, we added 1.5 mmHg to oscillometer-measured systolic BP and subtracted 1.3 mmHg from diastolic BP for participants in 2017–2020 to adjust the oscillometer values to those of a mercury sphygmomanometer (14, 16).
TC, HDL-C, triglycerides, and hemoglobin A1c (HbA1c) were determined by standard methods using blood samples collected in the mobile examination center. Low-density lipoprotein cholesterol (LDL-C) was calculated using the Friedewald equation (17) when triglycerides were ≤400 mg/dl and the Sampson equation (18, 19) when 400–800 mg/dl. Non–HDL-C was calculated by subtracting HDL-C from TC. Multiplying TC, LDL-C, HDL-C, and non-HDL-C values by 0.0259 to convert them to millimoles per liter. Multiply by 0.0113 to convert triglycerides into millimoles per liter.
Elevated cardiovascular risk was defined as a 10-year ASCVD risk ≥7.5% using the PCE among ASCVD-free adults aged 40–79 (9, 20, 21). The elevated cardiovascular risk prevalence was assessed by sex, race, and other sociodemographic groups.
We included both diagnosed and undiagnosed cases of diabetes, hypertension, and dyslipidemia. Diagnosed cases were identified based on self-reported diagnosis or the use of disease-specific medications. For diabetes, undiagnosed cases were defined as individuals with HbA1c ≥ 6.5%, excluding those who had already received a diagnosis (22). Similarly, undiagnosed hypertension was defined as systolic blood pressure ≥140 mmHg and/or diastolic blood pressure ≥90 mmHg, with diagnosed cases being excluded (23). Dyslipidemia was defined as at least one abnormality in TC, LDL-C, triglycerides, or HDL-C (Supplementary Methods S1) (24, 25).
The prevalence of diagnostic rate (e.g., the proportion of patients diagnosed with diabetes from all those with diabetes), medication use, and clinical risk factors were investigated separately in individuals with diabetes, hypertension, or dyslipidemia. The stringent and relaxed diabetes control targets were HbA1c <7% and <8%, respectively (22, 26). The stringent and relaxed BP control targets were <130/80 and <140/90 mmHg (27). The control targets for dyslipidemia were non-HDL-C < 130 mg/dl and HDL-C ≥ 60 mg/dl. Statins were recommended to individuals with LDL-C > 190 mg/dl or a PCE score ≥ 7.5% with one or more CVD risk factors (e.g., dyslipidemia, diabetes, hypertension, or smoking) (8, 11). TC < 200 mg/dl and LDL-C < 100 mg/dl as lipid control targets for statin recommended populations (25).
The unadjusted and adjusted prevalence of elevated cardiovascular risk were calculated separately for each four-year cycle. Age- and sex-adjusted estimates were standardized to the 2017–2018 NHANES data using the direct method and the following eight age and sex groups: ages 40–49, 50–59, 60–69, and 70–79 separately for males and females (Supplementary Methods S2). Considering the skewed distribution of the PCE score, geometric mean was presented for each calendar period. The control of glycemia, BP, and lipids was assessed according to the diagnosis rate, medication use, and achieved rate. We performed subgroup analyses by sex (male/female), race/ethnicity (non-Hispanic White, non-Hispanic Black, Hispanic, and other race), age (40–49, 50–59, 60–69, and 70–79 yeas), education levels (< high school, high school, and > high school), body mass index [<25.0, 25.0–29.9, and ≥30.0 (obesity) kg/m2], poverty index (<1.3, 1.3–3.49, and ≥3.50), insurance (uninsured/insured), current smoker (no/yes), and comorbidity (hypertension, diabetes, and dyslipidemia).
Linear trends were assessed using weighted regression, modeling the midpoint of each period. Trends for subgroup differences were assessed using the weighted likelihood ratio test by incorporating an interaction term between calendar year and sociodemographic subgroup in the regression models. Sex-specific logistic regression models assessed the associations between the survey period (a categorical variable) and the prevalence of elevated cardiovascular risk as a function of the survey period, adjusted for age and then further for race/ethnicity, education level, poverty index, and insurance status. Subsequently, the model was run without age to determine the impact of aging on trends in elevated cardiovascular risk prevalence. The contribution of population aging and other influencing factors to the change in the elevated cardiovascular risk prevalence was estimated using differential decomposition (Supplementary Methods S3) (28).
All analyses were conducted using the “survey” package in R software (version 4.1.2). Sample weights, clustering, and stratification were used to obtain nationally representative estimates. Two-sided P < 0.05 was considered statistically significant.
Of this study (n = 31,528), we excluded those with clinical ASCVD (n = 4,136) or missing data on estimating 10-year ASCVD risk (n = 3,798), resulting in a total of 23,594 participants (representing 105.3 million non-institutional residents of the US; Supplementary Figure S1) for analysis. The mean age of enrolled participants was 54.9 (10.2) years, and 12,179 (52.6%) were female (Supplementary Table S4). Missing data on education level [n = 17 (0.1%)], body mass index (n = 263 [1.1%]), poverty index (n = 2,092 [8.9%]), insurance status (n = 56 [0.2%]), HbA1c (n = 36 [0.2%]), and LDL-C (n = 118 [0.5%]). Participants with an education level below high school declined from 15.9% in 2001–2004 to 10.4% in 2017–2020, and those with obesity increased from 33.2% to 43.4% (Table 1). Living in poverty was noted in 14.3–17.3% of the participants, 84.0–90.4% had health insurance, and current smokers decreased from 21.3% to 15.1%.
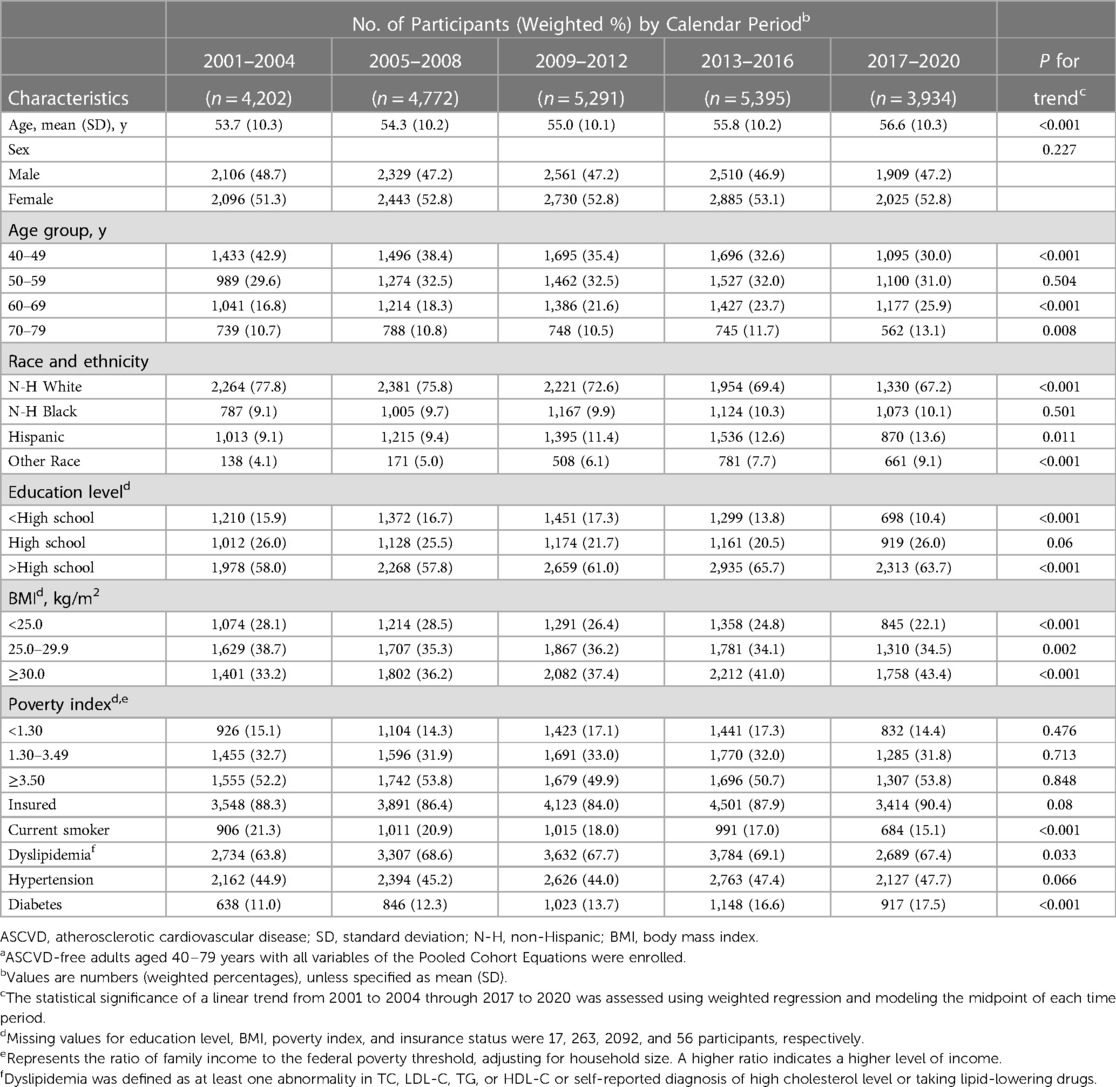
Table 1. Characteristics of participants without clinical ASCVD among US adults, 2001–2020a.
The projected 10-year ASCVD risk score showed a right-skewed distribution, in males significantly larger than in females (Supplementary Figure S2). The age- and sex-adjusted 10-year ASCVD risk geometric mean decreased from 5.1% (95% CI, 4.9%–5.4%) in 2001–2004 to 4.6% (95% CI, 4.4%–4.8%) in 2009–2012, but then rose to 4.7% (95% CI, 4.4%–5.0%) in 2017–2020 (P for linear trend = 0.054), with similar trends for males and females. The 10-year ASCVD risk showed a significant decrease in Hispanic during 2001–2020 (P for linear trend = 0.027), while it slightly increased in non-Hispanic Black (Supplementary Table S1).
The age- and sex-adjusted prevalence of elevated cardiovascular risk had slightly decreased from 2001 to 2004 (41.5% [95% CI, 39.7–43.3%]) to 2017–2020 (38.6% [95% CI, 36.1–41.1%]) (P for linear trend = 0.169; Figure 1, Supplementary Table S2). Similar trends were seen in males and females. During 2001–2020, there was a significant decline among participants aged 40–49 (P for linear trend = 0.001) and 60–69 years (P for linear trend = 0.032), a relatively stable trend among those aged 50–59 and 70–79 years. Similar declining trends were noted when analyzed by age, sex, education, body mass index, poverty index, and insurance. However, we noted a worsening disparity between young and old and a narrowing gap among education and poverty index levels (all P trend for interaction <0.05; Supplementary Table S2). The elevated cardiovascular risk improved significantly among the less-educated and the poor and slightly among the more-educated and wealthy participants.
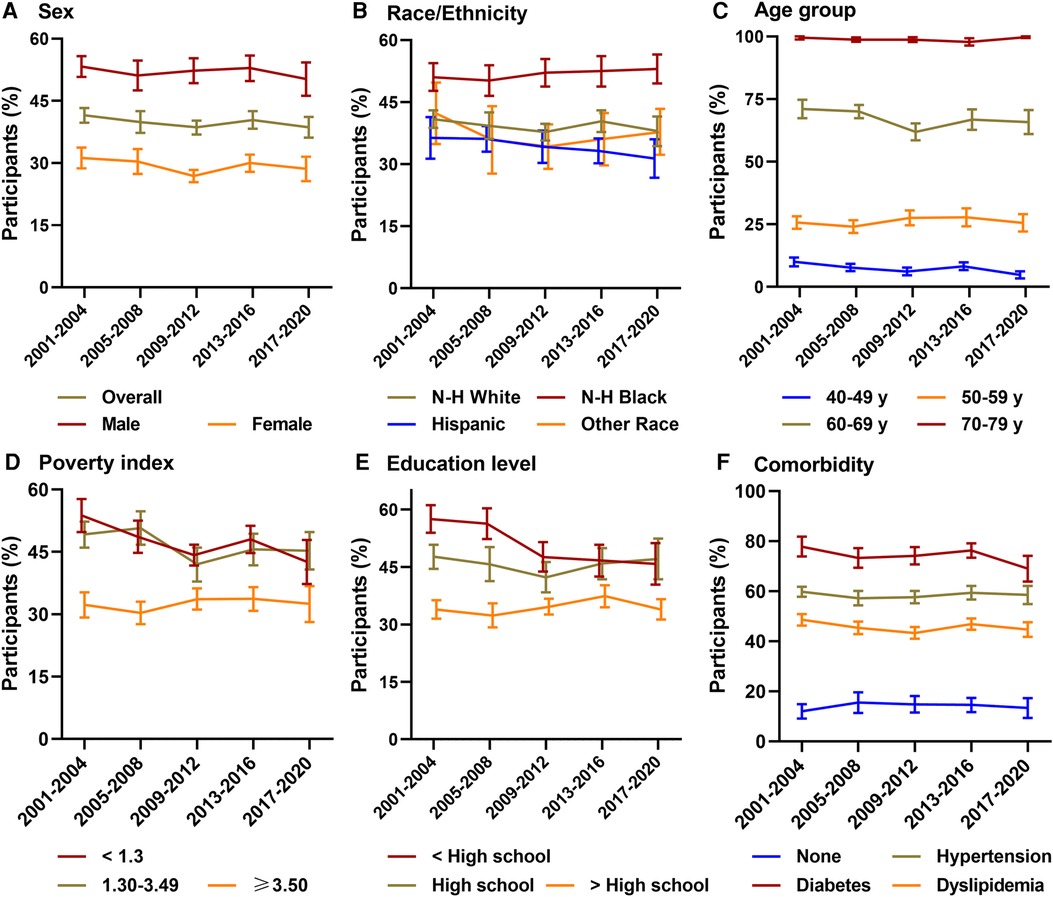
Figure 1. Prevalence of elevated cardiovascular risk among US adults, 2001–2020. N-H, Non-Hispanic; ASCVD, atherosclerotic cardiovascular disease. Survey-weighted national proportion (line) and 95% CIs (error bars) are shown (A) overall and by sex, (B) race/ethnicity, (C) age group, (D) poverty index, (E) education level, and (F) comorbidity. Elevated cardiovascular risk was defined as a projected 10-year ASCVD risk of 7.5% or greater using the Pooled Cohort Equations. All estimates were standardized to the 2017–2018 NHANES ASCVD-free adults by the direct method. For males and females, the estimates were age-adjusted, and for other groups, it was age- and sex-adjusted. In comorbidity, none was defined as participants without dyslipidemia, hypertension, and diabetes.
The sex-adjusted prevalence of elevated cardiovascular risk significantly rose through 2001–2020 from 34.4% (95% CI, 32.8–36.0%) to 39.5% (95% CI, 37.0–42.0%) (P for linear trend <0.001; Supplementary Table S3). It had a 6.4% (95% CI, 1.6–11.3%) absolute increase in males and a 4.0% (95% CI, 0.4%–7.7%) increase in females during 2001–2020. Males had a higher prevalence of elevated cardiovascular risk than females (all P for group difference <0.001), females were nearly half as likely to have an elevated cardiovascular risk in 2017–2020 (29.4% [95% CI, 26.3–32.4%]) as males (51.2% [95% CI, 47.2–55.2%]). Non-Hispanic Black were more likely than Hispanic and non-Hispanic White to have an elevated cardiovascular risk (all P for group difference <0.05). There is a largest absolute change in prevalence of elevated cardiovascular risk among non-Hispanic Black (10.7% [95% CI, 6.0–15.5%]) and a smallest absolute change among Hispanic (2.4% [95% CI, −4.1%–8.9%]) during 2001–2020.
As shown in Table 2, the prevalence of elevated cardiovascular risk showed a significant negative trend in the age- and sex-adjusted overall model and the age-adjusted sex-specific models (all P for linear trend <0.05). The linear trends for overall and males, but not females (P for linear trend = 0.06), remained significant when the models were additionally adjusted for race/ethnicity, education level, poverty index, and insurance. The overall and sex-specific models showed a significant positive linear trend when age was excluded to account for ageing impact (all P for linear trend < 0.05).
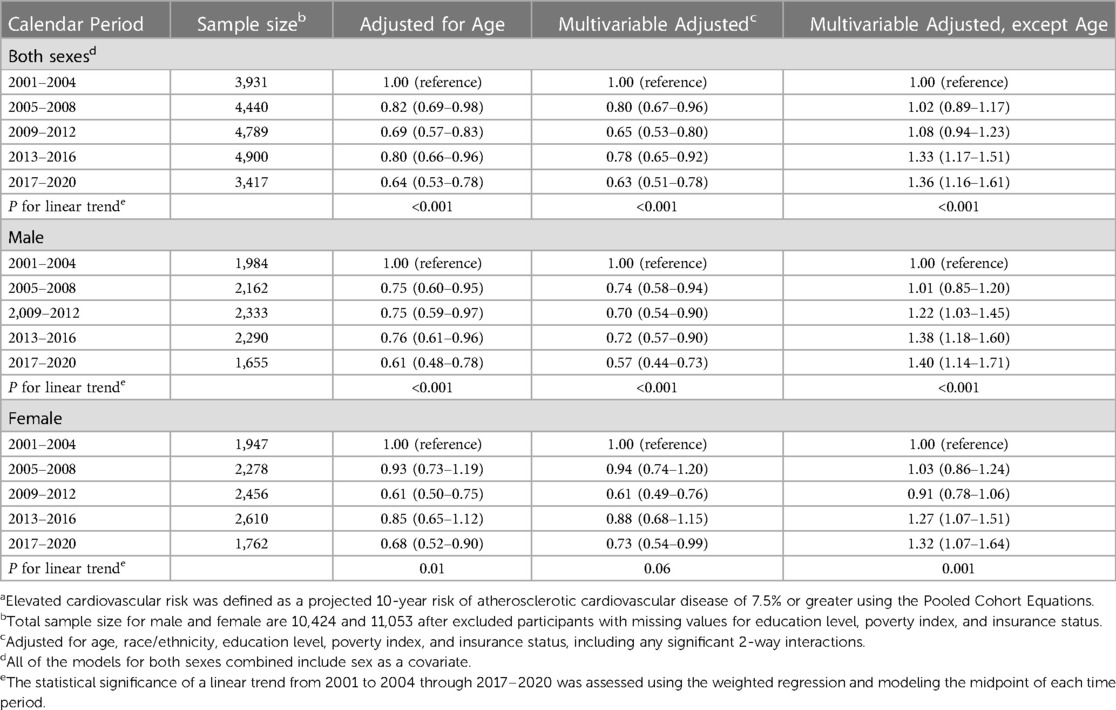
Table 2. Weighted associations of calendar period and prevalence of elevated cardiovascular risk by sexa.
The rate of participants with diabetes using anti-diabetic medications increased significantly from 64.4% (95% CI, 60.3–68.5%) in 2001–2004 to 75.9% (95% CI, 72.9–78.9%) in 2013–2016, but subsequently declined to 73.7% (95% CI, 70.3–77.1%) in 2017–2020 (P for trend < 0.001; Table 3). Similar trends were seen in medication use for hypertension (P for linear trend = 0.018). Medication use for dyslipidemia increased from 26.3% (95% CI, 24.0–28.6%) in 2001–2004 to 36.5% (95% CI, 34.3–38.7%) in 2009–2012 and subsequently leveled off (P for linear trend < 0.001). There was a significant improvement for statin therapy from 20.0% (95% CI, 18.0–21.9%) to 36.4% (95% CI, 32.2–40.7%) during 2001–2020 (P for linear trend < 0.001). The rate of BP and lipids control showed a significant improvement (P for linear trend < 0.001), while glycemic control remained stable during 2001–2020 (P for linear trend > 0.05).
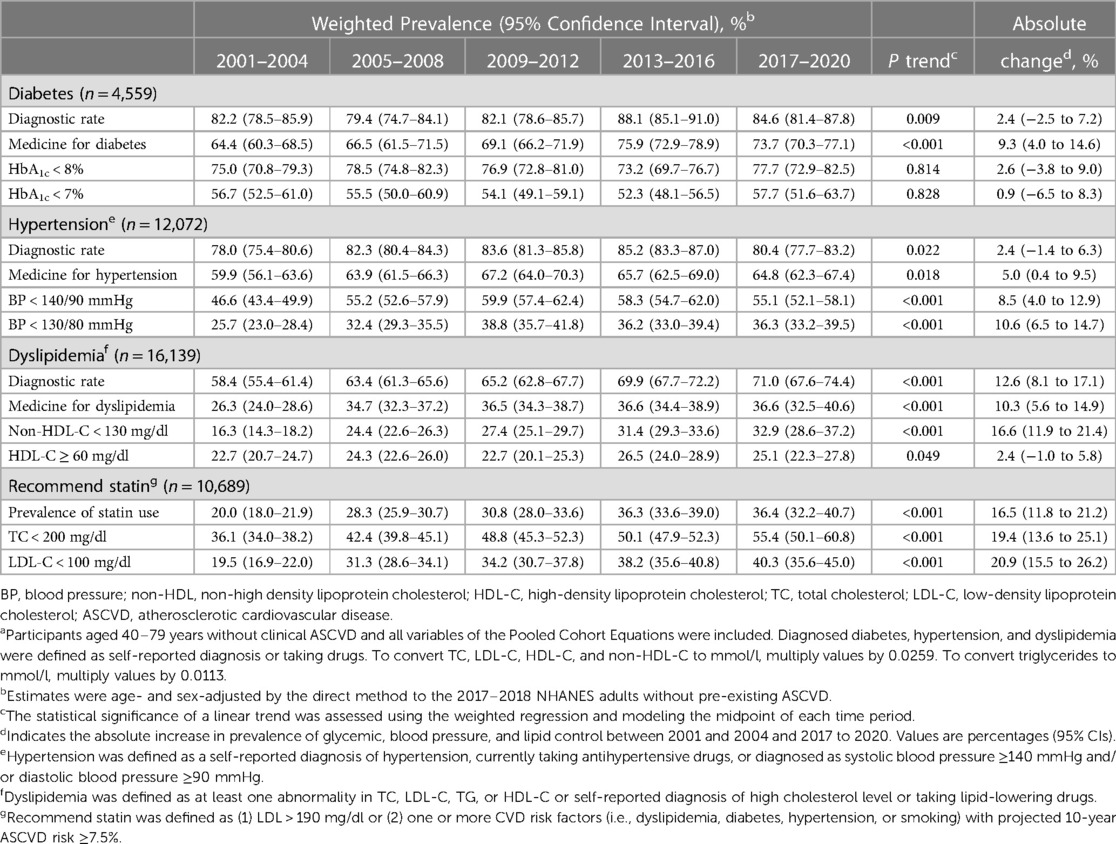
Table 3. Trends in glycemic, blood pressure, and lipids control among US adultsa.
The prevalence of elevated cardiovascular risk increased by 5.0% during 2001–2020 using differential decomposition analysis. This increase was association with an 8.8% increase due to demographic changes (primarily population aging; 11.2% in males and 7.1% in females) and an 3.8% decrease due to risk factor control (5.8% in males and 1.9% in females; Table 4). Risk factor control worked best for non-Hispanic White, whereas aging posed the greatest risk. Risk factor control had little effect among non-Hispanic Black. Their elevated cardiovascular risk increased by 0.5%, and the overall prevalence increased by 10.1% during 2001–2020. Population aging had the least impact among Hispanics, whose risk factors were also well controlled.
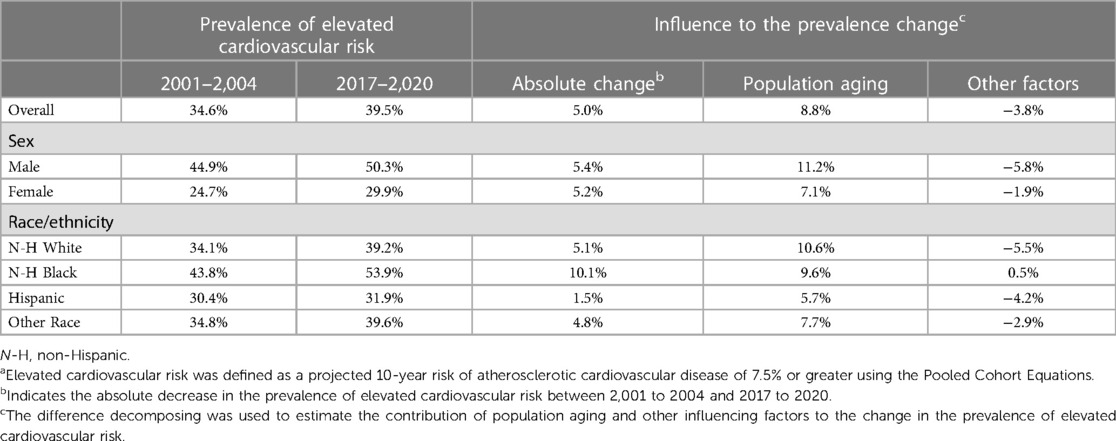
Table 4. Differential decomposition analysis of the prevalence of elevated cardiovascular riska.
This cross-sectional study examined 20-year (2001–2020) trends in the prevalence of elevated cardiovascular risk and the control of related risk factors in ASCVD-free participants. The age- and sex-adjusted prevalence of elevated cardiovascular risk slightly decreased, while the sex-adjusted and sex-specific prevalence increased significantly. Sex and race continued to show disparities in elevated cardiovascular risk. Males were more likely to have elevated cardiovascular risk than females, and non-Hispanic Black than non-Hispanic White and Hispanic. Furthermore, we observed socioeconomic differences in elevated cardiovascular risk. Low educational attainment and family income levels were associated with a high prevalence of elevated cardiovascular risk, but this relationship has decreased over time. The prevalence among those with diabetes or advanced age was higher than those with hypertension or dyslipidemia.
Based on these considerations, patients with diabetes, hypertension, and dyslipidemia have higher lifetime risks than those without these conditions; estimating the risk of future ASCVD events and assessing the control of these diseases are crucial (10). Over the past 20 years, BP and lipid control had improved significantly, and the prevalence of hypertension and dyslipidemia slight increased. By contrast, the proportion of participants achieving glycemic control remained stable, and the prevalence of diabetes increased rapidly. Yet, we should take a correct perspective on the progress made in diabetes prevention and management. Diabetes has a higher diagnosis rate, medication use, and control rate than hypertension or dyslipidemia. Dyslipidemia was the most prevalent, while its diagnosis rate, medication use, and control were the lowest (when BP < 130/80 mmHg as a target, the hypertension control rate was the lowest). Considerable progress in tobacco control was noted, and the number of smokers continued to decline. Although risk factor control (i.e., smoking, hypertension, and dyslipidemia) achieved some results, population aging and increased diabetes significantly increased the prevalence of elevated cardiovascular risk.
Secular trends in 10-year ASCVD risk were explored in several studies. The age- and sex-adjusted 10-year ASCVD risk decreased from 7.6% in 1999–2000 to 6.5% in 2011–2012 among US adults aged ≥20 (29). It is worth noting that the PCE is only applicable to participants aged 40–79 when estimating the 10-year ASCVD risk. It can be used to assess lifetime risk beginning at age 21, but it is based on an inadequate database (10). There was a decline in the age-adjusted mean 10-year ASCVD risk from 13.5% in 1999–2000 to 12.0% in 2017–2018 among participants aged 40–79 (30). Differences in the population's age in the two studies led to wide variations in outcomes. Age is the most critical driving factor for CVD, with 10-year ASCVD risk increasing exponentially with age, resulting in a skewed distribution of the risk score (31). Therefore, describing the 10-year ASCVD risk by the arithmetic mean is inappropriate and could result in large deviations. Recently, Jacobs et al. (32) reported that among adults aged 40–75 in the US from 2013 to March 2020, 58.3% had a 10-year ASCVD risk ranging from 7.5% to 20%, while 10.7% had a 10-year ASCVD risk equal to or greater than 20%. Overall, 69.0% of adults are in a state of elevated cardiovascular risk, but they did not provide a detailed description of their trend changes. In the present study, we employed the accepted cut-off value to depict the patterns in future cardiovascular risk, aiming to inform clinical practice, evaluate the prospective burden on communities, and offer more comprehensible evidence for policy development. Considering the variations in cardiovascular risk across diverse populations, it is advisable for policymakers and guideline developers to pay greater attention to males, non-Hispanic Black individuals, as well as individuals from low-income and low-education backgrounds.
Effectively controlling multiple risk factors can decrease the risk of CVD events by 50% or more. However, only a small percentage, less than 20% of patients, are able to achieve the desired targets for risk factor reduction, including plasma lipid levels, BP, glycaemic control, body weight, and non-smoking status (33). In 2019, the leading risk factors for mortality were high systolic blood pressure and smoking, which caused 10.8 million global deaths, accounting for 19.2% of all deaths, and resulted in 8.7 million global deaths, representing 15.4% of all deaths (34). The age-adjusted prevalence of hypertension was 31.5% in 2009–2012 and slightly increased to 32.9% in 2017–2020 among US adults aged above 18 (14). While the prevalence of adults with controlled BP, defined as systolic BP <140 mm Hg and diastolic BP <90 mm Hg, experienced a significant decline, dropping from 52.8% to 48.2% between 2009 and 2020. Muntner et al. (35) found that the age-adjusted estimated proportion with controlled BP decreased from 53.0% in 2009–2010 to 43.7% in 2017–2018. Smoking kills, it is not original but worth repeating. Tobacco smoking was responsible for approximately 14% of all deaths in 2019 (36). In our study, the percentage of current smokers decreased from 21.3% to 15.1% between 2001 and 2020. Despite experiencing a decline of over 1% per year in age-standardized tobacco smoking exposure between 2010 and 2019, tobacco still ranks as the third primary risk factor for attributable disability-adjusted life-years (37).
Diabetes is the leading risk factor for cardiovascular events, resulting in over 100,000 deaths in the US in 2020 (38). From 1988 to 1994 to 2017–2020, the prevalence of total diabetes increased from 6.8% to 14.2% (39). Among US adults, the age-adjusted prevalence of diabetes saw a notable rise, increasing from 9.8% in 1999–2000 to 14.3% in 2017–2018 (40). While there was an improvement in glycemic control (achieving a glycated hemoglobin level of <7%) during the same period, with the percentage of participants reaching this target increasing from 36.7% to 50.4% (13). It should be pointed out that current research primarily focuses on the entire adults, including primary and secondary prevention, whereas our study targets individuals without clinical ASCVD. The present analysis thoroughly investigated several significant cardiovascular risk factors by utilizing the latest available national survey data. Dyslipidemia is a modifiable risk factor for CVD that can be reversed through lifestyle modifications and statins. Among US adults, there was a significant reduction in age-adjusted TC levels, dropping from 197 mg/dl in 2007–2008 to 189 mg/dl in 2017–2018 (41). Age-adjusted LDL-C also significantly improved in the overall population from 116 mg/dl in 2007–2008 to 111 mg/dl in 2017–2018. However, among adults receiving statin therapy, the rates of age-adjusted lipid control did not exhibit a significant change, remaining relatively stable at 78.5% to 79.5% throughout this period. Consistent with our findings, there was a significant improvement in lipid levels. It is important to note, however, that more than half of US adults who require statin therapy have LDL-C levels greater than 100 mg/dl, which is worrisome given the overwhelming evidence of cardiovascular benefits below this concentration (10).
Based on the findings of the Global Burden of Disease project, approximately two-thirds of global deaths in 2020 were attributed to chronic non-communicable diseases. It is projected that by 2030, non-communicable diseases will contribute to 77% of all deaths, with this rise primarily influenced by the aging population in Western societies (37). Globally, the aged population (> 65 years) is growing fast; the old will outnumber the young in nearly every country over the next 40–60 years (42). Demographic changes significantly impact ASCVD burdens. Unfortunately, only 6.8% of the US adults had optimal cardiometabolic health in 2017–2018, decreasing from 1999 to 2000 (43). Coronary heart disease incidence was expected to rise by approximately 26% during 2010–2040 and its prevalence by 47% (44). Due to this deterioration, maintaining a healthy elderly population is a major challenge for societies, and much needs to be done in the US. Reprioritization efforts must be made to reduce the widespread suffering and premature deaths caused by CVD, both limiting healthy and sustainable development in every country. Roth et al. (45) ranked the modifiable risk factors attributing to CVD: high systolic BP, dietary risks, high LDL-C, air pollution, a high body mass index, smoking, hyperglycemia, and kidney dysfunction. For 28 chronic diseases, on average, only 18.5% of the population's susceptibility is attributed to genetic factors (46). In other words, the vast majority of the disease burden is controllable or influenced by modifiable factors. According to the results of the present study, risk prevention in the US should focus on controlling diabetes incidence, reducing obesity, and strengthening the control over hypertension and dyslipidemia. Additionally, a healthy diet and lifestyle, and statin therapy are the most effective means of preventing ASCVD (8). It is necessary to assess the 10-year ASCVD risk in individuals aged 40–75, with statin therapy being the first-line treatment when the cardiovascular risk (PCE scores ≥ 7.5%) is elevated. For clinicians, policymakers, and guideline developers, it is important to focus on targeted interventions for risk factor control and addressing the disparities identified. By understanding the evolving trends in cardiovascular risk and their underlying factors, healthcare providers can develop tailored strategies and interventions to effectively prevent and manage ASCVD.
Several limitations were present in this study. First, NHANES is a cross-sectional survey; individual longitudinal changes in cardiovascular risk could not be evaluated. Such changes could improve the accuracy of CVD risk prediction and enhance the evidence base for decision-making concerning preventive measures beyond a single risk score assessment (47). Second, self-reported diagnosis and medication use are susceptible to recall bias and inaccuracy. Third, fasting blood samples (i.e., fasting plasma glucose, serum LDL-C, and triglycerides) and 2-hour plasma glucose were not used since only some participants had these data. Fourth, the PCE has not been validated in Hispanic and Asian populations. Additionally, Asian participants were grouped into other races despite the differences within these groups. Finally, due to the COVID-19 pandemic, data collection was suspended in March 2020, resulting in a smaller sample size for 2017–2020.
First, further investigation can focus on developing interventions that address age-related cardiovascular risk and can have significant implications for an aging population. Second, delve deeper into the underlying factors contributing to disparities in cardiovascular risk among different demographic groups, such as sex and race, and evaluate interventions targeted at reducing them. Implementing tailored interventions can help address disparities in cardiovascular risk. Finally, our research primarily investigated the control of traditional risk factors. Future research could explore emerging risk factors such as air pollution, dietary patterns, sedentary behavior, sleep quality, or genetic markers, and their impact on cardiovascular health.
There is a slight reduction in the prevalence of age- and sex-adjusted elevated cardiovascular risk among US adults without clinical ASCVD between 2001 and 2020, while the sex-adjusted prevalence significantly increased. The rate of BP and lipids control showed a significant improvement, while glycemic control remained stable over this period. The decrease in elevated cardiovascular risk prevalence was mainly attributed to risk factor control, while demographic changes contributed to an increase.
Publicly available datasets were analyzed in this study. This data can be found here: https://www.cdc.gov/nchs/nhanes/index.htm.
The studies involving human participants were reviewed and approved by the National Center for Health Statistics Institutional Review Board. The patients/participants provided their written informed consent to participate in this study.
HH and CC contributed to the conception or design of the work. HH, XL, KK, and WX conducted screening and extraction of data. HH, CY, and LF conducted statistical analyses. HH, JL and HB wrote the draft. CC and FM assisted in revising the article. All authors reviewed the manuscript, gave their final approval, and agreed to be accountable for all aspects of the work ensuring integrity and accuracy.
This project was supported by the Discipline construction project of Guangdong Medical University (GDMXk2021001).
We are grateful for the help of Jin Zhang from Tongren Hospital, Shanghai Jiao Tong University School of Medicine. His nhanesR package and webpage make it easier for us to explore the NHANES database.
The authors declare that the research was conducted in the absence of any commercial or financial relationships that could be construed as a potential conflict of interest.
All claims expressed in this article are solely those of the authors and do not necessarily represent those of their affiliated organizations, or those of the publisher, the editors and the reviewers. Any product that may be evaluated in this article, or claim that may be made by its manufacturer, is not guaranteed or endorsed by the publisher.
The Supplementary Material for this article can be found online at: https://www.frontiersin.org/articles/10.3389/fcvm.2023.1153926/full#supplementary-material
1. Virani SS, Alonso A, Benjamin EJ, Bittencourt MS, Callaway CW, Carson AP, et al. Heart disease and stroke statistics-2020 update: a report from the American heart association. Circulation. (2020) 141(9):e139–596. doi: 10.1161/CIR.0000000000000757
2. McClellan M, Brown N, Califf RM, Warner JJ. Call to action: urgent challenges in cardiovascular disease: a presidential advisory from the American heart association. Circulation. (2019) 139(9):e44–54. doi: 10.1161/CIR.0000000000000652
3. Shah NS, Lloyd-Jones DM, O'Flaherty M, Capewell S, Kershaw KN, Carnethon M, et al. Trends in cardiometabolic mortality in the United States, 1999–2017. JAMA. (2019) 322(8):780–2. doi: 10.1001/jama.2019.9161
4. Goff DC Jr, Khan SS, Lloyd-Jones D, Arnett DK, Carnethon MR, Labarthe DR, et al. Bending the curve in cardiovascular disease mortality: bethesda + 40 and beyond. Circulation. (2021) 143(8):837–51. doi: 10.1161/CIRCULATIONAHA.120.046501
5. Heidenreich PA, Trogdon JG, Khavjou OA, Butler J, Dracup K, Ezekowitz MD, et al. Forecasting the future of cardiovascular disease in the United States: a policy statement from the American heart association. Circulation. (2011) 123(8):933–44. doi: 10.1161/CIR.0b013e31820a55f5
6. Sampson M, Wolska A, Amar M, Ueda M, Dunbar R, Soffer D, et al. Estimated atherosclerotic cardiovascular disease risk score: an automated decision aid for statin therapy. Clin Chem. (2022) 68(10):1302–10. doi: 10.1093/clinchem/hvac120
7. Goff DC Jr, Lloyd-Jones DM, Bennett G, Coady S, D'Agostino RB, Gibbons R, et al. 2013 ACC/AHA guideline on the assessment of cardiovascular risk: a report of the American college of cardiology/American heart association task force on practice guidelines. Circulation. (2014) 129(25 Suppl 2):S49–73. doi: 10.1161/01.cir.0000437741.48606.98
8. Arnett DK, Blumenthal RS, Albert MA, Buroker AB, Goldberger ZD, Hahn EJ, et al. 2019 ACC/AHA guideline on the primary prevention of cardiovascular disease: executive summary: a report of the American college of cardiology/American heart association task force on clinical practice guidelines. Circulation. (2019) 140(11):e563–95. doi: 10.1161/CIR.0000000000000677
9. Stone NJ, Robinson JG, Lichtenstein AH, Bairey Merz CN, Blum CB, Eckel RH, et al. 2013 ACC/AHA guideline on the treatment of blood cholesterol to reduce atherosclerotic cardiovascular risk in adults: a report of the American college of cardiology/American heart association task force on practice guidelines. Circulation. (2014) 129(25 Suppl 2):S1–S45. doi: 10.1161/01.cir.0000437738.63853.7a
10. Grundy SM, Stone NJ, Bailey AL, Beam C, Birtcher KK, Blumenthal RS, et al. 2018 AHA/ACC/AACVPR/AAPA/ABC/ACPM/ADA/AGS/APhA/ASPC/NLA/PCNA guideline on the management of blood cholesterol: a report of the American college of cardiology/American heart association task force on clinical practice guidelines. Circulation. (2019) 139(25):e1082–143. doi: 10.1161/CIR.0000000000000625
11. Mangione CM, Barry MJ, Nicholson WK, Cabana M, Chelmow D, Coker TRet al.Statin use for the primary prevention of cardiovascular disease in adults: US preventive services task force recommendation statement. JAMA. (2022) 328(8):746–53. doi: 10.1001/jama.2022.13044
12. Pandya A, Sy S, Cho S, Weinstein MC, Gaziano TA. Cost-effectiveness of 10-year risk thresholds for initiation of statin therapy for primary prevention of cardiovascular disease. JAMA. (2015) 314(2):142–50. doi: 10.1001/jama.2015.6822
13. Fang M, Wang D, Coresh J, Selvin E. Trends in diabetes treatment and control in U.S. Adults, 1999–2018. N Engl J Med. (2021) 384(23):2219–28. doi: 10.1056/NEJMsa2032271
14. Muntner P, Miles MA, Jaeger BC, Hannon Iii L, Hardy ST, Ostchega Y, et al. Blood pressure control among US adults, 2009 to 2012 through 2017 to 2020. Hypertension. (2022) 79(9):1971–80. doi: 10.1161/HYPERTENSIONAHA.122.19222
15. Ingram DD, Malec DJ, Makuc DM, Kruszon-Moran D, Gindi RM, Albert M, et al. National center for health statistics guidelines for analysis of trends. Vital Health Stat. (2018) 2(179):1–71.
16. Ostchega Y, Nwankwo T, Chiappa M, Wolz M, Graber J, Nguyen DT. Comparing blood pressure values obtained by two different protocols: national health and nutrition examination survey, 2017–2018. Vital Health Stat 1. (2021) 87:1–26.
17. Friedewald WT, Levy RI, Fredrickson DS. Estimation of the concentration of low-density lipoprotein cholesterol in plasma, without use of the preparative ultracentrifuge. Clin Chem. (1972) 18(6):499–502. doi: 10.1093/clinchem/18.6.499
18. Sampson M, Ling C, Sun Q, Harb R, Ashmaig M, Warnick R, et al. A new equation for calculation of low-density lipoprotein cholesterol in patients with normolipidemia and/or hypertriglyceridemia. JAMA Cardiol. (2020) 5(5):540–8. doi: 10.1001/jamacardio.2020.0013
19. Brown WV. Methods of calculating low-density lipoprotein cholesterol level. JAMA Cardiol. (2020) 5(5):502–3. doi: 10.1001/jamacardio.2020.0042
20. Patel KK, Taksler GB, Hu B, Rothberg MB. Prevalence of elevated cardiovascular risks in young adults: a cross-sectional analysis of national health and nutrition examination surveys. Ann Intern Med. (2017) 166(12):876–82. doi: 10.7326/M16-2052
21. Fan W, Philip S, Granowitz C, Toth PP, Wong ND. Residual hypertriglyceridemia and estimated atherosclerotic cardiovascular disease risk by statin use in U.S. Adults with diabetes: national health and nutrition examination survey 2007-2014. Diabetes Care. (2019) 42(12):2307–14. doi: 10.2337/dc19-0501
22. American Diabetes Association Professional Practice Committee. 10. Cardiovascular disease and risk management: standards of medical care in diabetes-2022. Diabetes Care. (2022) 45(Suppl 1):S144–74. doi: 10.2337/dc22-S010
23. Chobanian AV, Bakris GL, Black HR, Cushman WC, Green LA, Izzo JL Jr, et al. The seventh report of the joint national committee on prevention, detection, evaluation, and treatment of high blood pressure: the JNC 7 report. JAMA. (2003) 289(19):2560–72. doi: 10.1001/jama.289.19.2560
24. Kopin L, Lowenstein C. Dyslipidemia. Ann Intern Med. (2017) 167(11):ITC81–96. doi: 10.7326/AITC201712050
25. Expert panel on detection, evaluation, and treatment of high blood cholesterol in adults. Executive summary of the third report of the national cholesterol education program (NCEP) expert panel on detection, evaluation, and treatment of high blood cholesterol in adults (adult treatment panel III). JAMA. (2001) 285(19):2486–97. doi: 10.1001/jama.285.19.2486
26. American Diabetes Association Professional Practice Committee. 6. Glycemic targets: standards of medical care in diabetes-2022. Diabetes Care. (2022) 45(Suppl 1):S83–96. doi: 10.2337/dc22-S006
27. Whelton PK, Carey RM, Aronow WS, Casey DE Jr, Collins KJ, Dennison Himmelfarb C, et al. 2017 ACC/AHA/AAPA/ABC/ACPM/AGS/APhA/ASH/ASPC/NMA/PCNA guideline for the prevention, detection, evaluation, and management of high blood pressure in adults: executive summary: a report of the American college of cardiology/American heart association task force on clinical practice guidelines. Circulation. (2018) 138(17):e426–83. doi: 10.1161/CIR.0000000000000597
28. Chen Y, Xiao Y, Yang Y, Duan J, Xu W. Decomposing contribution of age and non-age factors to rapid growth of lung cancer in Xuanwei over past 30 years. BMC Public Health. (2015) 15:1116. doi: 10.1186/s12889-015-2482-y
29. He J, Zhu Z, Bundy JD, Dorans KS, Chen J, Hamm LL. Trends in cardiovascular risk factors in US adults by race and ethnicity and socioeconomic Status, 1999-2018. JAMA. (2021) 326(13):1286–98. doi: 10.1001/jama.2021.15187
30. Chobufo MD, Singla A, Rahman EU, Michos ED, Whelton PK, Balla S. Temporal trends in atherosclerotic cardiovascular disease risk among U.S. Adults. Analysis of the national health and nutrition examination survey, 1999-2018. Eur J Prev Cardiol. (2022) 29(18):2289–300. doi: 10.1093/eurjpc/zwac161
31. Partridge L, Deelen J, Slagboom PE. Facing up to the global challenges of ageing. Nature. (2018) 561(7721):45–56. doi: 10.1038/s41586-018-0457-8
32. Jacobs JA, Addo DK, Zheutlin AR, Derington CG, Essien UR, Navar AM, et al. Prevalence of statin use for primary prevention of atherosclerotic cardiovascular disease by race, ethnicity, and 10-year disease risk in the US: national health and nutrition examination surveys, 2013 to march 2020. JAMA Cardiol. (2023) 8(5):443–52. doi: 10.1001/jamacardio.2023.0228
33. Wong ND, Sattar N. Cardiovascular risk in diabetes mellitus: epidemiology, assessment and prevention. Nat Rev Cardiol. (2023). doi: 10.1038/s41569-023-00877-z [Online ahead of print]37193856
34. GBD 2019 Risk Factors Collaborators. Global burden of 87 risk factors in 204 countries and territories, 1990-2019: a systematic analysis for the global burden of disease study 2019. Lancet. (2020) 396(10258):1223–49. doi: 10.1016/S0140-6736(20)30752-2
35. Muntner P, Hardy ST, Fine LJ, Jaeger BC, Wozniak G, Levitan EB, et al. Trends in blood pressure control among US adults with hypertension, 1999-2000 to 2017-2018. JAMA. (2020) 324(12):1190–200. doi: 10.1001/jama.2020.14545
36. Hodson R. The battle against tobacco is not yet won. Nature. (2023) 618(7964):S1. doi: 10.1038/d41586-023-01836-x
37. Münzel T, Sørensen M, Hahad O, Nieuwenhuijsen M, Daiber A. The contribution of the exposome to the burden of cardiovascular disease. Nat Rev Cardiol. (2023). doi: 10.1038/s41569-023-00873-3 [Online ahead of print]
38. Ahmad FB, Anderson RN. The leading causes of death in the US for 2020. JAMA. (2021) 325(18):1829–30. doi: 10.1001/jama.2021.5469
39. Fang M, Wang D, Coresh J, Selvin E. Undiagnosed diabetes in U.S. Adults: prevalence and trends. Diabetes Care. (2022) 45(9):1994–2002. doi: 10.2337/dc22-0242
40. Wang L, Li X, Wang Z, Bancks MP, Carnethon MR, Greenland P, et al. Trends in prevalence of diabetes and control of risk factors in diabetes among US adults, 1999-2018. JAMA. (2021) 326(8):1–13. doi: 10.1001/jama.2021.9883
41. Aggarwal R, Bhatt DL, Rodriguez F, Yeh RW, Wadhera RK. Trends in lipid concentrations and lipid control among US adults, 2007-2018. JAMA. (2022) 328(8):737–45. doi: 10.1001/jama.2022.12567
42. Fuster V. Changing demographics: a new approach to global health care due to the aging population. J Am Coll Cardiol. (2017) 69(24):3002–5. doi: 10.1016/j.jacc.2017.05.013
43. O'Hearn M, Lauren BN, Wong JB, Kim DD, Mozaffarian D. Trends and disparities in cardiometabolic health among U.S. Adults, 1999-2018. J Am Coll Cardiol. (2022) 80(2):138–51. doi: 10.1016/j.jacc.2022.04.046
44. Odden MC, Coxson PG, Moran A, Lightwood JM, Goldman L, Bibbins-Domingo K. The impact of the aging population on coronary heart disease in the United States. Am J Med. (2011) 124(9):827–33.e5. doi: 10.1016/j.amjmed.2011.04.010
45. Roth GA, Mensah GA, Fuster V. The global burden of cardiovascular diseases and risks: a compass for global action. J Am Coll Cardiol. (2020) 76(25):2980–1. doi: 10.1016/j.jacc.2020.11.021
46. Rappaport SM. Genetic factors are not the Major causes of chronic diseases. PLoS One. (2016) 11(4):e0154387. doi: 10.1371/journal.pone.0154387
47. Lindbohm JV, Sipilä PN, Mars N, Knüppel A, Pentti J, Nyberg ST, et al. Association between change in cardiovascular risk scores and future cardiovascular disease: analyses of data from the whitehall II longitudinal, prospective cohort study. Lancet Digit Health. (2021) 3(7):e434–44. doi: 10.1016/S2589-7500(21)00079-0
Keywords: cardiovascular risk, primary prevention, risk factor profiles, secular trends, national health and nutrition examination survey (NHANES)
Citation: Huang H, Liu J, Liang X, Fang L, Yang C, Ke K, Bai H, Xu W, Li W, Meng F and Chen C (2023) Trends in the prevalence of elevated cardiovascular risk and the control of its risk factors Among US adults, 2001–2020. Front. Cardiovasc. Med. 10:1153926. doi: 10.3389/fcvm.2023.1153926
Received: 30 January 2023; Accepted: 21 June 2023;
Published: 30 June 2023.
Edited by:
Leonardo Roever, Federal University of Uberlandia, BrazilReviewed by:
Amitava Acharyya, Ministry of AYUSH, India© 2023 Huang, Liu, Liang, Fang, Yang, Ke, Bai, Xu, Li, Meng and Chen. This is an open-access article distributed under the terms of the Creative Commons Attribution License (CC BY). The use, distribution or reproduction in other forums is permitted, provided the original author(s) and the copyright owner(s) are credited and that the original publication in this journal is cited, in accordance with accepted academic practice. No use, distribution or reproduction is permitted which does not comply with these terms.
*Correspondence: Can Chen Y2hlbmNhbi0yMUAxNjMuY29t
†These authors have contributed equally to this work
Disclaimer: All claims expressed in this article are solely those of the authors and do not necessarily represent those of their affiliated organizations, or those of the publisher, the editors and the reviewers. Any product that may be evaluated in this article or claim that may be made by its manufacturer is not guaranteed or endorsed by the publisher.
Research integrity at Frontiers
Learn more about the work of our research integrity team to safeguard the quality of each article we publish.