 Lu Chen1,2,3
 Linfeng He1,2,3
 Wenbin Zheng1,2,3
 Qiuying Liu1,2,3Yifan Ren1,2,3Wen Kong1,2,3
 Tianshu Zeng1,2,3*
- 1Department of Endocrinology, Union Hospital, Tongji Medical College, Huazhong University of Science and Technology, Wuhan, China
- 2Hubei Provincial Clinical Research Center for Diabetes and Metabolic Disorders, Huazhong University of Science and Technology, Wuhan, China
- 3Hubei Key Laboratory of Metabolic Abnormalities and Vascular Aging, Huazhong University of Science and Technology, Wuhan, China
Background: There is compelling evidence for an association between triglyceride glucose-body mass index (TyG-BMI) and cardiovascular disease (CVD). However, data on the relationship between TyG-BMI and prehypertension (pre-HTN) or hypertension (HTN) remains scant. The aim of this study was to characterize the association between TyG-BMI and pre-HTN or HTN risk, and to assess the ability of TyG-BMI in predicting pre-HTN and HTN in Chinese and Japanese populations.
Methods: A total of 214,493 participants were included in this study. The participants were divided into 5 groups based on quintiles of TyG-BMI index at baseline (Q1, Q2, Q3 Q4 and Q5). Logistic regression analysis was then employed to assess the relationship between TyG-BMI quintiles and pre-HTN or HTN. Results were presented as odds ratios (ORs) and 95% confidence intervals (CIs).
Results: Our restricted cubic spline analysis showed that TyG-BMI was linearly correlated with both pre-HTN and HTN. Multivariate logistic regression analysis indicated that TyG-BMI was independently correlated with pre-HTN [ORs and 95% CIs were 1.011 (1.011–1.012), 1.021 (1.02–1.023), 1.012 (1.012–1.012), respectively] and HTN [ORs and 95% CIs were 1.021 (1.02–1.021), 1.031 (1.028–1.033), 1.021 (1.02–1.021), respectively] in Chinese or Japanese individuals or both groups after adjusting for all variates. In addition, subgroup analyses showed that the relationship between TyG-BMI and pre-HTN or HTN was independent of age, sex, BMI, country, smoking and drinking status. Across all study populations, the areas under the TyG-BMI curve predicting pre-HTN and HTN were 0.667 and 0.762, respectively, resulting in cut-off values of 189.7 and 193.7, respectively.
Conclusion: Our analyses showed that TyG-BMI was independently correlated with both pre-HTN and HTN. Besides, TyG-BMI showed superior predictive power in predicting pre-HTN and HTN compared to TyG or BMI alone.
1. Introduction
Hypertension is perceived as a preventable condition associated with an increased risk of cardiovascular disease (CVD) such as ischemic heart disease and stroke (1), which is a major contributor to all-cause mortality (2). Prehypertension is defined as a diastolic blood pressure (DBP) of 120–139 mmHg and/or systolic blood pressure (SBP) of 80–89 mmHg, which was first described in the JNC-7 report (3). In addition, data from the Framingham Heart Study suggest that older people with pre-HTN are more likely to progress to HTN within 4 years (4). It is estimated that one in three healthy individuals suffers from pre-HTN worldwide (5), and this rate will increase in future, with the number of adults diagnosed with HTN expected to reach 1.56 billion by 2025 (6). Therefore, there is an urgent need for early screening for pre-HTN and HTN in high-risk populations, along with development of effective interventions.
As a pathophysiological basis of various cardiometabolic diseases, insulin resistance (IR) has gained significant research attention in recent years (7–10). For instance, recent data has demonstrated an association between IR and the risk of pre-HTN (11–13) and HTN (14). Although hyperinsulinemic-euglycemic clamp (HEC) remains the gold standard for evaluating IR (15), it is not suitable for routine physical examinations and large population-based epidemiologic studies due to its invasiveness, required resources and time. Thus, more accessible and reproducible alternatives to IR are warranted in resource-limited primary care settings.
More recent data suggest that TyG-BMI, an emerging index calculated from triglycerides, fasting blood glucose and body mass index, has a great potential to be a surrogate for IR (16). Indeed, compelling evidence suggests a reliable relationship between TyG-BMI and nonalcoholic fatty disease (17), metabolic syndrome (18), diabetes (19) and ischemic stroke (20). However, data on the relationship between TyG-BMI and pre-HTN or HTN remains scant. Although both China and Japan are in East Asia, China is a developing country while Japan is a developed country. However, both countries have very low rates of blood pressure control. Data show that there are approximately 41.3% individuals with pre-HTN and 23.3% with HTN in China (21). On the other hand, 43 million people in Japan suffer from HTN, of which 31 million are poorly controlled. Worryingly, pre-HTN and HTN are responsible for approximately 50% of cardiovascular disease mortality (22). In this study, we aimed to characterize the relationship between TyG-BMI and the risk of pre-HTN or HTN, and determine its predictive power for reducing the incidence of early cardiovascular disease in Chinese and Japanese populations.
2. Materials and methods
2.1. Study population
This study included and analyzed two cohort studies: the Rich Health Care Group study and the NAGALA cohort study. The Rich Health Care Group study is a cohort study that recruited 685,277 participants who underwent health screening between 2010 and 2016 in 11 cities located in China (23). As shown in Figure 1, after applying our inclusion and exclusion criteria, we included and analyzed 199,029 subjects. The NAGALA cohort is a study that includes participants who have attended health checkups since Murakami Memorial Hospital was officially established in 1994 (24). In our study, we extracted data from 15,464 subjects in the NAGALA database from 1994 to 2016 (Figure 1).The Ethics Committees had previously authorized the original project. We did not apply for ethical approval again, as our study was considered a post hoc analysis. All subjects provided informed consent in previous studies (24, 25). Our study complies with the Declaration of Helsinki.
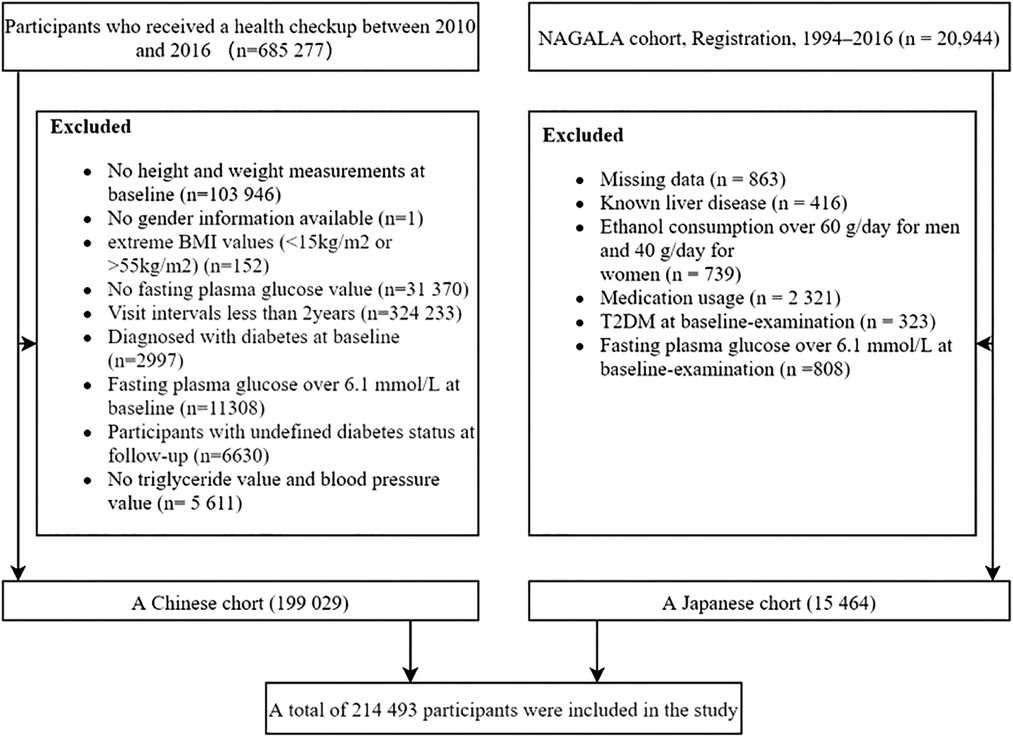
Figure 1. Flowcharts for study subjects.
2.2. Data collection and measurement
A standardized questionnaire which was completed by all subjects contained data on demographic characteristics, medical history, physical examination results and lifestyle information, which included age, sex, height, weight as well as the status of blood pressure, cigarette and alcohol consumption. Height, weight and blood pressure were measured by trained staff. Height was measured to the nearest 0.1 cm without shoes using a portable stadiometer, and weight was measured to the nearest 0.1 kg while participants were wearing lightweight clothing. BMI (kg/m2) was calculated as weight (kilograms) divided by height (meters) squared. All participants were required to rest in a quiet environment for at least 5 min before blood pressure measurement. Blood pressure was measured by standard mercury sphygmomanometers. Blood sample collection was conducted after fasting for at least 10 h. Fasting blood glucose (FPG), triglyceride (TG), total cholesterol (TC), and alanine aminotransferase (ALT), were measured by the uniform automated analyzer.
2.3. Definition and calculation
The participants were divided into three categories according to the criteria for hypertension described in the 2018 Chinese guidelines (26). BMI = weight (kg)/height (m)2; TyG = Ln [fasting TG (mg/dl)*FPG (mg/dl)/2] (27); TyG-BMI = TyG × BMI (16);
2.4. Statistical analysis
Stata/MP 17.0, EmpowerStats and R language software were used for data analysis. Continuous variables were grouped into normal and skewed variables. The normal variables were presented as mean ± standard deviation while the skewed variables were presented as median and interquartile range (IQR). Differences among continuous variables were tested by one-way ANOVA. Categorical variables were expressed as numbers (percentages) and then analyzed by chi-square tests. The relationship between TyG-BMI and BP or pre-HTN and HTN was analyzed by Spearman's correlation analysis and restricted cubic spline, respectively. In addition, we employed analytical models to examine the relationship between TyG-BMI and pre-HTN or HTN in the logistic regression analyses, including crude model (unadjusted), adjusted model I (adjusted for age and sex) and adjusted model II (adjusted model I + adjusted for smoking status, alcohol consumption, TC and ALT levels). Correlations with gender, age, BMI, country, smoking status and alcohol consumption were further tested. A P < 0.05 was defined as statistically significant.
3. Results
3.1. Study population baseline characteristics
This study recruited 214,493 participants (mean age: 41.95 ± 12.28, female/male: 98,041/116,452) including 199,029 Chinese and 15,464 Japanese. Of all participants, 27,168 had hypertension, 48,396 had prehypertension while 138,929 had normotension (Table 1). Age, proportion of males, BMI, SBP, DBP, FPG, TC, TG and ALT were highest in the hypertensive group. Interestingly, prehypertensives were more likely to drink alcohol and smoke compared to the other groups.
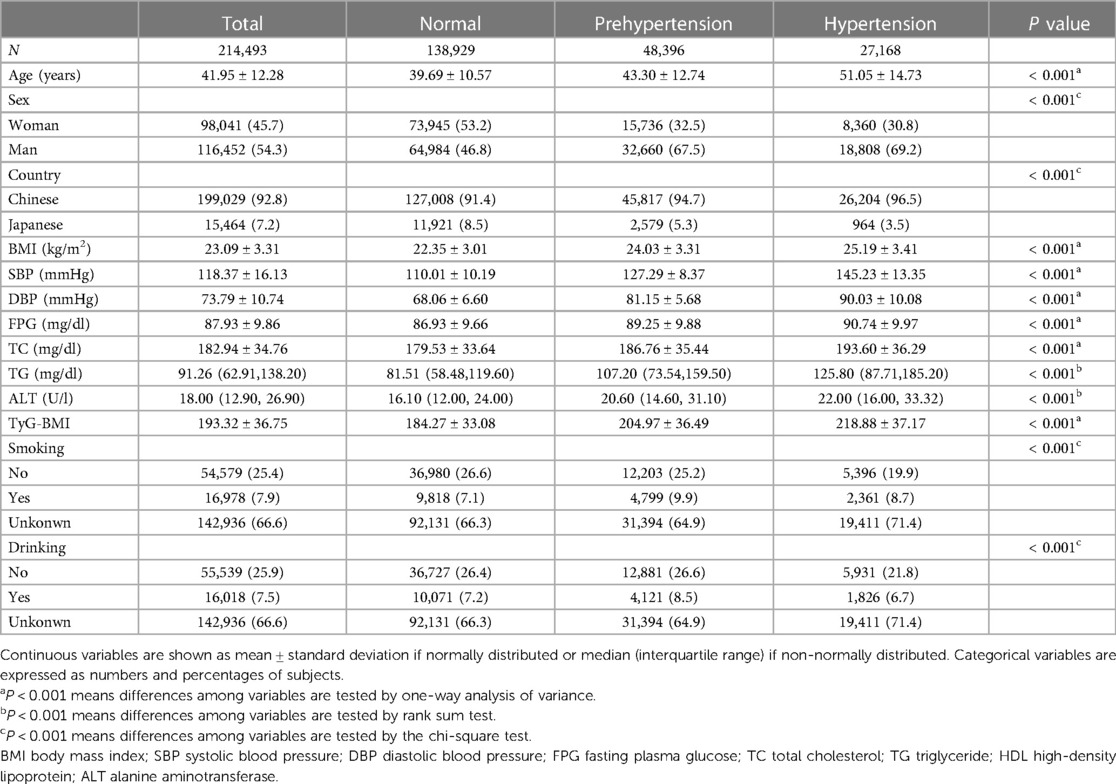
Table 1. Baseline Characteristics of study population.
3.2. Logistic regression analyses of TyG-BMI quintiles and prehypertension and hypertension
Our data showed that age, BMI, SBP, DBP, FPG, TC, TG, ALT, TyG and TyG-BMI were all positively correlated with pre-HTN and HTN (Supplementary Table S1). Men and those with high drinking and smoking behaviors had a higher likelihood of developing pre-HTN and HTN. Comparison of the two geographical populations demonstrated that Chinese were more prone to pre-HTN and HTN than Japanese (Supplementary Table S1). In addition, there was a linear relationship between TyG-BMI and SBP or DBP (Supplementary Fig. S1) and between TyG-BMI and pre-HTN or HTN (Supplementary Fig. S2). Analysis of TyG-BMI quintiles showed that the prevalence of pre-HTN and HTN increased with increasing TyG-BMI quintiles in either Chinese or Japanese or both (Figure 2). Odds ratios (ORs) for TyG-BMI were positively correlated with pre-HTN or HTN regardless of whether confounders were adjusted (Table 2 and Table 3). In the adjusted model II with the quintile1 as a reference in both the Chinese and Japanese populations, the ORs and 95% CIs for pre-HTN were 1.012 (1.012–1.012), 1.011 (1.011–1.012) and 1.021 (1.02–1.023), whereas the ORs and 95% CIs for HTN were 1.021 (1.02–1.021), 1.021 (1.02–1.021) and 1.031 (1.028–1.033), respectively.
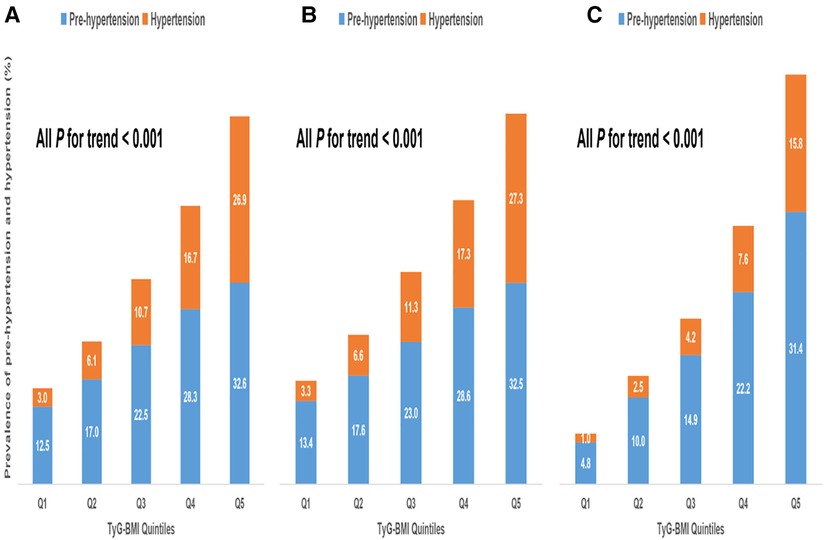
Figure 2. Prevalence of prehypertension and hypertension according to TyG-BMI group. (A). All populations (B). Chinese (C). Japanese.
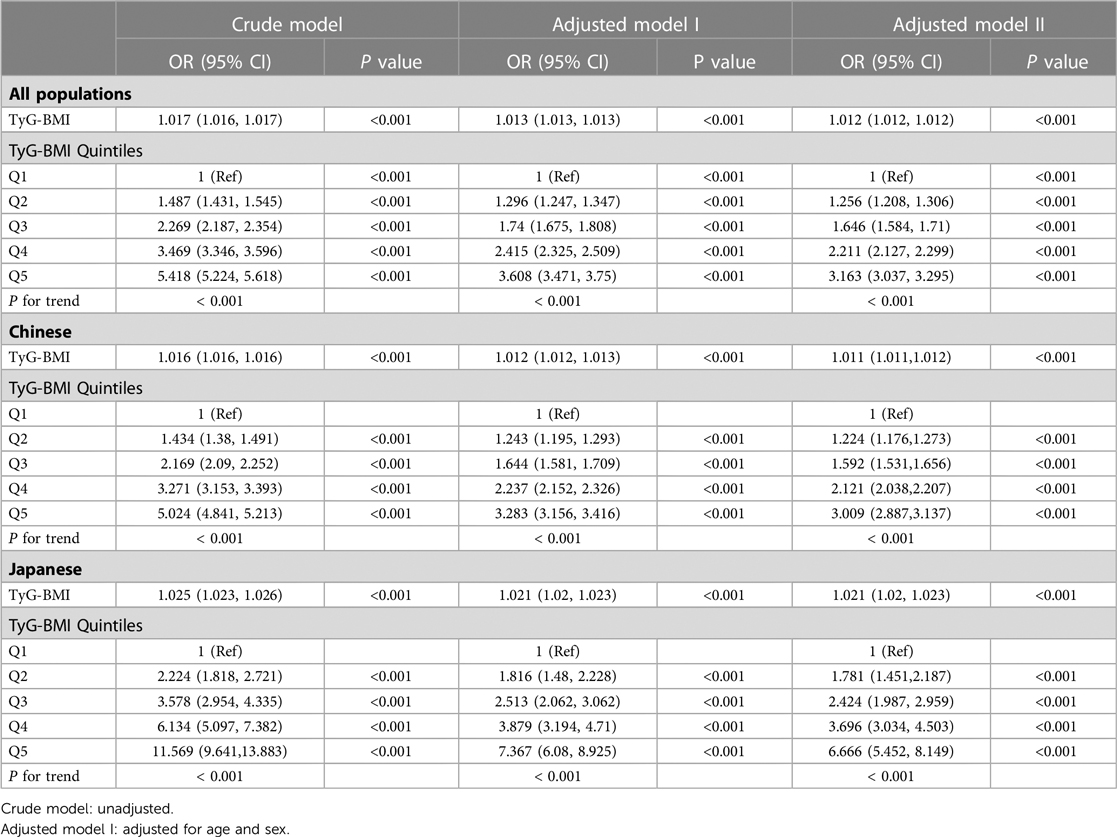
Table 2. Logistic regression analysis of the relationship between TyG-BMI and prehypertension.
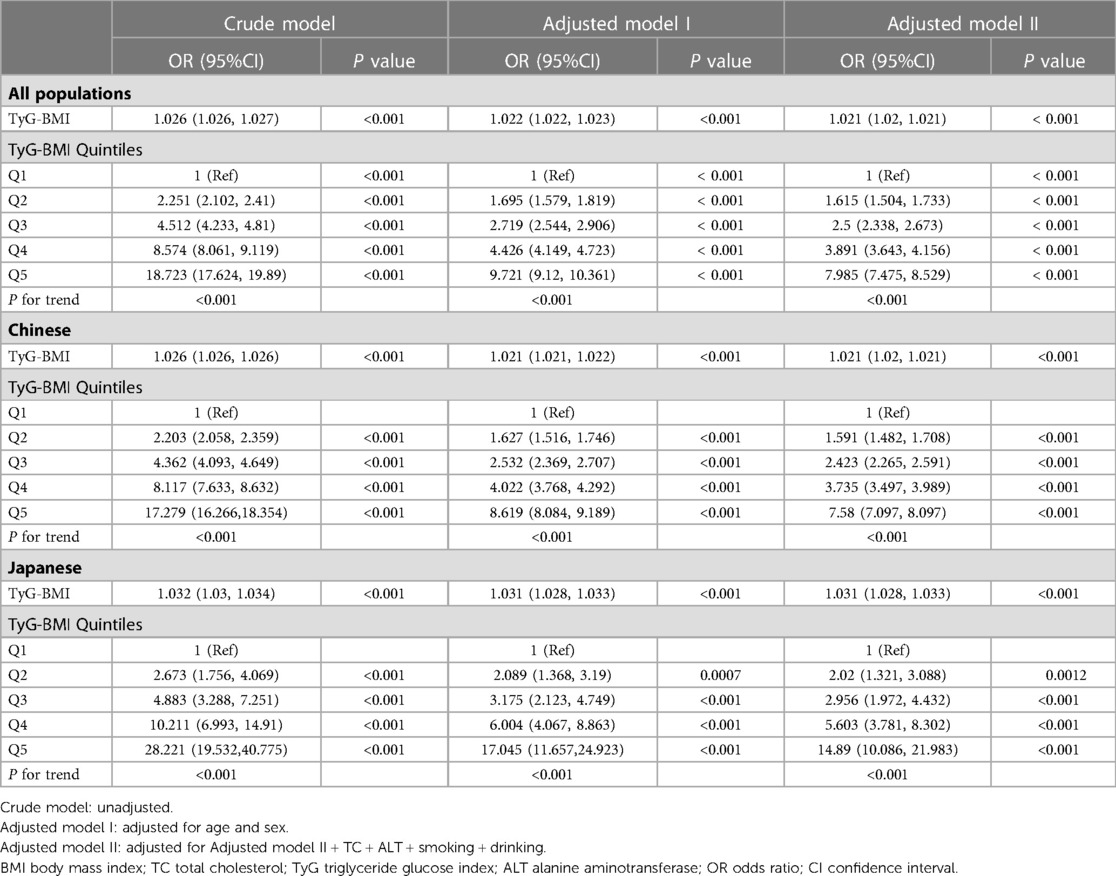
Table 3. Logistic regression analysis of the relationship between TyG-BMI and hypertension.
3.3. Association between TyG-BMI and pre-HTN or HTN in subgroups
To assess the impact of TyG-BMI on pre-HTN or HTN, we explored associations across age, gender, country, BMI, smoking and drinking status. Our analyses revealed significant differences in TyG-BMI-related pre-HTN and HTN risk across phenotypes. As shown in Supplementary Table S2, group-specific TyG-BMI was a stronger predictor of pre-HTN and HTN. We determined the ORs for each subgroup. In the age stratification, ORs for pre-HTN (<45 years: 1.012 vs. 45–60 years: 1.013 vs. > 60 years: 1.01; P-interaction < 0.001), ORs for HTN (<45 years: 1.015 vs. 45–60 years: 1.017 vs. > 60 years: 1.015; P-interaction < 0.001). In the sex stratification, ORs for pre-HTN (women: 1.013 vs. men: 1.011; P-interaction <0.001), ORs for HTN (women: 1.024 vs. men: 1.011; P-interaction <0.001). In the country stratification, ORs for pre-HTN (Japanese: 1.021 vs. Chinese: 1.011; P-interaction <0.001), ORs for HTN (Japanese: 1.022 vs. Chinese: 1.015; P-interaction <0.001). In the BMI stratification, ORs for pre-HTN (1.013 in BMI < 18.5 kg/m2 group vs. 1.013 in 18.5 kg/m2 ≤ BMI < 24 kg/m2 group vs. 1.01 in 24 kg/m2 ≤ BMI < 28 kg/m2 group vs. 1.008 in BMI ≥ 28 kg/m2 group; P-interaction < 0.001); ORs for HTN (1.032 vs. 1.022 vs. 1.014 vs. 1.009 for the corresponding group, respectively; P-interaction < 0.001).
3.4. Prediction of TyG-BMI in the pre-HTN or HTN
To characterize the predictive ability of BMI, TyG and TyG-BMI for pre-HTN and HTN, we performed receiver operating characteristic (ROC) curve analysis for the Chinese and Japanese patients (Figure 3). Prediction of pre-HTN and HTN in Chinese and Japanese showed that TyG-BMI exhibited the highest discriminative performance in both populations (P < 0.001). Across all populations, the AUCs of TyG-BMI for pre-HTN and HTN were 0.667 (95% CI: 0.665–0.670) and 0.762 (95% CI: 0.760, 0.764), respectively. In addition, the corresponding optimal cut-off values for TyG-BMI were 189.7 and 193.7 (Supplementary Table S3).
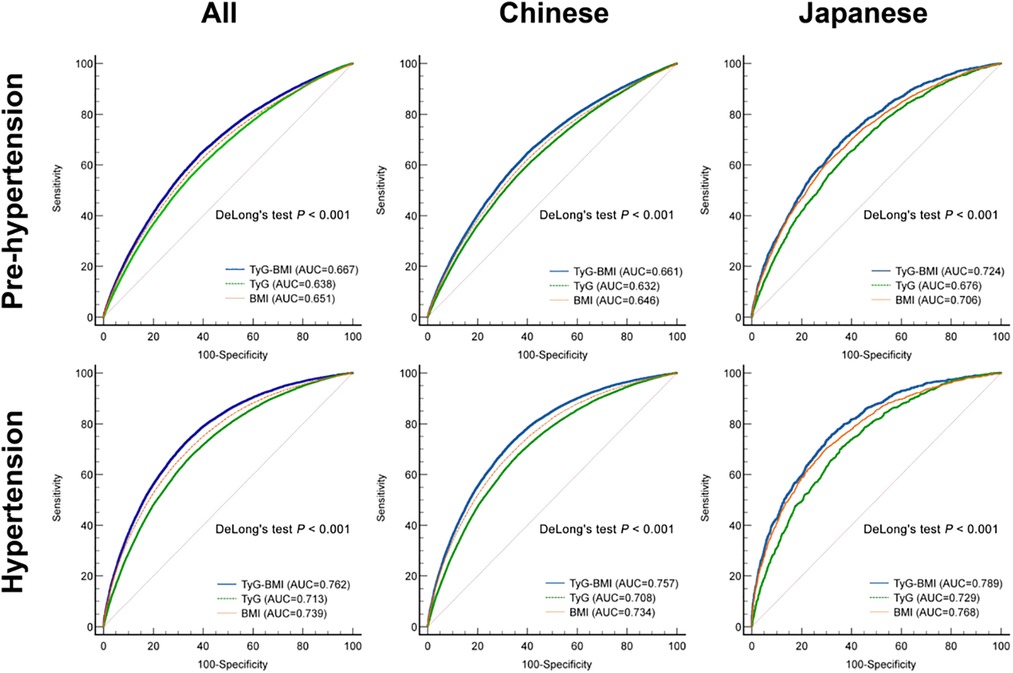
Figure 3. ROC curve analysis of TyG-BMI, TyG and BMI.
4. Discussion
We performed a retrospective study to evaluate the association between TyG-BMI and the risk of pre-HTN or HTN. The findings showed that TyG-BMI was positively correlated with pre-HTN or HTN regardless of whether the covariates were adjusted in all populations. TyG-BMI was reliable in predicting pre-HTN and HTN, thus it can be an accessible, resource- and time-saving indicator for early identification and intervention in pre-HTN and HTN.
IR has long been regarded as a core pathophysiological marker for diverse cardiometabolic abnormalities such as CVD (28). Hence, successful screening for IR at an early stage before the development of unfavorable life-threatening complications, will reduce the burden on health outcomes and the strain on the global economy. Nevertheless, the most precise evaluation method of IR remains HEC, which is invasive and labour-intensive (29). Besides, it is sophisticated and impractical to conduct a HEC experiment in large-scale population-based studies. Therefore, a number of simple, inexpensive and reproducible alternative parameters have emerged, which have been shown to replace HEC for IR. These parameters include the ratios of triglycerides and specific components of cholesterol, TyG and TyG-related parameters, metabolic score for insulin resistance (METS-IR), visceral adiposity index (VAI) and lipid accumulation product (LAP), whose association with IR has been explored (16, 30, 31) and compared in the prediction of some specific diseases (32–36).
Intriguingly, Er et al. (16) found that TyG-BMI is an optimum index substitute for IR in nondiabetic Taiwanese people compared to some indices related to lipids, adipokines and visceral adiposity. In addition, Li et al. (37) showed that Chinese visceral adiposity index (CVAI) had an optimal and superior discriminative ability in predicting pre-HTN or HTN compared to the VAI, which was based on 34,732 Chinese participants. On the other hand, Han et al. (38) observed that METS-IR was strongly associated with pre-HTN and HTN in 15,453 Japanese individuals with normal glucose tolerance. In recent years, TyG-BMI has been shown to have a higher value in predicting HTN prevalence compared to METS-IR in 117,056 Chinese participants (32).
Our study aimed to explore the role of TyG-BMI in predicting pre-HTN and HTN in 214,493 subjects from China and Japan. In addition, our findings suggest that middle-aged, nonobese, female and Japanese individuals have a greater ability of TyG-BMI in predicting pre-HTN and HTN. This may be due to several factors; (1) the accelerated pace of modern life and the rapidly increasing ageing population, which further exacerbates the social burden on middle-aged people (39). (2) Asians gain more body adiposity at lower BMI levels (40, 41) and are more likely to accumulate visceral fat (41, 42), which is more strongly associated with pre-HTN and HTN than subcutaneous fat. BMI alone does not reflect adiposity (43). (3) Sexual dimorphism between TyG-BMI and pre-HTN and HTN is due to gender differences in the renin-angiotensin system (RAS), sympathetic nervous activity (SNA), estrogens and androgens, ET-1 and immunoregulatory cytokines (44). (4) Consistent with the prevalence of obesity, the incidence of CVD in Japanese individuals is significantly lower than that in the Chinese individuals, which is robustly associated with their lifestyle habits, such as lower salt and red meat intake and higher physical activity. The observation that the relationship between TyG-BMI and pre-HTN and HTN is more obvious in Japanese individuals seems abnormal, but may be related to the ageing of the Japanese population. Future research is needed to determine the underlying mechanisms.
There is a rational assumption that TyG-BMI is an optimal substitute for IR as supported by various findings: (1) glucotoxicity and lipotoxicity are of paramount importance in the development of IR (45); (2) BMI can partially reflect the information on adipose tissue. Moreover, adipose tissues which are also deemed an endocrine organ, can secrete hormones, cytokines, chemokines and adipokines (i.e., leptin and adiponectin) with effects on glucose, lipid metabolism and signaling pathways mediating IR (46). Thus, IR is a pivotal factor underlying the mechanisms linking TyG-BMI and pre-HTN or HTN. High levels of insulin could activate RAS (47) and SNA (48), leading to the expansion of vascular smooth muscle and endothelial cells which further increases peripheral vascular resistance. In addition, IR promotes the absorption of salt. Moreover, IR can accelerate atherosclerosis by attenuating eNOS activation and damaging endothelial function, resulting in systemic vasoconstriction (49).
Although our study highlights important findings, the causal relationship between TyG-BMI and pre-HTN or HTN remains inconclusive as the study was a retrospective study. Secondly, only one race was involved in our study, and therefore the conclusions cannot be generalized into other ethnic groups. Thirdly, we did not take diet and exercise habits, family history, economic status and occupational stress into account, which could lead to confounding bias. Owing to high cost, we also did not assess fasting insulin or C-peptide levels, which partially reflect IR. Thus, more large-scale population-based randomized clinical trials or Mendelian randomization studies are needed to conclusively characterize the causal relationship between TyG-BMI and pre-HTN or HTN. Besides, our findings need to be validated in other races and countries due to genetic and habitual disparities. In addition, as life or work stress exerts adverse impacts on elevated blood pressure, this should be taken into account in future studies.
5. Conclusion
In summary, our data suggest that TyG-BMI is significantly correlated with pre-HTN and HTN, and exhibited excellent power in predicting the risk of pre-HTN and HTN in East Asian populations. Therefore, TyG-BMI is a promising tool and might be an optimal indicator for screening high-risk individuals susceptible to pre-HTN and HTN, and may be a novel target for the prevention and management of pre-HTN and HTN.
Data availability statement
The datasets presented in this study can be found in online repositories. The names of the repository/repositories and accession number(s) can be found below: The data used in this study can be obtained from the ‘DATADRYAD' database (www.Datadryad.org).
Ethics statement
The Chinese and Japanese cohort studies in this study were approved by the ethics committees of Rich Healthcare Group and Murakami Memorial Hospital, respectively. Informed consent was obtained from participants in both studies, in line with the Helsinki Declaration. The patients/participants provided their written informed consent to participate in this study.
Author contributions
LC, LH, WZ, WK, QL, YR and TZ contributed to the study design and data analyses and drafted the paper. All authors contributed to the article and approved the submitted version.
Funding
This study was supported by the National Natural Science Foundation of China (Grant No. 82270909, No. 81974107) and the Key R&D Program of Hubei Province (Grant No. 2020BCB003).
Acknowledgments
We would like to thank each of the participants in this study.
Conflict of interest
The authors declare that the research was conducted in the absence of any commercial or financial relationships that could be construed as a potential conflict of interest.
Publisher's note
All claims expressed in this article are solely those of the authors and do not necessarily represent those of their affiliated organizations, or those of the publisher, the editors and the reviewers. Any product that may be evaluated in this article, or claim that may be made by its manufacturer, is not guaranteed or endorsed by the publisher.
Supplementary material
The Supplementary Material for this article can be found online at: https://www.frontiersin.org/articles/10.3389/fcvm.2023.1139842/full#supplementary-material.
References
1. Zhou B, Perel P, Mensah GA, Ezzati M. Global epidemiology, health burden and effective interventions for elevated blood pressure and hypertension. Nat Rev Cardiol. (2021) 18(11):785–802. doi: 10.1038/s41569-021-00559-8
2. Collaborators GBDRF. Global, regional, and national comparative risk assessment of 84 behavioural, environmental and occupational, and metabolic risks or clusters of risks for 195 countries and territories, 1990-2017: a systematic analysis for the global burden of disease study 2017. Lancet. (2018) 392(10159):1923–94. doi: 10.1016/S0140-6736(18)32225-6
3. Lenfant C, Chobanian AV, Jones DW, Roccella EJ. Joint national committee on the prevention DE, treatment of high blood P. Seventh report of the joint national committee on the prevention, detection, evaluation, and treatment of high blood pressure (JNC 7): resetting the hypertension sails. Hypertension. (2003) 41(6):1178–9. doi: 10.1161/01.HYP.0000075790.33892.AE
4. Vasan RS, Larson MG, Leip EP, Kannel WB, Levy D. Assessment of frequency of progression to hypertension in non-hypertensive participants in the framingham heart study: a cohort study. Lancet. (2001) 358(9294):1682–6. doi: 10.1016/S0140-6736(01)06710-1
5. Gupta AK, Brashear MM, Johnson WD. Coexisting prehypertension and prediabetes in healthy adults: a pathway for accelerated cardiovascular events. Hypertens Res. (2011) 34(4):456–61. doi: 10.1038/hr.2010.267
6. Kearney PM, Whelton M, Reynolds K, Muntner P, Whelton PK, He J. Global burden of hypertension: analysis of worldwide data. Lancet. (2005) 365(9455):217–23. doi: 10.1016/S0140-6736(05)17741-1
7. Barazzoni R, Gortan Cappellari G, Ragni M, Nisoli E. Insulin resistance in obesity: an overview of fundamental alterations. Eat Weight Disord. (2018) 23(2):149–57. doi: 10.1007/s40519-018-0481-6
8. Buzzetti E, Pinzani M, Tsochatzis EA. The multiple-hit pathogenesis of non-alcoholic fatty liver disease (NAFLD). Metab Clin Exp. (2016) 65(8):1038–48. doi: 10.1016/j.metabol.2015.12.012
9. Lann D, LeRoith D. Insulin resistance as the underlying cause for the metabolic syndrome. Med Clin N Am. (2007) 91(6):1063. -+. doi: 10.1016/j.mcna.2007.06.012
10. Stumvoll M, Goldstein BJ, van Haeften TW. Type 2 diabetes: principles of pathogenesis and therapy. Lancet. (2005) 365(9467):1333–46. doi: 10.1016/S0140-6736(05)61032-X
11. Kawamoto R, Kohara K, Tabara Y, Abe M, Kusunoki T, Miki T. Insulin resistance and prevalence of prehypertension and hypertension among community-dwelling persons. J Atheroscler Thromb. (2010) 17(2):148–55. doi: 10.5551/jat.2584
12. Player MS, Mainous AG, 3rd, Diaz VA, Everett CJ. Prehypertension and insulin resistance in a nationally representative adult population. J Clin Hypertens (Greenwich). (2007) 9(6):424–9. doi: 10.1111/j.1524-6175.2007.06439.x
13. Zhao HL, Wang GY, Zhang MZ, Tong WJ, Zhang YH. Prehypertension and insulin resistance among Mongolian people, Inner Mongolia, China. Blood Press. (2011) 20(2):98–103. doi: 10.3109/08037051.2010.532320
14. Xun PC, Liu K, Cao WH, Sidney S, Williams OD, He K. Fasting insulin level is positively associated with incidence of hypertension among American young adults A 20-year follow-up study. Diabetes Care. (2012) 35(7):1532–7. doi: 10.2337/dc11-2443
15. Muniyappa R, Lee S, Chen H, Quon MJ. Current approaches for assessing insulin sensitivity and resistance in vivo: advantages, limitations, and appropriate usage. Am J Physiol-Endoc M. (2008) 294(1):E15–26. doi: 10.1152/ajpendo.00645.2007
16. Er LK, Wu S, Chou HH, Hsu LA, Teng MS, Sun YC, et al. Triglyceride glucose-body mass Index is a simple and clinically useful surrogate marker for insulin resistance in nondiabetic individuals. Plos One. (2016) 11(3):e0149731. doi: 10.1371/journal.pone.0149731
17. Hu HF, Han Y, Cao CC, He YC. The triglyceride glucose-body mass index: a non-invasive index that identifies non-alcoholic fatty liver disease in the general Japanese population. J Transl Med. (2022) 20(1):398. doi: 10.1186/s12967-022-03611-4
18. Mirr M, Skrypnik D, Bogdanski P, Owecki M. Newly proposed insulin resistance indexes called TyG-NC and TyG-NHtR show efficacy in diagnosing the metabolic syndrome. J Endocrinol Invest. (2021) 44(12):2831–43. doi: 10.1007/s40618-021-01608-2
19. Li XT, Sun MZ, Yang YX, Yao N, Yan SM, Wang L, et al. Predictive effect of triglyceride glucose-related parameters, obesity indices, and lipid ratios for diabetes in a Chinese population: a prospective cohort study. Front Endocrinol. (2022) 13:862919. doi: 10.3389/fendo.2022.862919
20. Du Z, Xing LY, Lin M, Sun YX. Estimate of prevalent ischemic stroke from triglyceride glucose-body mass index in the general population. Bmc Cardiovasc Disor. (2020) 20(1):483. doi: 10.1186/s12872-020-01768-8
21. Wang ZW, Chen Z, Zhang LF, Wang X, Hao G, Zhang ZG, et al. Status of hypertension in China results from the China hypertension survey, 2012−2015. Circulation. (2018) 137(22):2344–56. doi: 10.1161/CIRCULATIONAHA.117.032380
22. Umemura S, Arima H, Arima S, Asayama K, Dohi Y, Hirooka Y, et al. The Japanese society of hypertension guidelines for the management of hypertension (JSH 2019). Hypertens Res. (2019) 42(9):1235–481. doi: 10.1038/s41440-019-0284-9
23. Chen Y, Zhang XP, Yuan J, Cai B, Wang XL, Wu XL, et al. Association of body mass index and age with incident diabetes in Chinese adults: a population-based cohort study. Bmj Open. (2018) 8(9):e021768. doi: 10.1136/bmjopen-2018-021768
24. Okamura T, Hashimoto Y, Hamaguchi M, Obora A, Kojima T, Fukui M. Ectopic fat obesity presents the greatest risk for incident type 2 diabetes: a population-based longitudinal study. Int J Obesity. (2019) 43(1):139–48. doi: 10.1038/s41366-018-0076-3
25. Wu Y, Hu HF, Cai JL, Chen RT, Zuo X, Cheng H, et al. Association of hypertension and incident diabetes in Chinese adults: a retrospective cohort study using propensity-score matching. Bmc Endocr Disord. (2021) 21(1):87. doi: 10.1186/s12902-021-00747-0
26. Liu LS, Revision JCG. 2018 Chinese guidelines for prevention and treatment of hypertension-A report of the revision committee of Chinese guidelines for prevention and treatment of hypertension. J Geriatr Cardiol. (2019) 16(3):182–241. doi: 10.11909/j.issn.1671-5411.2019.03.014
27. Lee EY, Yang HK, Lee J, Kang B, Yang Y, Lee SH, et al. Triglyceride glucose index, a marker of insulin resistance, is associated with coronary artery stenosis in asymptomatic subjects with type 2 diabetes. Lipids Health Dis. (2016) 15(1):155. doi: 10.1186/s12944-016-0324-2
28. Ormazabal V, Nair S, Elfeky O, Aguayo C, Salomon C, Zuniga FA. Association between insulin resistance and the development of cardiovascular disease. Cardiovasc Diabetol. (2018) 17(1):122. doi: 10.1186/s12933-018-0762-4
29. Rudvik A, Mansson M. Evaluation of surrogate measures of insulin sensitivity—correlation with gold standard is not enough. BMC Med Res Methodol. (2018) 18(1):64. doi: 10.1186/s12874-018-0521-y
30. Bello-Chavolla OY, Almeda-Valdes P, Gomez-Velasco D, Viveros-Ruiz T, Cruz-Bautista I, Romo-Romo A, et al. METS-IR, a novel score to evaluate insulin sensitivity, is predictive of visceral adiposity and incident type 2 diabetes. Eur J Endocrinol. (2018) 178(5):533–44. doi: 10.1530/EJE-17-0883
31. Du TT, Yuan G, Zhang MX, Zhou XR, Sun XX, Yu XF. Clinical usefulness of lipid ratios, visceral adiposity indicators, and the triglycerides and glucose index as risk markers of insulin resistance. Cardiovasc Diabetol. (2014) 13:146. doi: 10.1186/s12933-014-0146-3
32. Cheng WK, Kong FL, Chen SW. Comparison of the predictive value of four insulin resistance surrogates for the prevalence of hypertension: a population-based study. Diabetol Metab Syndr. (2022) 14(1):137. doi: 10.1186/s13098-022-00907-9
33. Mehta R, Antonio-Villa NE, Bello-Chavolla OY, Martagon AJ, Elias-Lopez D, Vargas-Vazquez A, et al. Association between insulin resistance and arterial stiffness in Mexican patients without type 2 diabetes. Gac Med Mex. (2021) 157(5):539–47. doi: 10.24875/GMM.21000177
34. Sheng GT, Lu S, Xie QY, Peng N, Kuang MB, Zou Y. The usefulness of obesity and lipid-related indices to predict the presence of non-alcoholic fatty liver disease. Lipids Health Dis. (2021) 20(1):134. doi: 10.1186/s12944-021-01561-2
35. Xuan WT, Liu DX, Zhong JA, Luo HJ, Zhang XW. Impacts of triglyceride glucose-Waist to height ratio on diabetes incidence: a secondary analysis of Apopulation-based longitudinal data. Front Endocrinol. (2022) 13:949831. doi: 10.3389/fendo.2022.949831
36. Zhang X, Yu CP, Ye RY, Liu TH, Chen XP. Correlation between non-insulin-based insulin resistance indexes and the risk of prehypertension: a cross-sectional study. J Clin Hypertens. (2022) 24(5):573–81. doi: 10.1111/jch.14449
37. Li BQ, Wang J, Zhou X, Liu Y, Wang WQ, Gao ZN, et al. Chinese Visceral adiposity Index is more closely associated with hypertension and prehypertension than traditional adiposity indices in Chinese population: results from the REACTION study. Front Endocrinol. (2022) 13:921997. doi: 10.3389/fendo.2022.921997
38. Han KY, Gu JN, Wang ZS, Liu J, Zou S, Yang CX, et al. Association between METS-IR and prehypertension or hypertension among normoglycemia subjects in Japan: a retrospective study. Front Endocrinol. (2022) 13:851338. doi: 10.3389/fendo.2022.851338
39. Eriksson M, Ng N. Changes in access to structural social capital and its influence on self-rated health over time for middle-aged men and women: a longitudinal study from northern Sweden. Soc Sci Med. (2015) 130:250–8. doi: 10.1016/j.socscimed.2015.02.029
40. Deurenberg P, Deurenberg-Yap M, Guricci S. Asians are different from caucasians and from each other in their body mass index/body fat per cent relationship. Obes Rev. (2002) 3(3):141–6. doi: 10.1046/j.1467-789X.2002.00065.x
41. Xia MF, Chen Y, Lin HD, Ma H, Li XM, Aleteng Q, et al. A indicator of visceral adipose dysfunction to evaluate metabolic health in adult Chinese. Sci Rep. (2016) 6:38214. doi: 10.1038/srep38214
42. Camhi SM, Bray GA, Bouchard C, Greenway FL, Johnson WD, Newton RL, et al. The relationship of waist circumference and BMI to visceral, subcutaneous, and total body fat: sex and race differences. Obesity (Silver Spring). (2011) 19(2):402–8. doi: 10.1038/oby.2010.248
43. Gomez-Ambrosi J, Silva C, Galofre JC, Escalada J, Santos S, Millan D, et al. Body mass index classification misses subjects with increased cardiometabolic risk factors related to elevated adiposity. Int J Obes (Lond). (2012) 36(2):286–94. doi: 10.1038/ijo.2011.100
44. Song JJ, Ma Z, Wang J, Chen LX, Zhong JC. Gender differences in hypertension. J Cardiovasc Transl Res. (2020) 13(1):47–54. doi: 10.1007/s12265-019-09888-z
45. Lytrivi M, Castell AL, Poitout V, Cnop M. Recent insights into mechanisms of beta-cell lipo- and glucolipotoxicity in type 2 diabetes. J Mol Biol. (2020) 432(5):1514–34. doi: 10.1016/j.jmb.2019.09.016
46. Ahmed B, Sultana R, Greene MW. Adipose tissue and insulin resistance in obese. Biomed Pharmacother. (2021) 137:111315. doi: 10.1016/j.biopha.2021.111315
47. Esler M, Rumantir M, Wiesner G, Kaye D, Hastings J, Lambert G. Sympathetic nervous system and insulin resistance: from obesity to diabetes. Am J Hypertens. (2001) 14(11 Pt 2):304S–9S. doi: 10.1016/S0895-7061(01)02236-1
48. Soleimani M. Insulin resistance and hypertension: new insights. Kidney Int. (2015) 87(3):497–9. doi: 10.1038/ki.2014.392
Keywords: triglyceride glucose-body mass index, prehypertension, hypertension, Chinese, Japanese
Citation: Chen L, He L, Zheng W, Liu Q, Ren Y, Kong W and Zeng T (2023) High triglyceride glucose-body mass index correlates with prehypertension and hypertension in east Asian populations: A population-based retrospective study. Front. Cardiovasc. Med. 10:1139842. doi: 10.3389/fcvm.2023.1139842
Received: 7 January 2023; Accepted: 3 April 2023;
Published: 25 April 2023.
Edited by:
Gaurav Kumar, Medical College of Wisconsin, United StatesReviewed by:
Nak-Hoon Son, Keimyung University, Republic of KoreaHuijuan Ma, Hebei General Hospital, China
© 2023 Chen, He, Zheng, Liu, Ren, Kong and Zeng. This is an open-access article distributed under the terms of the Creative Commons Attribution License (CC BY). The use, distribution or reproduction in other forums is permitted, provided the original author(s) and the copyright owner(s) are credited and that the original publication in this journal is cited, in accordance with accepted academic practice. No use, distribution or reproduction is permitted which does not comply with these terms.
*Correspondence: Tianshu Zeng dHN6ZW5nQDEyNi5jb20=
Specialty Section: This article was submitted to Hypertension, a section of the journal Frontiers in Cardiovascular Medicine