 Xiaoyu Zheng
 Tianyang Hu
 Tingrong Liu3
- 1School of Clinical Medicine, Chongqing Medical and Pharmaceutical College, Chongqing, China
- 2Precision Medicine Center, The Second Affiliated Hospital, Chongqing Medical University, Chongqing, China
- 3Department of Geriatrics, The People’s Hospital of Yubei District of Chongqing City, Chongqing, China
- 4Department of Orthopedics, The People’s Hospital of Yubei District of Chongqing City, Chongqing, China
Background: Coronary care unit (CCU) patients with acute myocardial infarction (AMI) lack effective predictors of in-hospital mortality. This study aimed to investigate the performance of four scoring systems in predicting in-hospital mortality in CCU patients with AMI.
Methods: The baseline data, the logistic organ dysfunction system (LODS), the Oxford acute severity of illness score (OASIS), the simplified acute physiology score II (SAPS II), and the simplified acute physiology score III (SAPS III) scores of the patients were extracted from the fourth edition of the Medical Information Mart for Critical Care (MIMIC-IV) database. Independent risk factors for in-hospital mortality were identified by regression analysis. We performed receiver operating characteristic (ROC) curves and compared the area under the curve (AUC) to clarify the predictive value of the four scoring systems. Meanwhile, Kaplan–Meier curves and decision curve analysis (DCA) were performed to determine the optimal scoring system for predicting in-hospital mortality.
Results: A total of 1,098 patients were included. The SAPS III was an independent risk factor for predicting in-hospital mortality in CCU patients with AMI before and after the propensity score matching (PSM) analysis. The discrimination of in-hospital mortality by SAPS III was superior to that of LODS, OASIS, and SAPS II. The AUC of the SAPS III scoring system was the highest among the four scoring systems, at 0.901 (before PSM) and 0.736 (after PSM). Survival analysis showed that significantly more in-hospital mortality occurred in the high-score SAPS III group compared to the low-score SAPS III group before PSM (HR 7.636, P < 0.001) and after PSM (HR 2.077, P = 0.005). The DCA curve of SAPS III had the greatest benefit score across the largest threshold range compared to the other three scoring systems.
Conclusion: The SAPS III was an independent risk factor for predicting in-hospital mortality in CCU patients with AMI. The predictive value for in-hospital mortality with SAPS III is superior to that of LODS, OASIS, and SAPS II. The results of the DCA analysis suggest that SAPS III may provide a better clinical benefit for patients. We demonstrated that SAPS III is an excellent scoring system for predicting in-hospital mortality for CCU patients with AMI.
Introduction
As a common type of coronary heart disease (CHD), AMI is a fatal and seriously life-threatening disease. According to some reports, the in-hospital mortality rate for ST-elevation myocardial infarction (STEMI) is approximately 10% (1–3). The mortality rate for patients with AMI treated in a regular ward dropped from 26 to 7% for those treated in the CCU because of specialized care from the CCU (4). Predicting in-hospital mortality in CCU patients with AMI could help improve the treatment and prognosis of AMI-related complications. Although CCU treatment benefits patients, it lacks an efficient and practical scoring system to predict in-hospital mortality.
Nowadays, many risk-scoring tools are used to assess mortality from AMI (5–7). They may provide some predictive value for patients with AMI. However, they have limitations, such as insufficient clinical data for developing risk scores, low predictive efficiency, and unaccepted novel scoring tools that hinder their widespread use. Therefore, it is vital to identify an acceptable and effective scoring method for predicting in-hospital mortality in CCU patients with AMI.
Various scoring systems in intensive care have demonstrated outstanding performance in predicting in-hospital mortality. As a generally acceptable scoring system, the logistic organ dysfunction system (LODS) can be used to predict morbidity and mortality in intensive care unit (ICU) patients and quantify their baseline severity of organ dysfunction (8, 9). The Oxford acute severity of illness score (OASIS) contains minimal variables for assessing disease mortality in the ICU. These machine-learning algorithms guarantee the accuracy of predictions (10). The SAPS II and SAPS III are developed to provide estimates of ICU admission mortality (11, 12). Compared to SAPS II, SAPS III has a higher-quality multinational database for predicting mortality before ICU intervention (13). However, in an ICU for internal disorders, SAPS II seemed to show better mortality prediction performance than SAPS III (14). Our study aimed to explore the utility of the above scoring systems in evaluating the in-hospital mortality of CCU patients admitted for AMI and to investigate the better performance of the prediction models in clinical practice.
Materials and methods
Database
This retrospective study included hospital admissions from the MIMIC-IV database. All real hospital stays of patients between 2008 and 2019 admitted to the critical care units of the Beth Israel Deaconess Medical Center (Boston, MA, USA) were included in the study. Regarding introductions to the database, refer to the official website1 : Detailed data from MIMIC-IV (version 1.0) were obtained through PhysioNet.2 Author XZ passed the “Protecting Human Research Participants” examination on the National Institutes of Health website and signed a data usage agreement (Record ID: 48747466) to access the database. The patient’s private information (real name, family address, and telephone) in the database is anonymous. Therefore, ethical approval and informed consent are not required. This study complies with the Declaration of Helsinki.
Study population and data extraction
Data were extracted by Navicat Premium software (version 15.0). All CCU patients diagnosed with AMI were screened, and the following data were extracted from the MIMIC-IV database: age, gender, length of hospital stay, and length of CCU stay. The Charlson comorbidity index (CCI) (15) provided a simple and effective method for assessing comorbidities. Coexisting comorbidities, such as congestive heart failure (CHF), cerebrovascular disease (CVD), chronic pulmonary disease (CPD), diabetes, hypertension, renal disease, liver disease, and malignant cancer (MC), were included. We also investigated whether patients had a combined acute kidney injury (AKI) during their hospitalization. Laboratory results (hemoglobin, white blood cell, platelets, anion gap, blood urea nitrogen, serum creatinine, and the international normalized ratio), vital signs (heart rate, mean blood pressure, respiratory rate, and temperature), mechanical ventilation (MV), and scoring systems (LODS, OASIS, SAPS II, and SAPS III) should be recorded within 24 h of admission. If variables related to laboratory results or vital signs were assessed multiple times, then the average value was taken. We investigated whether patients underwent percutaneous coronary intervention (PCI) or coronary artery bypass grafting (CABG) during hospitalization. Only patients admitted to the ICU for the first time were included.
Statistical analysis
Normally distributed continuous variables (Kolmogorov–Smirnov tests evaluated normality) were expressed as mean ± standard deviation, and the independent samples t-test was used for comparison. Non-normally distributed continuous variables were expressed as the median of the interquartile range (IQR), and the Wilcoxon rank-sum test was applied to the comparison. Categorical variables were expressed as percentages and compared using the chi-square test. Independent risk factors for in-hospital mortality in CCU patients with AMI were determined by binomial logistic regression and Cox regression. In the multivariate analysis, we only considered the variables that had a P-value < 0.1 in the univariate analysis. The ROC curves of the four scoring systems for predicting in-hospital mortality were drawn, and the area under the curve (AUC) was compared using the Delong method (16) to determine the discriminative power of each scoring system.
To reduce baseline bias, propensity score matching (PSM) analysis was used to correct some confounding factors, making comparisons between the death and survival groups more reasonable. A 1:1 nearest neighbor matching algorithm (caliper = 0.05, without replacement) conducted the PSM analysis, and a logistic regression model calculated the propensity score. The following variables were included: age, gender, CCI, LODS, OASIS, SAPS II, SAPS III, AG, MV, PCI/CABG, and AKI. In addition, once a better scoring system was determined, Kaplan–Meier survival curves were drawn using the optimal cutoff value of the ROC curve to further clarify the value of the scoring system in predicting in-hospital mortality. The log-rank test was utilized to identify any differences between the groups. The decision curve analysis (DCA) was performed to evaluate the net benefits of the four scoring systems in CCU patients with AMI after PSM (17). The above statistical analyses were performed using R (version 4.1.2) software and MedCalc software (version 20.1.0). A P-value <0.05 was defined as statistically significant.
Results
Baseline characteristics
A total of 76,540 ICU admissions were included in the MIMIC-IV database, including 8,746 CCU patients. Finally, 1,098 patients were carefully screened, of whom 137 died and 961 survived in the hospital. The data selection flowchart is shown in Figure 1. The median age of the death group was 76 years, which was older than the median age of the survival group of 69 years (P < 0.001). The patients who died had a longer length of CCU stay when compared with the patients who survived. On the first day of admission, CCI, white blood cell, blood urea nitrogen, serum creatinine, anion gap, international normalized ratio, heart rate, respiratory rate, LODS score, OASIS score, SAPS II score, and SAPS III scores in the death group were significantly greater than those in the survival group (P < 0.001 for all). A lower Hb level, PLT, and MAP were found in the death group than in the survival group (P < 0.001 for all). Moreover, non-survivors were more likely than survivors to have comorbidities, such as CHF, CVD, diabetes, liver disease, renal disease, and AKI (P < 0.05 for all). The proportion of patients who received MV was remarkably higher in the death group (P < 0.001), while there was no statistical difference in the length of hospital stay and whether patients underwent PCI/CABG. PSM balanced variables including age, gender, length of hospital stay, length of CCU stay, whether patients underwent PCI/CABG, mechanical ventilation, AKI, and CCI. After matching, the two groups of variables were comparable (P > 0.05 for all), and 108 dead patients and 108 surviving patients were finally included. After PSM, the death group had higher levels of BUN, Cr, INR, and AG than the surviving group. The differences among the four scoring systems were similar to those before matching (P < 0.05 for all). There was no statistical difference in coexisting comorbidities between the two groups, except for minor differences in CPD. Baseline characteristics and detailed data are shown in Table 1.
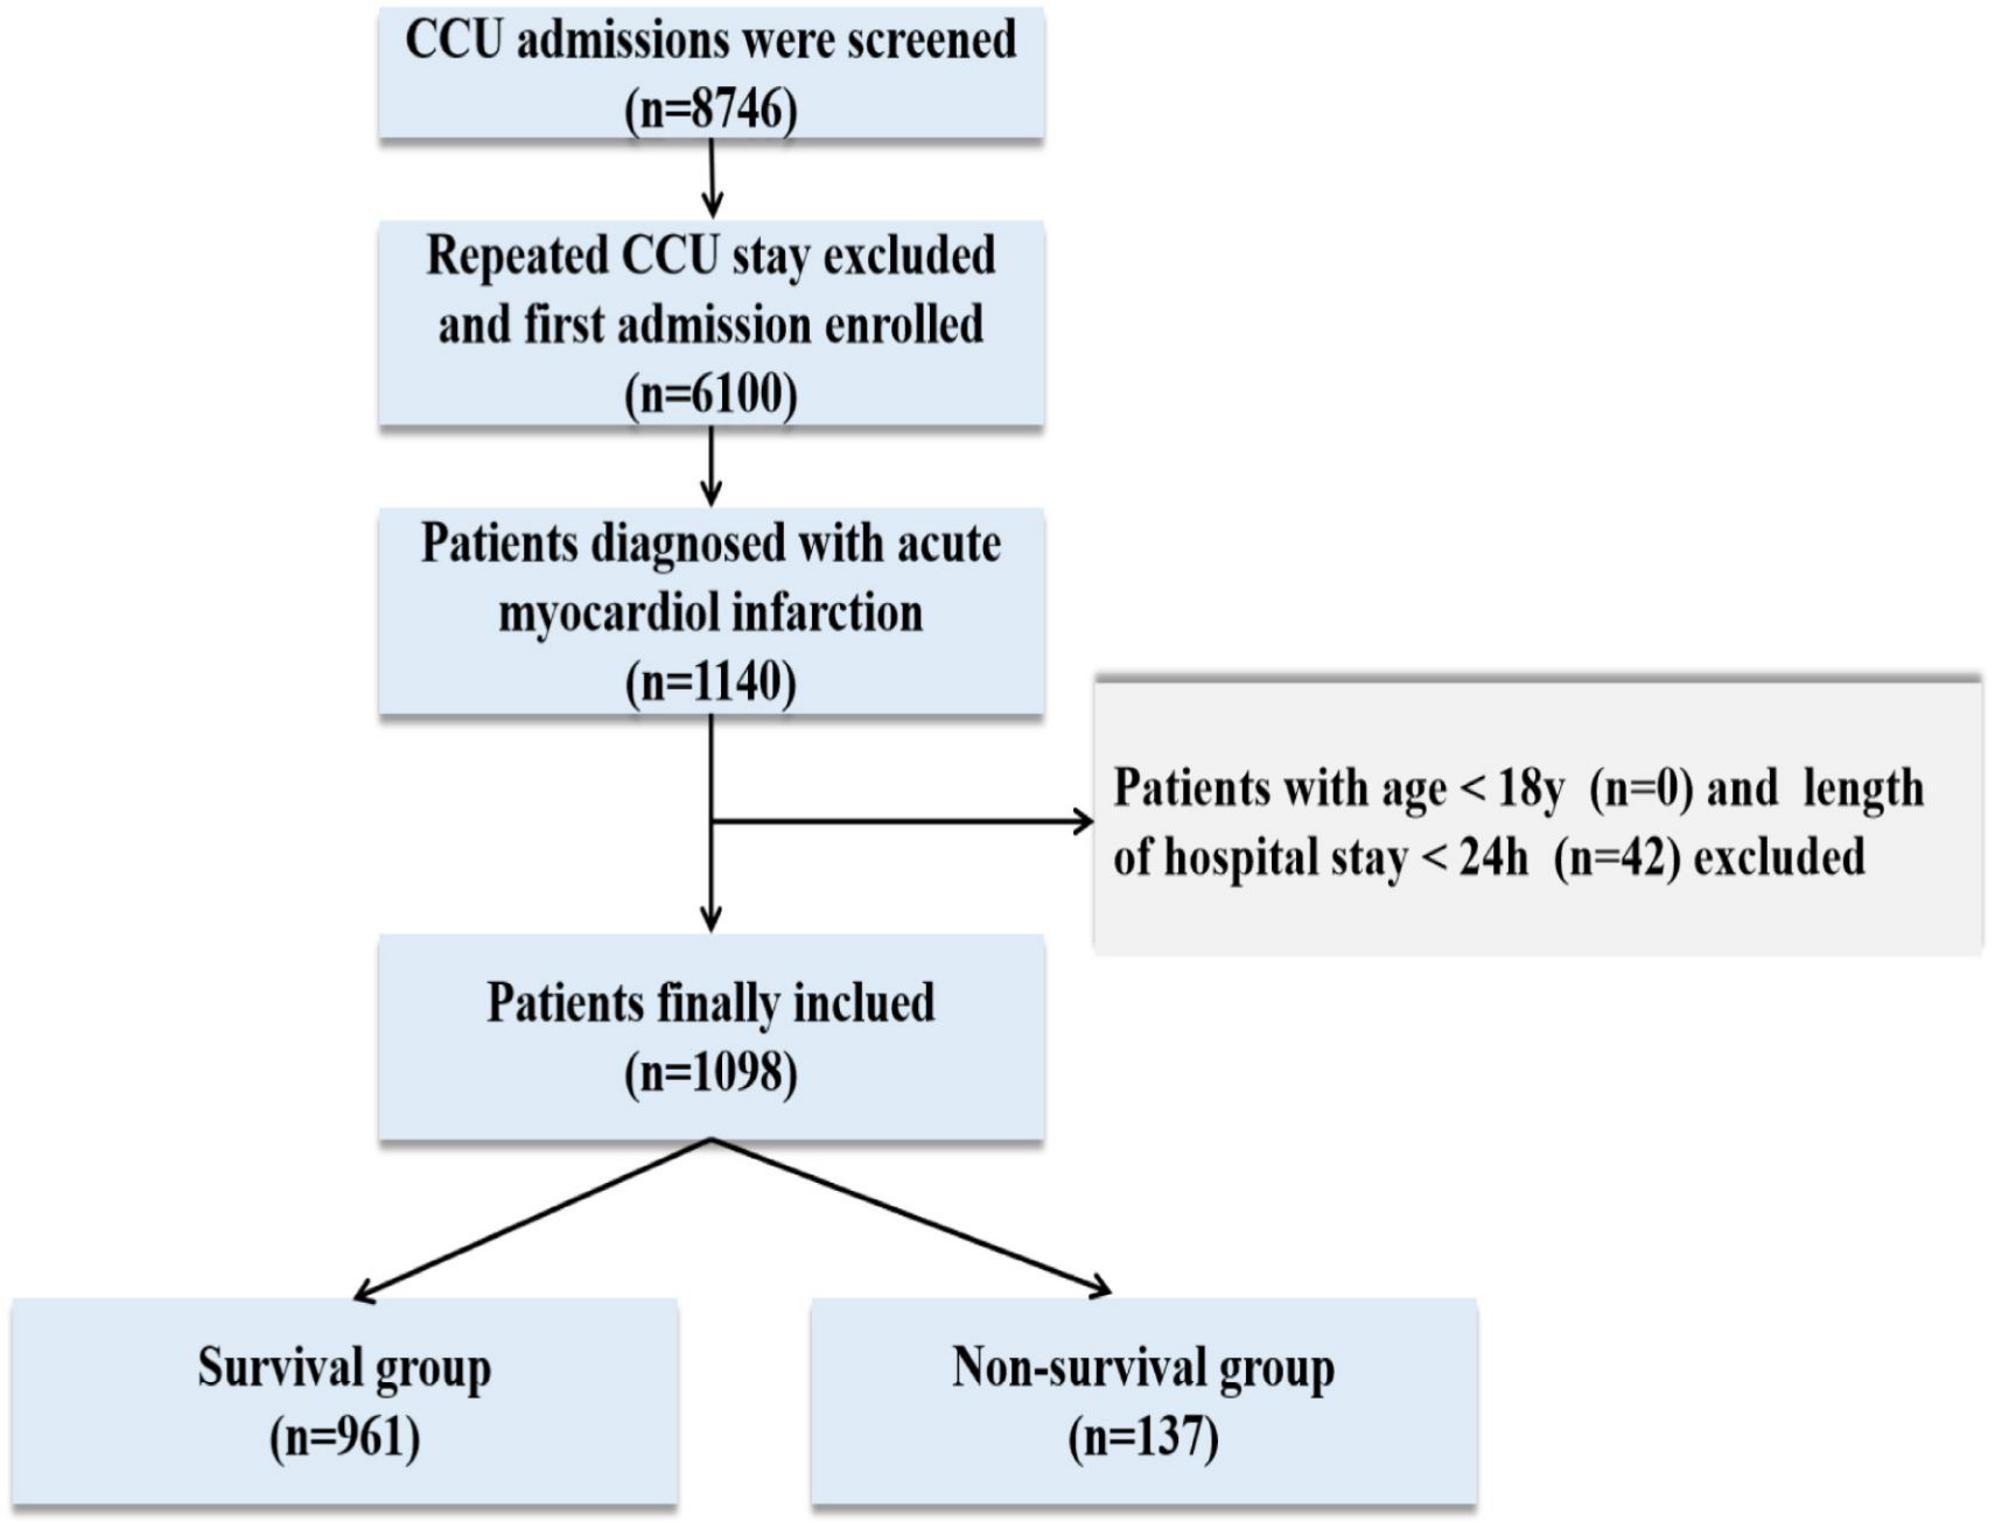
Figure 1. Flowchart of the study cohort. CCU, coronary care unit.
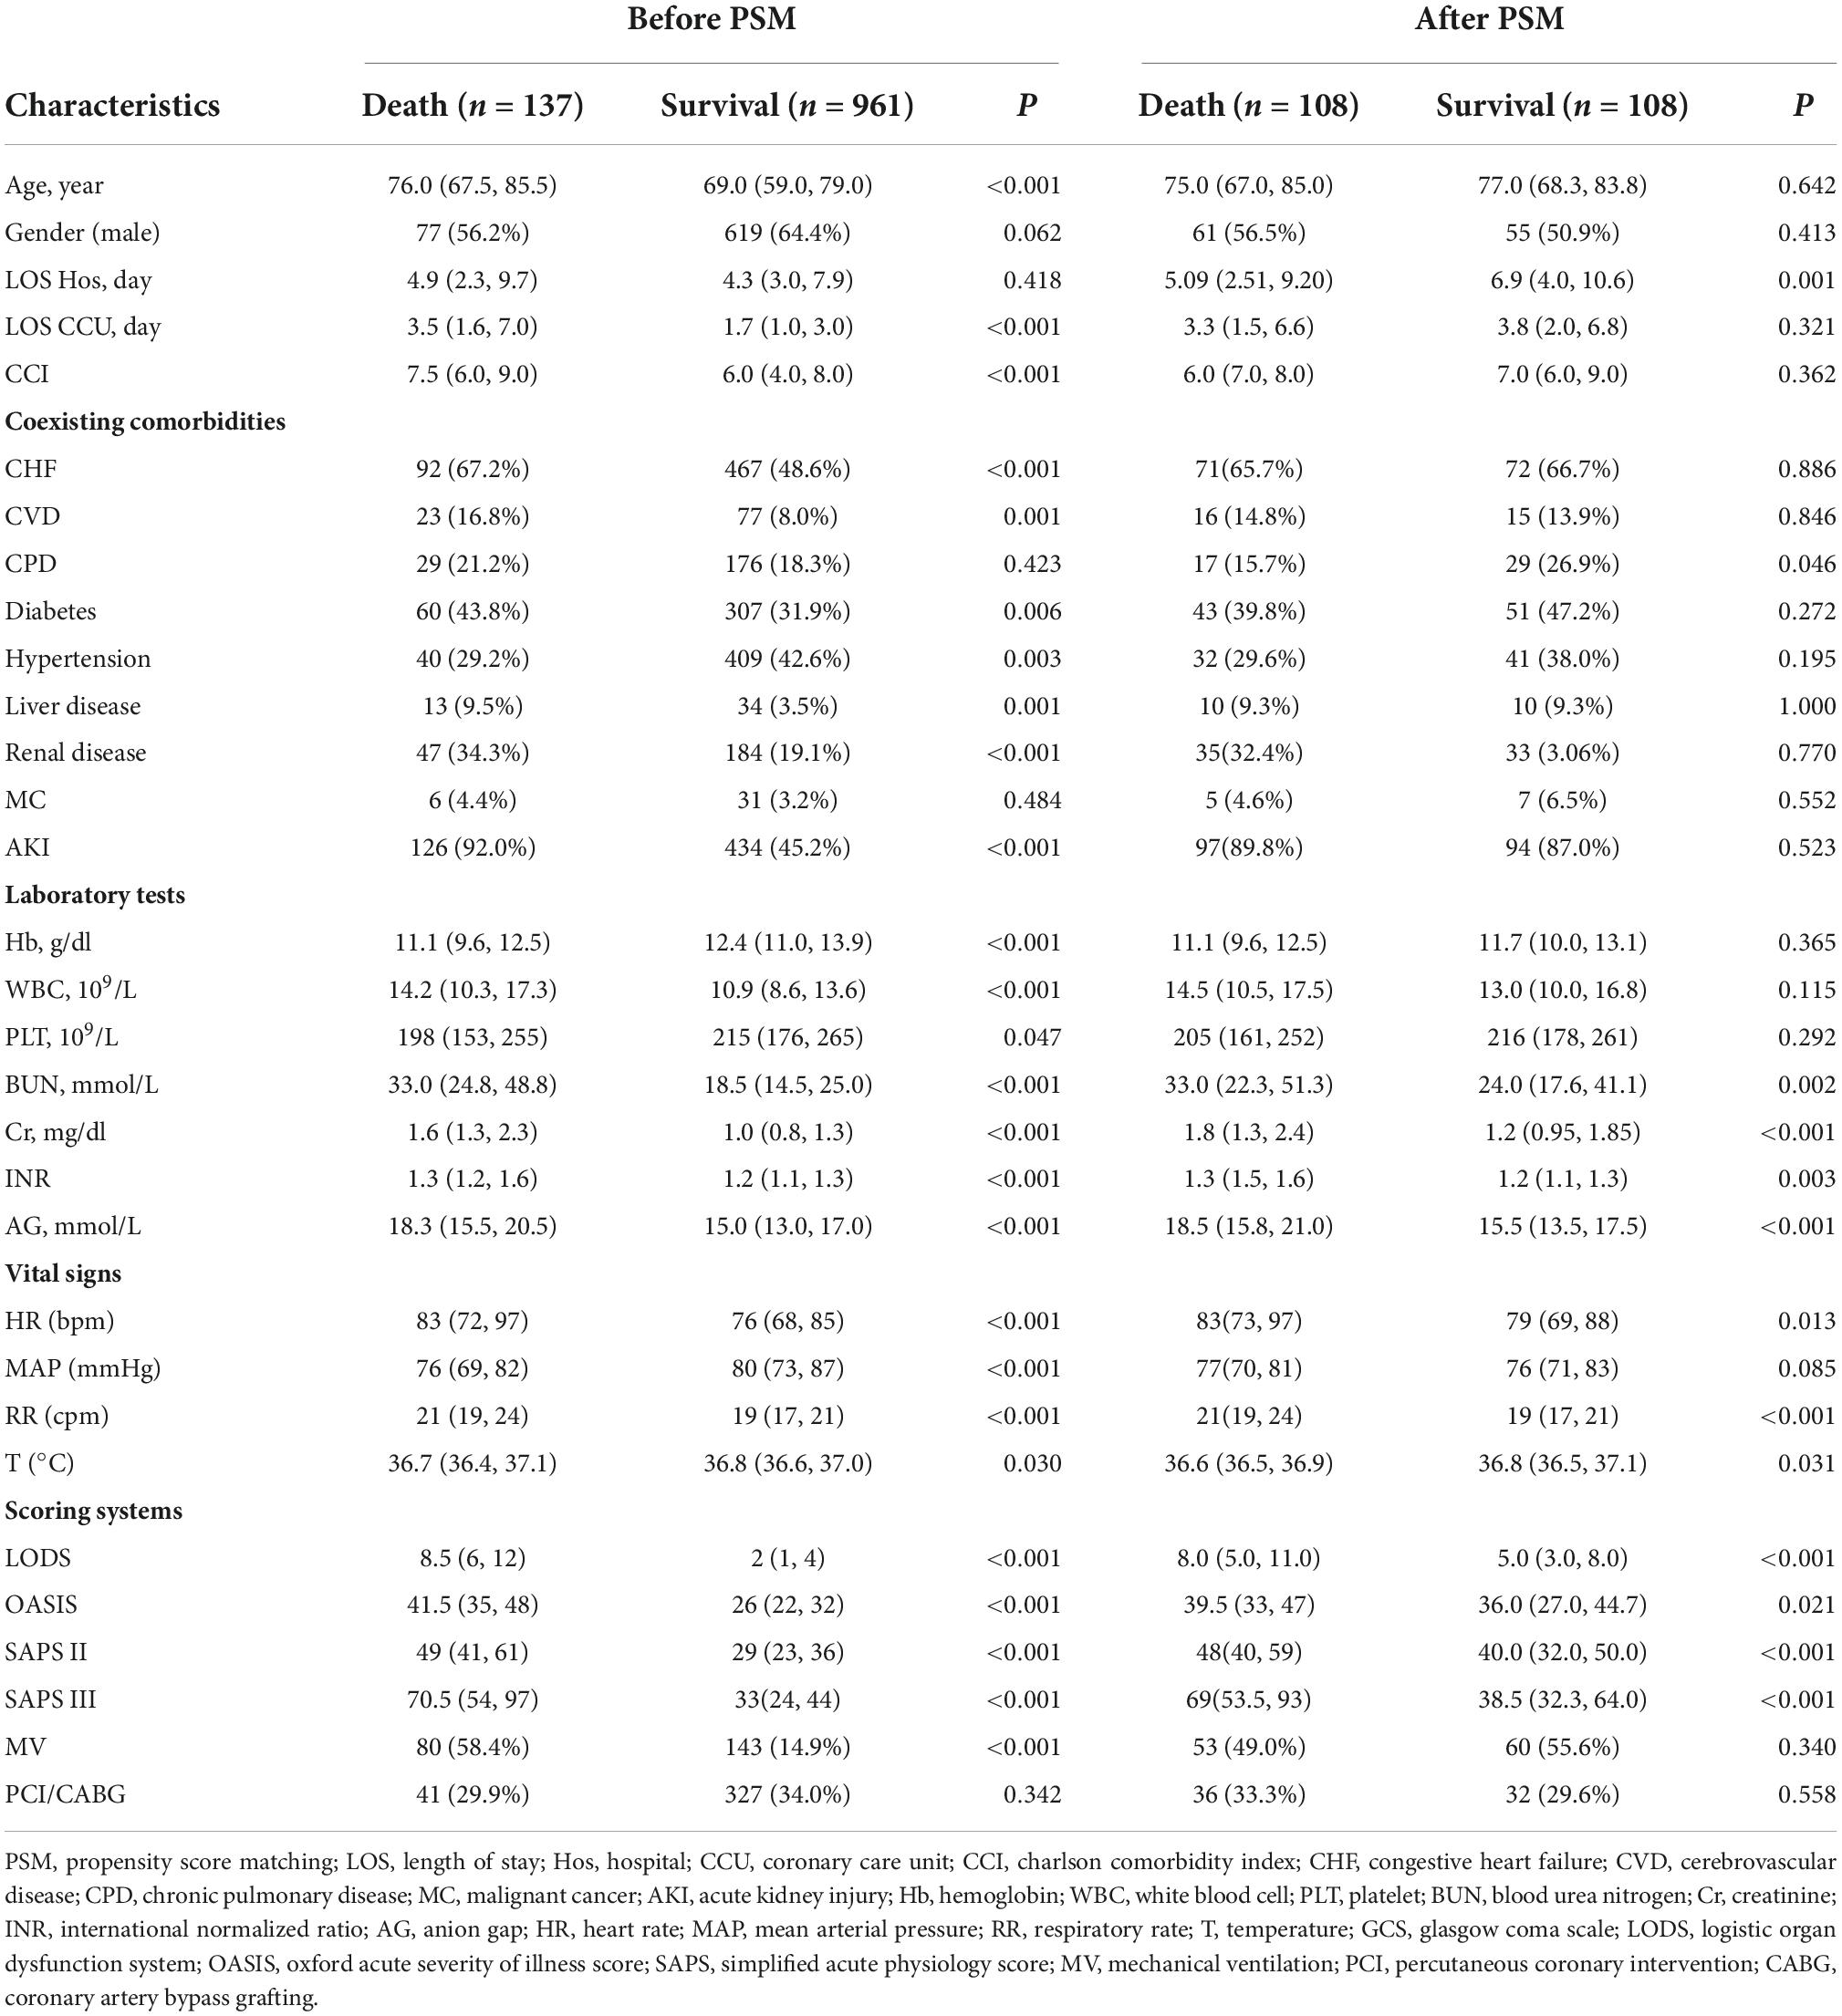
Table 1. Demographic and clinical characteristics of patients.
Regression analysis
Logistic regression analysis
Before PSM, age, AG, and SAPS III were independent risk factors for in-hospital mortality in CCU patients with AMI, regardless of whether the regression was univariable or multivariable (P < 0.01 for all) (Table 2). After PSM, AG (univariable regression analysis: OR 1.276, 95% CI 1.166–1.395, P < 0.001; multivariable regression analysis: OR 1.188, 95% CI 1.082–1.304, P < 0.01), OASIS (univariable regression analysis: OR 1.036, 95% CI 1.007–1.065, P < 0.001; multivariable regression analysis: OR 0.947, 95% CI 0.899–0.998, P = 0.043), and SAPS III (univariable regression analysis: OR 1.036, 95% CI 1.023–1.049, P < 0.001; multivariable regression analysis: OR 1.046, 95% CI 1.023–1.070, P = 0.001) were independent risk factors for in-hospital mortality in the included patients (Table 3).
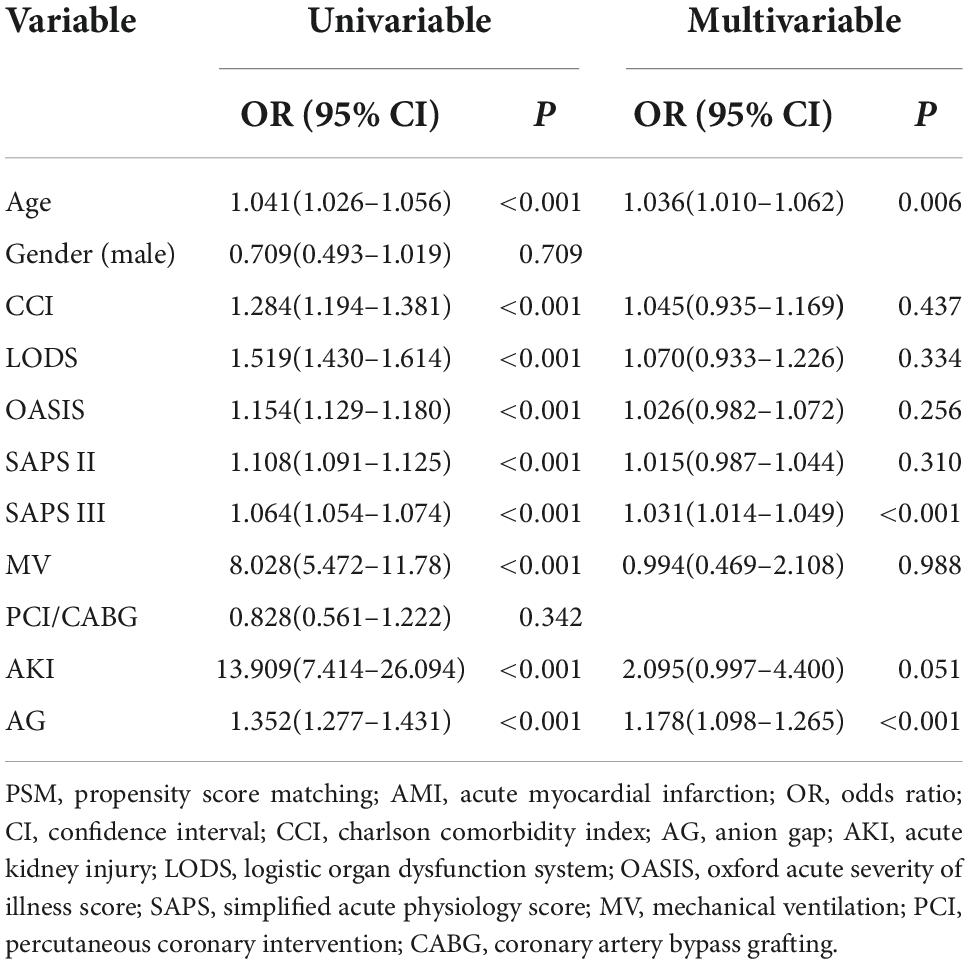
Table 2. Binomial logistic regression analysis for in-hospital mortality among coronary care unit patients with AMI (before PSM).
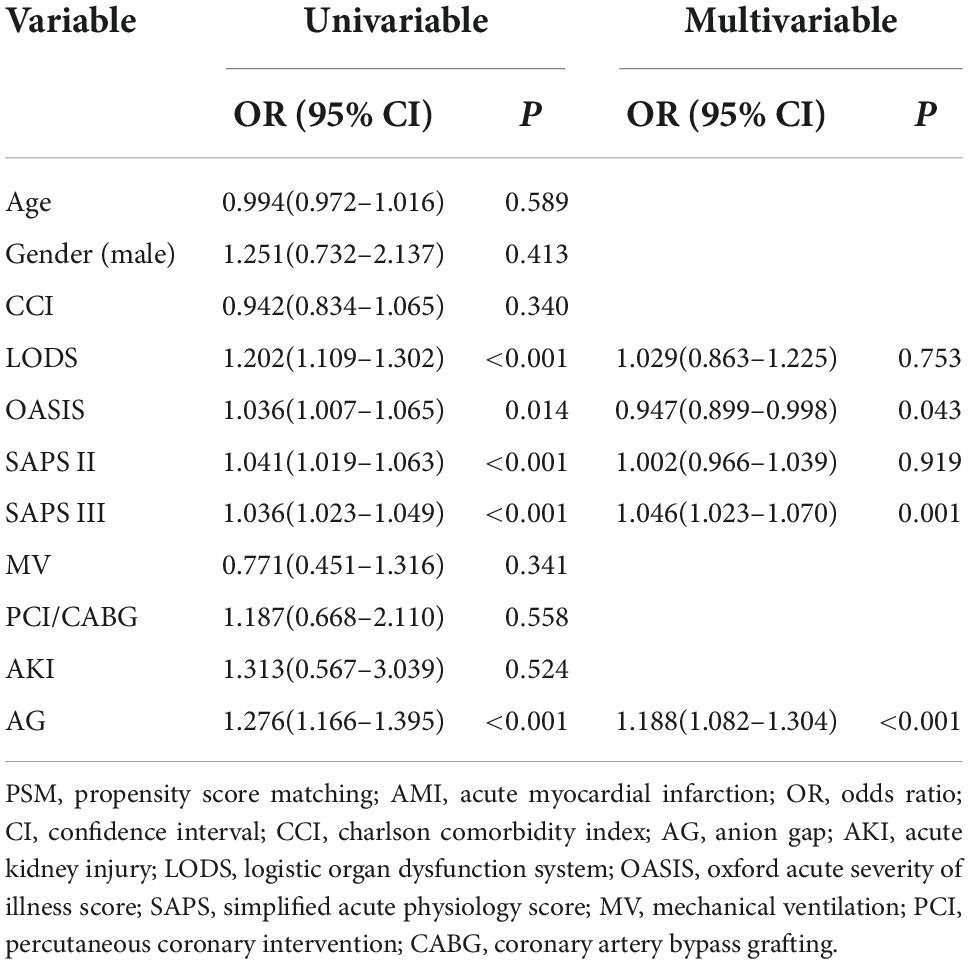
Table 3. Binomial logistic regression analysis for in-hospital mortality among coronary care unit patients with AMI (after PSM).
Cox regression analysis
Cox regression was performed to identify the risk factors and confirm the results of binomial logistic regression. Both univariable hazards analyses and multivariate analyses revealed that SAPS III was the independent predictor of mortality in CCU patients with AMI before PSM (univariate analysis: HR 1.031, 95% CI 1.026–1.037, P < 0.001; multivariate analysis: HR 1.015, 95% CI 1.004–1.027, P = 0.006) (Table 4) and after PSM (univariate analysis: HR 1.012, 95% CI 1.005–1.019, P < 0.001; multivariate analysis: HR 1.014, 95% CI 1.001–1.026, P = 0.038) (Table 5).
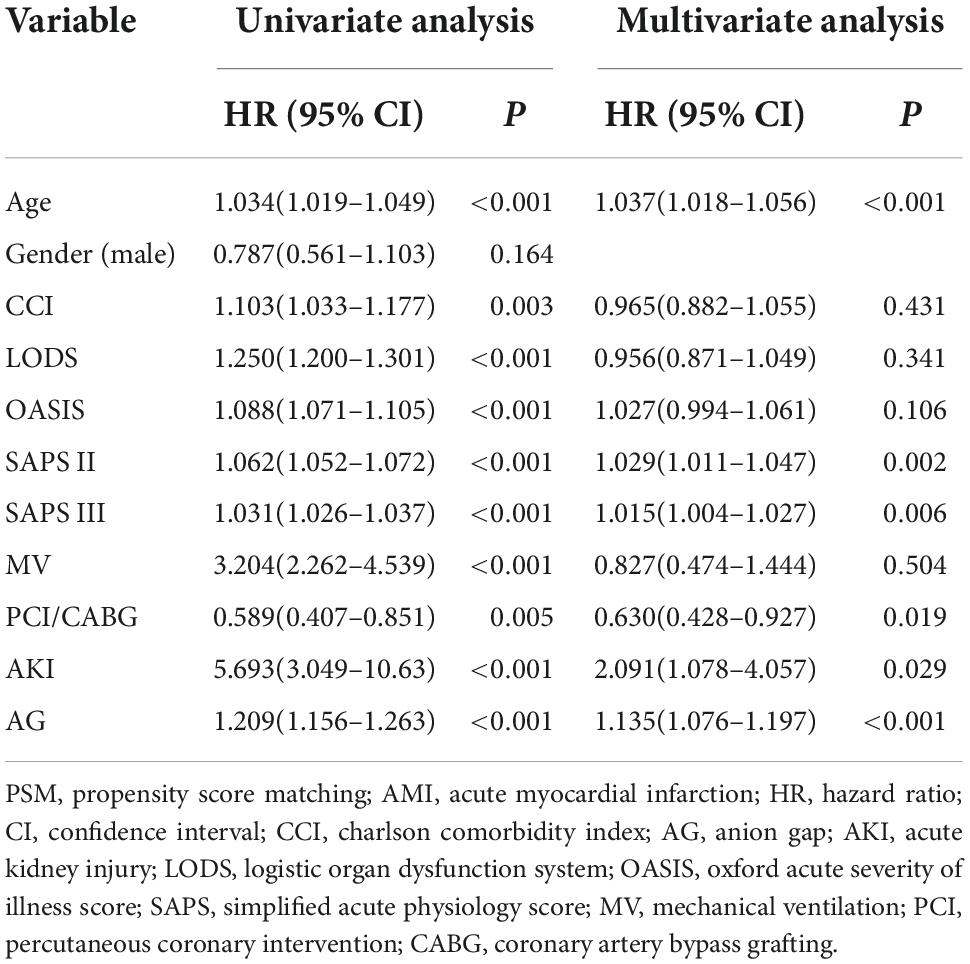
Table 4. Cox regression analyses of risk factors for in-hospital mortality among coronary care unit patients with AMI (before PSM).
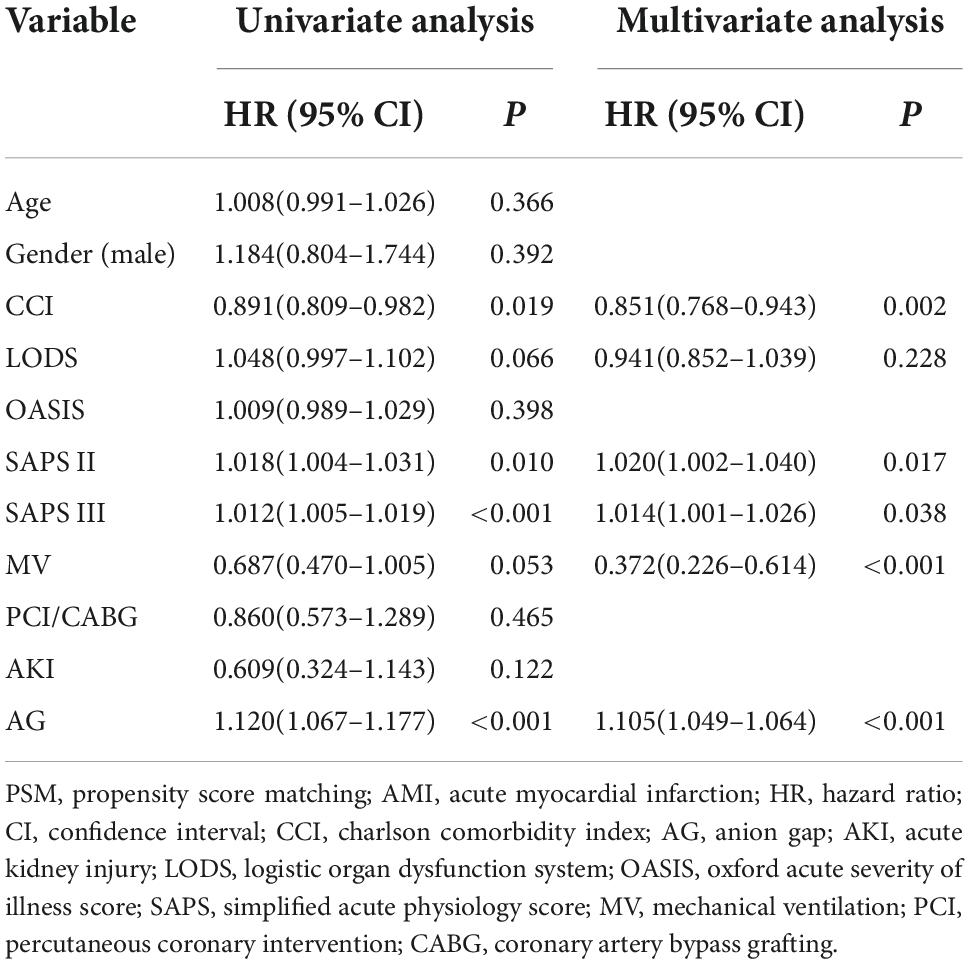
Table 5. Cox regression analyses of risk factors for in-hospital mortality among coronary care unit patients with AMI (after PSM).
Comparison of receiver operating characteristic curves
The ROC curves were used to demonstrate the predictive value of the four scoring systems for in-hospital mortality in CCU patients with AMI. All AUCs for the four scoring systems were greater than 0.850 before PSM. The AUC of the SAPS III score was greater than that of LODS, OASIS, and SAPS II (Figure 2A). Although LODS, SAPS II, and SAPS III had the same sensitivity, SAPS III had the highest specificity (82.83%) and Youden’s index (0.6750) (Table 6). After PSM, the AUC of the SAPS III model was 0.736, which was superior to LODS (Z = 2.541, P = 0.011), OASIS (Z = 4.960, P < 0.001), and SAPS II (Z = 3.219, P = 0.004) in predicting in-hospital mortality (Figure 2B). As shown in Table 7, SAPS III demonstrated reasonable sensitivity (84.26%) and Youden’s index (0.3704).
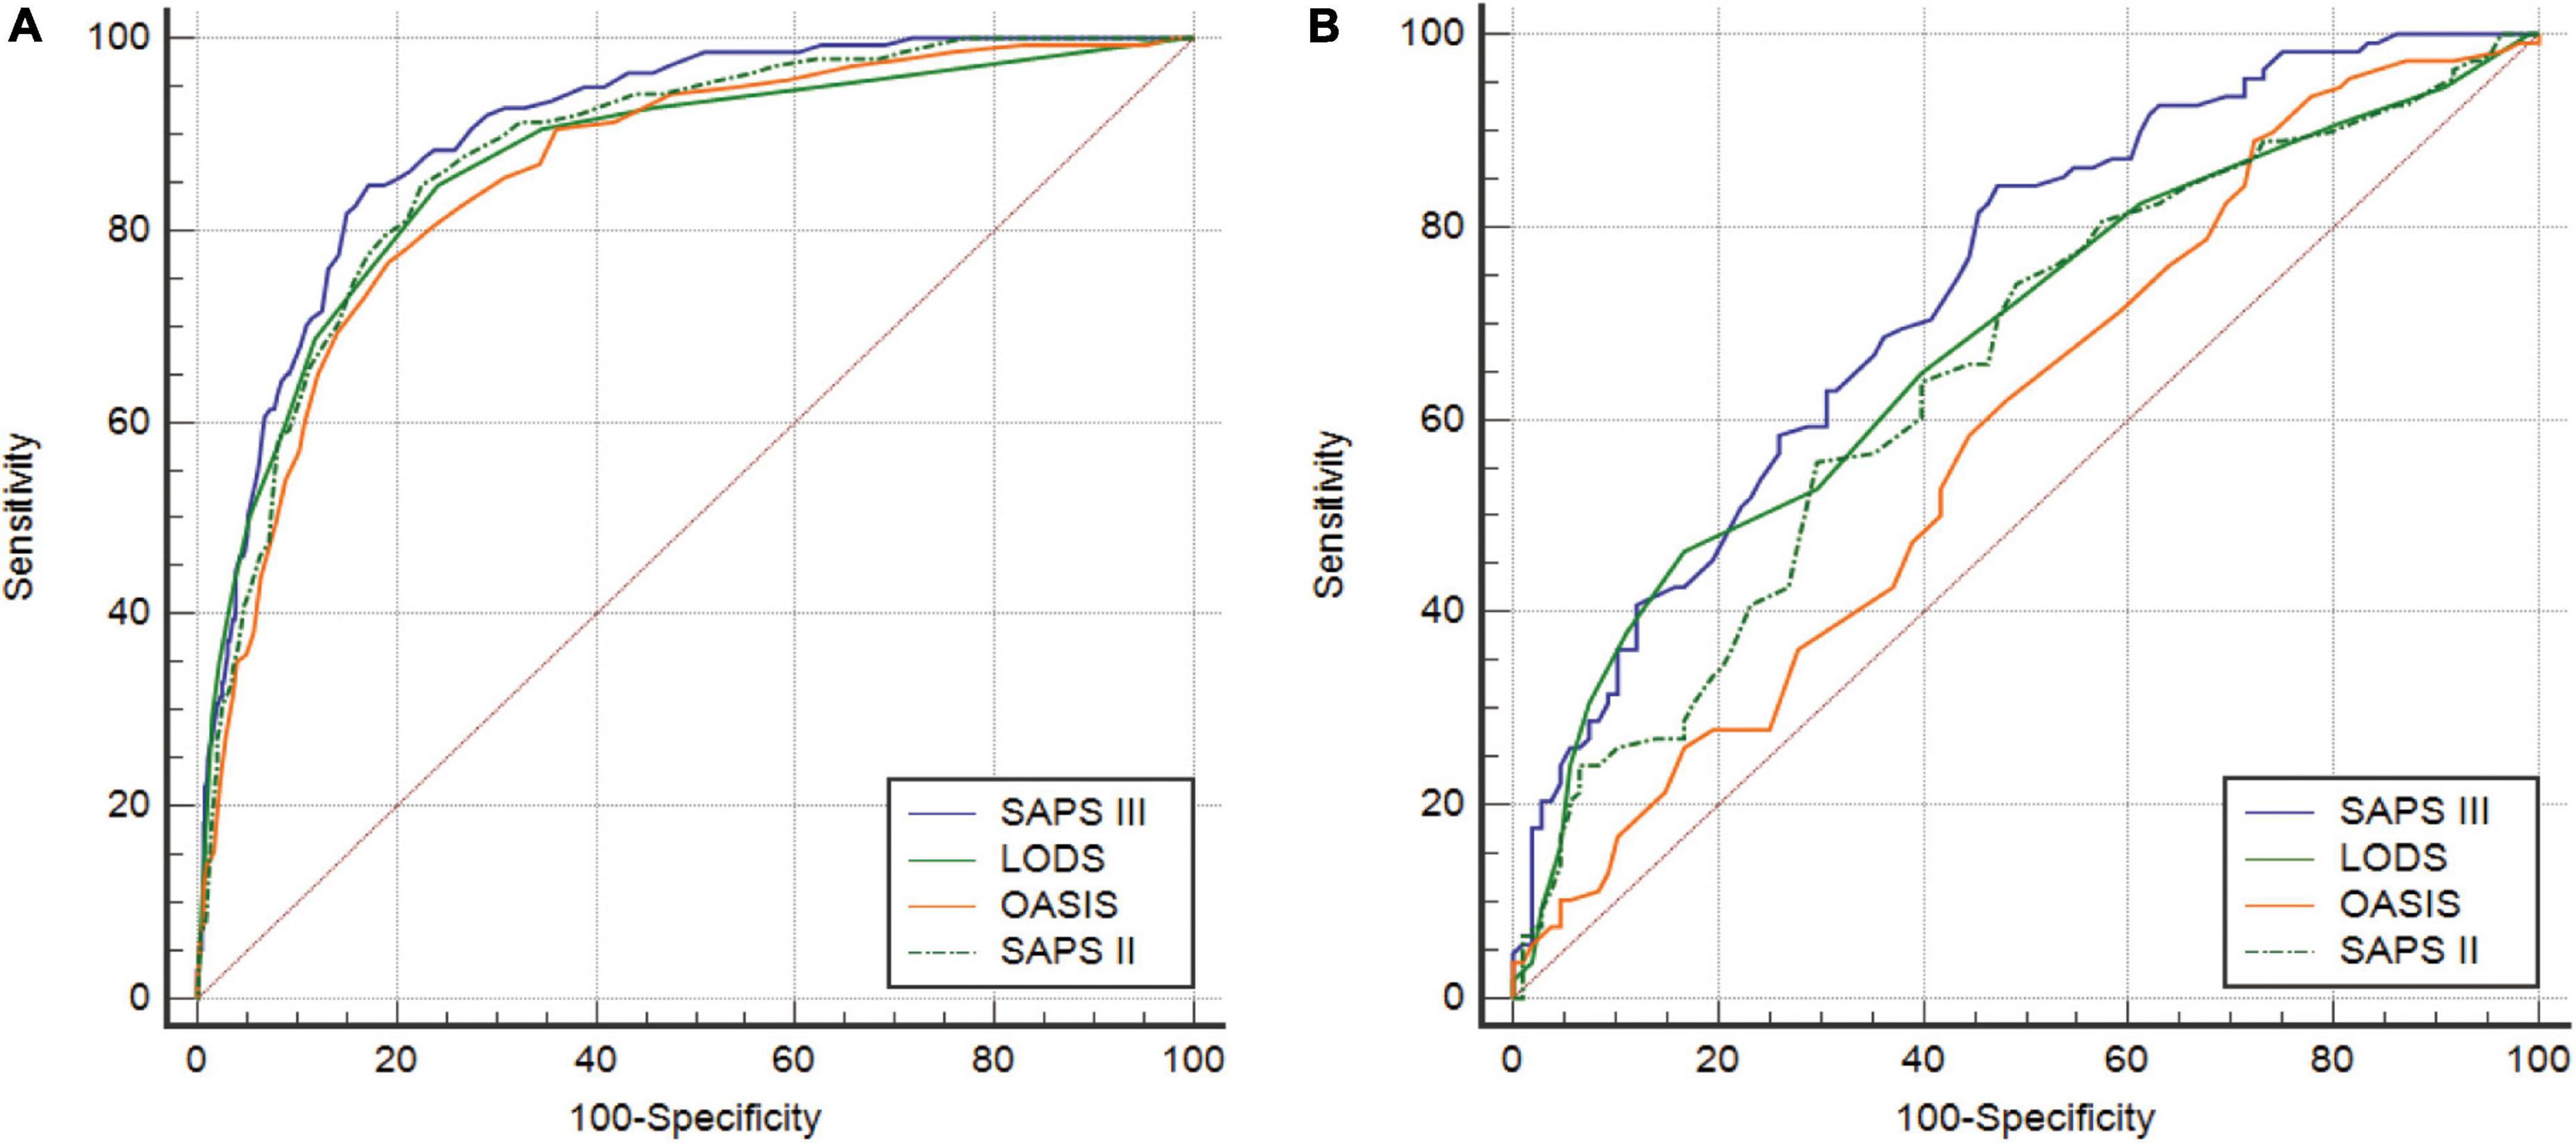
Figure 2. (A) ROC curves of LODS, OASIS, SAPS II, and SAPS III before PSM. (B) ROC curves of LODS, OASIS, SAPS II, and SAPS III after PSM. ROC, receiver operating characteristic; LODS, logistic organ dysfunction system; OASIS, oxford acute severity of illness score; SAPS, simplified acute physiology score; PSM, propensity score matching.
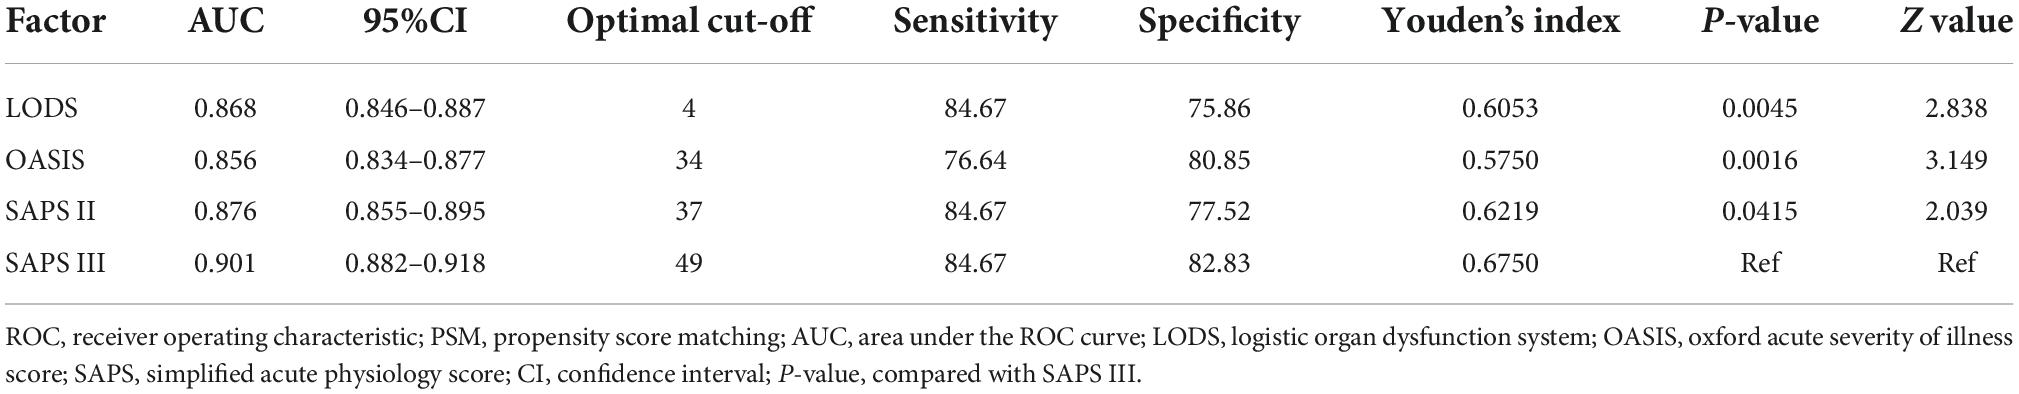
Table 6. Comparison of ROC curves (before PSM).

Table 7. Comparison of ROC curves (after PSM).
Kaplan–Meier curves of the simplified acute physiology score III scoring system
Before PSM, SAPS III was separated into high- and low-score categories, with an optimal cutoff of 49 (Figure 3A). The Kaplan–Meier curves showed a median survival of 19.566 days for the high-score group (95% CI: 13.185–24.301) and 42.156 days in the low-score group (95% CI: 41.237–42.156). The difference between the two groups was statistically significant (log-rank test, P < 0.0001), and the hazard ratio (HR) of the high-score group was 7.636 (95% CI: 5.355–10.889) when compared with the low-score group. After PSM, the optimal cutoff value was 49 (Figure 3B). The median survival days in the high-score group were 15.245 days (95% CI: 10.795–19.695), whereas they were 24.493 days in the low-score group (95% CI: 16.694–32.292). The difference between the two groups was statistically significant (log-rank test, P < 0.0001). Moreover, the HR for the high-score group was 2.077 (95% CI: 1.379–3.123) compared to the low-score group.
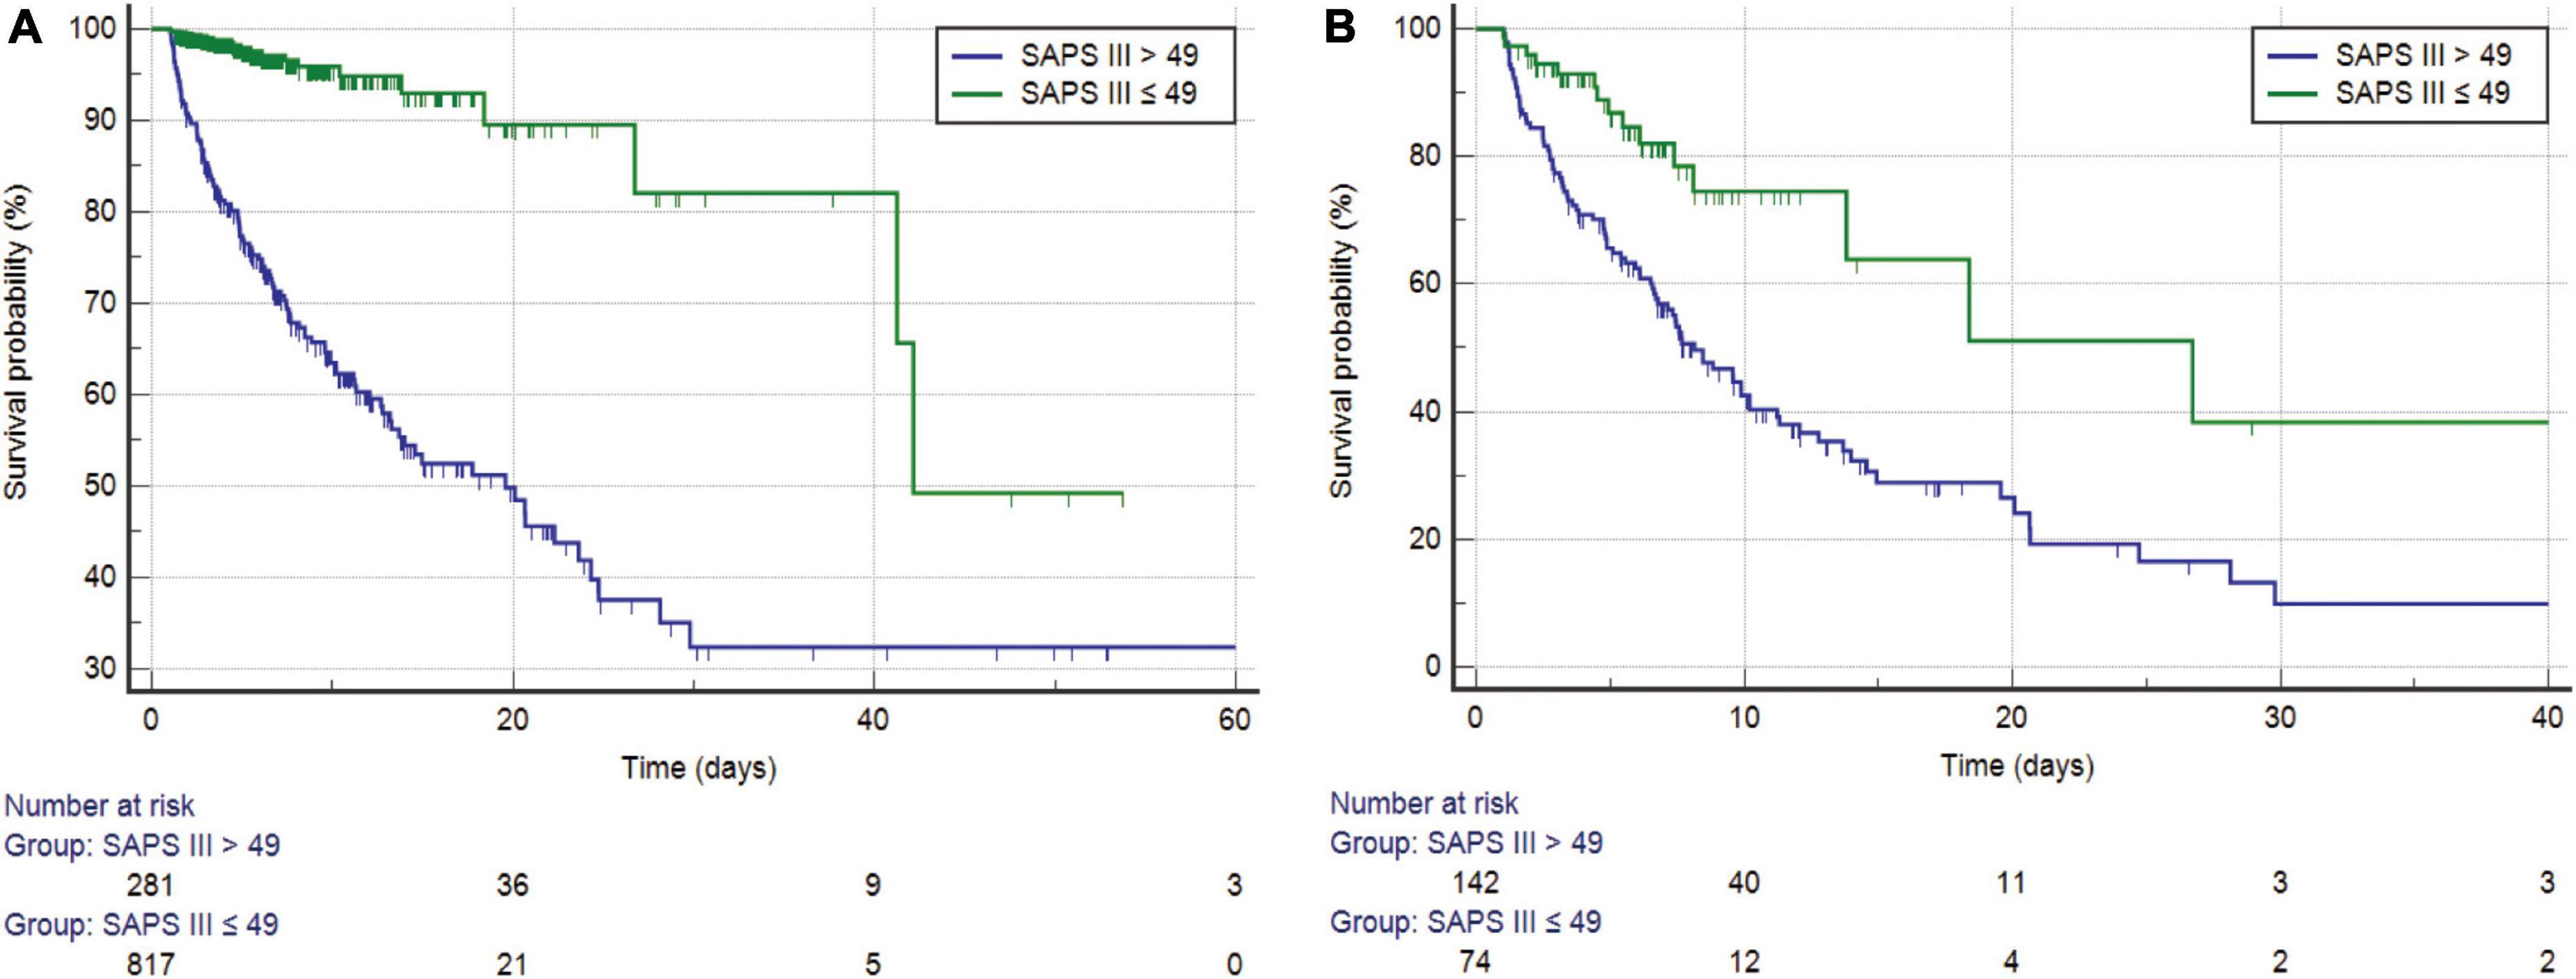
Figure 3. (A) Kaplan–Meier survival curves of SAPS III for the study cohort before PSM (log-rank P < 0.0001). (B) Kaplan–Meier survival curves of SAPS III for the study cohort after PSM (log-rank P < 0.0001). SAPS, simplified acute physiology score; PSM, propensity score matching.
Comparison of decision curve analysis curves
Before PSM, the DCA curve results of the four scoring systems showed that SAPS III and LODS had slightly more clinical profits than OASIS and SAPS II, but the two overlapped and were comparable (Figure 4A). After PSM, SAPS III had the greatest net benefit when compared to the other three scoring systems if the high-risk threshold was lower than 0.6, while the net benefit of LODS was slightly higher than SAPS III when the high-risk threshold was between 0.6 and 0.7. When the high-risk threshold was greater than 0.8, SAPS III offered more significant net benefits than the other three scoring systems (Figure 4B).
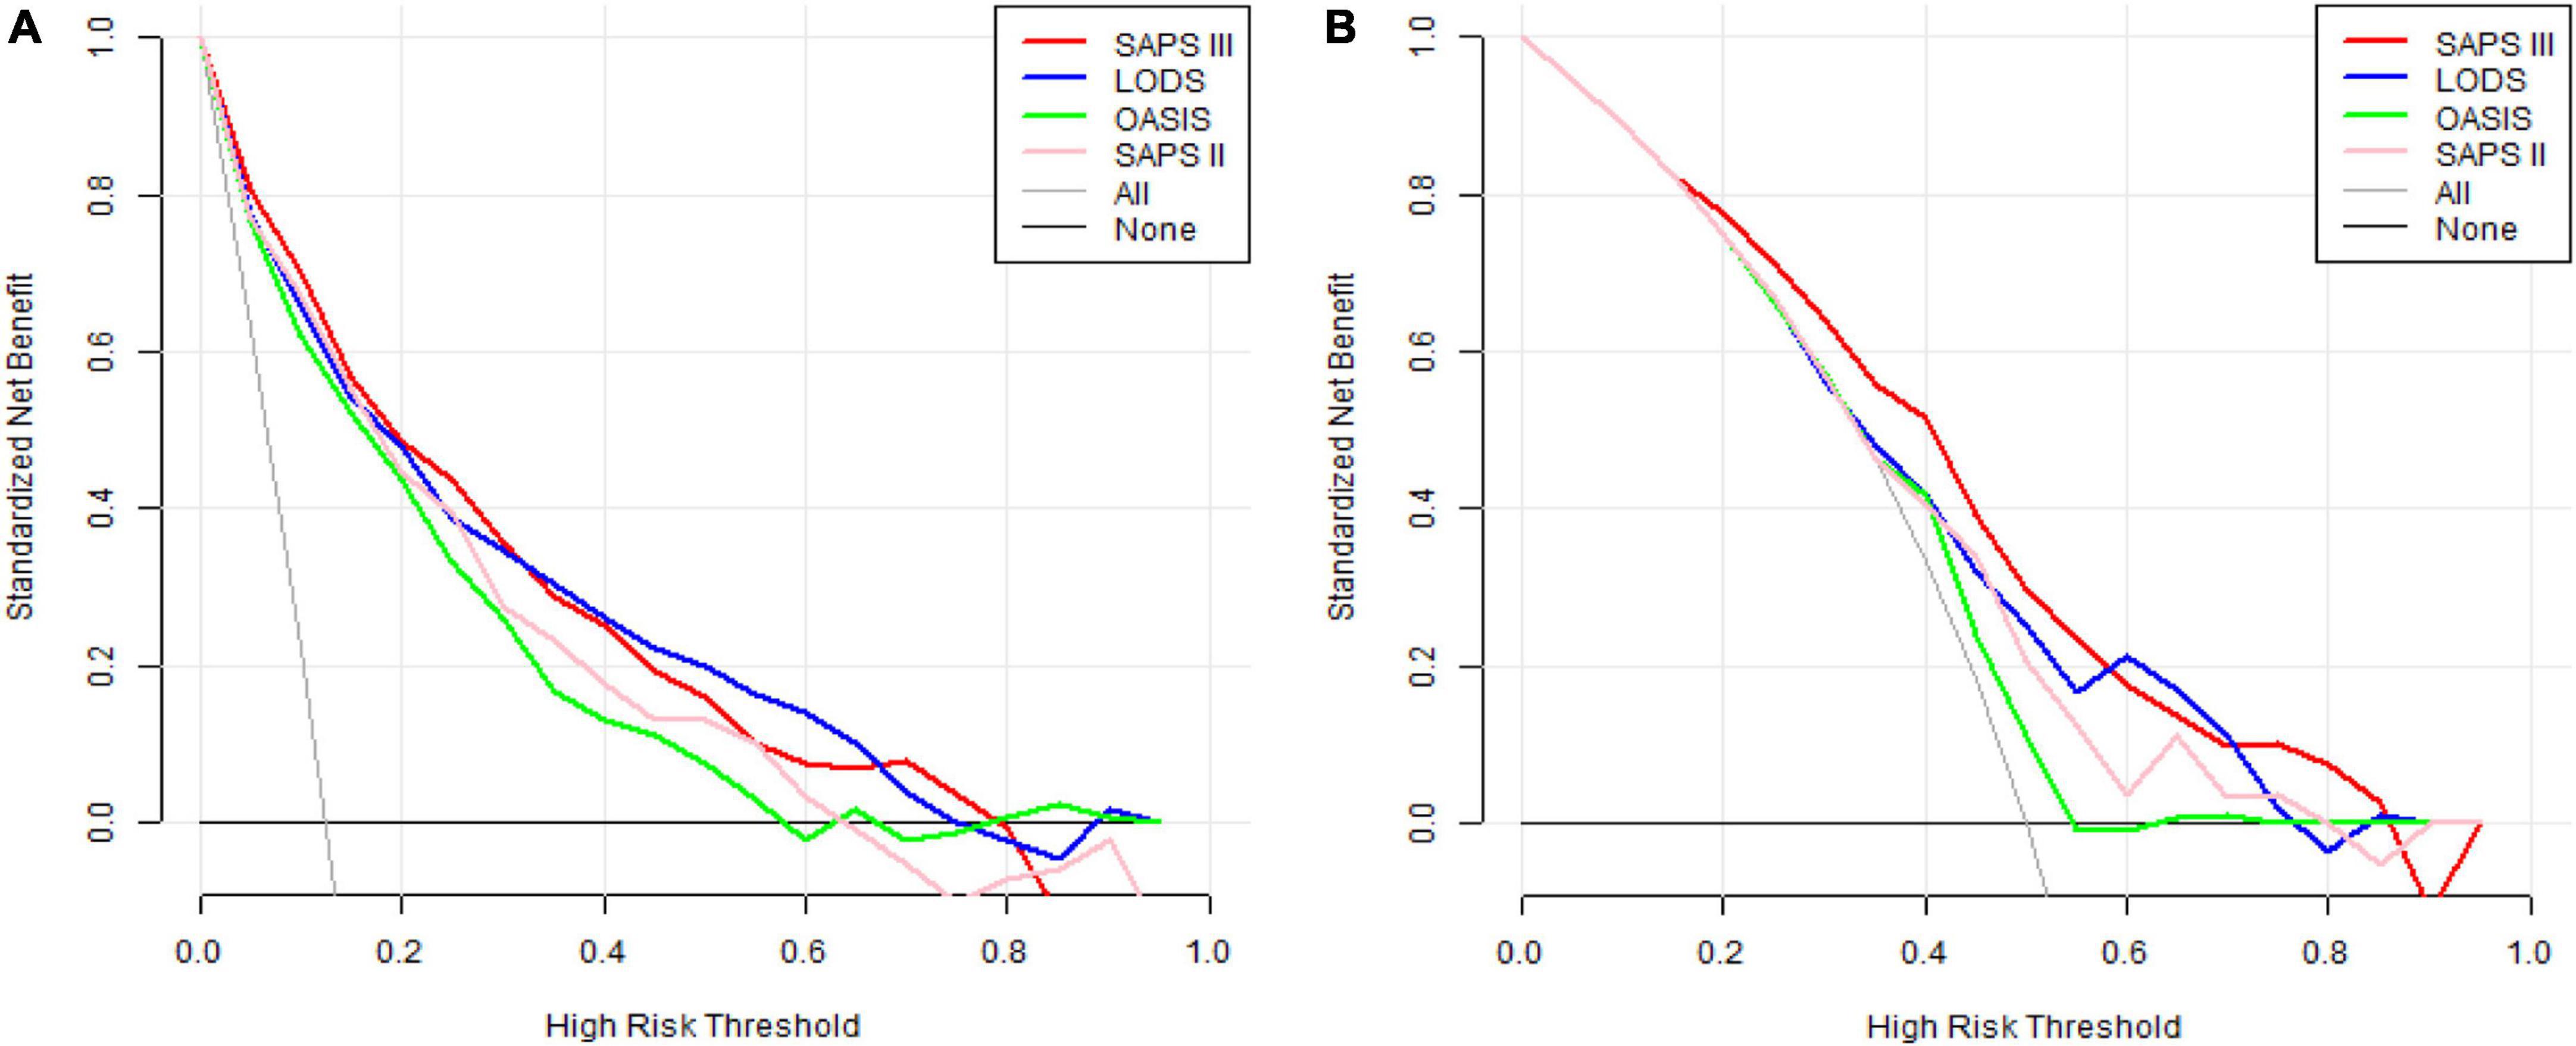
Figure 4. (A) DCA curves of LODS, OASIS, SAPS II, and SAPS III before PSM. (B) DCA curves of LODS, OASIS, SAPS II, and SAPS III after PSM. DCA, decision curve analysis; LODS, logistic organ dysfunction system; OASIS, oxford acute severity of illness score; SAPS, simplified acute physiology score; PSM, propensity score matching.
Discussion
This study explored a better scoring system to predict in-hospital mortality in CCU patients with AMI. The main findings are as follows: (1) The death group had higher mean LODS, OASIS, SAPS II, and SAPS III scores than the survivor group; (2) SAPS III was an independent risk factor for predicting in-hospital mortality in CCU patients with AMI before and after PSM; (3) SAPS III had a more excellent predictive value than the other three scoring systems; (4) before and after PSM, there was a substantial increase in in-hospital mortality and a significant decrease in median survival days as the SAPS III score increased; (5) SAPS III provided the greatest net benefits across the largest threshold range compared to the other three scoring systems; and (6) patients who underwent PCI/CABG and those who had coexisting comorbidities were not associated with in-hospital mortality.
We analyzed the independent risk factors associated with AMI by binomial logistic regression and cox regression analysis. Regression analysis revealed that SAPS III was the independent predictor of mortality in CCU patients with AMI before and after PSM. AKI is a severe complication of AMI, and the development of AKI is strongly correlated with in-hospital mortality (18, 19). Before PSM, approximately 92.0% of patients in the death group died from AKI-related comorbidities, which was significantly higher than in the survival group. To make the data from the death and survival groups more comparable, we matched the two groups. Thus, the baseline characteristics of the patients in each group were comparable to reduce the influence of potential confounding factors. AG was included due to the limited number of variables and its high odds ratio value in the univariable regression analysis. The results suggested that AG provided significant predictive value for in-hospital mortality in CCU patients with AMI. Indeed, previous studies demonstrated that AG was an independent and reliable predictor of all-cause mortality after AMI. Higher AG values were associated with more severe clinical types of coronary artery disease (20, 21). More clinical data collected in the public MIMIC-IV database will increase the credibility of the analysis. Mortality in individuals with AMI is related to rapid percutaneous coronary intervention (PCI), mechanical problems, and indications of heart failure (22–24). Patients with STEMI who underwent primary PCI had a 10-year survival rate of 76.2% after hospital discharge (25). PCI/CABG seemed like an independent risk factor for in-hospital mortality of patients with STEMI (26). However, the conclusion is inconsistent with the current results. One possible explanation is that the surgical population in our study had comparable baseline characteristics before and after PSM.
It is crucial to determine the risk level in critically ill patients. The prevalence of major diseases and changes in diagnosis and treatment will lead to poor discrimination and calibration of scoring systems. Depending on the individual conditions and geographic regions, the performance of scoring systems differs in various scenarios (27). Critical care clinicians are seeking a scoring prognostic model that is standardized, highly precise, and specific. In a retrospective study, the common variables of LODS, including Glasgow Coma Scale (GCS) score, heart rate, blood pressure, urine output, and PaO2/FiO2, were mostly related to STEMI outcomes. Therefore, LODS could better predict in-hospital mortality in ICU patients with STEMI (26). Our study found that SAPS III has the second highest sensitivity and Youden’s index. The AUC of the LODS model was 0.680, which was lower than the 0.736 of SAPS III after PSM (P = 0.011, Z = 2.541). Consequently, SAPS III has greater discriminative power than LODS. Furthermore, the OASIS system had fewer variables and displayed higher sensitivity than other scoring systems, but it had the lowest specificity. In a cohort study of clinical outcomes in patients with sepsis, OASIS might be an initial predictor, as it does not contain any laboratory parameters (28). Some laboratory parameters, such as platelet count, white blood cell, and serum creatinine level, have specific values for diagnosing AMI and predicting mortality after AMI (29–31). Due to the lack of these meaningful laboratory parameters, OASIS is not an ideal predictor of patients with AMI. The capacity of SAPS III to differentiate in-hospital mortality was superior to that of the other three scoring systems. This may be because the biggest advantage of SAPS III compared to other databases is that it provides both global and regional databases for users to choose from according to the situation. To more accurately predict mortality in different geographic regions, the SAPS III scoring system uses a different calculation formula for each region (32). Special and appropriate criteria can be selected for ICU patients to predict mortality. Another feature of SAPS III, the manual collection and calibration of data within 1 h of ICU admission, prevents mortality prediction from being interfered with by clinical interventions or increased sampling rates (33). Related research compared the performance of the SAPS II and SAPS III in intermediate-care patients, and the SAPS II had adequate discriminative power but was poorly calibrated and might underestimate patient mortality (34). Consequently, the SAPS III showed high accuracy in predicting mortality.
SAPS III demonstrated excellent discrimination for 28-day mortality in individuals with sepsis (35). Furthermore, SAPS III was more sensitive and discriminative than the Acute Physiology and Chronic Health Evaluation (APACHE) IV scoring system for mortality prediction in multi-trauma ICU patients (36). Another study with 1042 ICU patients came to the same conclusion: The SAPS III score was more predictive of mortality than the APACHE II score (37). To date, no studies have evaluated the predictive power of the SAPS III scoring system for in-hospital mortality in patients with AMI. The present results confirmed that SAPS III was an independent risk factor for predicting in-hospital mortality in CCU patients with AMI. Meanwhile, SAPS III had a significantly higher AUC than LODS, OASIS, and SAPS II. This may be because SAPS III contains hydrogen ion concentration, which is not included in the other three rating systems. Hydrogen ion concentration was confirmed to be related to myocardial ischemia and reperfusion injury (38). A stratification analysis of the optimal cutoff for SAPS III showed that higher scores were associated with higher in-hospital mortality.
Decision curve analysis is one method to evaluate the clinical utility of predictive models. We observed the DCA curves of all scoring systems. Before PSM, the DCA curves of SAPS III and LODS had marginally greater clinical profits than OASIS and SAPS II, but this advantage was not significant. After PSM, in most threshold ranges, the clinical benefit of SAPS III was significantly higher than that of the other three scoring systems. However, it was only slightly lower than that of LODS within a very minimal range of about 0.6–0.7. This suggested that when most thresholds were selected for mortality prediction in clinical applications, the SAPS III score appeared to provide patients with the greatest clinical benefit. For example, if we use 0.8 as the threshold value, doctors will take active measures to reduce death as much as possible in clinical practice when patients have an 80% probability of death. Meanwhile, SAPS III’s ordinate (red line) is roughly 0.08, but the horizontal coordinates of the other three scores were less than or equal to 0. This meant that if the SAPS III score had been used to predict death at this threshold, eight out of every hundred patients would have benefited clinically, whereas the other three scoring systems would not have. The interpretation of thresholds in other locations is the same. Therefore, SAPS III is an excellent model for predicting in-hospital mortality for CCU patients with AMI.
As a strength of the study, two groups were defined by the optimal cutoff for SAPS III, and a subgroup analysis was performed. Before and after PSM, the risk of death remained higher in the high-score group than in the low-score group, which added to the reliability of the results. It is critical to consider the SAPS III score in clinical practice. Early identification and prompt intervention in patients with AMI at high risk for mortality can help reduce in-hospital mortality. Another strength is the extensive and effective data from MIMIC-IV. A large-scale investigation was conducted to increase the credibility of the study. There are also some limitations to this study. First, this was a single-center study based on a predominantly white US population, which may have potential implications for the analysis. Second, longitudinal data generated during hospitalization, such as dynamic changes in the scoring systems, may also be useful for prognostic prediction. However, we were unable to normalize these aforementioned longitudinal data due to the large variation in the length of hospital/CCU stay among patients; thus, only the scoring system scores on the first day of admission were selected for this study. Factors influencing mortality after CCU discharge were not considered, which became increasingly pertinent over time. Third, some key markers associated with myocardial injuries, such as troponin T or troponin I, were not compared with scoring systems in the study. That is because complete troponin values were unavailable in hospitalized patients, and blood troponin levels fluctuate rapidly, making it difficult to determine the exact value at the onset of a disease, which had an impact on outcomes. Therefore, prospective, large-scale clinical studies can be performed to validate the results.
Conclusion
SAPS III is an independent risk factor for CCU patients with AMI. The predictive value for in-hospital mortality with SAPS III is superior to that of LODS, OASIS, and SAPS II. The results of the DCA analysis suggest that SAPS III may provide a better clinical benefit for patients. We demonstrated that SAPS III is an excellent scoring system for predicting in-hospital mortality in CCU patients with AMI.
Data availability statement
The original contributions presented in this study are included in the article/supplementary material, further inquiries can be directed to the corresponding author.
Ethics statement
Ethical review and approval was not required for the study on human participants in accordance with the local legislation and institutional requirements. Written informed consent for participation was not required for this study in accordance with the national legislation and the institutional requirements.
Author contributions
XZ and TH contributed to the study design and drafted and revised the manuscript. XZ contributed to the design and acquisition of data. TL contributed to the statistical analysis. WW and TH contributed to the design and critically revised the manuscript. All authors contributed to the article and approved the submitted version.
Acknowledgments
We thank all co-authors for their contributions to data collection and processing. Meanwhile, we would like to thank the Massachusetts Institute of Technology and the Beth Israel Deaconess Medical Center for the MIMIC-IV database.
Conflict of interest
The authors declare that the research was conducted in the absence of any commercial or financial relationships that could be construed as a potential conflict of interest.
Publisher’s note
All claims expressed in this article are solely those of the authors and do not necessarily represent those of their affiliated organizations, or those of the publisher, the editors and the reviewers. Any product that may be evaluated in this article, or claim that may be made by its manufacturer, is not guaranteed or endorsed by the publisher.
Footnotes
References
1. Greco C, Rosato S, D’Errigo P, Mureddu GF, Lacorte E, Seccareccia F. Trends in mortality and heart failure after acute myocardial infarction in Italy from 2001 to 2011. Int J Cardiol. (2015). 184:115–21. doi: 10.1016/j.ijcard.2015.01.073
2. Bonnefoy E, Kirkorian G. [Mortality of myocardial infarction]. Ann Cardiol Angeiol. (2011) 606:311–6. doi: 10.1016/j.ancard.2011.10.001
3. Takagi K, Tanaka A, Yoshioka N, Morita Y, Yoshida R, Kanzaki Y, et al. In-hospital mortality among consecutive patients with ST-elevation myocardial infarction in modern primary percutaneous intervention era ~ Insights from 15-year data of single-center hospital-based registry. PLoS One. (2021) 16:e0252503. doi: 10.1371/journal.pone.0252503
4. Fuster V. 50th anniversary historical article. Myocardial infarction and coronary care units. J Am Coll Cardiol. (1999) 34:1851–3. doi: 10.1016/s0735-1097(99)00496-9
5. Wang SJ, Cheng ZX, Fan XT, Lian YG. Development of an optimized risk score to predict short-term death among acute myocardial infarction patients in rural China. Clin Cardiol. (2021) 44:699–707. doi: 10.1002/clc.23598
6. Reina A, Vázquez G, Aguayo E, Bravo I, Colmenero M, Bravo M. Mortality discrimination in acute myocardial infarction: comparison between APACHE III and SAPS II prognosis systems. PAEEC Group. Intensive Care Med. (1997) 23:326–30. doi: 10.1007/s001340050335
7. Kellner P, Prondzinsky R, Pallmann L, Siegmann S, Unverzagt S, Lemm H, et al. Predictive value of outcome scores in patients suffering from cardiogenic shock complicating AMI: APACHE II, APACHE III, Elebute-stoner, SOFA, and SAPS II. Med Klin Intensivmed Notfmed. (2013) 108:666–74. doi: 10.1007/s00063-013-0234-2
8. Le Gall JR, Klar J, Lemeshow S, Saulnier F, Alberti C, Artigas A, et al. The logistic organ dysfunction system. A new way to assess organ dysfunction in the intensive care unit. ICU scoring group. JAMA. (1996) 276:802–10. doi: 10.1001/jama.276.10.802
9. Metnitz PG, Lang T, Valentin A, Steltzer H, Krenn CG, Le Gall JR. Evaluation of the logistic organ dysfunction system for the assessment of organ dysfunction and mortality in critically ill patients. Intensive Care Med. (2001) 27:992–8. doi: 10.1007/s001340100888
10. Johnson AE, Kramer AA, Clifford GD. A new severity of illness scale using a subset of acute physiology and chronic health evaluation data elements shows comparable predictive accuracy. Crit Care Med. (2013) 41:1711–8. doi: 10.1097/CCM.0b013e31828a24fe
11. Le Gall JR, Lemeshow S, Saulnier F. A new simplified acute physiology score (SAPS II) based on a European/North American multicenter study. JAMA. (1993) 270:2957–63. doi: 10.1001/jama.270.24.2957
12. Metnitz PG, Moreno RP, Almeida E, Jordan B, Bauer P, Campos RA, et al. SAPS 3–from evaluation of the patient to evaluation of the intensive care unit. part 1: objectives, methods and cohort description. Intensive Care Med. (2005) 31:1336–44. doi: 10.1007/s00134-005-2762-6
13. Moreno RP, Metnitz PG, Almeida E, Jordan B, Bauer P, Campos RA, et al. SAPS 3–from evaluation of the patient to evaluation of the intensive care unit. part 2: development of a prognostic model for hospital mortality at ICU admission. Intensive Care Med. (2005) 31:1345–55. doi: 10.1007/s00134-005-2763-5
14. Katsounas A, Kamacharova I, Tyczynski B, Eggebrecht H, Erbel R, Canbay A, et al. The predictive performance of the SAPS II and SAPS 3 scoring systems: a retrospective analysis. J Crit Care. (2016) 33:180–5. doi: 10.1016/j.jcrc.2016.01.013
15. Charlson ME, Pompei P, Ales KL, MacKenzie CR. A new method of classifying prognostic comorbidity in longitudinal studies: development and validation. J Chronic Dis. (1987) 40:373–83. doi: 10.1016/0021-9681(87)90171-8
16. DeLong ER, DeLong DM, Clarke-Pearson DL. Comparing the areas under two or more correlated receiver operating characteristic curves: a nonparametric approach. Biometrics. (1988) 44:837–45.
17. Vickers AJ, Van Calster B, Steyerberg EW. Net benefit approaches to the evaluation of prediction models, molecular markers, and diagnostic tests. BMJ. (2016) 352:i6. doi: 10.1136/bmj.i6
18. Marenzi G, Cosentino N, Bartorelli AL. Acute kidney injury in patients with acute coronary syndromes. Heart. (2015) 101:1778–85. doi: 10.1136/heartjnl-2015-307773
19. Kanic V, Ekart R, Kanic Z. Outcome in patients resuscitated following myocardial infarction with acute kidney injury. Int J Med Sci. (2020) 17:1333–9. doi: 10.7150/ijms.45686
20. Yang SW, Zhou YJ, Zhao YX, Liu YY, Tian XF, Wang ZJ, et al. The serum anion gap is associated with disease severity and all-cause mortality in coronary artery disease. J Geriatr Cardiol. (2017) 14:392–400. doi: 10.11909/j.issn.1671-5411.2017.06.008
21. Xu C, Sun L, Dong M, Ullah H, Ullah H, Zhou J, et al. Serum anion gap is associated with risk of all-cause mortality in critically Ill patients with acute myocardial infarction. Int J Gen Med. (2022) 15:223–31. doi: 10.2147/ijgm.S336701
22. Miyachi H, Takagi A, Miyauchi K, Yamasaki M, Tanaka H, Yoshikawa M, et al. Current characteristics and management of ST elevation and non-ST elevation myocardial infarction in the Tokyo metropolitan area: from the Tokyo CCU network registered cohort. Heart Vessels. (2016) 31:1740–51. doi: 10.1007/s00380-015-0791-9
23. Yoneyama K, Ishibashi Y, Koeda Y, Itoh T, Morino Y, Shimohama T, et al. Association between acute myocardial infarction-to-cardiac rupture time and in-hospital mortality risk: a retrospective analysis of multicenter registry data from the cardiovascular research consortium-8 universities (CIRC-8U). Heart Vessels. (2021) 36:782–9. doi: 10.1007/s00380-020-01762-2
24. McNamara RL, Kennedy KF, Cohen DJ, Diercks DB, Moscucci M, Ramee S, et al. Predicting in-hospital mortality in patients with acute myocardial infarction. J Am Coll Cardiol. (2016) 68:626–35. doi: 10.1016/j.jacc.2016.05.049
25. Watanabe N, Takagi K, Tanaka A, Yoshioka N, Morita Y, Yoshida R, et al. Ten-year mortality in patients with ST-elevation myocardial infarction. Am J Cardiol. (2021) 149:9–15. doi: 10.1016/j.amjcard.2021.03.008
26. Wang L, Zhang Z, Hu T. Effectiveness of LODS, OASIS, and SAPS II to predict in-hospital mortality for intensive care patients with ST elevation myocardial infarction. Sci Rep. (2021) 111:23887. doi: 10.1038/s41598-021-03397-3
27. Moralez GM, Rabello L, Lisboa TC, Lima M, Hatum RM, De Marco FV, et al. External validation of SAPS 3 and MPM(0)-III scores in 48,816 patients from 72 Brazilian ICUs. Ann Intensive Care. (2017) 7:53. doi: 10.1186/s13613-017-0276-3
28. Chen Q, Zhang L, Ge S, He W, Zeng M. Prognosis predictive value of the oxford acute severity of illness score for sepsis: a retrospective cohort study. PeerJ. (2019) 7:e7083. doi: 10.7717/peerj.7083
29. Ding L, Sun L, Wang F, Zhu L, Zhang T, Hua F. Clinical significance of platelet volume and other platelet parameters in acute myocardial infarction and stable coronary artery disease. Arq Bras Cardiol. (2019) 112:715–9.
30. Shiyovich A, Gilutz H, Plakht Y. White blood cell subtypes are associated with a greater long-term risk of death after acute myocardial infarction. Tex Heart Inst J. (2017) 44:176–88. doi: 10.14503/thij-16-5768
31. Gibson CM, Pinto DS, Murphy SA, Morrow DA, Hobbach HP, Wiviott SD, et al. Association of creatinine and creatinine clearance on presentation in acute myocardial infarction with subsequent mortality. J Am Coll Cardiol. (2003) 42:1535–43. doi: 10.1016/j.jacc.2003.06.001
32. Soares M, Salluh JI. Validation of the SAPS 3 admission prognostic model in patients with cancer in need of intensive care. Intensive Care Med. (2006) 32:1839–44. doi: 10.1007/s00134-006-0374-4
33. Suistomaa M, Kari A, Ruokonen E, Takala J. Sampling rate causes bias in APACHE II and SAPS II scores. Intensive Care Med. (2000) 26:1773–8. doi: 10.1007/s001340000677
34. Jahn M, Rekowski J, Gerken G, Kribben A, Canbay A, Katsounas A. The predictive performance of SAPS 2 and SAPS 3 in an intermediate care unit for internal medicine at a German university transplant center; a retrospective analysis. PLoS One. (2019) 14:e0222164. doi: 10.1371/journal.pone.0222164
35. Zhu Y, Zhang R, Ye X, Liu H, Wei Wang J. SAPS III is superior to SOFA for predicting 28-day mortality in sepsis patients based on Sepsis 3.0 criteria. Int J Infect Dis. (2022) 114:135–41. doi: 10.1016/j.ijid.2021.11.015
36. Korkmaz Toker M, Gülleroğlu A, Karabay AG, Biçer İG, Demiraran Y. SAPS III or APACHE IV: which score to choose for acute trauma patients in intensive care unit? Ulus. Travma Acil Cerrahi Derg. (2019) 25:247–52. doi: 10.5505/tjtes.2018.22866
37. Alvear-Vega S, Canteros-Gatica J. [Performance evaluation of APACHE II and SAPS III in an intensive care unit]. Rev Salud Publica. (2018) 20:373–7. doi: 10.15446/rsap.V20n3.59952
Keywords: SAPS III, SAPS II, OASIS, LODS, acute myocardial infarction, in-hospital mortality, coronary care unit
Citation: Zheng X, Hu T, Liu T and Wang W (2022) Simplified acute physiology score III is excellent for predicting in-hospital mortality in coronary care unit patients with acute myocardial infarction: A retrospective study. Front. Cardiovasc. Med. 9:989561. doi: 10.3389/fcvm.2022.989561
Received: 08 July 2022; Accepted: 22 November 2022;
Published: 08 December 2022.
Edited by:
Jun Lyu, The First Affiliated Hospital of Jinan University, ChinaReviewed by:
Qipeng Luo, Peking University Third Hospital, ChinaYoufeng Zhu, Guangzhou Red Cross Hospital, China
Zhongheng Zhang, Sir Run Run Shaw Hospital, China
Copyright © 2022 Zheng, Hu, Liu and Wang. This is an open-access article distributed under the terms of the Creative Commons Attribution License (CC BY). The use, distribution or reproduction in other forums is permitted, provided the original author(s) and the copyright owner(s) are credited and that the original publication in this journal is cited, in accordance with accepted academic practice. No use, distribution or reproduction is permitted which does not comply with these terms.
*Correspondence: Wei Wang, d2FuZ3dlaWNxeWJAMTI2LmNvbQ==