 Gert Reiter1,2Gabor Kovacs3,4Clemens Reiter2Albrecht Schmidt5
 Michael Fuchsjäger2
 Horst Olschewski3,4
 Ursula Reiter2*
- 1Research & Development, Siemens Healthcare Diagnostics GmbH, Graz, Austria
- 2Division of General Radiology, Department of Radiology, Medical University of Graz, Austria
- 3Division of Pulmonology, Department of Internal Medicine, Medical University of Graz, Austria
- 4Ludwig Boltzmann Institute for Lung Vascular Research Graz, Austria
- 5Division of Cardiology, Department of Internal Medicine, Medical University of Graz, Austria
Background: Mean pulmonary artery wedge pressure (PAWP) represents a right heart catheter (RHC) surrogate measure for mean left atrial (LA) pressure and is crucial for the clinical classification of pulmonary hypertension (PH). Hypothesizing that PAWP is related to acceleration of blood throughout the LA, we investigated whether an adequately introduced LA acceleration factor derived from magnetic resonance (MR) four-dimensional (4D) flow imaging could provide an estimate of PAWP in patients with known or suspected PH.
Methods: LA 4D flow data of 62 patients with known or suspected PH who underwent RHC and near-term 1.5 T cardiac MR (ClinicalTrials.gov identifier: NCT00575692) were retrospectively analyzed. Early diastolic LA peak outflow velocity (vE) as well as systolic (vS) and early diastolic (vD) LA peak inflow velocities were determined with prototype software to calculate the LA acceleration factor (α) defined as α = vE/[(vS + vD)/2]. Correlation, regression and Bland-Altman analysis were employed to investigate the relationship between α and PAWP, α-based diagnosis of elevated PAWP (>15 mmHg) was analyzed by receiver operating characteristic curve analysis.
Results: α correlated very strongly with PAWP (r = 0.94). Standard deviation of differences between RHC-derived PAWP and PAWP estimated from linear regression model (α = 0.61 + 0.10·PAWP) was 2.0 mmHg. Employing the linear-regression-derived cut-off α = 2.10, the α-based diagnosis of elevated PAWP revealed the area under the curve 0.97 with sensitivity/specificity 93%/92%.
Conclusions: The very close relationship between the LA acceleration factor α and RHC-derived PAWP suggests α as potential non-invasive parameter for the estimation of PAWP and the distinction between pre- and post-capillary PH.
Introduction
Mean pulmonary artery wedge pressure (PAWP) represents a surrogate for mean left atrial (LA) pressure (1, 2), and its assessment by right heart catheterization (RHC) is crucial in the clinical classification of pulmonary hypertension (PH). A cut-off value of PAWP = 15 mmHg is employed to differentiate between pre- and post-capillary PH. In addition, the difference between the mean pulmonary arterial pressure (mPAP) and PAWP defines the transpulmonary pressure gradient, which enters in the calculation of pulmonary vascular resistance (3, 4). While magnetic resonance (MR) four-dimensional (4D) flow imaging has been shown to allow for an accurate estimation of elevated mPAP and the diagnosis of PH from the duration of vortical blood flow along the pulmonary artery (5, 6), a non-invasive 4D flow-based correlate to PAWP is lacking.
If there is one, then a flow-based correlate for PAWP is likely to be encoded in LA blood flow patterns. MR 4D flow imaging of the LA has mainly been employed to study vortical blood flow and stasis within the LA (7–9). The LA pressure represents both the driving force of transmitral outflow from the LA and the decelerating force for pulmonary venous inflow into the LA. Consequently, it might be expected that higher mean LA pressure or PAWP could be related to lower LA inflow velocities and higher LA outflow velocities or—summarizing both effects—to a higher “acceleration” of blood from LA inflow to outflow.
We therefore hypothesized that PAWP should correlate closely with a LA acceleration factor—defined as an adequate ratio of 4D flow-derived LA peak outflow to peak inflow velocities. The purpose of the present study was to investigate the relationship between the LA acceleration factor and PAWP in patients with known or suspected PH.
Materials and methods
Study population
Between June 2006 and May 2014 240 patients with known or suspected PH, aged above 18 years and without known MR contraindications were recruited for near-term cardiac MR and 4D flow imaging after successful RHC. This prospective study (ClinicalTrials.gov identifier, NCT00575692) complied with the Declaration of Helsinki, was approved by the local ethical review board and all subjects gave written informed consent. 4D flow in the right ventricular outflow tract of the subjects was explored previously (5, 6, 10, 11). In the current study we retrospectively analyzed data from those 70 patients where LA 4D flow containing the orifices of the right and left inferior pulmonary veins as well as the mitral valve was acquired. To minimize the probability of relevant changes in disease state, eight patients for whom a delay of one month or more occurred between RHC and MR imaging were excluded from analysis. Mean delay between RHC and MR imaging for the remaining 62 patients was 7 ± 10 days; the median delay was one day. No changes in drug treatment occurred between RHC and MR imaging.
Right heart catheterization
RHC was performed during free breathing in the supine position with a 7F quadruple-lumen, balloon-tipped, flow-directed Swan-Ganz catheter (Baxter Healthcare Corporation, Irvine, CA, USA) using the transjugular approach. Zero reference level was set to anterior axillary line. All intrathoracic pressures—including PAWP—were averaged over 3–4 respiratory cycles during normal respiration. No triggering on any respirator or cardiac waves was employed (4, 12). RHC parameters obtained included mPAP, systolic and diastolic pulmonary arterial pressure (sPAP and dPAP, respectively), PAWP, TPG and PVR with the cardiac output measured by thermodilution. Moreover, systolic and diastolic systemic blood pressure (sBP and dBP, respectively) were measured by sphygmomanometer. Following the current guidelines (4) thresholds of mPAP ≥ 25 mmHg and of PAWP > 15 mmHg were employed to diagnose PH and post-capillary PH, respectively.
MR imaging
Electrocardiographically (ECG)-gated cardiac MR imaging, including functional imaging and 4D flow imaging of the left atrium, was performed on a 1.5 T MR scanner (MAGNETOM Sonata, Siemens Healthcare, Erlangen, Germany) using a 6-channel cardiac-array coil together with a spine array coil. Subjects were investigated in the supine position.
For functional assessment, retrospectively ECG-gated, balanced steady state free precession (bSSFP) cine series were obtained in 2-chamber and 4-chamber views as well as in contiguous gapless short-axis slices covering the ventricles. Imaging parameters were as follows: temporal resolution, 32–41 ms in long-axis and 48–54 ms in short-axis view; interpolated cardiac phases, 30; echo time, 1.2 ms; flip angle, 60°; bandwidth, 930 Hz/pixel; voxel size, 1.7–1.9 × 1.4 × 6.0 mm3 in long-axis and 2.2 × 1.4 × 8.0 mm3 in short-axis view; imaging time per slice, 12–15 heart beats in long-axis and 6–8 heart beats in short-axis view.
4D flow imaging data were acquired employing a retrospectively ECG-gated, segmented, two-dimensional (2D) spoiled gradient-echo-based cine phase-contrast sequence with three-directional velocity encoding by a simple four-point velocity encoding scheme. The LA was covered by gapless slices in 4-chamber orientation containing the orifices of the right and left inferior pulmonary veins as well as the mitral valve. Velocity encoding (VENC) was set to 90 cm/s in all directions and was adapted—if necessary—to prevent aliasing in regions close to the mitral valve. Further protocol parameters were as follows: temporal resolution, 89 ms; interpolated cardiac phases, 20; echo time, 4.1 ms; flip angle, 15°; bandwidth, 455 Hz/pixel; GRAPPA (generalized auto-calibrating partially parallel acquisition) factor, 2; voxel size, 2.4 × 1.8 × 6.0 mm3; imaging time per slice, 22–24 heart beats.
Functional and 4D flow imaging were performed during multiple breath holding. For patients who were unable to hold their breath, three-fold averaging was used to suppress breathing artifacts.
MR image analysis
Quantification of left ventricular (LV) and right ventricular (RV) end-diastolic volume (EDV), end-systolic volume (ESV), ejection fraction (EF), stroke volume (SV) and muscle mass (MM) was performed with standard software (Argus, Siemens Healthcare, Erlangen, Germany) by manual segmentation of myocardial end-diastolic and end-systolic epicardial and endocardial borders in the stack of bSSFP short-axis images including papillary muscles and trabeculae to the myocardium. Cardiac output (CO) was calculated from SV multiplied by the average heart rate during the short-axis scans. Additionally to ventricular volumetry, maximal LA volume (LAVmax) was calculated from cine bSSFP 2-chamber and 4-chamber images employing the bi-planar area-length method (13). All non-relative volumetric cardiac parameters were normalized to body surface area (BSA) which is indicated with “I.”
Time courses of maximal 3-dimensional (3D) velocities across the time-varying planes of the atrio-ventricular junction and the atrial junctions of the left and right inferior pulmonary veins were determined from 4D flow data employing dedicated prototype software (4D Flow, Siemens Healthcare, Erlangen, Germany). Early diastolic (vE) and late diastolic (vA) LA peak outflow velocities were defined as early and late diastolic peaks of the transmitral maximal velocity-time curve; systolic (vS) and diastolic (vD) LA peak inflow velocities were defined as systolic and early diastolic peaks of the left or right pulmonary venous maximal velocity-time curve, whichever exhibited higher velocities (Figure 1). The LA acceleration factor (α) was defined as the following ratio of a specific linear combination of vE and vA to a specific linear combination of vS and vD:
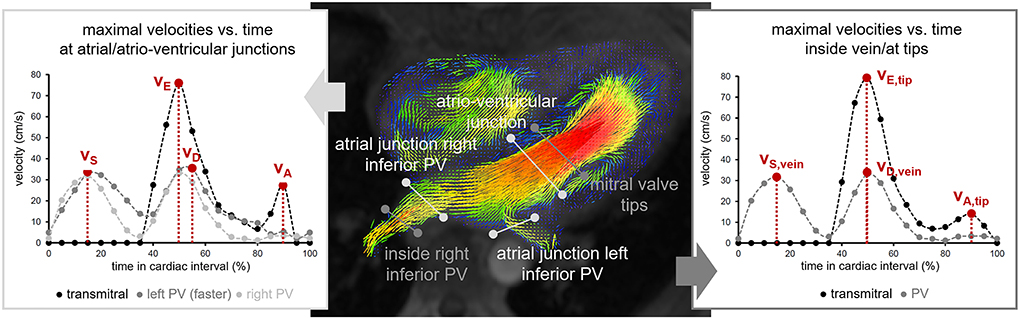
Figure 1. Illustration of the determination of LA peak in- and outflow velocities. Measurement cut planes are indicated on an early diastolic magnitude image with color-encoded vector plot of the three-dimensional velocity field. PV pulmonary vein; vS, systolic LA peak inflow velocity; vD, diastolic LA peak inflow velocity; vE, early diastolic LA peak outflow velocity; vA, late diastolic LA peak outflow velocity; vS, vein, systolic peak velocity determined in the pulmonary vein; vD, vein, diastolic peak velocity determined in the pulmonary vein; vE, tip, early diastolic peak velocity determined at the level of the mitral valve tips; vA, tip, late diastolic peak velocity determined at the level of the mitral valve tips.
To evaluate the impact of the location of velocity measurements on α, peak LA in- and outflow velocities were additionally determined from spatially fixed planes at the level of the mitral valve tips in early diastole and in the pulmonary vein with the fastest velocity 1–2 cm from the orifices (Figure 1). Maximum velocities are denoted by vE, tip, vA, tip, vS, vein and vD, vein, the corresponding LA acceleration factors by αtip, αvein and αtip/vein, respectively.
Statistical analysis
Statistical analysis was performed using NCSS software (NCSS 11 Statistical Software (2016). NCSS, LLC. Kaysville, Utah, USA) employing a significance level of 0.05 for statistical tests. Mean values are given together with standard deviations and diagnostic measures are specified together with 95%-confidence intervals. The nomenclature 0.3–0.5 = weak, 0.5–0.7 = moderate, 0.7–0.9 = strong, and 0.9–1.0 = very strong is employed for classifying the strength of a correlation by the Pearson's correlation coefficient (r).
Demographic, RHC hemodynamic, volumetric cardiac and in- and outflow peak velocity parameters in the non-PH, the pre-capillary and the post-capillary PH groups were compared by one-way analysis of variance (ANOVA) and Tukey-Kramer multiple comparison procedure. Relationships between these parameters were investigated by means of correlation and linear regression analysis. The dependency of slopes and intercepts of the linear regression models on binary variables was analyzed by adding them (with and without interaction) separately to the respective linear regression model and performing partial F-tests. Similarly, bilinear regressions on PAWP and continuous demographic, RHC hemodynamic as well as volumetric cardiac parameters were introduced and analyzed by partial F-tests to determine if the latter parameters could explain a significant amount of residual variation in the corresponding linear regression model on PAWP.
Non-linear regression of PAWP on vE, vA, vS and vD was employed to motivate the definition of the LA acceleration factor α as linear correlate to PAWP among all general ratios (αgeneral) of linear combinations of LA peak outflow velocities to linear combinations of LA peak inflow velocities: Up to a multiplicative constant such a general ratio can be written as
where cout and cin are constants and where vE+A, vE−A, vS+D, and vS−D represent short notations for (vE + vA)/2, (vE – vA)/2, (vS + vD)/2, and (vS – vD)/2, respectively. A specific choice of αgeneral was interpreted as optimal if the choices for cout and cin were contained within the large sample 95%-confidence intervals of the non-linear regression of PAWP on vE, vA, vS and vD.
The linear regression equation of α on PAWP was inverted to derive calculated mean pulmonary arterial wedge pressure values PAWPcalc from α and to compare PAWPcalc and PAWP by Bland-Altman analysis. The diagnostic performance of α in predicting PAWP > 15 mmHg was investigated by means of receiver operating characteristic curve (ROC) analysis.
One-sample t-test was employed to test if differences of quantities from velocity measurements at different locations differed from zero. Pearson correlation coefficients between PAWP and LA acceleration factors derived from velocity measurements at different locations were compared by means of Williams-Hotelling test.
Results
PH was diagnosed in 34 of the analyzed 62 patients; nine patients demonstrated mPAP between 21 and 24 mmHg, one of them with PAWP > 15 mmHg. Nineteen patients had normal mPAP <21 mmHg. Thirteen PH patients with PAWP > 15 mmHg were classified as having post-capillary PH. The remaining 21 pre-capillary PH patients suffered from pulmonary arterial hypertension (n = 15), PH due to lung diseases (n = 2), chronic thromboembolic PH (n = 2) and PH with unclear multifactorial mechanisms (n = 2). Demographic, RHC-derived hemodynamic and volumetric cardiac parameters of the study population derived from RHC are summarized in Table 1. Among all volumetric parameters LAVImax demonstrated the strongest correlation to PAWP (r = 0.49). After omission of one severe outlier in the pre-capillary PH group the correlation increased to r = 0.60; the significance of differences in LAVImax between non-PH, pre-capillary PH and post-capillary PH subjects remained unaltered.
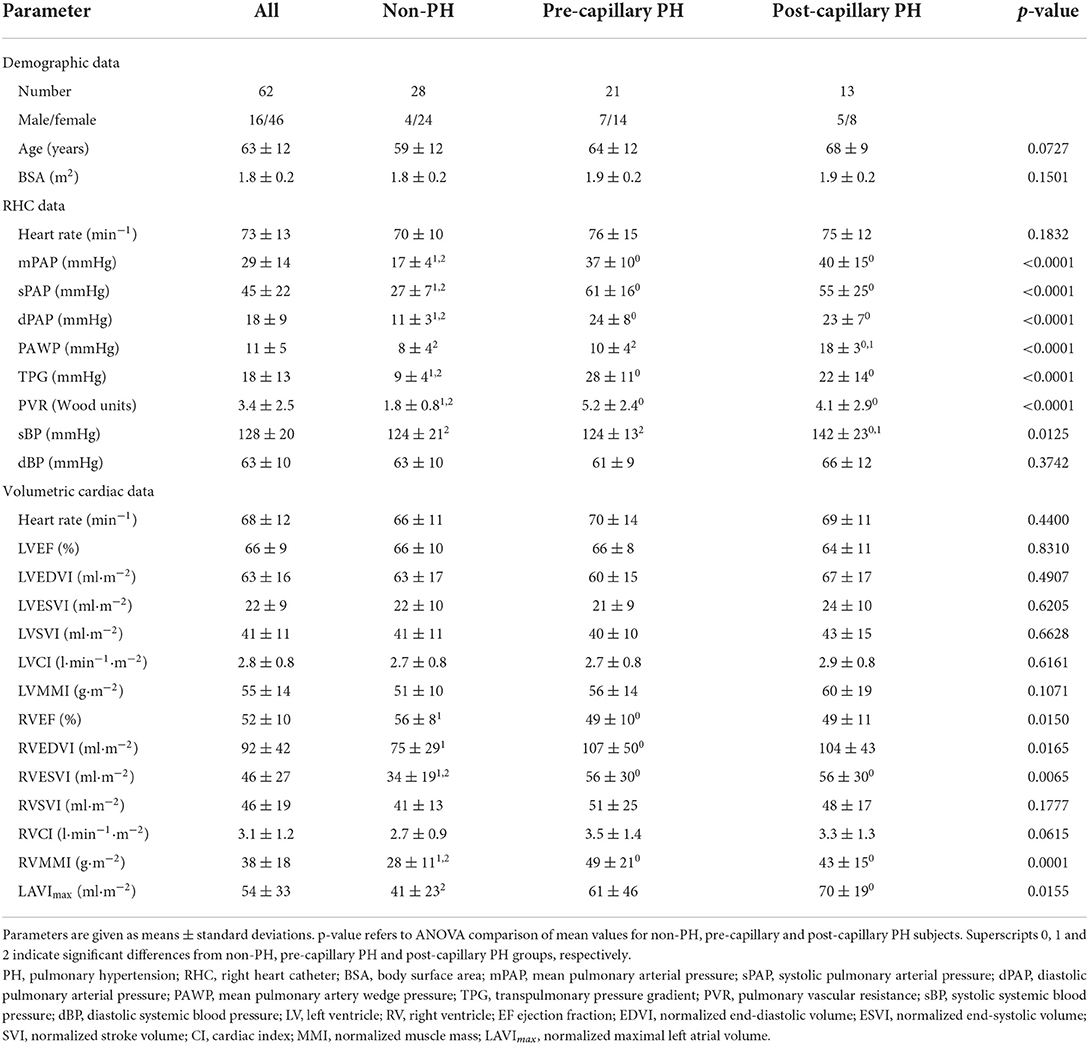
Table 1. Demographic, RHC-derived hemodynamic and volumetric cardiac data of the study population.
LA peak in- and outflow velocities
LA peak inflow velocities were determined from the left inferior pulmonary vein's inflow in 25 subjects and from the right inferior pulmonary vein's inflow in 37 subjects. vA could not be specified in six of the 62 patients because a biphasic transmitral outflow profile was lacking. Mean LA peak in- and outflow velocities in non-PH, pre-capillary PH and post-capillary PH subjects are summarized in Table 2. All LA peak in- and outflow velocities correlated significantly with each other except vS with vE and vD with vA (r = 0.38, 0.58, 0.39, and 0.40 for the correlations of vS with vD, vS with vA, vD with vE and vE with vA, respectively).
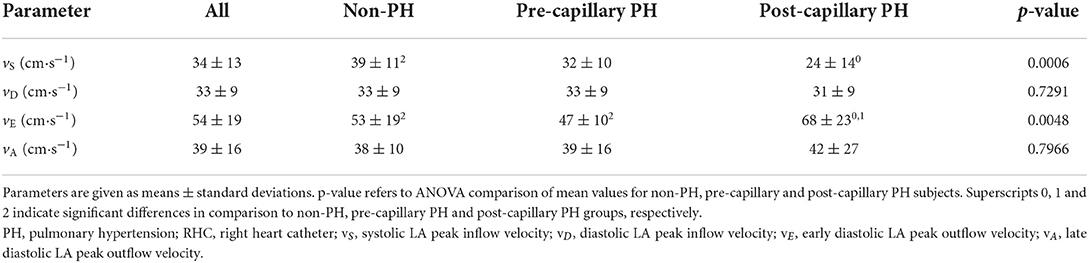
Table 2. LA peak in- and outflow velocities.
vS correlated moderately negatively (r = −0.57) and vE moderately positively (r = 0.59) with PAWP, whereas vD and vA did not show significant correlations with PAWP. The linear regression results of LA peak in- and outflow velocities are shown in Figure 2. Additionally, all LA peak in- and outflow velocities exhibited weak to moderate, but significant univariate correlations with demographic, RHC hemodynamic and volumetric cardiac parameters, which are specified in Table 3. Notably, none of the RHC parameters remained a significant predictor of vS when added to PAWP.
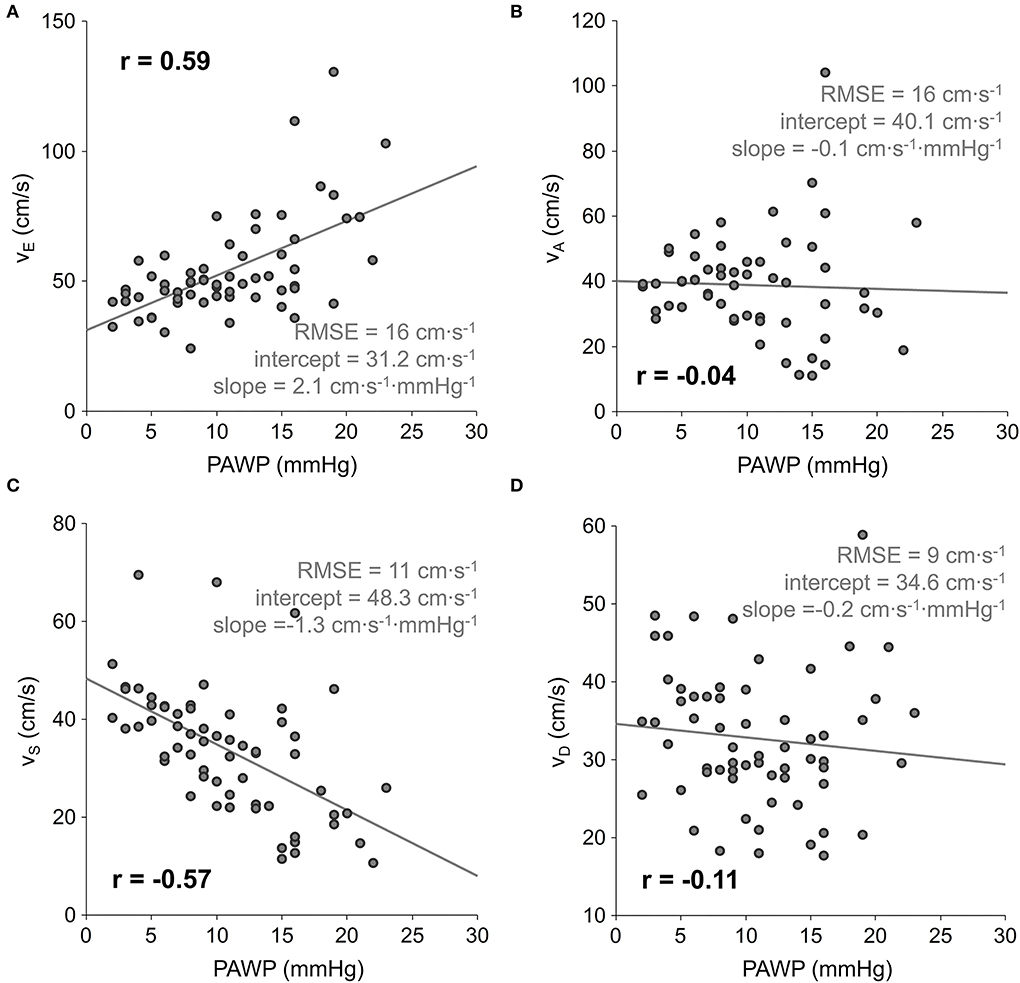
Figure 2. Scatter plots and linear regressions of early diastolic LA peak outflow vE (A), late diastolic LA peak outflow vD (B), systolic LA peak inflow vS (C), and early diastolic LA peak inflow vD (D) velocity on PAWP. PAWP, mean pulmonary artery wedge pressure; r, correlation coefficient; RMSE, root-mean-square error.
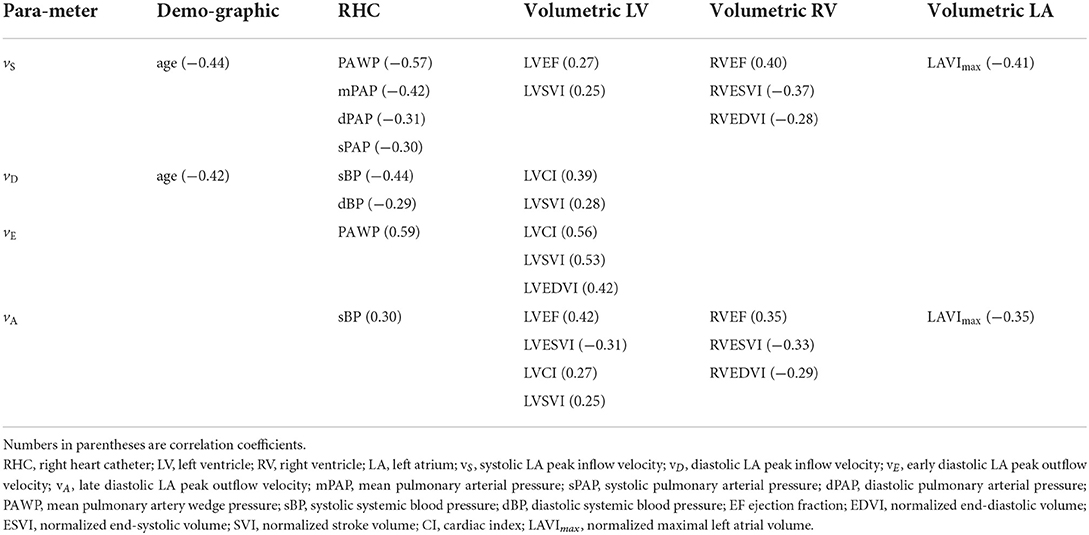
Table 3. Significant correlations of LA peak in- and outflow velocities with demographic, RHC-derived hemodynamic and MR-derived volumetric cardiac parameters.
Modeling of the LA acceleration factor
Assuming a linear relationship between PAWP and αgeneral, regression of PAWP on vE, vA, vS and vD for all patients with biphasic transmitral flow profile (n = 56) resulted in a non-linear correlation coefficient r = 0.94 and 95%-confidence intervals 0.53–1.14 and −0.06 to 0.33 for the constants cout and cin, respectively. Fixing cout = 1 and performing regression of PAWP on vE, vS and vD for all patients resulted in r = 0.94 and the 95%-confidence interval −0.05 to 0.26 for cin. Consequently, cout = 1 and cin = 0 or, equivalently, omission of vA- and vS−D-terms in α were optimal when searching for a linear correlate to PAWP. Notably cin = 1 (simplifying αgeneral to vE/vS) was not in the derived 95%-confidence intervals, although vE/vS correlated strongly with PAWP (r = 0.85).
Relationship between LA acceleration factor and PAWP
Mean α for all patients was 1.69 ± 0.57. While mean α for patients without PH (1.46 ± 0.42) and for patients with pre-capillary PH (1.51 ± 0.40) did not differ significantly, both differed significantly from mean α in the post-capillary PH group (2.45 ± 0.41, p < 0.0001).
α correlated very strongly with PAWP (r = 0.94), even when restricted to the non-PH (r = 0.90), the pre-capillary PH (r = 0.91) and the post-capillary PH (r = 0.80) groups. The linear regression equation α = 0.61 + 0.10·PAWP (PAWP in mmHg) is shown in Figure 3A; the difference between r2 and prediction sum of squares (PRESS) R2 was small (0.01). Inversion of the linear regression equation to calculate PAWP from α (PAWPcalc = −6.2 + 10.1·α, with PAWPcalc in mmHg) resulted in a standard deviation of differences of SD = 2.0 mmHg between PAWP and PAWPcalc; the corresponding Bland-Altman plot is presented in Figure 3B.
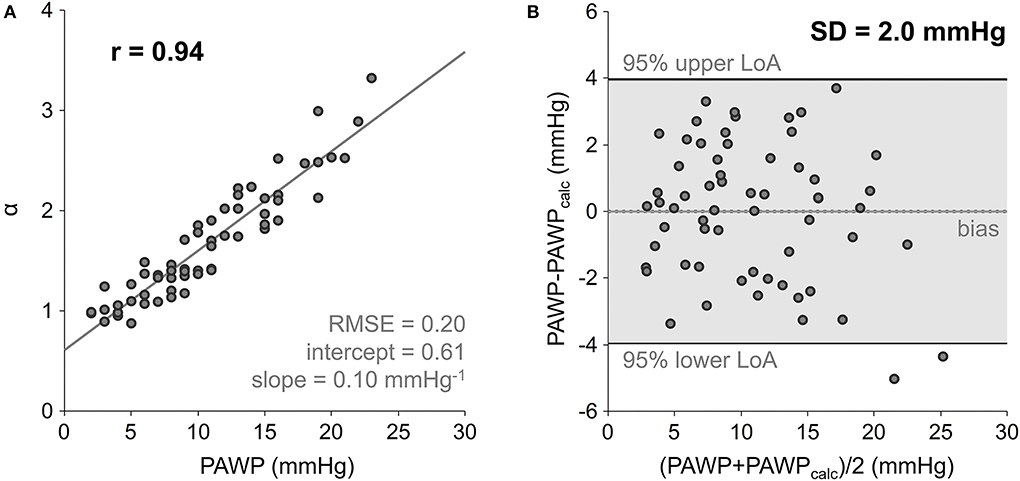
Figure 3. Scatter plot and linear regression of LA acceleration factor α on PAWP (A), and Bland-Altman plot comparing RHC-derived PAWP and PAWPcalc calculated from inverted linear regression equation (B). PAWP, mean pulmonary artery wedge pressure; RMSE, root-mean-square error; LoA, limits of agreement; SD, standard deviation of differences.
Neither intercept nor slope of the linear regression of α on PAWP depended significantly on gender, the presence of PH, or the evaluated pulmonary vein. Moreover, none of the continuous demographic, RHC and volumetric cardiac parameters assessed was a significant predictor of α additional to PAWP.
Diagnosis of PAWP > 15 mmHg
The area under the ROC curve (AUC) for the prediction of PAWP > 15 mmHg employing α was 0.97 with a 95%-confidence interval of 0.90–0.99 (Figure 4). The cut-off value α = 2.10 derived from the regression equation for PAWP = 15 mmHg coincided with the cut-off value maximizing the sum of sensitivity and specificity; the corresponding sensitivity and specificity were 93 and 92%, with 95%-confidence intervals of 66–100 and 80–98%, respectively.
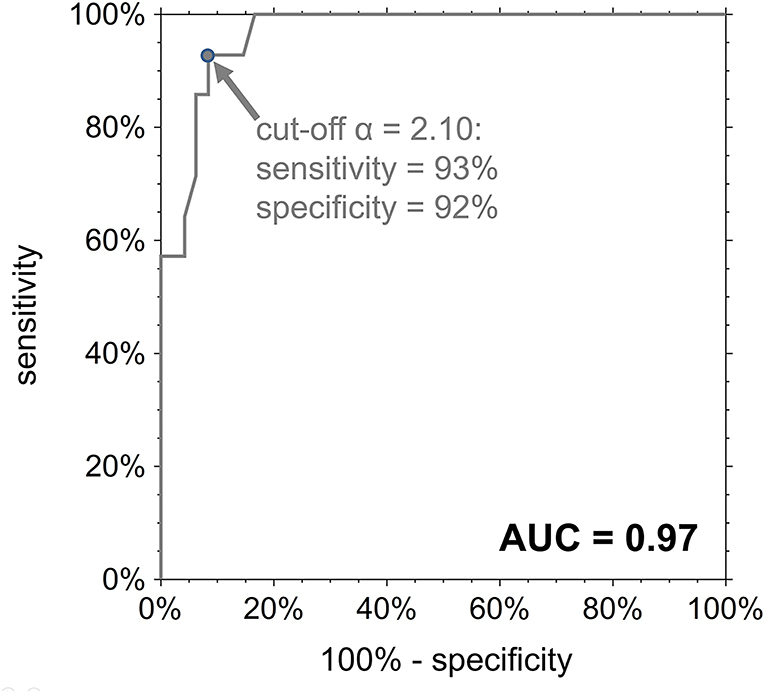
Figure 4. ROC curve for the diagnosis of PAWP > 15 mmHg employing the LA acceleration factor α. AUC, area under the ROC curve.
The AUC for the diagnosis of post-capillary PH in PH patients was 0.95 with the 95%-confidence interval 0.83–0.99. Sensitivity and specificity for the cut-off value α = 2.10 were 92 and 86%, with 95%-confidence intervals of 64–100 and 64–97%, respectively, whereas the sum of sensitivity and specificity was maximized for the cut-off value α = 1.90 with sensitivity and specificity of 100 and 86% (95%-confidence intervals 75–100 and 64–97%), respectively.
Locations of velocity measurements
Table 4 summarizes the results for LA peak in- and outflow velocities as well as derived acceleration factors determined from measurement planes at the level of mitral valve tips and in the pulmonary veins. The early diastolic transmitral peak velocity vE, tip was the only velocity exhibiting a significant bias to vE. vD, vein correlated, however, only weakly with vD. In contrast to measurements at the atrial junction, the means of vD, vein in the non-PH (30 ± 8 cm·s−1), the pre-capillary PH (37 ± 8 cm·s−1) and the post-capillary PH (40 ± 12 cm·s−1) groups differed significantly between non-PH and PH subjects (p = 0.0026). Moreover, vD, vein correlated significantly with sPAP (r = 0.44), mPAP (r = 0.33), dPAP (r = 0.31), PVR (r = 0.31), and TPG (r = 0.27).
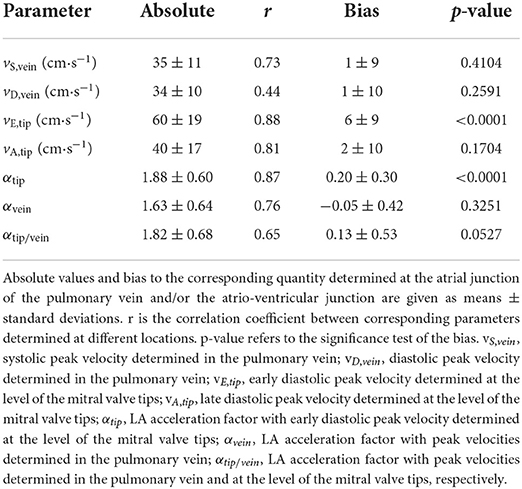
Table 4. Peak velocities in the pulmonary vein and at the level of mitral valve tips and the corresponding LA acceleration factors.
Linear regressions of αtip, αvein and αtip/vein on PAWP are shown in Figure 5. Compared to the correlation between PAWP and α, all correlations between PAWP and LA acceleration factors derived from peak velocity measurements at the mitral valve tips and in the pulmonary veins were significantly weaker (r = 0.85, p = 0.0004 for the correlation between PAWP and αtip, r = 0.69, p < 0.0001 for the correlation between PAWP and αvein, and r = 0.61, p < 0.0001 for the correlation between PAWP and αtip/vein). Notably, intercepts of the linear regression lines of αvein and αtip/vein on PAWP depended significantly on the presence of PH (p = 0.6844, 0.0012, and 0.0094 for the linear regressions of αtip, αvein and αtip/vein on PAWP, respectively).
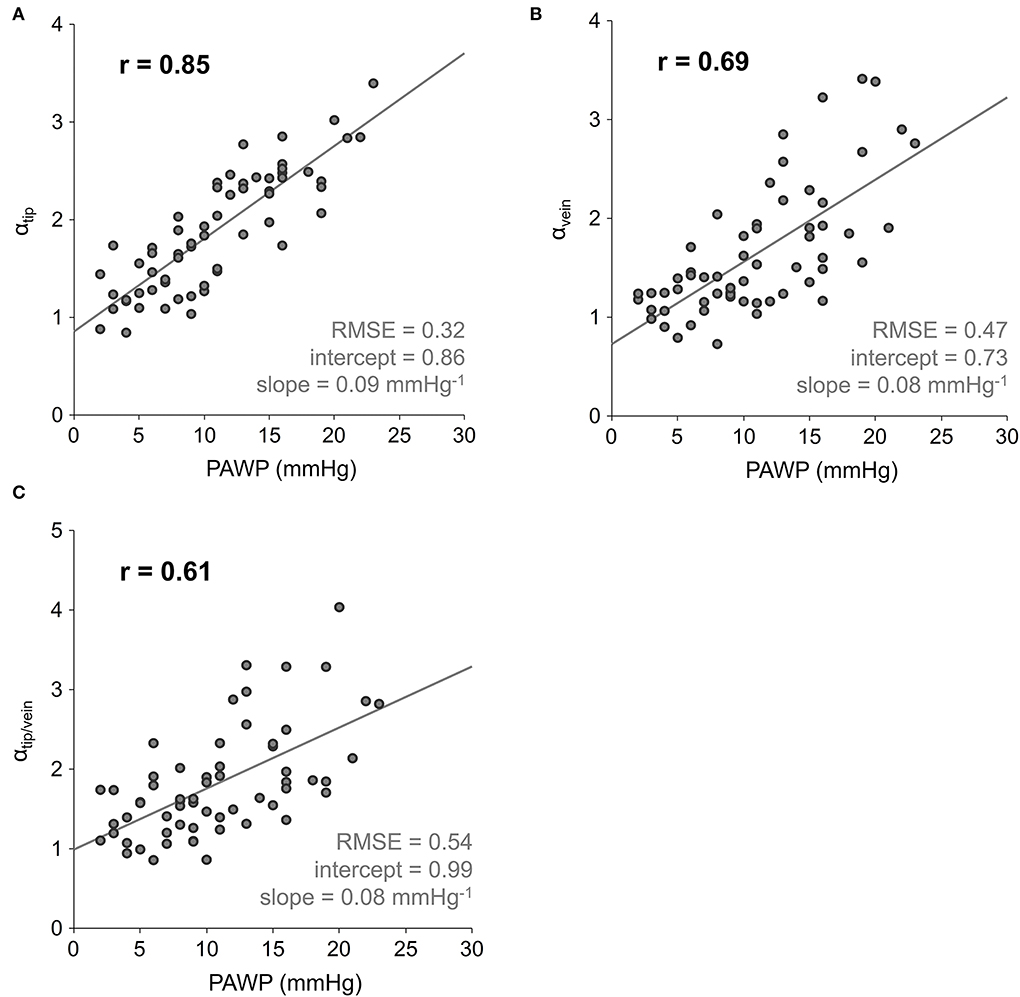
Figure 5. Scatter plots and linear regressions of the LA acceleration factors on PAWP, with LA acceleration factors calculated from peak velocity measurements at the level of mitral valve tips αtip (A), within the pulmonary vein αvein (B), and both αtip/vein (C). PAWP, mean pulmonary artery wedge pressure; r, correlation coefficient; RMSE, root-mean-square error.
Discussion
The main results of the study were that the LA acceleration factor α (1) represented an optimal linear correlate to PAWP among all ratios of linear combination of vE and vA to linear combinations of vS and vD, (2) correlated very strongly with PAWP, (3) allowed an accurate prediction of PAWP > 15 mmHg, and (4) depended significantly on the location of measurement of vE, vS and vD.
The LA acceleration factor
Dependencies of 4D flow-derived LA peak in- and outflow velocities on PAWP, specifically an increase of vE, a decrease of vS and non-significant changes of vA and vD with PAWP, are in line with the common interpretation of mean LA pressure as a major determinant of pulmonary venous and early diastolic transmitral blood flow velocities (14–16). A similar relationship of echocardiographically determined transmitral peak velocities to PAWP was found previously in populations including both, pre- and post-capillary PH patients (17–20). The dependency of pulmonary venous peak inflow velocities on PAWP rather than on TPG, which was similarly shown in an animal model study (21), justifies our hypothesis that the LA acceleration factor would correlate with PAWP.
Given the dependencies of LA peak in- and outflow velocities on PAWP and the observed independence of vS and vE, one might have expected the LA acceleration factor correlating with PAWP to be of the form vE/vS. Regression of PAWP on vE, vA, vS and vD suggested, however, that α takes the form vE/vS+D with vS+D being the average of vS and vD. This functional form of α did not particularly depend on PH and its pre- or post-capillary nature, because α and PAWP correlated very strongly, even when restricted to the non-PH, the pre-capillary PH or the post-capillary PH groups with their smaller PAWP ranges.
Two arguments that are not mutually exclusive support the appearance of vD in the definition of α: First, maximal early diastolic transmitral blood flow velocity depends on left ventricular relaxation rate (14–16). In a close correlate between PAWP and an expression containing vE, this dependency should be corrected. vD correlated significantly with vE, and the early diastolic pulmonary venous peak velocity tends to share dependencies with early diastolic transmitral blood velocity (14–16). Therefore, vD in α might be interpreted as a correction term for left ventricular relaxation. Second, velocities and kinetic energy of blood within the LA in early diastole should not only depend on systolic inflow characterized by vS but should increase and decrease with the early diastolic pulmonary venous inflow characterized by vD. Higher or lower kinetic energy and velocities in the LA in early diastole imply smaller or higher LA pressures necessary to accelerate the blood to a specific transmitral peak velocity vE, such that the appearance of vD in α might be interpreted as “input velocity correction” from which acceleration by LA pressure or PAWP occurs.
The relationship between LA acceleration factor and PAWP
The very strong correlation between α and PAWP suggests that α can be employed to estimate PAWP from 4D flow measurements. Inverting the linear regression equation of α on PAWP, the standard deviation of errors between non-invasively estimated and RHC-derived PAWP was substantially smaller than standard deviations found when employing either the quotient of early diastolic transmitral peak blood flow velocity to mitral annular peak tissue velocity (22–24) or LA volume and strain parameters (25, 26) for estimation of PAWP in PH. Notably, the correlation between LAVImax and PAWP in the present study population was similar to the one previously found by Swift et al. (25).
The accuracy of α for discriminating between subjects with PAWP > 15 mmHg and PAWP ≤ 15 mmHg exceeded accuracies of previously studied single-parametric models (17–20, 22, 23, 25–29) and multi-parametric models (19, 20, 30, 31).
As expected by known direct or indirect relationships of forward peak velocities of pulmonary venous and transmitral flow profiles on age, systemic blood pressure, LV, RV and LA volumes, and on LV as well as RV systolic performance (14–16, 32), vE, vA, vS and vD demonstrated various weak to moderate univariate associations with these parameters in the present study population. The linear regression equation of α on PAWP, however, exhibited neither significant dependency on any of these demographic or cardiac volumetric parameters nor on any RHC-derived parameters apart from PAWP. This fact, together with the high PRESS R2, suggest an adequate generalizability of the predictive results for the functional relationship between α and PAWP in PH patients (33, 34).
Locations of velocity measurements
While it is canonical to determine maximal 3D LA in- and outflow velocities at the atrial junctions of the pulmonary veins and atrio-ventricular junction with MR 4D flow data, MR 2D phase contrast (35) or echocardiography (16) derived transmitral and pulmonary venous flow profiles are typically assessed at the level of mitral valve tips and 1–2 cm in the pulmonary veins, respectively. Employing 3D peak velocities measured at these locations worsened the correlations of LA acceleration factors with PAWP. This result might be immediately understood as reflecting the fact that peak velocities in the pulmonary veins and at the level of the mitral valve tips contain dependencies on geometrical factors such as the mitral valve's opening area or the pulmonary vein's cross section and curvature (14, 36), which are not directly related to mean LA pressure or PAWP. Moreover, the presence of PH explained a significant part of the variability of the linear relationship between PAWP and αvein or αtip/vein, which might be attributed to the fact that early diastolic peak blood flow velocity in the pulmonary veins depended on pulmonary artery pressures.
Limitations
Some limitations of the current study need to be acknowledged. Although the delay between RHC and MR imaging was small, measurements were not acquired simultaneously. Typical differences between measured PAWP and PAWP estimated from MR imaging should amount to at least 9% (37), but it seems legitimate to assume that the delay only contributes to worsening of correlations. Additionally, different procedures for invasive PAWP measurement (38, 39) might alter its relationship with α.
Linear regression of LA acceleration factor on PAWP as well as Bland-Altman plot comparing RHC-derived PAWP and calculated PAWP were derived from the whole study population, because PRESS statistics rather than data splitting was employed for cross-validation.
The assumption of a linear relationship between LA acceleration factor and PAWP was well fulfilled within the relatively small range of PAWP values of the patients in our study. While a larger PAWP range might have increased the correlation, deviations from linearity might occur in populations with very high PAWP values.
Finally, the time resolution and slice thickness of the phase-contrast sequence used, as well as the coverage of the LA, were optimized for total imaging time. The limited spatiotemporal resolution might have caused underestimation of the true peak velocities. Because LA in- and outflow waves do not change rapidly with time and peak velocities compared well with those in studies employing 4D flow technique with higher spatial and/or temporal resolution (8, 9, 13, 40), one could expect the impact of resolution to be moderate, especially for the estimation of α as a quotient of velocities. The incomplete coverage of the LA and all entering pulmonary veins did not pose a direct limitation to the results. However, neither the inflow via the upper pulmonary veins nor the propagation of maximal velocities inside the LA could be investigated adequately in the studied population.
Conclusions
The LA acceleration factor α was introduced as the 4D flow-derived ratio of early diastolic LA peak outflow velocity at the atrio-ventricular junction to the average of systolic and early diastolic LA peak inflow velocities at the atrial junctions of the pulmonary veins. The very close relationship between α and RHC-derived PAWP suggests α as potential non-invasive parameter for the estimation of PAWP and the distinction between pre- and post-capillary PH patients.
Data availability statement
The datasets used and analyzed during the current study are available from the corresponding author on reasonable request.
Ethics statement
The study was approved by the local ethical review board and all subjects gave written informed consent.
Author contributions
GR: study design, data acquisition, statistical analysis, manuscript preparation, and editing. GK: study design, data acquisition, and manuscript editing. CR: study design, data analysis, and manuscript editing. AS, MF, and HO: study design and manuscript editing. UR: study design, data acquisition and analysis, manuscript preparation, and editing. All authors read and approved the final manuscript.
Funding
This work was supported by the funds of the Oesterreichische Nationalbank, Anniversary Fund (Grant Number 15702).
Acknowledgments
The authors thank Ada Muellner, MS for editing the manuscript.
Conflict of interest
Author GR is an employee of Siemens Healthcare Diagnostics GmbH.
The remaining authors declare that the research was conducted in the absence of any commercial or financial relationships that could be construed as a potential conflict of interest.
Publisher's note
All claims expressed in this article are solely those of the authors and do not necessarily represent those of their affiliated organizations, or those of the publisher, the editors and the reviewers. Any product that may be evaluated in this article, or claim that may be made by its manufacturer, is not guaranteed or endorsed by the publisher.
Abbreviations
2D, two-dimensional; 3D, three-dimensional; 4D, four-dimensional; ANOVA, analysis of variance; AUC, area under the receiver operating characteristic curve; α, left atrial acceleration factor; BSA, body surface area; bSSFP, balanced steady state free precession; CI, cardiac index; dBP, diastolic systemic blood pressure; dPAP, diastolic pulmonary arterial pressure; ECG, electrocardiogram; EDVI, normalized end-diastolic volume; EF, ejection fraction; ESVI, normalized end-systolic volume; LA, left atrium; LAVImax, maximal left atrial volume normalized to body surface area; LoA, limits of agreement; LV, left ventricle; MMI, normalized muscle mass; mPAP, mean pulmonary arterial pressure; MR, magnetic resonance; PAWP, mean pulmonary artery wedge pressure; PH, pulmonary hypertension; PV, pulmonary vein; PVR, pulmonary vascular resistance; PRESS, prediction sum of squares; r, Pearson's correlation coefficient; R, multiple non-linear correlation coefficient; RHC, right heart catheter; RMSE, root-mean-square error; ROC, receiver operating characteristic; RV, right ventricle; sBP, systolic systemic blood pressure; SD, standard deviation of differences; sPAP, systolic pulmonary arterial pressure; SVI, normalized stroke volume; TPG, transpulmonary pressure gradient; vA, late diastolic left atrial peak outflow velocity; vD, diastolic left atrial peak inflow velocity; vE, early diastolic left atrial peak outflow velocity; vS, systolic left atrial peak inflow velocity.
References
1. Walston A, Kendall ME. Comparison of pulmonary wedge and left atrial pressure in man. Am Heart J. (1973) 86:159–64. doi: 10.1016/0002-8703(73)90239-1
2. Chaliki HP, Hurrell DG, Nishimura RA, Reinke RA, Appleton CP. Pulmonary venous pressure: relationship to pulmonary artery, pulmonary wedge, and left atrial pressure in normal, lightly sedated dogs. Catheter Cardiovasc Interv. (2002) 56:432–8. doi: 10.1002/ccd.10203
3. Chemla D, Castelain V, Hervé P, Lecarpentier Y, Brimioulle S. Haemodynamic evaluation of pulmonary hypertension. Eur Respir J. (2002) 20:1314–31. doi: 10.1183/09031936.02.00068002
4. Galiè N, Humbert M, Vachiery J-L, Gibbs S, Lang I, Torbicki A, et al. (2016). 2015 ESC/ERS guidelines for the diagnosis and treatment of pulmonary hypertension: the joint task force for the diagnosis and treatment of pulmonary hypertension of the European Society of Cardiology (ESC) and the European Respiratory Society (ERS) endorsed by: Association for European Paediatric and Congenital Cardiology (AEPC), International Society for Heart and Lung Transplantation (ISHLT). Eur Heart J. 37, 67–119. doi: 10.1093/eurheartj/ehv317
5. Reiter G, Reiter U, Kovacs G, Kainz B, Schmidt K, Maier R, et al. Magnetic resonance–derived 3-dimensional blood flow patterns in the main pulmonary artery as a marker of pulmonary hypertension and a measure of elevated mean pulmonary arterial pressure. Circ Cardiovasc Imaging. (2008) 1:23–30. doi: 10.1161/CIRCIMAGING.108.780247
6. Reiter G, Reiter U, Kovacs G, Olschewski H, Fuchsjäger M. Blood flow vortices along the main pulmonary artery measured with MR imaging for diagnosis of pulmonary hypertension. Radiology. (2015) 275:71–9. doi: 10.1148/radiol.14140849
7. Fyrenius A, Wigström L, Ebbers T, Karlsson M, Engvall J, Bolger AF, et al. Three dimensional flow in the human left atrium. Heart. (2001) 86:448–55. doi: 10.1136/heart.86.4.448
8. Suwa K, Saitoh T, Takehara Y, Sano M, Nobuhara M, Saotome M, et al. Characteristics of Intra-left atrial flow dynamics and factors affecting formation of the vortex flow – analysis with phase-resolved 3-dimensional cine phase contrast magnetic resonance imaging. Circ J. (2015) 79:144–52. doi: 10.1253/circj.CJ-14-0562
9. Markl M, Lee DC, Ng J, Carr M, Carr J, Goldberger JJ, et al. Left atrial 4-dimensional flow magnetic resonance imaging: stasis and velocity mapping in patients with atrial fibrillation. Invest Radiol. (2016) 51:147–54. doi: 10.1097/RLI.0000000000000219
10. Reiter U, Reiter G, Kovacs G, Stalder AF, Gulsun MA, Greiser A, et al. Evaluation of elevated mean pulmonary arterial pressure based on magnetic resonance 4D velocity mapping: comparison of visualization techniques. PLoS ONE. (2013) 8:E82212. doi: 10.1371/journal.pone.0082212
11. Reiter U, Kovacs G, Reiter C, Kräuter C, Nizhnikava V, Fuchsjäger M, et al. MR 4D Flow-based mean pulmonary arterial pressure tracking in pulmonary hypertension. Eur Radiol. (2021) 31:1883–93. doi: 10.1007/s00330-020-07287-6
12. Kovacs G, Avian A, Pienn M, Naeije R, Olschewski H. Reading pulmonary vascular pressure tracings. How to handle the problems of zero leveling and respiratory swings. Am J Respir Crit Care Med. (2014) 190:252–7. doi: 10.1164/rccm.201402-0269PP
13. Reiter U, Reiter G, Manninger M, Adelsmayr G, Schipke J, Alogna A, et al. Early-stage heart failure with preserved ejection fraction in the pig: a cardiovascular magnetic resonance study. J Cardiovasc Magn Reson. (2016) 18:63. doi: 10.1186/s12968-016-0283-9
14. Klein AL, Garcia MJ editors. Diastology: Clinical Approach to Diastolic Heart Failure, 1st ed. Philadelphia, PA: Saunders/Elsevier. (2008).
15. Nagueh SF, Appleton CP, Gillebert TC, Marino PN, Oh JK, Smiseth OA, et al. Recommendations for the evaluation of left ventricular diastolic function by echocardiography. Eur J Echocardiogr. (2009) 10:165–93. doi: 10.1093/ejechocard/jep007
16. Nagueh SF, Smiseth OA, Appleton CP, Byrd BF, Dokainish H, Edvardsen T, et al. Recommendations for the evaluation of left ventricular diastolic function by echocardiography: an update from the American Society of Echocardiography and the European Association of Cardiovascular Imaging. J Am Soc Echocardiogr. (2016) 29:277–314. doi: 10.1016/j.echo.2016.01.011
17. Willens HJ, Chirinos JA, Gomez-Marin O, Fertel DP, Ghany RA, Alfonso CE, et al. Noninvasive differentiation of pulmonary arterial and venous hypertension using conventional and Doppler tissue imaging echocardiography. J Am Soc Echocardiogr. (2008) 21:715–9. doi: 10.1016/j.echo.2007.10.003
18. Hammerstingl C, Schueler R, Bors L, Momcilovic D, Pabst S, Nickenig G, et al. Diagnostic value of echocardiography in the diagnosis of pulmonary hypertension. PLoS ONE. (2012) 7:E38519. doi: 10.1371/journal.pone.0038519
19. D'Alto M, Romeo E, Argiento P, Pavelescu A, Mélot C, D'Andrea A, et al. Echocardiographic prediction of pre- versus postcapillary pulmonary hypertension. J Am Soc Echocardiogr. (2015) 28:108–15. doi: 10.1016/j.echo.2014.09.004
20. Cameron DM, McLaughlin VV, Rubenfire M, Visovatti S, Bach DS. Usefulness of echocardiography/doppler to reliably predict elevated left ventricular end-diastolic pressure in patients with pulmonary hypertension. Am J Cardiol. (2017) 119:790–4. doi: 10.1016/j.amjcard.2016.11.016
21. Barbier P, Solomon S, Schiller NB, Glantz SA. Determinants of forward pulmonary vein flow: an open pericardium pig model. J Am Coll Cardiol. (2000) 35:1947–59. doi: 10.1016/S0735-1097(00)00642-2
22. Ruan Q, Nagueh SF. Clinical Application of tissue Doppler imaging in patients with idiopathic pulmonary hypertension. Chest. (2007) 131:395–401. doi: 10.1378/chest.06-1556
23. Tian Z, Liu Y-T, Fang Q, Ni C, Chen T-B, Fang L-G, et al. (2011). Hemodynamic parameters obtained by transthoracic echocardiography and right heart catheterization: a comparative study in patients with pulmonary hypertension. Chin Med J. 124, 1796–801.
24. Bane O, Shah SJ, Cuttica MJ, Collins JD, Selvaraj S, Chatterjee NR, et al. A non-invasive assessment of cardiopulmonary hemodynamics with MRI in pulmonary hypertension. Magn Reson Imaging. (2015) 33:1224–35. doi: 10.1016/j.mri.2015.08.005
25. Swift AJ, Rajaram S, Hurdman J, Hill C, Davies C, Sproson TW, et al. Noninvasive estimation of PA pressure, flow, and resistance with CMR imaging: derivation and prospective validation study from the ASPIRE registry. JACC Cardiovasc Imaging. (2013) 6:1036–47. doi: 10.1016/j.jcmg.2013.01.013
26. Cameli M, Lisi M, Mondillo S, Padeletti M, Ballo P, Tsioulpas C, et al. Left atrial longitudinal strain by speckle tracking echocardiography correlates well with left ventricular filling pressures in patients with heart failure. Cardiovasc Ultrasound. (2010) 8:14. doi: 10.1186/1476-7120-8-14
27. Lin K, Sarnari R, Pathrose A, Gordon D, Blaisdell J, Markl M, et al. Cine MRI detects elevated left heart pressure in pulmonary hypertension. J Magn Reson Imaging. (2021) 54:275–83. doi: 10.1002/jmri.27504
28. Ran H, Schneider M, Pistritto AM, Gerges C, Heidari H, Binder T, et al. Echocardiographic evaluation of left ventricular filling pressures in patients with pulmonary hypertension. Int J Cardiovasc Imaging. (2019) 35:861–8. doi: 10.1007/s10554-019-01528-6
29. Crawley SF, Johnson MK, Dargie HJ, Peacock AJLA. Volume by CMR distinguishes idiopathic from pulmonary hypertension due to HFpEF. JACC Cardiovasc Imaging. (2013) 6:1120–1. doi: 10.1016/j.jcmg.2013.05.014
30. Opotowsky AR, Ojeda J, Rogers F, Prasanna V, Clair M, Moko L, et al. A simple echocardiographic prediction rule for hemodynamics in pulmonary hypertension. Circ Cardiovasc Imaging. (2012) 5:765–75. doi: 10.1161/CIRCIMAGING.112.976654
31. Garg P, Gosling R, Swoboda P, Jones R, Rothman A, Wild JM, et al. Cardiac magnetic resonance identifies raised left ventricular filling pressure: prognostic implications. Eur Heart J. (2022) 43:Ehac207. doi: 10.1093/eurheartj/ehac207
32. Burkett DA, Slorach C, Patel SS, Redington AN, Ivy DD, Mertens L, et al. Impact of pulmonary hemodynamics and ventricular interdependence on left ventricular diastolic function in children with pulmonary hypertension. Circ Cardiovasc Imaging. (2016) 9:E004612. doi: 10.1161/CIRCIMAGING.116.004612
33. Holiday DB, Ballard JE, McKeown BC. PRESS-related statistics: regression tools for cross-validation and case diagnostics. Med Sci Sports Exerc. (1995) 27:612–20. doi: 10.1249/00005768-199504000-00022
34. Palmer PB, O'Connell DG. Regression analysis for prediction: understanding the process. Cardiopulm Phys Ther J. (2009) 20:23–6. doi: 10.1097/01823246-200920030-00004
35. Duarte R, Fernandez-Perez G, Bettencourt N, Sampaio F, Miranda D, França M, et al. Assessment of left ventricular diastolic function with cardiovascular MRI: what radiologists should know. Diagn Interv Radiol. (2012) 18:446–53. doi: 10.4261/1305-3825.DIR.5510-11.1
36. Firstenberg MS, Greenberg NL, Smedira NG, Prior DL, Scalia GM, Thomas JD, et al. Doppler echo evaluation of pulmonary venous-left atrial pressure gradients: human and numerical model studies. Am J Physiol Heart Circ Physiol. (2000) 279:H594–600. doi: 10.1152/ajpheart.2000.279.2.H594
37. Moser DK, Frazier SK, Woo MA, Daley LK. Normal Fluctuations in pulmonary artery pressures and cardiac output in patients with severe left ventricular dysfunction. Eur J Cardiovasc Nurs. (2002) 1:131–7. doi: 10.1016/S1474-51510200013-0
38. Maron BA, Kovacs G, Vaidya A, Bhatt DL, Nishimura RA, Mak S, et al. Cardiopulmonary hemodynamics in pulmonary hypertension and heart failure: JACC review topic of the week. JACC. (2020) 76:2671–81. doi: 10.1016/j.jacc.2020.10.007
39. Naeije R, Chin K. Differentiating precapillary from postcapillary pulmonary hypertension. Circulation. (2019) 140:712–4. doi: 10.1161/CIRCULATIONAHA.119.040295
Keywords: right heart catheterization (RHC), pulmonary hypertension, pulmonary artery wedge pressure, cardiac magnetic resonance (CMR) imaging, 4D flow
Citation: Reiter G, Kovacs G, Reiter C, Schmidt A, Fuchsjäger M, Olschewski H and Reiter U (2022) Left atrial acceleration factor as a magnetic resonance 4D flow measure of mean pulmonary artery wedge pressure in pulmonary hypertension. Front. Cardiovasc. Med. 9:972142. doi: 10.3389/fcvm.2022.972142
Received: 17 June 2022; Accepted: 11 July 2022;
Published: 03 August 2022.
Edited by:
Zhihong Liu, Chinese Academy of Medical Sciences and Peking Union Medical College, ChinaReviewed by:
Robert Naeije, Université Libre de Bruxelles, BelgiumBruno Pinamonti, University Health Organization Giuliano Isontina (ASU GI), Italy
Pankaj Garg, Mayo Clinic Florida, United States
Copyright © 2022 Reiter, Kovacs, Reiter, Schmidt, Fuchsjäger, Olschewski and Reiter. This is an open-access article distributed under the terms of the Creative Commons Attribution License (CC BY). The use, distribution or reproduction in other forums is permitted, provided the original author(s) and the copyright owner(s) are credited and that the original publication in this journal is cited, in accordance with accepted academic practice. No use, distribution or reproduction is permitted which does not comply with these terms.
*Correspondence: Ursula Reiter, dXJzdWxhLnJlaXRlckBtZWR1bmlncmF6LmF0