 Guoqing Huang
 Qiankai Jin
 Xiaoqing Tian
 Yushan Mao
- 1Department of Endocrinology, The Affiliated Hospital of Medical School, Ningbo University, Ningbo, China
- 2School of Medicine, Ningbo University, Ningbo, China
Purpose: This study aimed to identify independent risk factors for carotid atherosclerosis (CAS) and construct and validate a CAS risk prediction model based on the Chinese population.
Methods: This retrospective study included 4,570 Chinese adults who underwent health checkups (including carotid ultrasound) at the Zhenhai Lianhua Hospital, Ningbo, China, in 2020. All the participants were randomly assigned to the training and validation sets at a ratio of 7:3. Independent risk factors associated with CAS were identified using multivariate logistic regression analysis. The least absolute shrinkage and selection operator combined with 10-fold cross-validation were screened for characteristic variables, and nomograms were plotted to demonstrate the risk prediction model. C-index and receiver operating characteristic curves, calibration plots, and decision curve analysis (DCA) were used to evaluate the risk model’s discrimination, calibration, and clinical applicability.
Results: Age, body mass index, diastolic blood pressure, white blood cell count, mean platelet volume, alanine transaminase, aspartate transaminase, and gamma-glutamyl transferase were identified as independent risk factors for CAS. In the training, internal validation, and external validation sets, the risk model showed good discriminatory power with C-indices of 0.961 (0.953–0.969), 0.953 (0.939–0.967), and 0.930 (0.920–0.940), respectively, and excellent calibration. The results of DCA showed that the prediction model could be beneficial when the risk threshold probabilities were 1–100% in all sets. Finally, a network computer (dynamic nomogram) was developed to facilitate the physicians’ clinical operations. The website is https://nbuhgq.shinyapps.io/DynNomapp/.
Conclusion: The development of risk models contributes to the early identification and prevention of CAS, which is important for preventing and reducing adverse cardiovascular and cerebrovascular events.
Introduction
Atherosclerosis is a systemic atherosclerotic disease characterized by thickening, hardening, and loss of elasticity of the arterial walls and has become the pathological basis of many cardiovascular and cerebrovascular diseases, such as coronary heart disease and stroke (1). As part of systemic atherosclerosis, carotid atherosclerosis (CAS) has become an important window for observing systemic vascular health and the early risk of atherosclerosis due to its superficial location and ease of ultrasound manipulation (2, 3). In a global meta-analysis, approximately 28% of individuals in the general population (30–79 years) had carotid intimal thickening (4), potentially threatening people’s health.
As the global aging process increases, the incidence of stroke has become a leading cause of morbidity and mortality (5). CAS is a major and potentially preventable cause of ischemic stroke. Some studies have shown that CAS is associated with 20–30% of strokes (6). Diagnostic examination modalities for CAS include carotid ultrasound, computed tomography, magnetic resonance imaging, and invasive angiography. Carotid ultrasound is the primary screening modality for CAS (6). Additionally, studies have shown that serum biomarkers such as interleukin, homocysteine, and adipokines contribute to the early diagnosis of CAS (7). The basic clinical treatment options for CAS are lifestyle modification, control of cardiovascular risk factors, antiplatelet aggregation (requiring adequate assessment of bleeding risk), and lipid-lowering (8, 9), whereas surgical intervention is required for severe carotid intimal thickening.
Reducing the risk factors associated with CAS is crucial in reducing adverse cardiovascular events occurrence. A meta-analysis by Ji et al. (10) showed that hyperlipidemia, hyperhomocysteinemia, hypertension (HTN), hyperuricemia, smoking history, metabolic syndrome, hypertriglyceridemia, diabetes mellitus (DM), and low-density lipoprotein (LDL) were significantly associated with CAS. In addition, a global meta-analysis showed that gender (male), smoking history, DM, HTN, and dyslipidemia are strongly associated with CAS (4). Identifying risk factors is a guide to targeting the prevention and control of CAS.
Although numerous risk factors associated with CAS are already known, few clinical risk prediction models related to CAS have been reported in Chinese populations. The nomogram is a common visual presentation tool for disease risk prediction models that is user-friendly and easy to understand. The current study aimed to develop and validate an analytical predictive model for CAS based on a Chinese population using statistical algorithms. This study will play an important role in the early identification and prevention of CAS in the Chinese population.
Materials and methods
Patients
A total of 4,738 adults (19–93 years) who underwent health checkups (including carotid ultrasound) at Zhenhai Lianhua Hospital, Ningbo, China, in 2020 were initially included in this study. Relevant information about the participants was obtained through the hospital’s electronic medical record system. Those with serious missing information (exceeding 20% of the total) were excluded, and those with less missing information (less than 20% of the total) were filled by multiple interpolations. Ultimately, 4,570 participants were included in this study. CAS was defined as an increase in carotid intima-media thickness of ≥1 mm or plaque formation (11). CAS diagnosis was based on carotid ultrasound results, recorded independently by 2 ultrasound physicians. The external validation dataset (2,791) was obtained from the 2015 health checkups (different from 2020). This study was approved by the ethics committee of the Affiliated Hospital of Medical School, Ningbo University, Ningbo, China (KY20191114). A flowchart of the participants is shown in Figure 1.
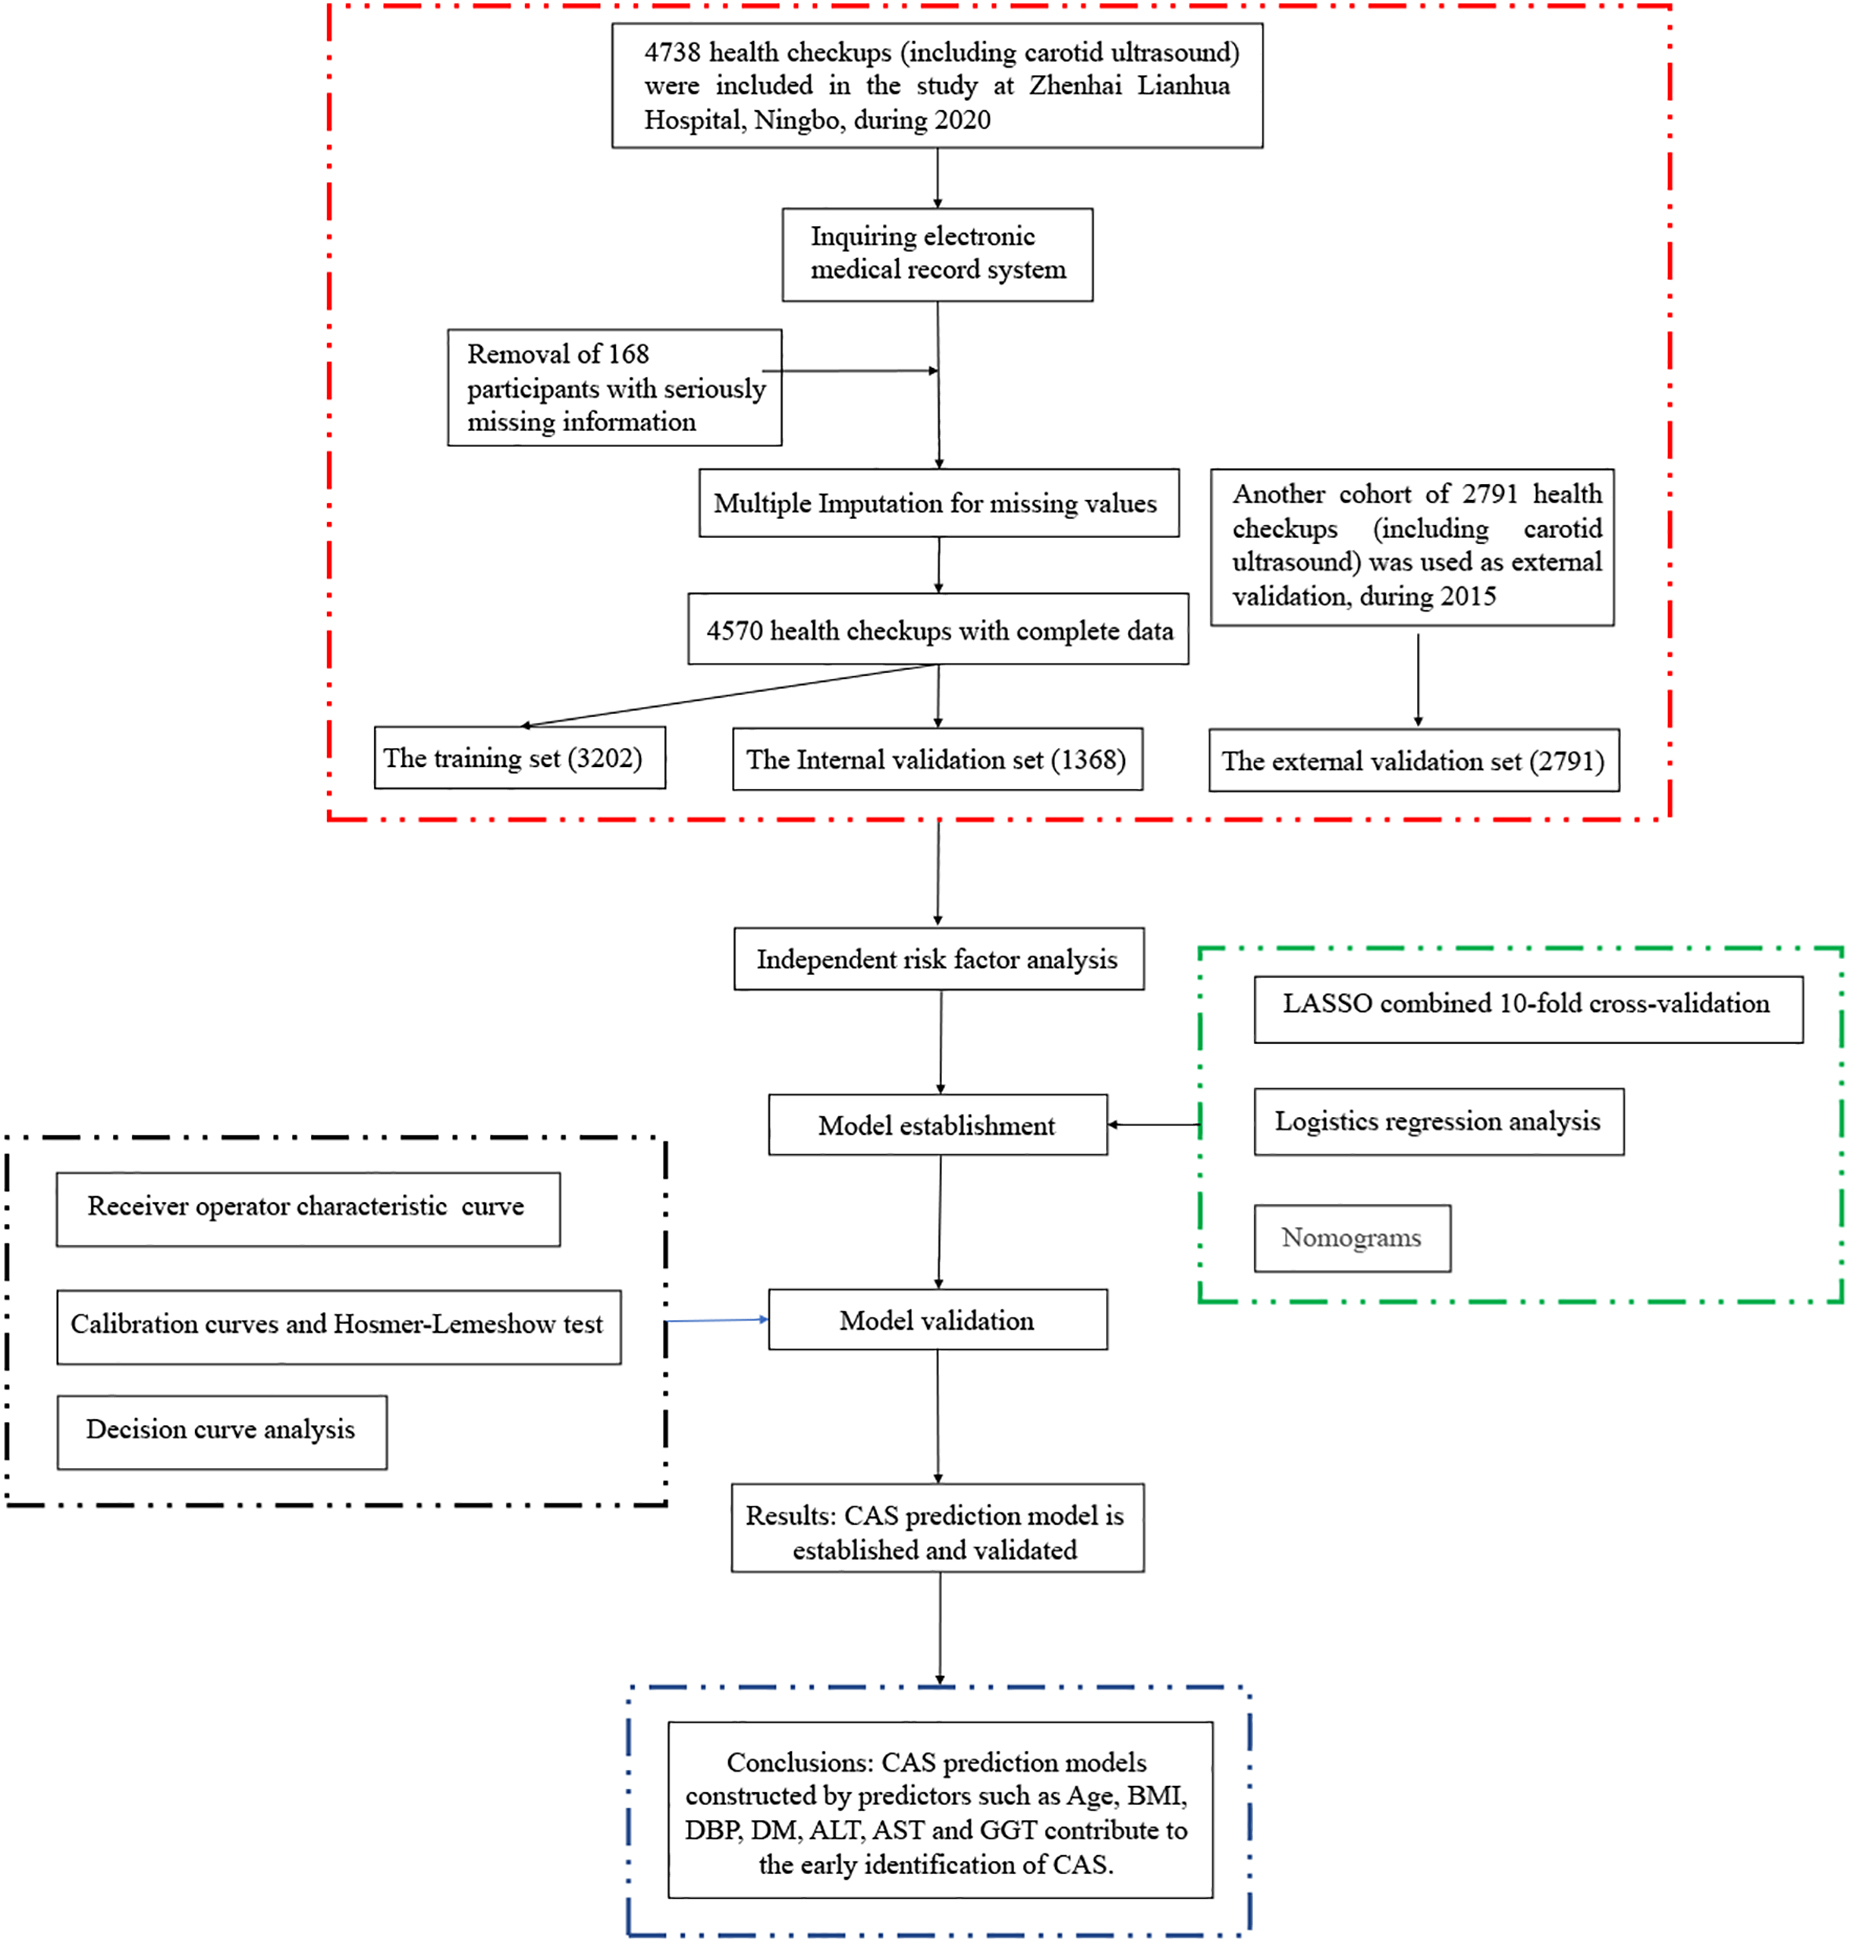
Figure 1. Flowchart of the participants.
Clinical baseline data
The methods and procedures for testing the clinical baseline data were based on previous studies (12–14). Gender, age, body mass index (BMI), systolic blood pressure (SBP), diastolic blood pressure (DBP), heart rate (HR), DM, HTN, Drinking and Smoking history, white blood cell count (WBC), neutrophil count, eosinophil count, basophil count, lymphocyte count, red blood cell count (RBC), hemoglobin, red blood cell distribution width, mean red blood cell volume, platelet count, platelet distribution width (PDW), mean platelet volume (MPV), alanine aminotransferase (ALT), aspartate aminotransferase (AST), total bilirubin, direct bilirubin, indirect bilirubin, total protein, albumin, globulin, gamma-glutamyl transpeptidase (GGT), total bile acids, blood urea nitrogen, serum creatinine, uric acid, fasting blood glucose, total cholesterol (TC), triglycerides, high-density lipoprotein, LDL, apolipoprotein A, apolipoprotein B (Apo-B), thyroid stimulating hormone, total triiodothyronine, total tetraiodothyronine, free triiodothyronine, and free tetraiodothyronine were obtained from the hospital electronic medical record system.
Statistical analysis
This study enrolled 4,750 adults, and the measurement data were expressed as mean ± standard deviation; the count data were expressed as counts (%). Statistical analysis was performed with R software (version 4.1.2).1 All tests were two-tailed, and a P-value <0.05 was considered statistically significant.
Participants were randomly assigned to the training and internal validation sets at a certain ratio (7:3) (15). Independent risk factors were identified using multivariate logistic regression analysis. The least absolute shrinkage and selection operator (LASSO) combined with 10-fold cross-validation was used to screen for characteristic variables associated with CAS. The visual presentation of the risk prediction model was displayed using a nomogram. Risk prediction models were evaluated in terms of discrimination (C-index and receiver operating characteristic (ROC) curves), calibration ability (Hosmer–Lemeshow test and calibration curves), and clinical applicability [decision curve analysis (DCA)] in the training, internal validation, and external validation sets, respectively.
Results
Characteristics of the study population
This study enrolled 4,570 participants (3,010 males and 1,560 females). The detection rate of CAS by carotid ultrasound in 2020 was 83.4% (3,813) compared with 73.1% (2,039) in 2015 (external validation set) at Zhenhai Lianhua Hospital, Ningbo, China. The total study population was divided into training (3,202) and internal validation (1,358) sets according to a 7:3 ratio, while an external validation set (2,791) was introduced to ensure the stability of the model (Table 1). Univariate analysis showed a higher proportion of males in the CAS group than in the healthy control (HC) group (66.90% vs. 60.63%, P < 0.001). The mean age of the HC and CAS groups was 40.08 and 64.37 years, respectively. The CAS group had higher proportions of DM, HTN, smoking history, and drinking history than the HC group. In addition, there were differences between the 2 groups in terms of routine blood tests, liver function, lipids, glucose, and thyroid function. The baseline information of the study cohort is shown in Table 2.
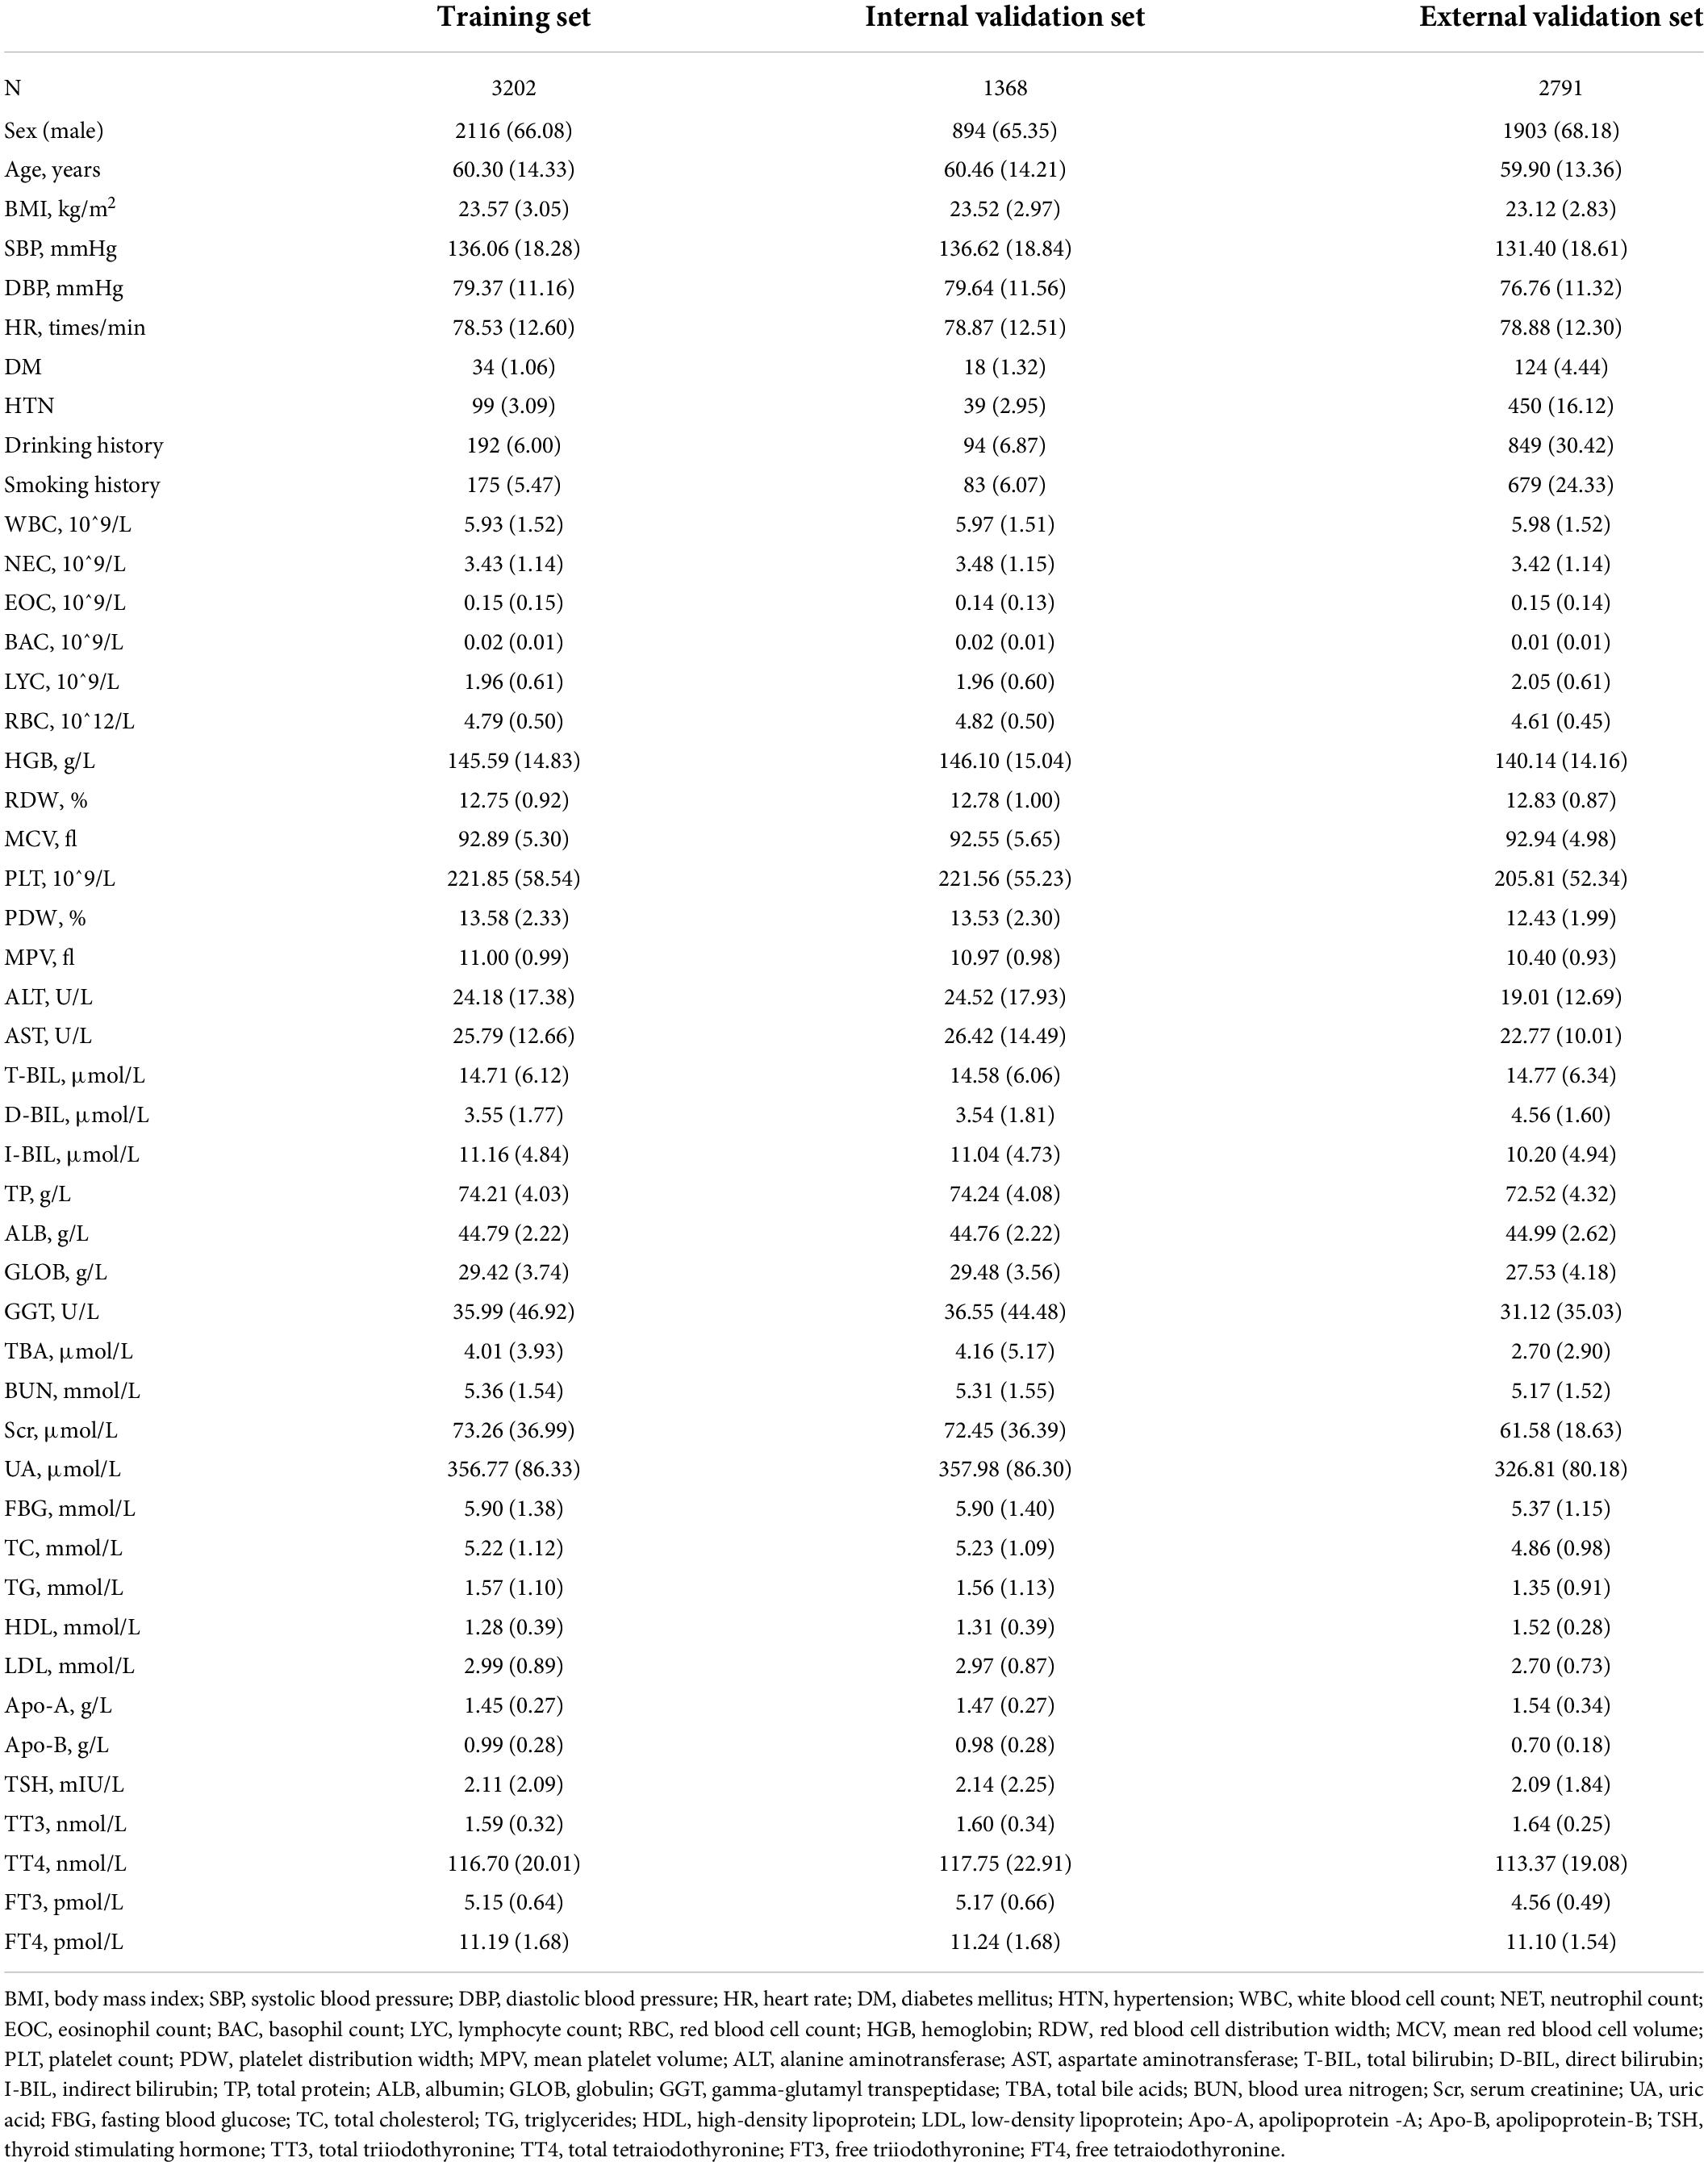
Table 1. Characteristics of participants in different cohorts.
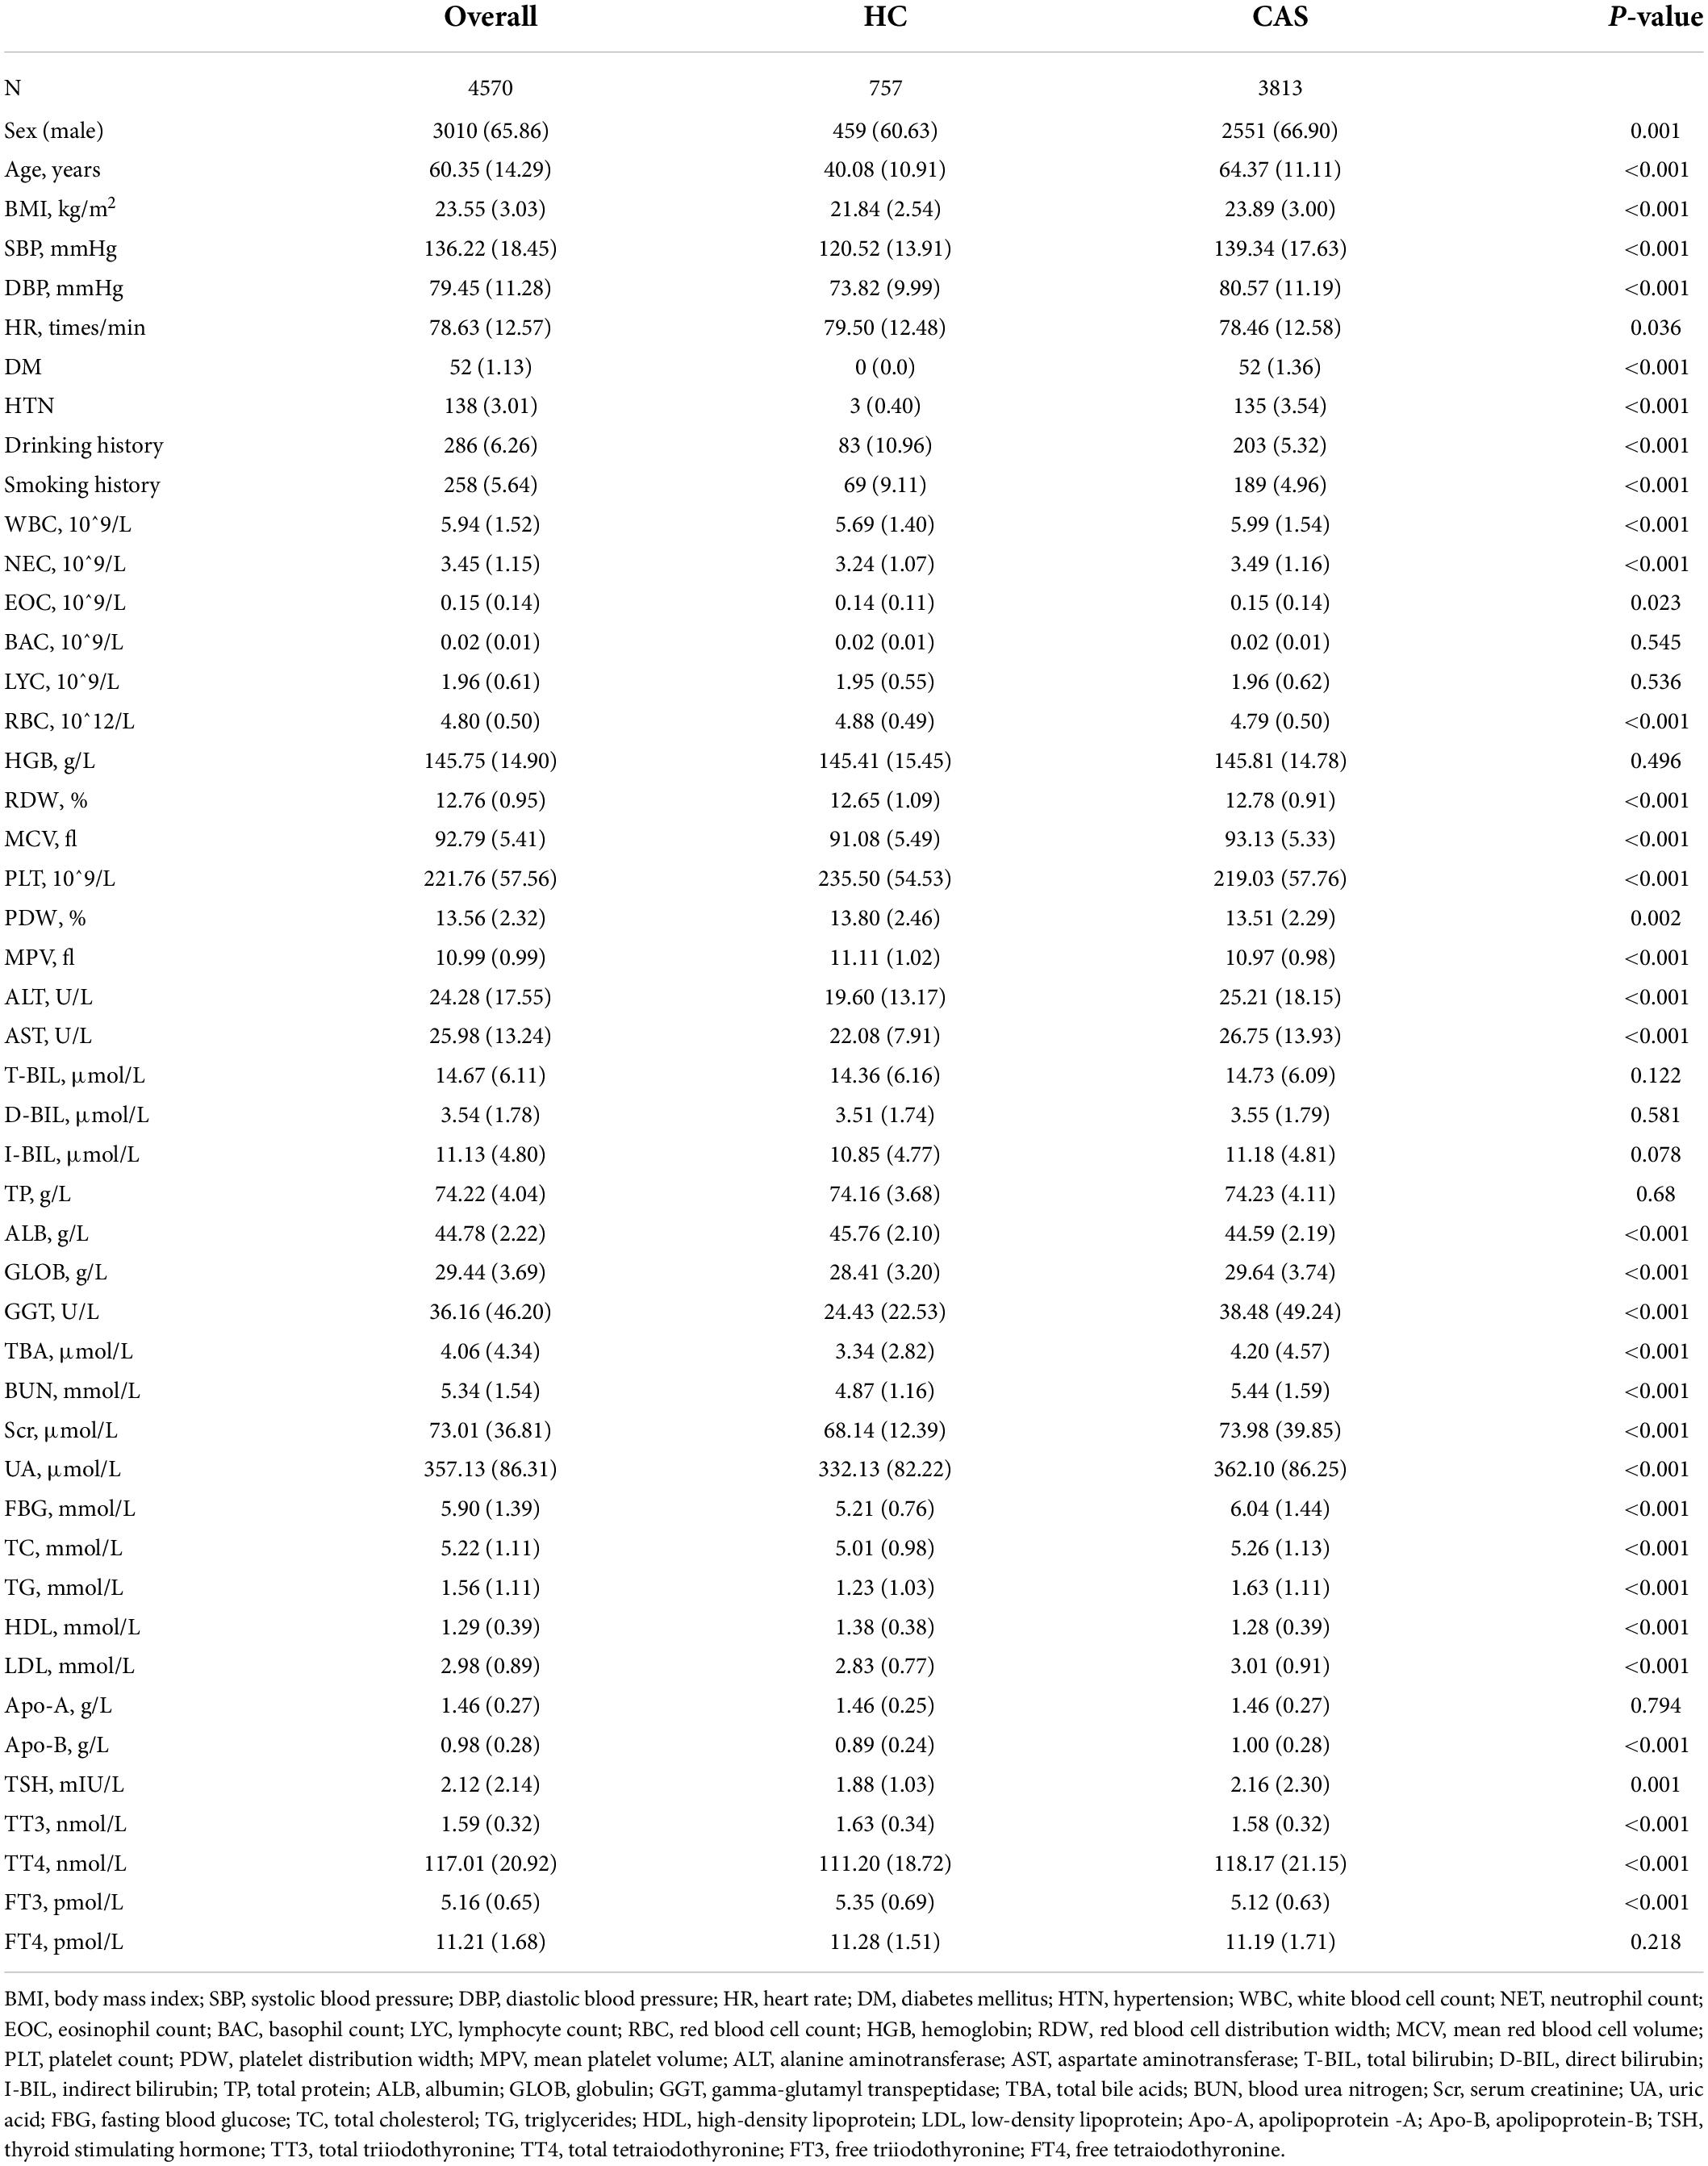
Table 2. Univariate analysis of carotid atherosclerosis.
Independent risk factors
Based on univariate analysis (Table 1), we selected candidate variables with P < 0.1 to screen independent risk factors. Covariance analysis among candidate variables showed variance inflation factors (VIF) > 10 for PDW, MPV, TC, LDL, and Apo-B. When the Akaike information criterion was −12180.32, the stepwise backward logistic regression analysis found the optimal model to include 20 variables such as age, BMI, HR, SBP, and DBP (VIF < 10). Furthermore, we constructed logistic regression equations.
Where BMI, body mass index; HR, heart rate; SBP, systolic blood pressure; DBP, diastolic blood pressure; WBC, white blood cell count; RBC, red blood cell count; MRBCV, mean red blood cell velocities; MPV, mean platelet volume; ALT, alanine transaminase; AST, aspartate transaminase; I_BIL, indirect bilirubin; GLOB, globulin; GGT, gamma-glutamyl transpeptidase; FBG, fasting blood glucose; LDL, low-density lipoprotein; Apo_B, apolipoprotein B; TT3, total triiodothyronine.
Independent risk factors associated with CAS were also identified, including age, BMI, WBC count, MPV, ALT, AST, and GGT (Table 3).
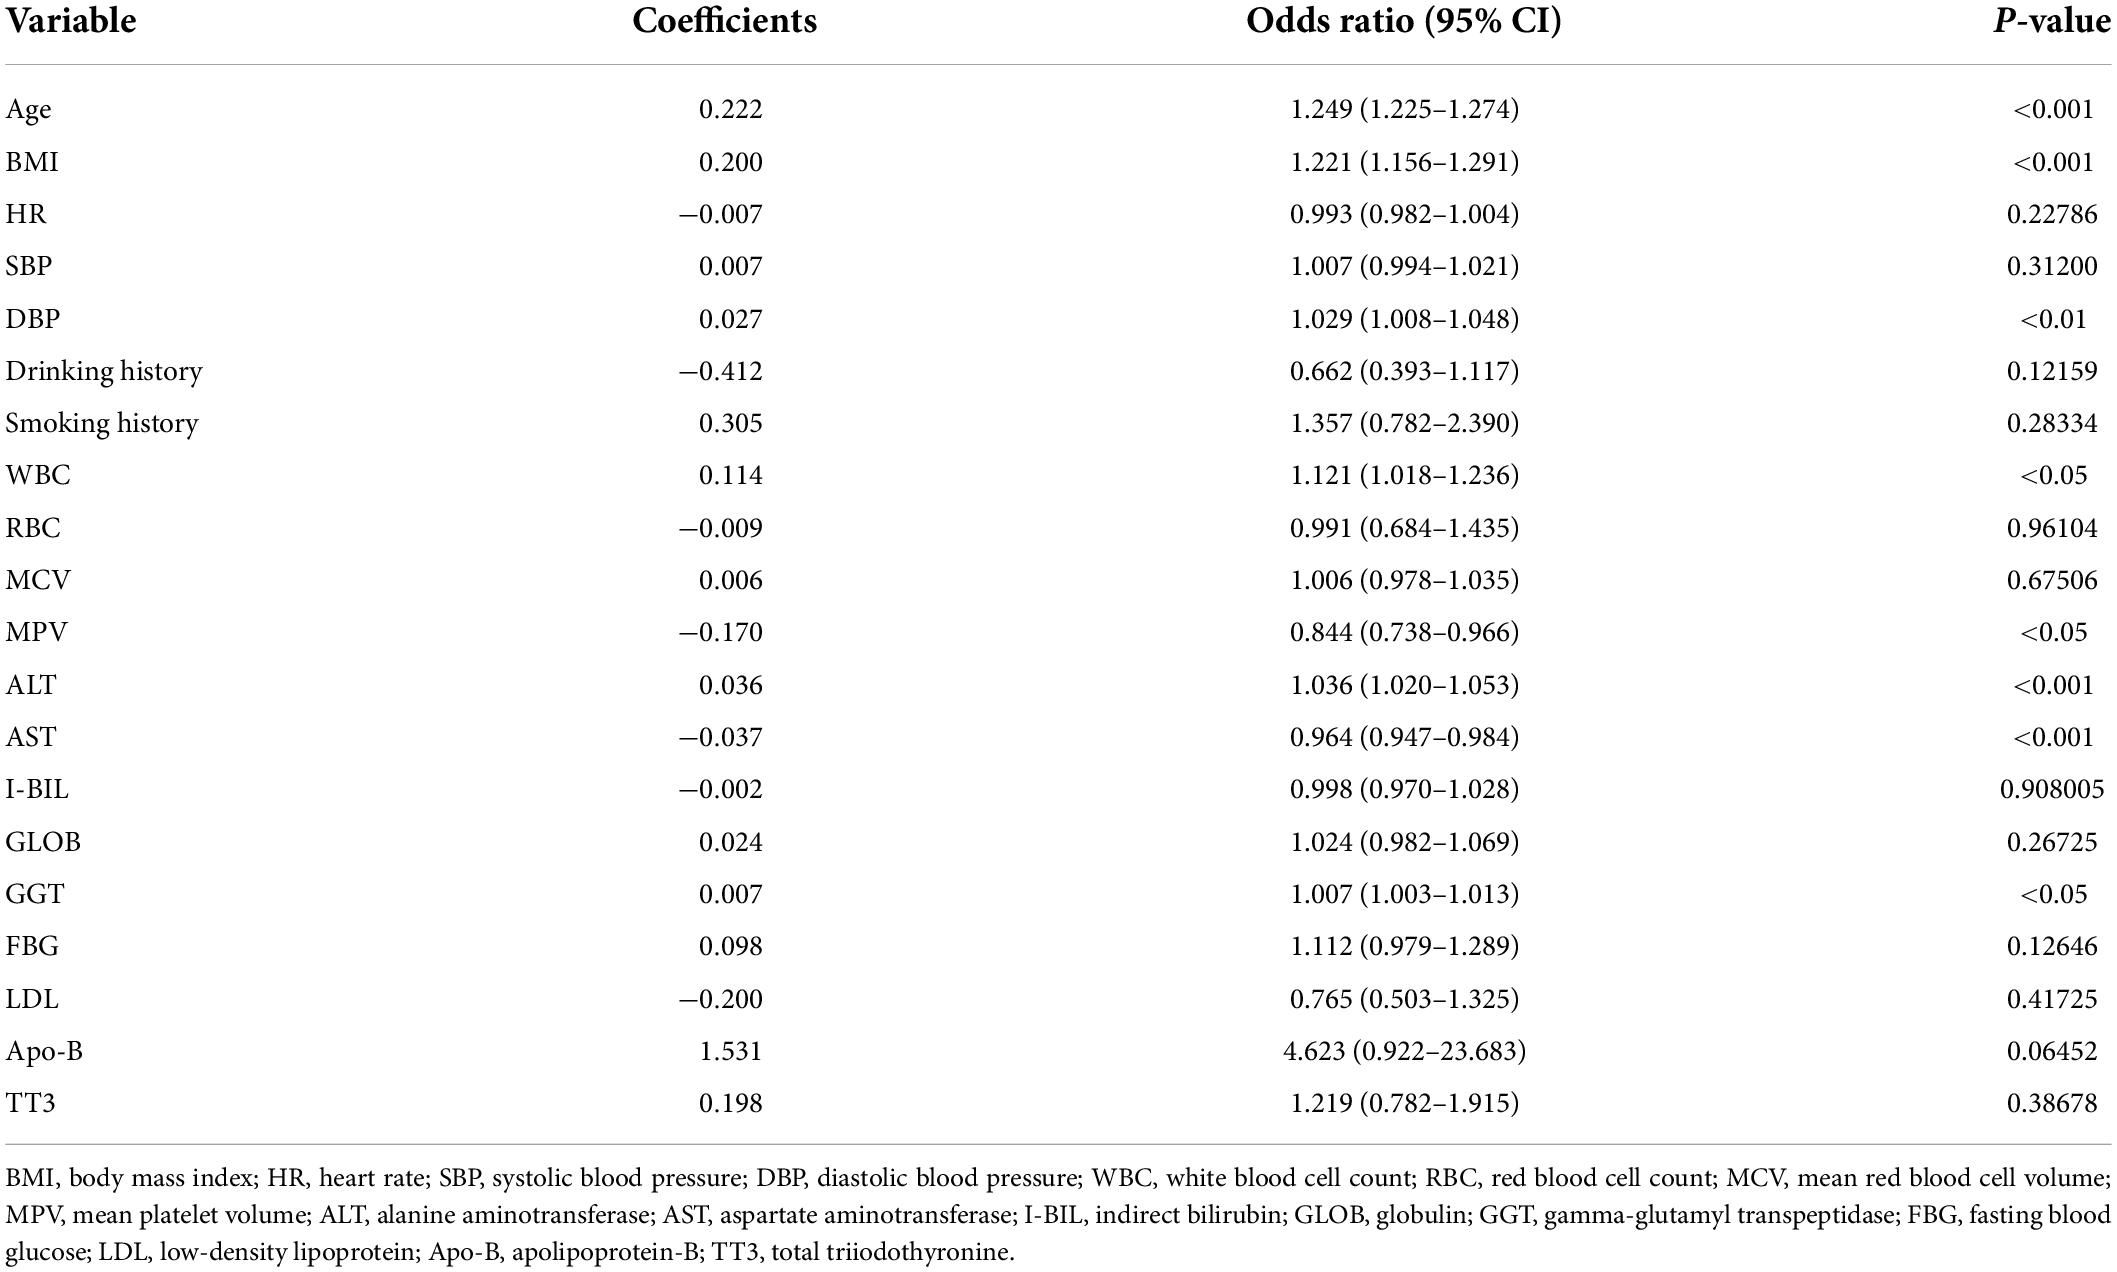
Table 3. Multivariate logistic regression analysis.
Construction of predictive models
In the training set, 28 non-zero characteristic variables were screened using LASSO regression analysis (Figure 2 and Table 4). Low-weight variables (points < 20) were removed from the risk prediction model. Finally, we selected age, BMI, DBP, DM, ALT, AST, and GGT for model construction (Figure 3). In addition, we developed a web version of the dynamic nomogram (Figure 4) for ease of daily use. The URL is https://nbuhgq.shinyapps.io/DynNomapp/.
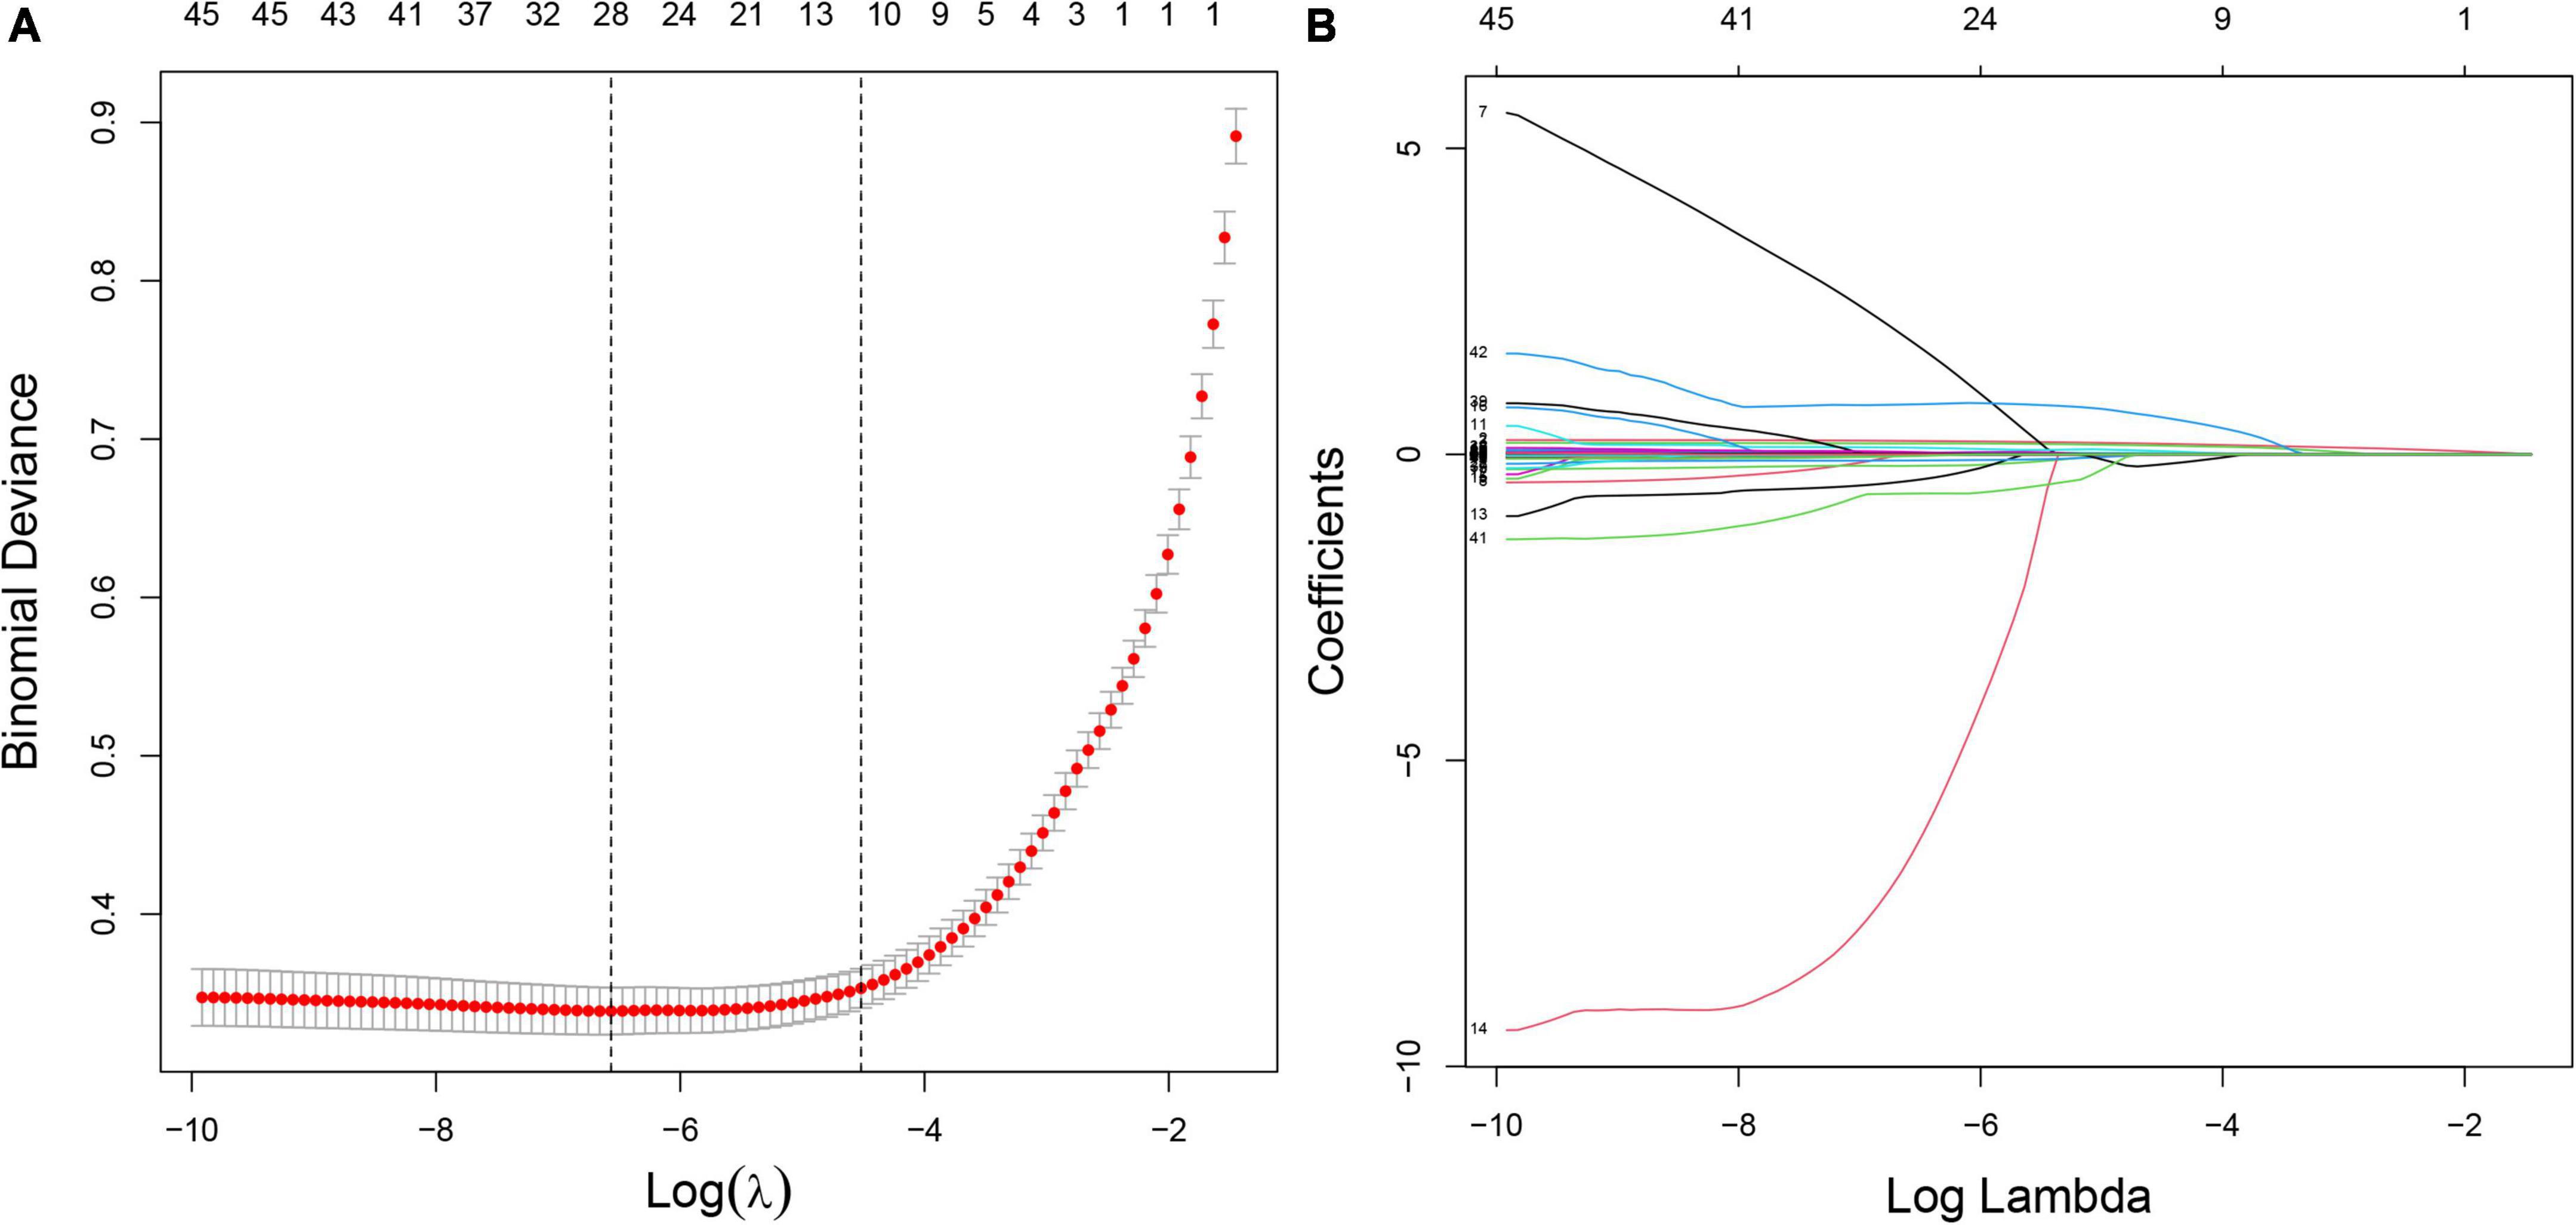
Figure 2. Screening of characteristic variables using the LASSO regression analysis. (A) The selection of the best parameter (lambda) in the LASSO model uses 10-fold cross-validation with the lowest standard. The relationship curve between partial likelihood deviation (binomial deviation) and log (lambda) was plotted. Dotted vertical lines were drawn at the optimal values by using the minimum criteria and the 1 SE of the minimum criteria (the 1 SE criteria). (B) LASSO coefficient profiles of the 28 characteristic variables. A coefficient profile plot was produced against the log (lambda) sequence. LASSO, least absolute shrinkage and selection operator; SE, standard error.
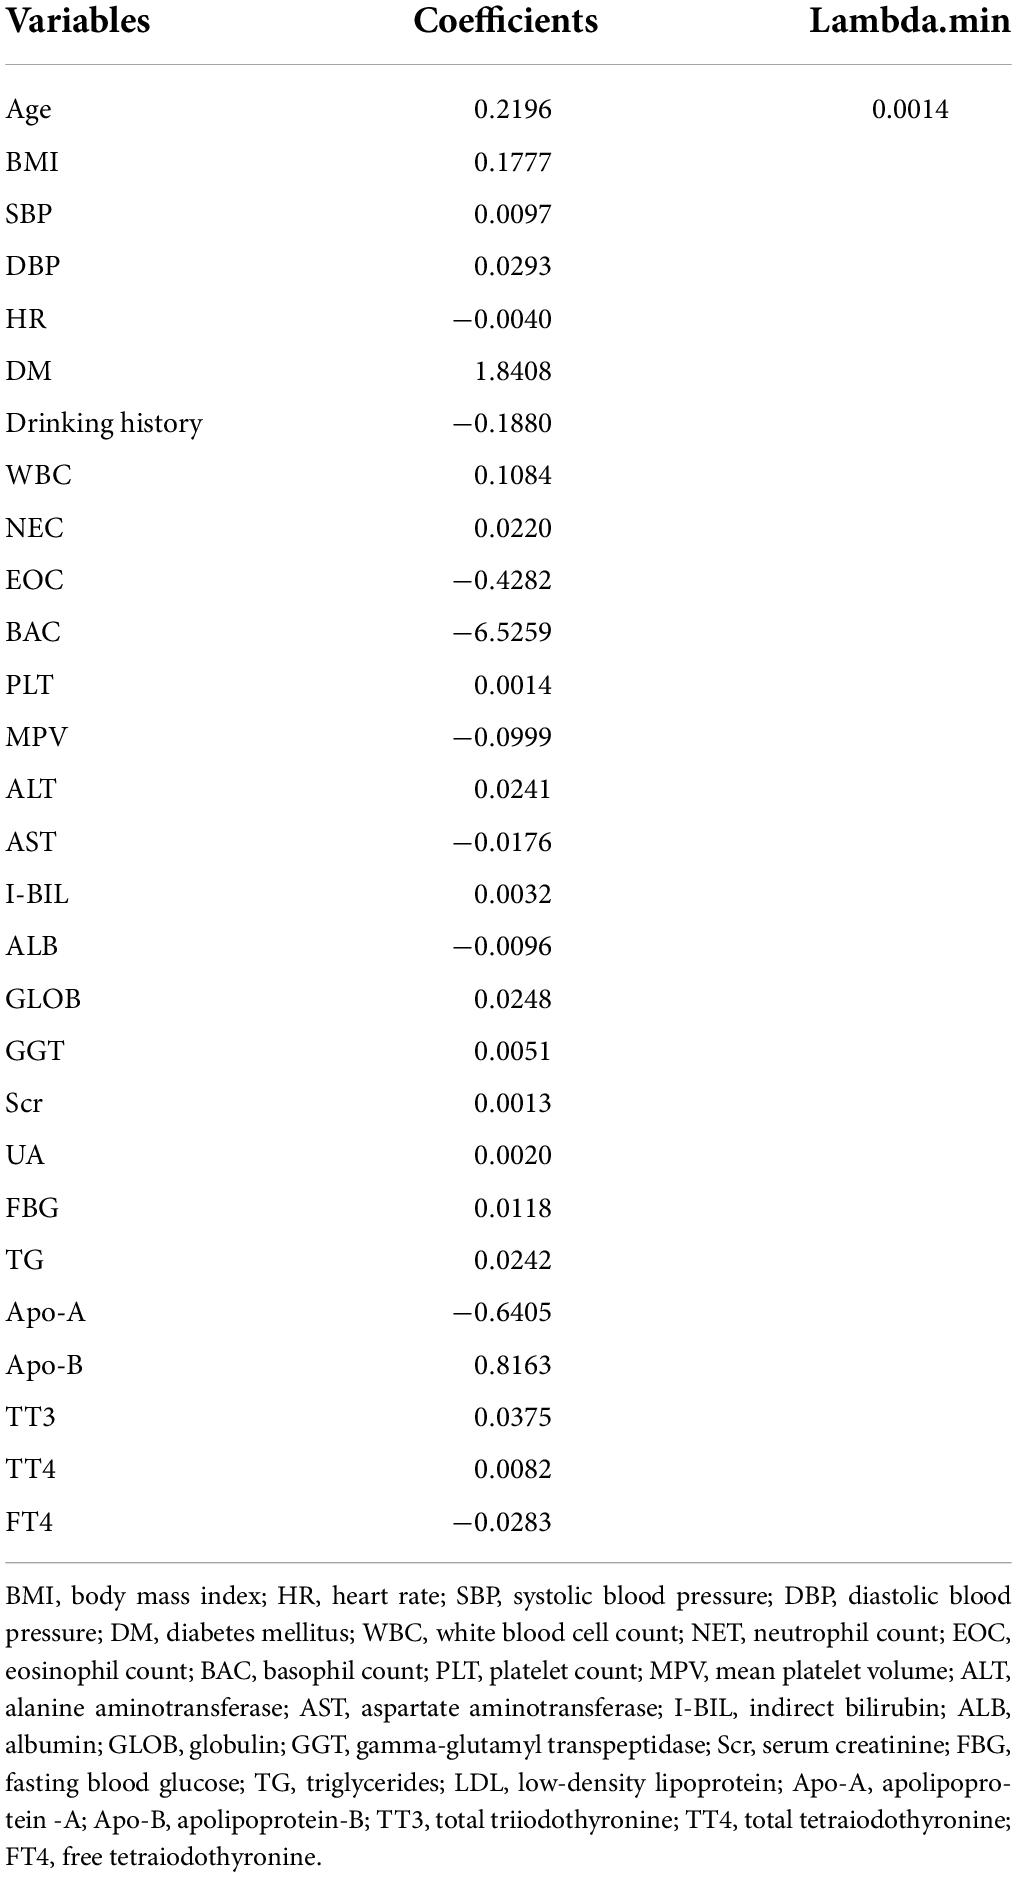
Table 4. Coefficients and lambda.min value of the LASSO regression.
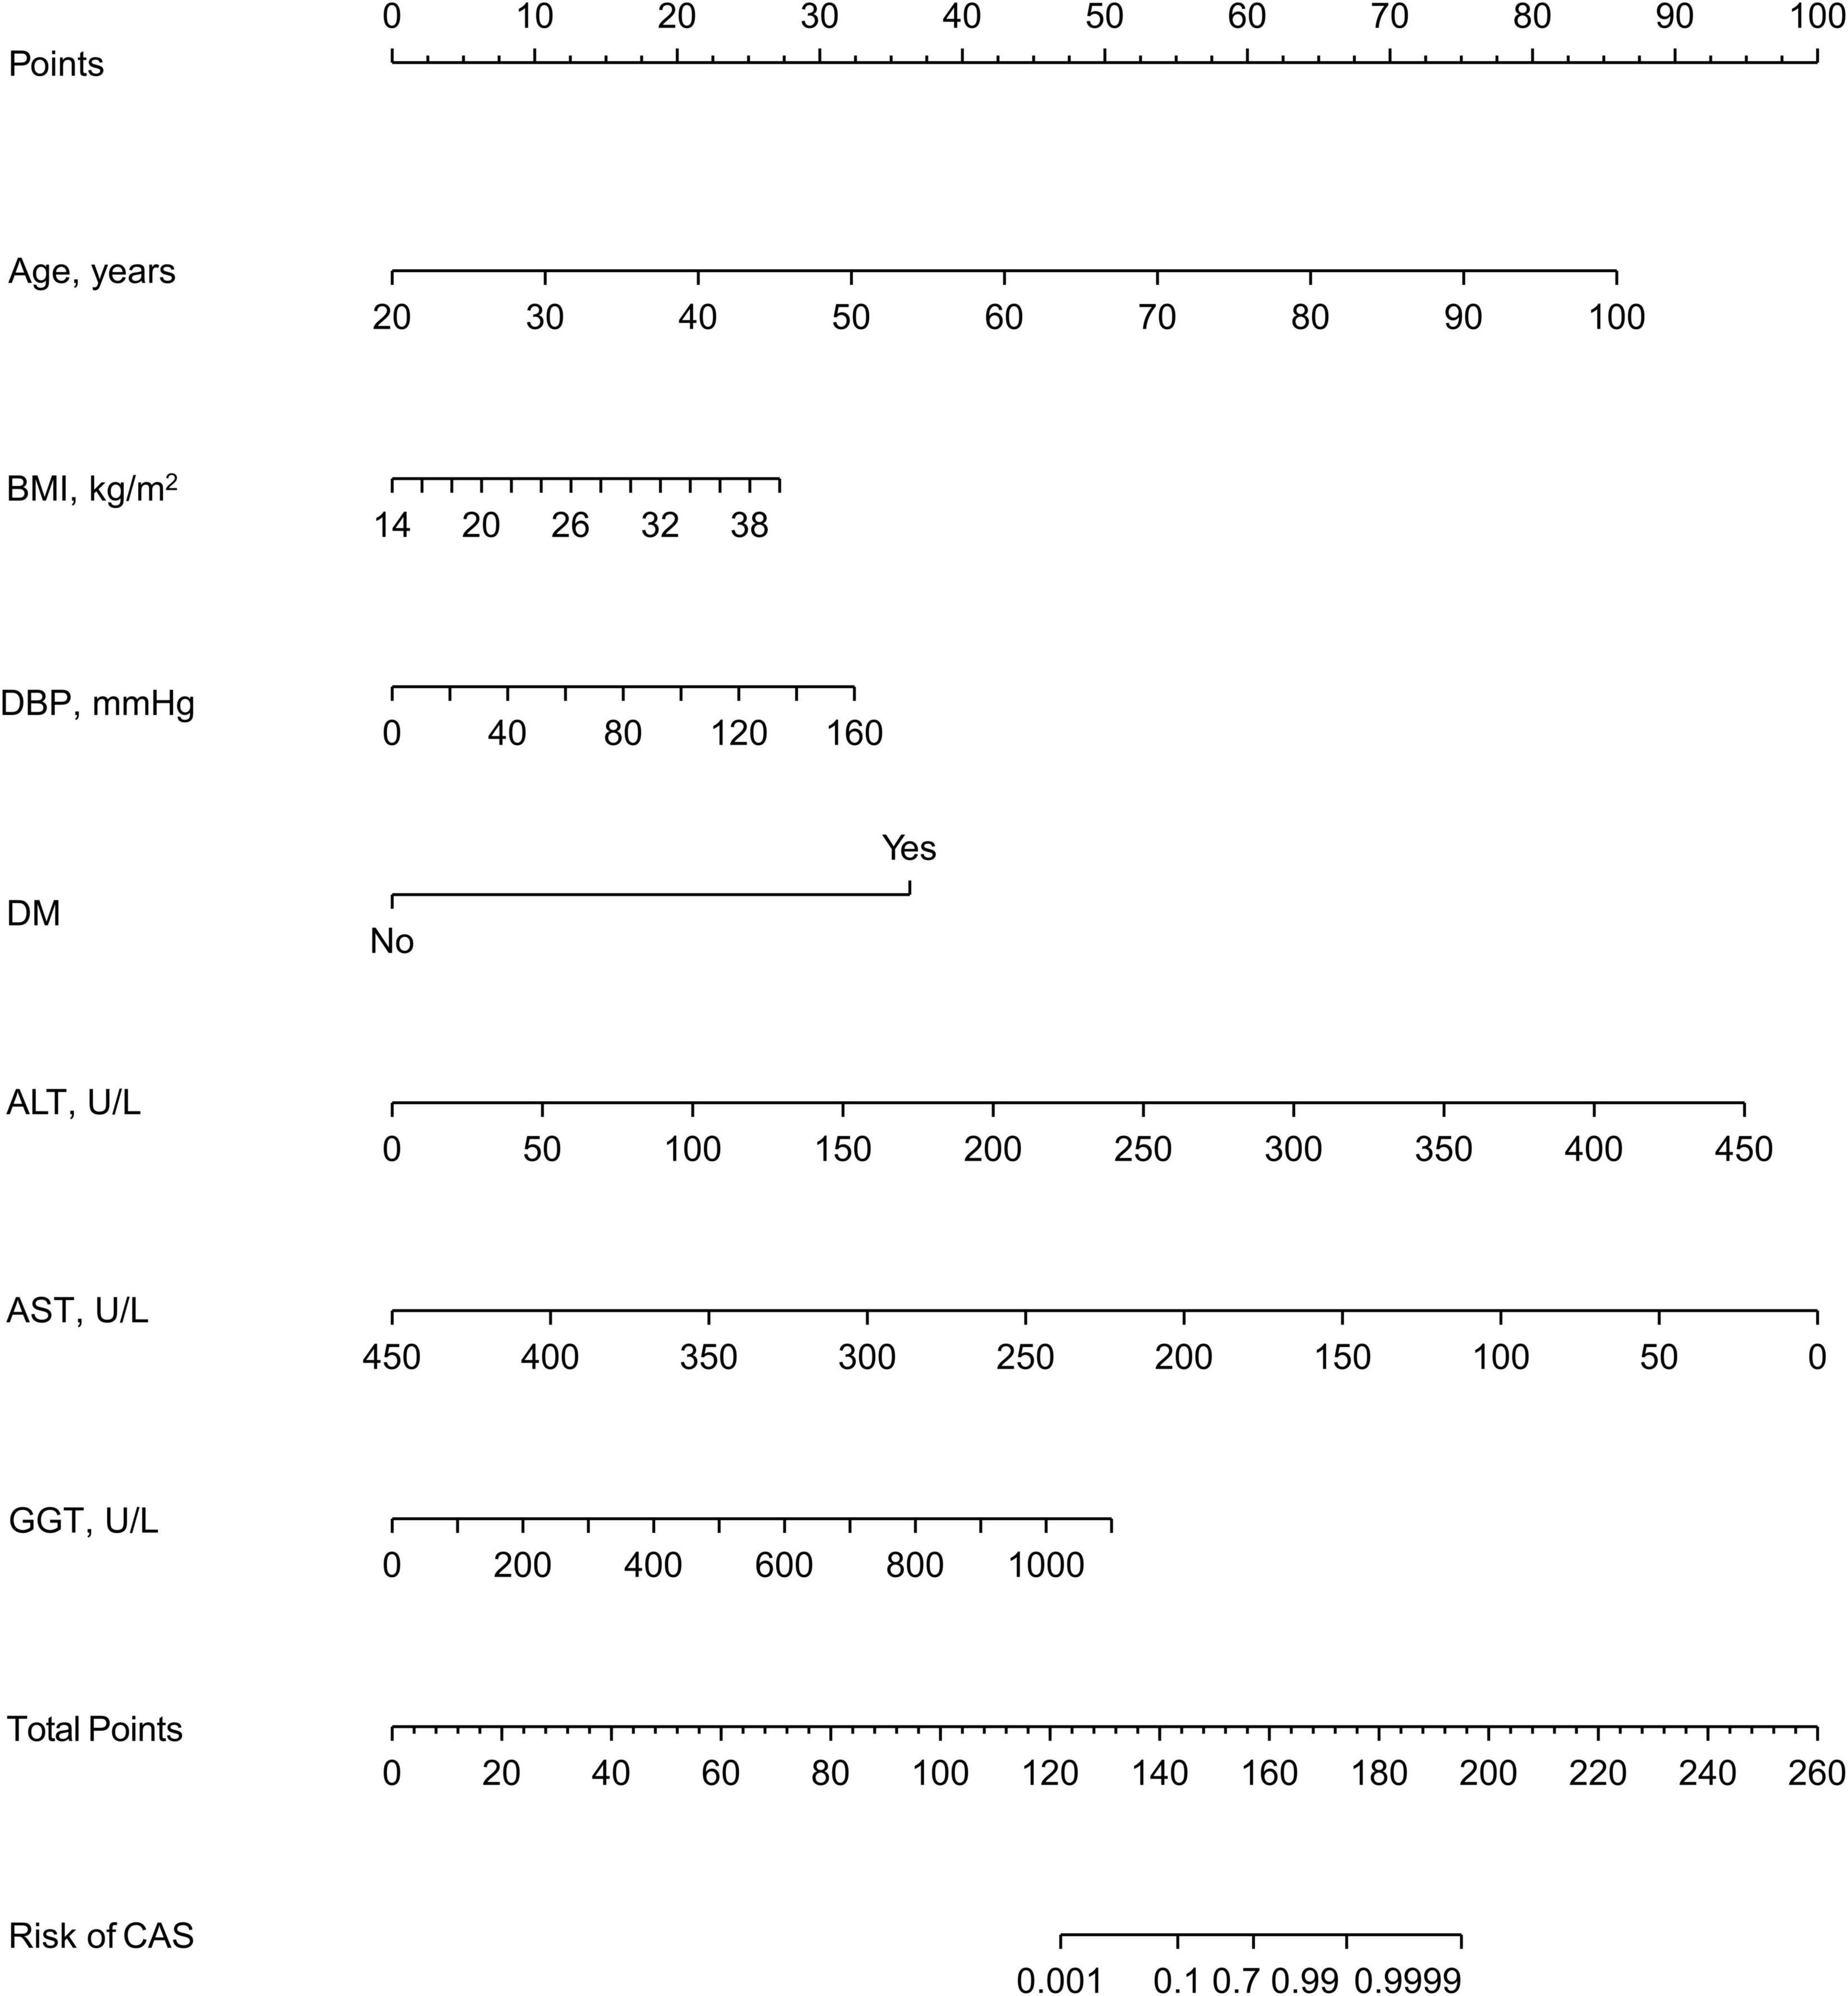
Figure 3. A nomogram for predicting the probability of the development of CAS. The nomogram is used by scoring each variable on its corresponding score scale. The scores for all variables are then summed up to obtain the total score, and a vertical line is drawn from the total point row to indicate the estimated probability of the development of CAS. carotid atherosclerosis, CAS; body mass index, BMI; systolic blood pressure, SBP; diastolic blood pressure, DBP; diabetes mellitus, DM; alanine aminotransferase, ALT; aspartate aminotransferase, AST; gamma-glutamyl transpeptidase, GGT.
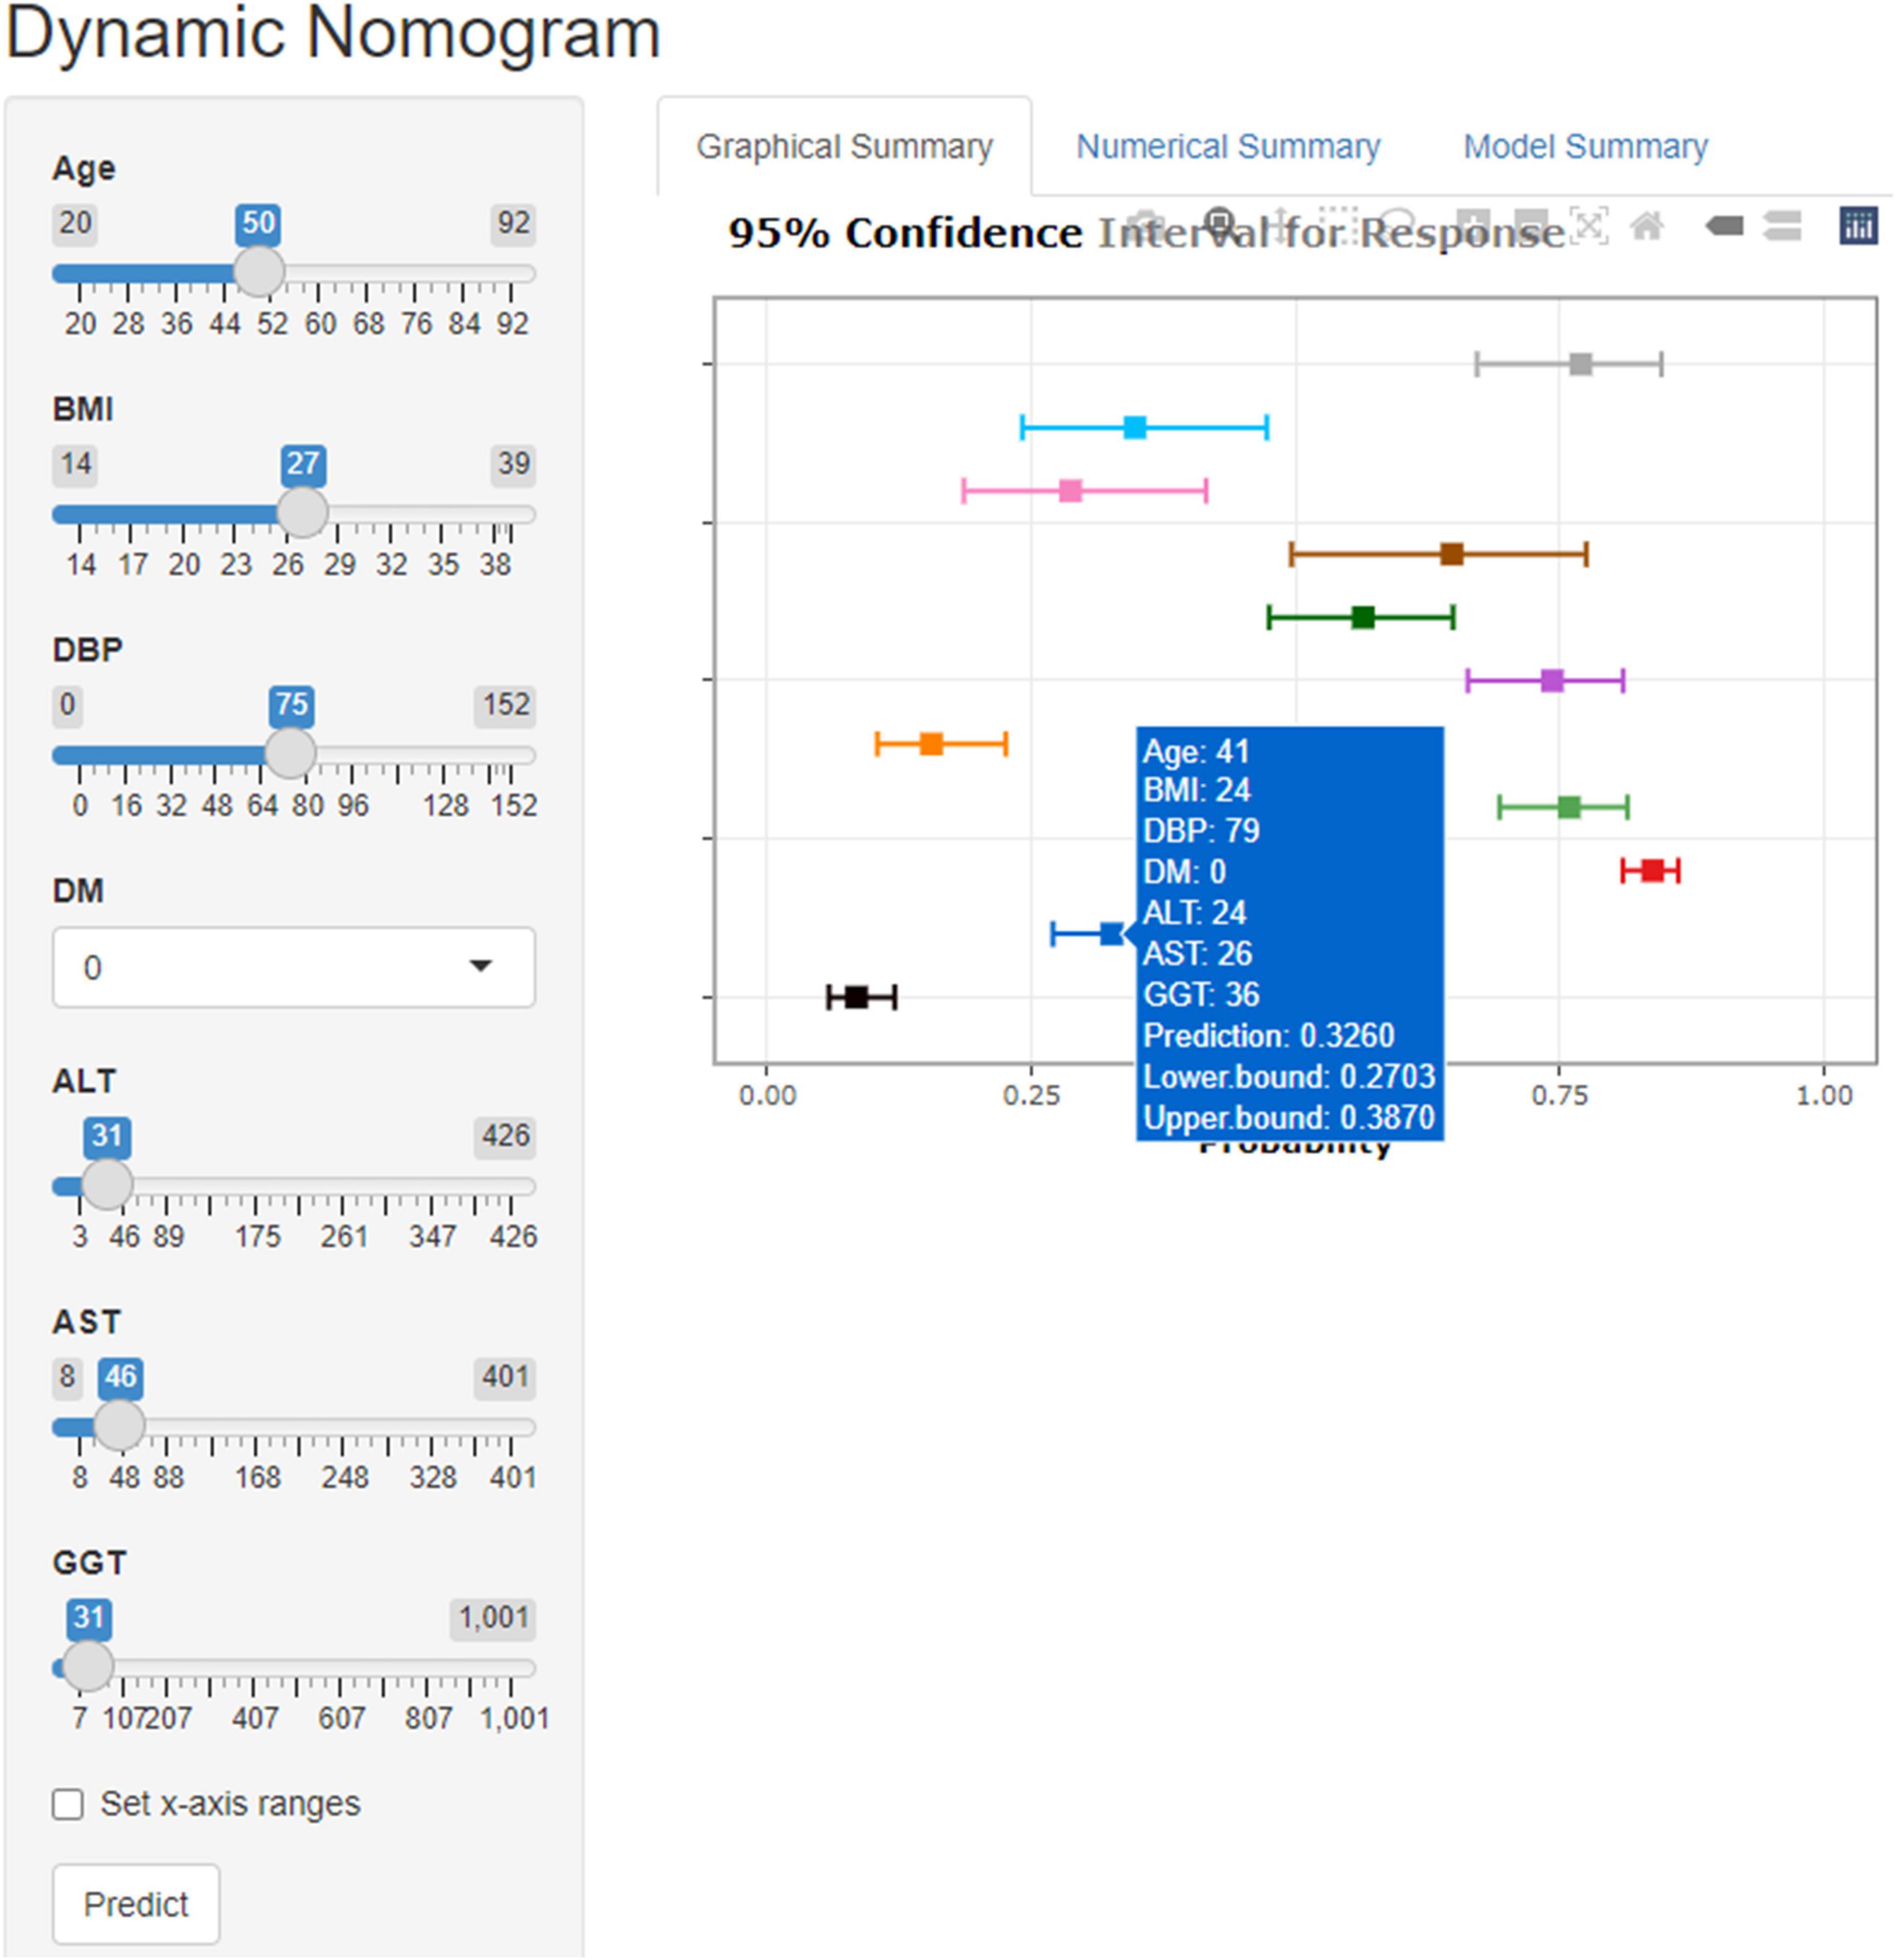
Figure 4. The web version of the dynamic nomogram.
Validation of predictive models
The C-index and area under the ROC curve (AUC) were used to assess the discriminatory ability of the risk model. The C-index was 0.961 (0.953–0.969), 0.953 (0.939–0.967), and 0.930 (0.920–0.940) in the training, internal validation, and external validation sets, respectively (Table 5), whereas the AUC was 0.961, 0.953, and 0.930, respectively (Figure 5).
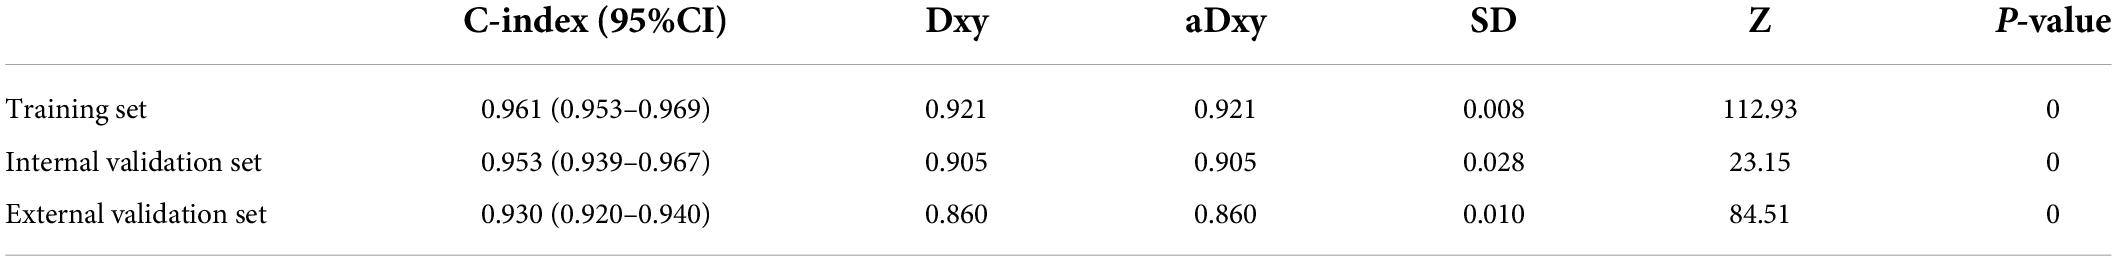
Table 5. C-index in the study cohort.
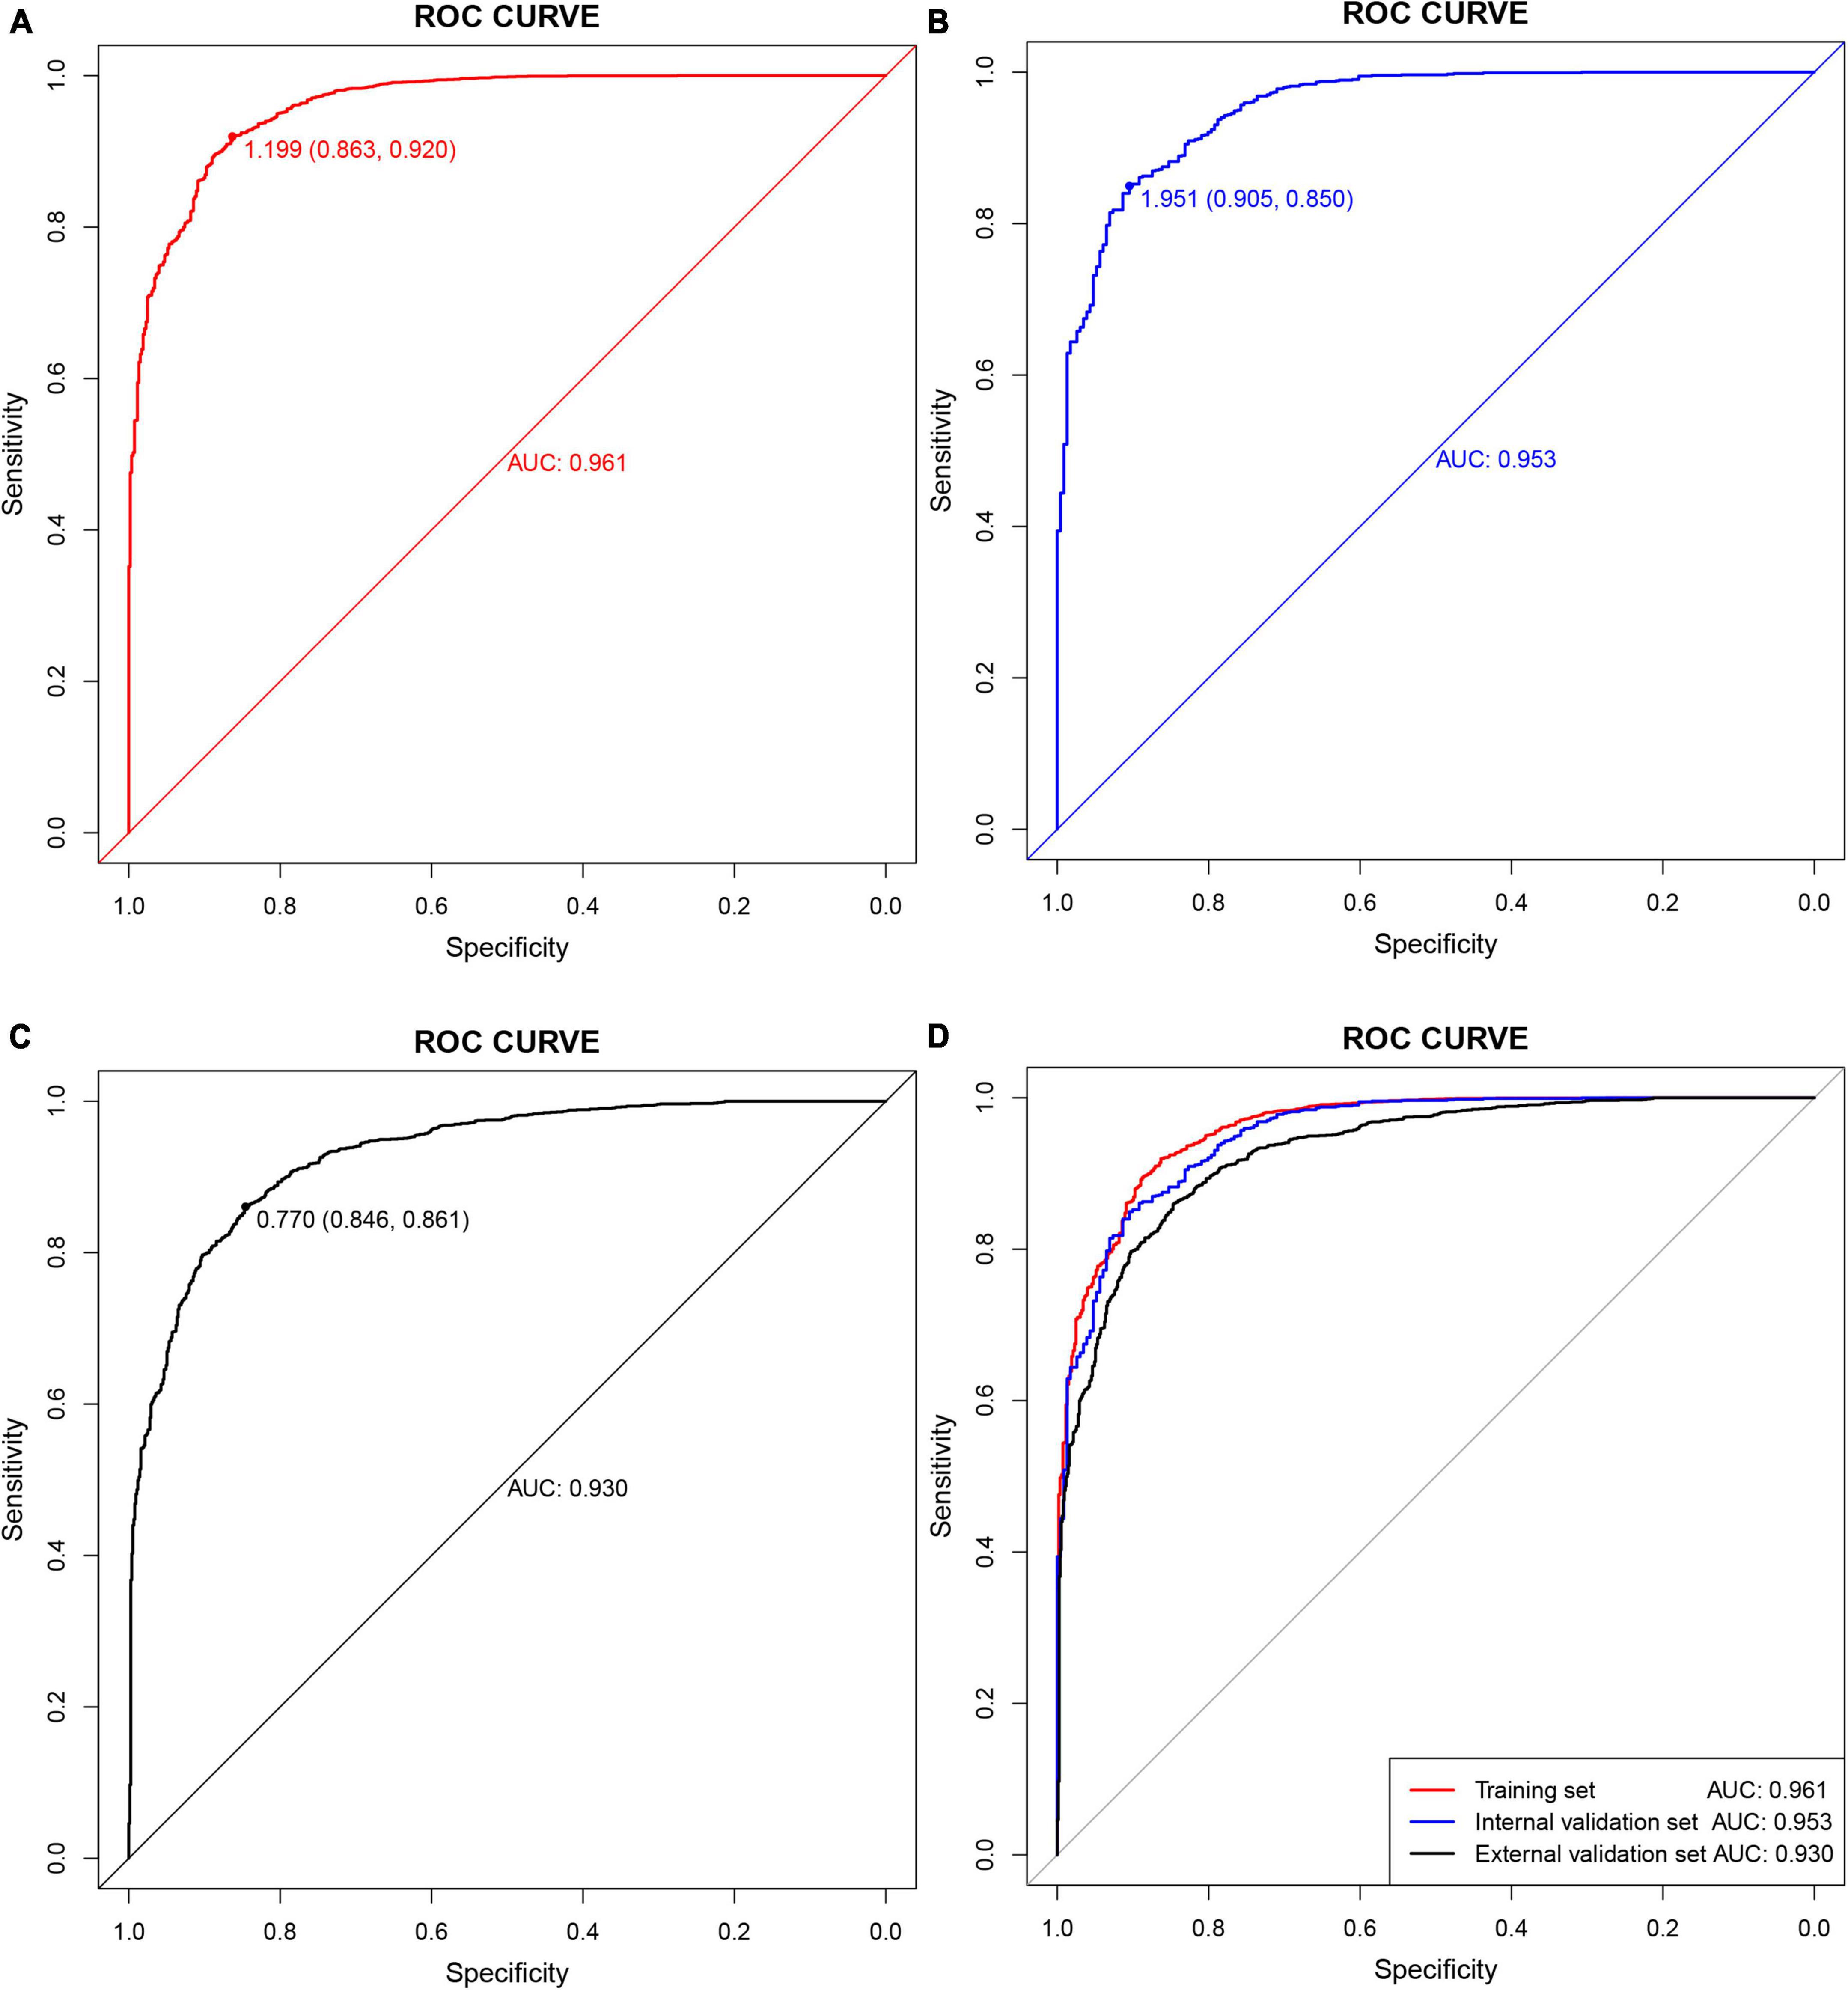
Figure 5. Receiver operating characteristic (ROC) curves. (A) Training set; (B) internal validation set; (C) external validation set; (D) all sets.
From the calibration curves, we observed that the predicted values were very close to the theoretical values in the training, internal validation, and external validation sets, showing a very good fit (Figure 6), which was further confirmed by the Hosmer-Lemeshow test (P > 0.05) (Table 6).
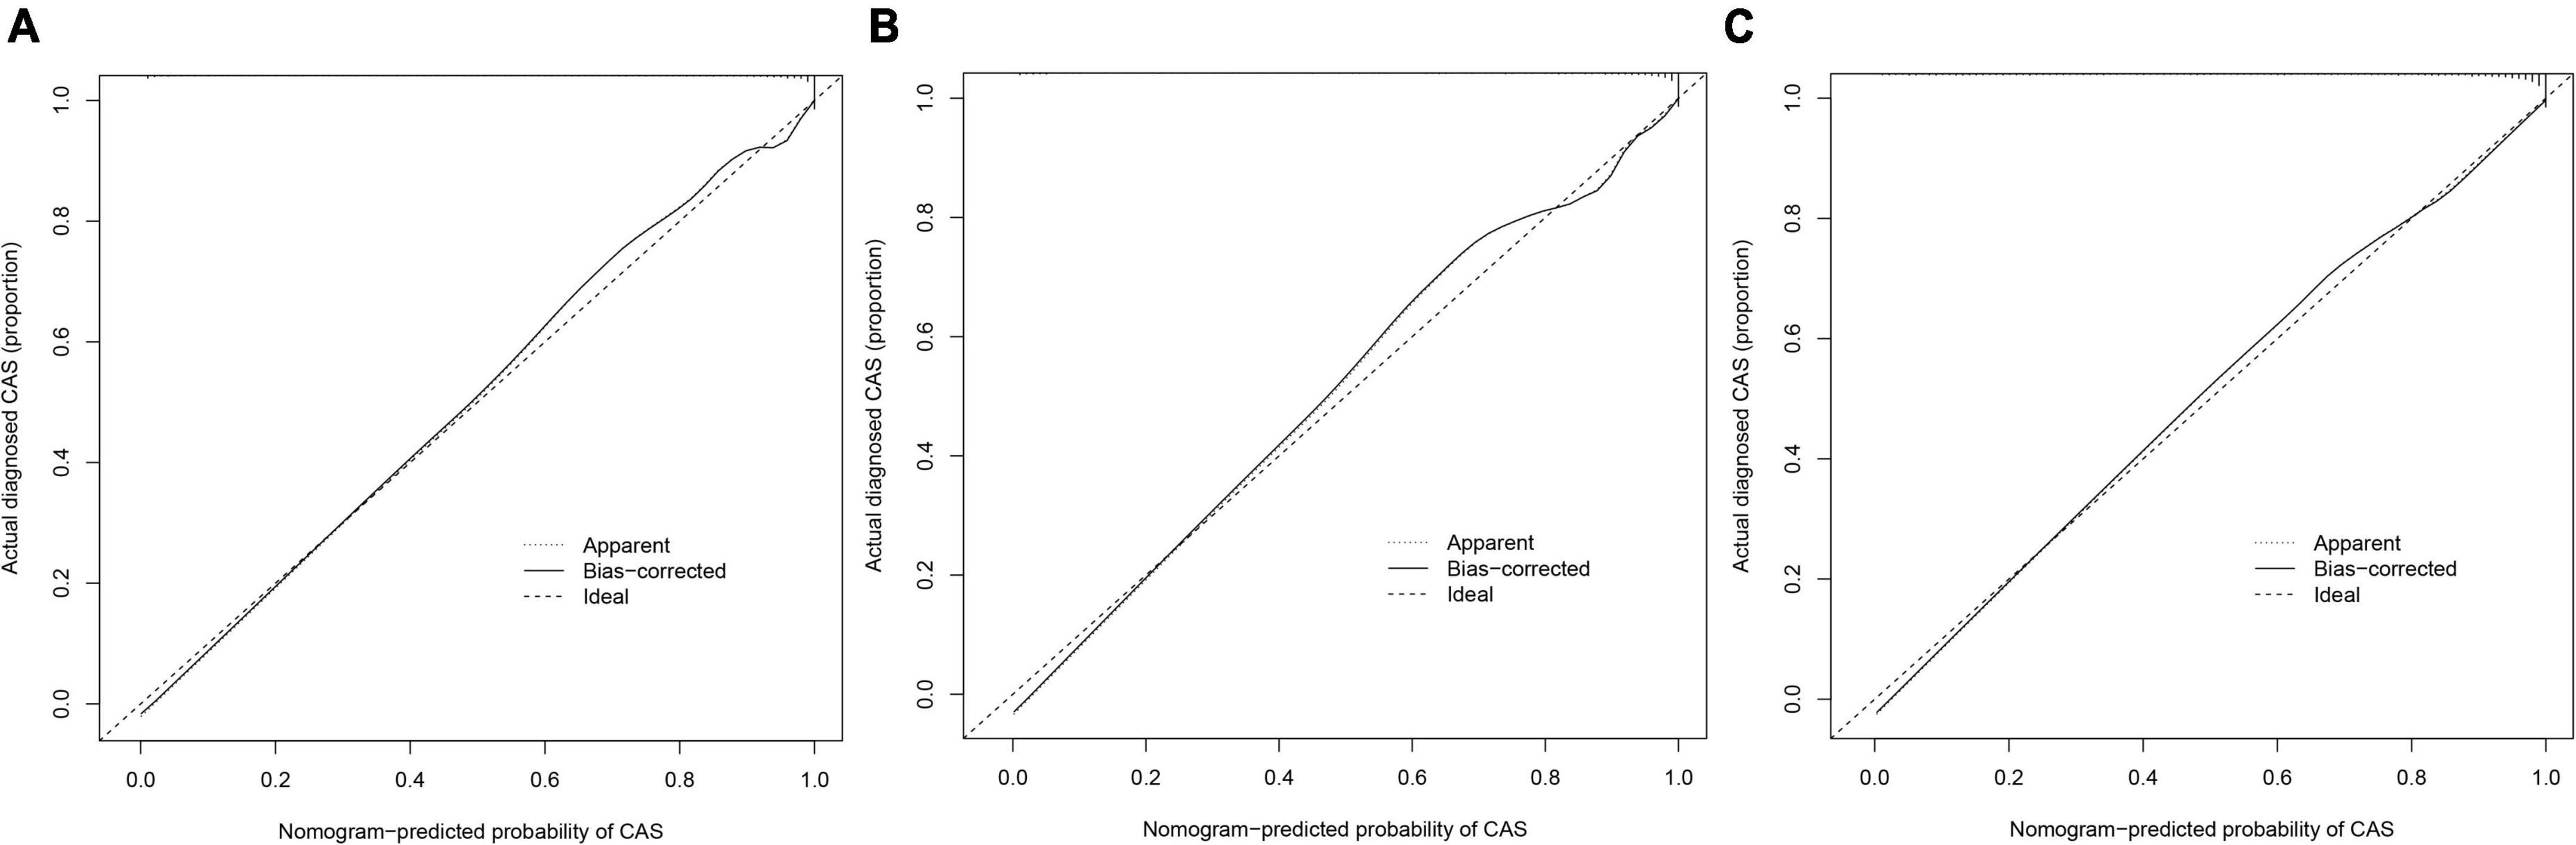
Figure 6. Calibration curves. The x-axis represents the predicted CAS risk. The y-axis represents the actual diagnosed CAS. The diagonal dotted line represents a perfect prediction by an ideal model. The solid line represents the performance of the nomogram, of which a closer fit to the diagonal dotted line represents a better prediction. (A) Training set; (B) internal validation set; (C) external validation set.
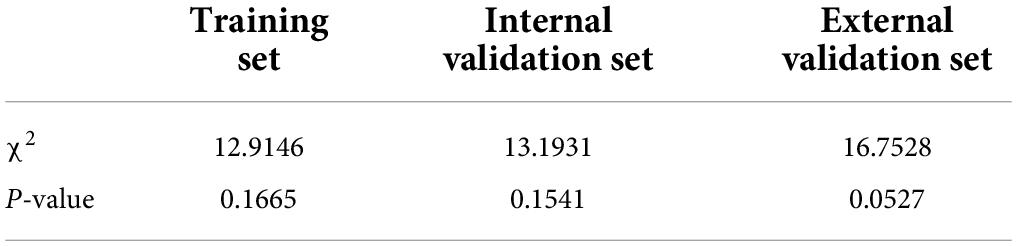
Table 6. Hosmer–Lemeshow test.
Decision curve analysis is often used to assess the clinical applicability of risk-prediction models. Figure 7 shows that the risk threshold probabilities for the training, internal validation, and external validation sets were 1–100%, suggesting that the risk prediction model is beneficial in this range.
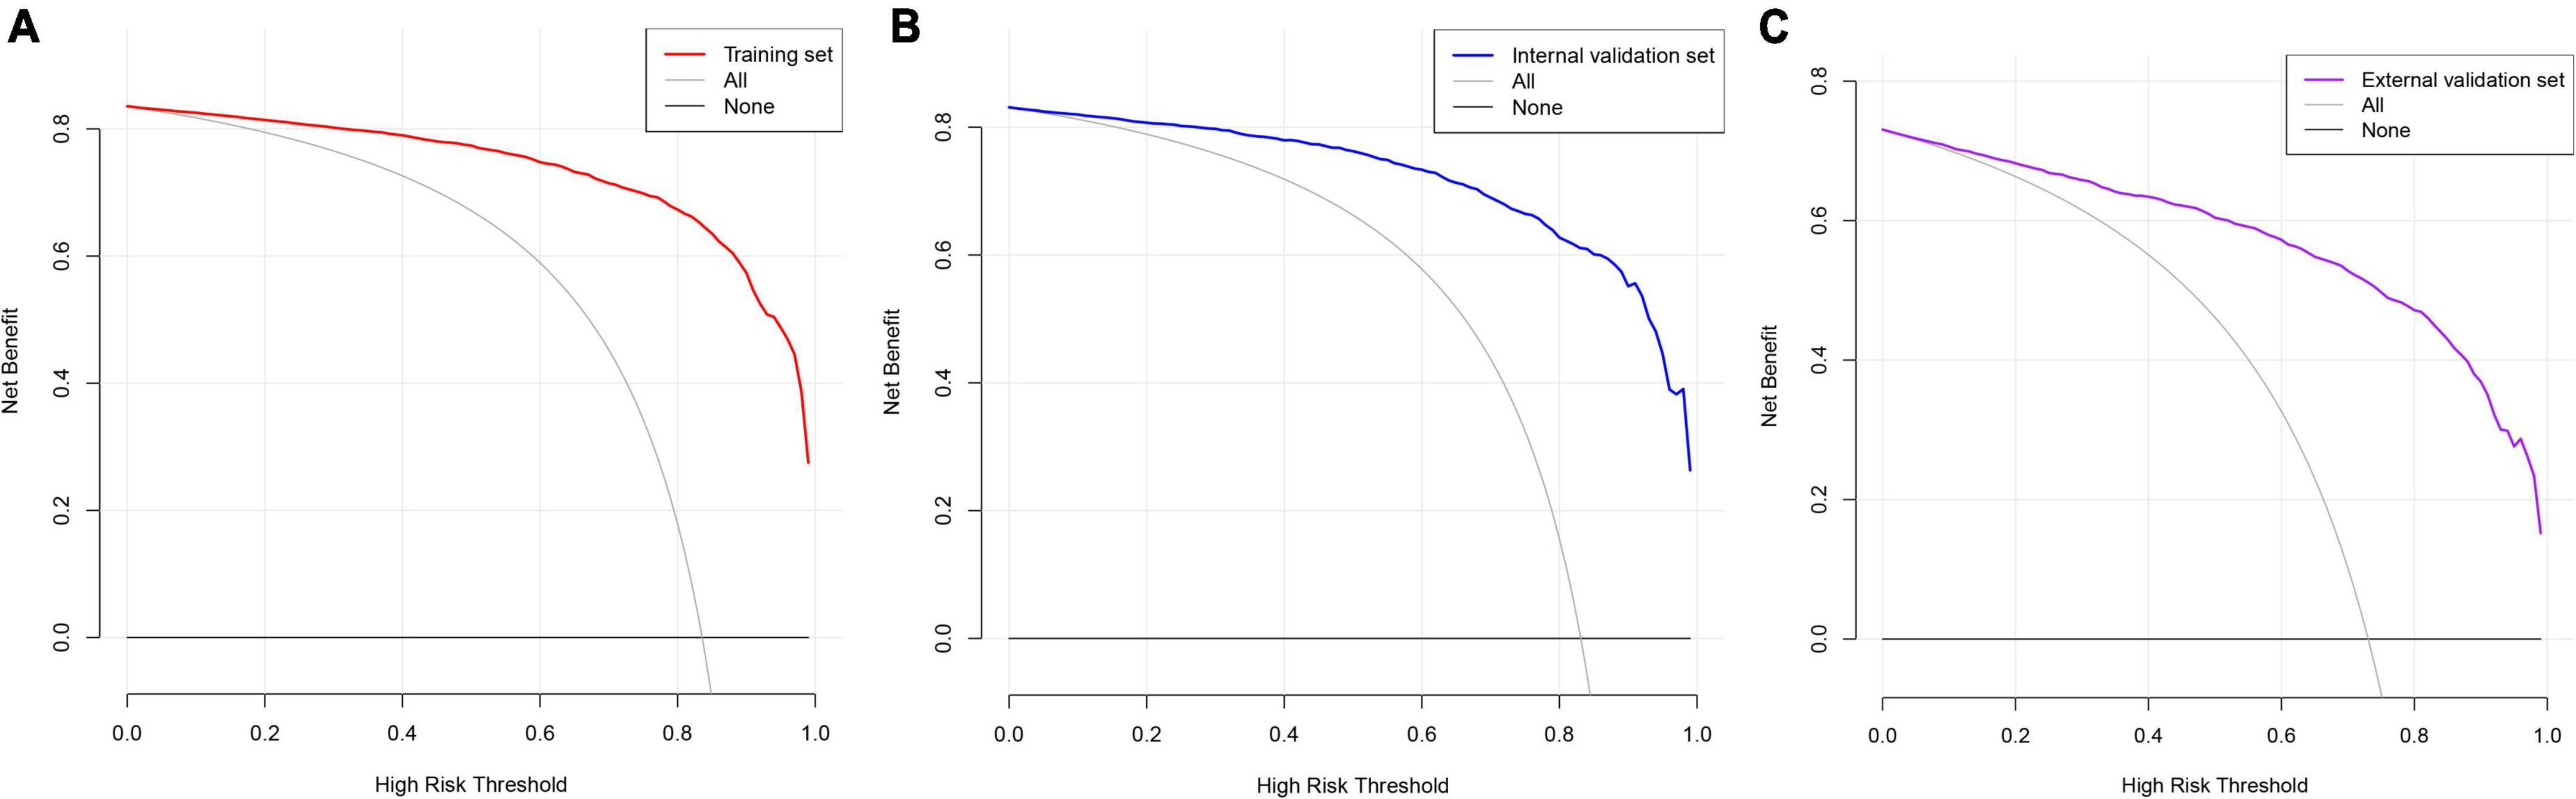
Figure 7. Decision curve analysis. The black straight line represents the net benefit when none of the participants are considered to develop CAS, while the light gray curve represents the net benefit when all participants are considered to develop CAS. The area between the color (red, blue, and purple) curve and the light gray curve in the model curve indicates the clinical utility of the model. (A) Training set; (B) internal validation set; (C) external validation set.
Discussion
With the popularity of ultrasound in health checkups, CAS detection rate is gradually increasing. The carotid ultrasound CAS detection rate in 2020 was 83.4% (3,813) compared to 73.1% (2,039) in 2015 (external validation set) at Zhenhai Lianhua Hospital in Ningbo, China. Age (odds ratio [OR]: 1.249 [1.225–1.274], P < 0.001), BMI (OR: 1.221 [1.156–1.291], P < 0.001), DBP (OR: 1.029 [1.008–1.048], P < 0.01), WBC (OR: 1.121 [1.018–1.236], P < 0.05), MPV (OR: 0.844 [0.738–0.966], P < 0.05), ALT (OR: 1.036 [1.020–1.053], P < 0.001), AST (OR: 0.964 [0.947–0.984], P < 0.001), GGT (OR: 1.007 [1.003–1.013], P < 0.05) were identified as independent risk factors for CAS. After removing the low-weight variables, age, BMI, DBP, DM, ALT, AST, and GGT were filtered out to design risk prediction models. The prediction model showed excellent clinical differentiation with C-indexes of 0.961 (0.953–0.969), 0.953 (0.939–0.967), and 0.930 (0.920–0.940) and degrees of fit in the training, internal validation, and external validation sets, respectively. In addition, DCA showed that the prediction model could benefit people with a risk threshold of 1%–100%.
Our study showed that age and DBP were risk factors for CAS, consistent with previous studies (4, 16). Previous studies have shown that BMI and abnormal lipid metabolism are closely related (17, 18) and are an important cause of CAS. This study found BMI to be an independent risk factor for CAS, consistent with a national cross-sectional study in China (11). However, a study in Iceland showed a negative association between BMI and CAS, which may be related to geographic location, ethnicity, diet, and lifestyle (19). Consistent with previous studies (20), we also found WBC count to be an independent risk factor for CAS in our study. CAS is gradually gaining acceptance as an inflammation-associated disease, and studies have shown that inflammatory markers such as interleukin 6 and C-reactive protein are serum markers of CAS (21). In addition, a randomized controlled trial has shown that anti-inflammatory therapy helps reduce the incidence of major cardiovascular adverse events (22). As the pathological basis of atherosclerosis, platelets promote the development and progression of atherosclerosis (23), which was also observed in our study. AST, ALT, and GGT levels are commonly used as indicators of liver dysfunction in clinical practice. In recent years, there has been an increasing number of studies on liver enzymes and cardiovascular risk, and a prospective meta-analysis revealed ALT and GGT levels in relation to cardiovascular disease risk (24). A study by Abdou et al. (25) based on a small sample of abdominally obese people (50) showed that AST was negatively associated with CAS; however, in our study, it was the opposite. A study in rural northeastern China showed that higher levels of education and income were associated with a lower risk of CAS (P < 0.05), although this relationship was absent after correction for confounders (26). The role of exercise in CAS remains controversial. A 6-year clinical trial showed that aerobic physical activity did not slow the progression of CAS (27) and might contribute to carotid endothelial injury (28). However, some studies have shown that lack of exercise is a risk factor for CAS (11, 26), and aerobic exercise could help combat carotid intima-media thickening in obese patients (29). In addition, a study in China showed that geographic location (rural areas) is associated with CAS (11).
Early identification and prevention of CAS are essential in reducing adverse cerebrovascular disease occurrence. The diagnosis of CAS in clinical practice relies mainly on carotid ultrasonography. However, there are still difficulties in the large-scale availability of ultrasound in health checkups owing to limited medical resources. The development of risk prediction models provides an alternative method for CAS detection that could benefit populations in less medically developed regions or countries. In addition, risk models could help physicians selectively perform further tests, which is beneficial in terms of saving health care resources. Xing et al. (30) constructed a risk prediction model for atherosclerosis in a systemic lupus erythematosus population based on RNA sequencing, and the model exhibited excellent clinical predictive value (AUC:0.922). However, this model has some limitations. First, the study’s sample size was limited (67); furthermore, it was not validated with internal and external samples, and the cost of RNA sequencing in atherosclerosis diagnosis was too high. In addition, an atherosclerosis prediction was constructed based on operational research (31), but it is too obscure and clinically inoperative.
Data mining in big clinical data provides technical support for establishing risk-prediction models (32). Nomograms can generate individual probabilities of clinical events by integrating different outcome and predictor variables and merging biological information with clinical prediction models (33–35). In recent years, it has been widely used as a prediction method in clinical settings (36, 37), and it plays a role in promoting personalized medicine (38, 39) and facilitates physicians in predicting disease risk (40). There have been many studies on CAS prevalence and risk factors (4, 41), but few studies on CAS risk-prediction models have been reported. LASSO is a widely used algorithm in machine learning to filter characteristics and interpretable predictors from a large number of potentially co-linear variables by constructing a penalty function (42, 43). LASSO combined with 10-fold cross-validation was used to screen for the characteristic variables associated with CAS. After several modeling attempts, we removed weakly weighted variables in the model (points < 20). Ultimately, 7 clinically common indicators, including age, BMI, DBP, DM, ALT, AST, and GGT, were screened as predictors to construct a risk prediction model. A network computer (dynamic nomogram) was developed to increase the tractability of the model. Our risk prediction model showed a high predictive value and clinical applicability, which might be useful for CAS screening in developing countries, including China.
This study has some inevitable limitations. First, the inclusion of the study population was regional, which may have affected the extrapolation of the prediction model. Second, the collection of clinical baseline data was not sufficiently comprehensive, and potential clinical predictors may have been overlooked. Third, the prediction models were constructed based on cross-sectional studies, and the stability of the models must be tested in clinical practice. In future studies, we will cooperate with multiple centers to continuously test and revise the prediction model during clinical practice and further improve its extrapolation of the prediction model.
Conclusion
This study identified eight CAS-associated independent risk factors, including age, BMI, DBP, WBC, MPV, ALT, AST, and GGT, based on the Chinese population. Meanwhile, we developed risk models for identifying individuals at high risk of CAS, which is important for preventing and reducing adverse prognostic events.
Data availability statement
The original contributions presented in this study are included in the article, further inquiries can be directed to the corresponding author.
Ethics statement
The study was approved by the ethics committee of the Affiliated Hospital of Medical School, Ningbo University, Ningbo, China (KY20191114). The patients/participants provided their written informed consent to participate in this study.
Author contributions
GH conceived and designed the research and drafted the manuscript. GH and QJ did the statistical analysis. GH and XT took part in the discussion. YM revised the manuscript. All authors read and approved the final manuscript.
Funding
This work was supported by the Grant of Zhejiang Medicine and Health Technology Project, China (Nos. 2018ZH029 and 2020KY871), Major Project for Science and Technology Innovation 2025 in Ningbo, China (No. 2019B10035), Grant of Ningbo Social Development, China (No. 2019C50080), and NINGBO Medical and Health Leading Academic Discipline Project (No. 2022-F24).
Acknowledgments
We thank Zhongwei Zhu of Ningbo Zhenhai Lianhua Hospital for his long-term support of this study.
Conflict of interest
The authors declare that the research was conducted in the absence of any commercial or financial relationships that could be construed as a potential conflict of interest.
Publisher’s note
All claims expressed in this article are solely those of the authors and do not necessarily represent those of their affiliated organizations, or those of the publisher, the editors and the reviewers. Any product that may be evaluated in this article, or claim that may be made by its manufacturer, is not guaranteed or endorsed by the publisher.
Footnotes
References
1. Herrington W, Lacey B, Sherliker P, Armitage J, Lewington S. Epidemiology of atherosclerosis and the potential to reduce the global burden of atherothrombotic disease. Circ Res. (2016) 118:535–46. doi: 10.1161/CIRCRESAHA.115.307611
2. Spanos K, Petrocheilou G, Karathanos C, Labropoulos N, Mikhailidis D, Giannoukas A. Carotid bifurcation geometry and atherosclerosis. Angiology. (2017) 68:757–64. doi: 10.1177/0003319716678741
3. Meng XF, Liu GM, Wang XL, Xu Q. [Analysis of carotid atherosclerosis and related risk factors in a university physical examination population in Beijing]. Zhonghua Yi Xue Za Zhi. (2017) 97:2620–4. doi: 10.3760/cma.j.issn.0376-2491.2017.33.014
4. Song P, Fang Z, Wang H, Cai Y, Rahimi K, Zhu Y, et al. Global and regional prevalence, burden, and risk factors for carotid atherosclerosis: a systematic review, meta-analysis, and modelling study. Lancet Glob Health. (2020) 8:e721–9. doi: 10.1016/S2214-109X(20)30117-0
5. Paul S, Candelario-Jalil E. Emerging neuroprotective strategies for the treatment of ischemic stroke: an overview of clinical and preclinical studies. Exp Neurol. (2021) 335:113518. doi: 10.1016/j.expneurol.2020.113518
6. Gokaldas R, Singh M, Lal S, Benenstein RJ, Sahni R. Carotid stenosis: from diagnosis to management, where do we stand? Curr Atheroscler Rep. (2015) 17:480. doi: 10.1007/s11883-014-0480-7
7. Martinez E, Martorell J, Riambau V. Review of serum biomarkers in carotid atherosclerosis. J Vasc Surg. (2020) 71:329–41. doi: 10.1016/j.jvs.2019.04.488
8. Gresele P, Paciullo F, Migliacci R. Antithrombotic treatment of asymptomatic carotid atherosclerosis: a medical dilemma. Intern Emerg Med. (2020) 15:1169–81. doi: 10.1007/s11739-020-02347-7
9. Paraskevas KI, Veith FJ, Eckstein H-H, Ricco J-B, Mikhailidis DP. Cholesterol, carotid artery disease and stroke: what the vascular specialist needs to know. Ann Transl Med. (2020) 8:1265. doi: 10.21037/atm.2020.02.176
10. Ji X, Leng X-Y, Dong Y, Ma Y-H, Xu W, Cao X-P, et al. Modifiable risk factors for carotid atherosclerosis: a meta-analysis and systematic review. Ann Transl Med. (2019) 7:632. doi: 10.21037/atm.2019.10.115
11. Wang X, Li W, Song F, Wang L, Fu Q, Cao S, et al. Carotid atherosclerosis detected by ultrasonography: a national cross-sectional study. J Am Heart Assoc. (2018) 7:e008701. doi: 10.1161/JAHA.118.008701
12. Xu L, Xie J, Chen S, Chen Y, Yang H, Miao M, et al. Light-to-moderate alcohol consumption is associated with increased risk of Type 2 diabetes in individuals with nonalcoholic fatty liver disease: a nine-year cohort study. Am J Gastroenterol. (2020) 115:876–84. doi: 10.14309/ajg.0000000000000607
13. Huang H, Wang J, Xu L, Miao M, Xu C. Association between high-density lipoprotein cholesterol to apolipoprotein A-I ratio and nonalcoholic fatty liver disease: a cross-sectional study. Int J Endocrinol. (2021) 2021:6676526. doi: 10.1155/2021/6676526
14. Mao Y-S, Liu Z-M, Chen C-X, Zhu Z-W, Hong Z-L. Ningbo thyroid dysfunction prevalence study: a cross-sectional survey in an employees-cohort. Chin Med J (Engl). (2010) 123:1673–8.
15. Lyu J, Li Z, Wei H, Liu D, Chi X, Gong D-W, et al. A potent risk model for predicting new-onset acute coronary syndrome in patients with type 2 diabetes mellitus in Northwest China. Acta Diabetol. (2020) 57:705–13. doi: 10.1007/s00592-020-01484-x
16. de Weerd M, Greving JP, de Jong AWF, Buskens E, Bots ML. Prevalence of asymptomatic carotid artery stenosis according to age and sex: systematic review and metaregression analysis. Stroke. (2009) 40:1105–13. doi: 10.1161/STROKEAHA.108.532218
17. Mota dos Santos C, Sá Silva C, César de Araújo E, Kruze Grande de Arruda I, da Silva Diniz A, Coelho Cabral P. [Lipid and glucose profiles in outpatients and their correlation with anthropometric indices]. Rev Port Cardiol. (2013) 32:35–41. doi: 10.1016/j.repc.2012.05.017
18. Zaid M, Ameer F, Munir R, Rashid R, Farooq N, Hasnain S, et al. Anthropometric and metabolic indices in assessment of type and severity of dyslipidemia. J Physiol Anthropol. (2017) 36:19. doi: 10.1186/s40101-017-0134-x
19. Sturlaugsdottir R, Aspelund T, Bjornsdottir G, Sigurdsson S, Thorsson B, Eiriksdottir G, et al. Prevalence and determinants of carotid plaque in the cross-sectional REFINE-Reykjavik study. BMJ Open. (2016) 6:e012457. doi: 10.1136/bmjopen-2016-012457
20. Ortega E, Gilabert R, Nuñez I, Cofán M, Sala-Vila A, de Groot E, et al. White blood cell count is associated with carotid and femoral atherosclerosis. Atherosclerosis. (2012) 221:275–81. doi: 10.1016/j.atherosclerosis.2011.12.038
21. Ammirati E, Moroni F, Norata GD, Magnoni M, Camici PG. Markers of inflammation associated with plaque progression and instability in patients with carotid atherosclerosis. Mediators Inflamm. (2015) 2015:718329. doi: 10.1155/2015/718329
22. Ridker PM, Everett BM, Thuren T, MacFadyen JG, Chang WH, Ballantyne C, et al. Antiinflammatory therapy with canakinumab for atherosclerotic disease. N Engl J Med. (2017) 377:1119–31. doi: 10.1056/NEJMoa1707914
23. Nording H, Baron L, Langer HF. Platelets as therapeutic targets to prevent atherosclerosis. Atherosclerosis. (2020) 307:97–108. doi: 10.1016/j.atherosclerosis.2020.05.018
24. Kunutsor SK, Apekey TA, Khan H. Liver enzymes and risk of cardiovascular disease in the general population: a meta-analysis of prospective cohort studies. Atherosclerosis. (2014) 236:7–17. doi: 10.1016/j.atherosclerosis.2014.06.006
25. Abdou AS, Magour GM, Mahmoud MM. Evaluation of some markers of subclinical atherosclerosis in Egyptian young adult males with abdominal obesity. Br J Biomed Sci. (2009) 66:143–7. doi: 10.1080/09674845.2009.11730261
26. Xing L, Li R, Zhang S, Li D, Dong B, Zhou H, et al. High burden of carotid atherosclerosis in rural northeast China: a population-based study. Front Neurol. (2021) 12:597992. doi: 10.3389/fneur.2021.597992
27. Rauramaa R, Halonen P, Väisänen SB, Lakka TA, Schmidt-Trucksäss A, Berg A, et al. Effects of aerobic physical exercise on inflammation and atherosclerosis in men: the DNASCO Study: a six-year randomized, controlled trial. Ann Intern Med. (2004) 140:1007–14. doi: 10.7326/0003-4819-140-12-200406150-00010
28. Marchio P, Guerra-Ojeda S, Vila JM, Aldasoro M, Valles SL, Soler C, et al. Chronic exercise impairs nitric oxide pathway in rabbit carotid and femoral arteries. J Physiol. (2018) 596:4361–74. doi: 10.1113/JP275611
29. Kim DK, Jee JH, Park WH. Effects of aerobic and resistance exercise training on carotid intima-media thickness in abdominal obese women. Metab Syndr Relat Disord. (2021) 19:200–4. doi: 10.1089/met.2020.0118
30. Xing H, Pang H, Du T, Yang X, Zhang J, Li M, et al. Establishing a risk prediction model for atherosclerosis in systemic lupus erythematosus. Front Immunol. (2021) 12:622216. doi: 10.3389/fimmu.2021.622216
31. Chen Z, Yang M, Wen Y, Jiang S, Liu W, Huang H. Prediction of atherosclerosis using machine learning based on operations research. Math Biosci Eng. (2022) 19:4892–910. doi: 10.3934/mbe.2022229
32. Wu W-T, Li Y-J, Feng A-Z, Li L, Huang T, Xu A-D, et al. Data mining in clinical big data: the frequently used databases, steps, and methodological models. Mil Med Res. (2021) 8:44. doi: 10.1186/s40779-021-00338-z
33. Balachandran VP, Gonen M, Smith JJ, DeMatteo RP. Nomograms in oncology: more than meets the eye. Lancet Oncol. (2015) 16:e173–80. doi: 10.1016/S1470-2045(14)71116-7
34. Jiang F, Yu X, Wu C, Wang M, Wei K, Wang J, et al. A simple-to-use nomogram for predicting survival in children with acute myeloid leukemia. Biomed Res Int. (2021) 2021:7264623. doi: 10.1155/2021/7264623
35. Jiang F, Wei K, Lyu W, Wu C. Predicting risk of insulin resistance in a Chinese population with polycystic ovary syndrome: designing and testing a new predictive nomogram. Biomed Res Int. (2020) 2020:8031497. doi: 10.1155/2020/8031497
36. Wu Y, Hu H, Cai J, Chen R, Zuo X, Cheng H, et al. A prediction nomogram for the 3-year risk of incident diabetes among Chinese adults. Sci Rep. (2020) 10:21716. doi: 10.1038/s41598-020-78716-1
37. Wu J, Zhang H, Li L, Hu M, Chen L, Xu B, et al. A nomogram for predicting overall survival in patients with low-grade endometrial stromal sarcoma: a population-based analysis. Cancer Commun (Lond). (2020) 40:301–12. doi: 10.1002/cac2.12067
38. Shi R, Zhang T, Sun H, Hu F. Establishment of clinical prediction model based on the study of risk factors of stroke in patients with Type 2 diabetes mellitus. Front Endocrinol (Lausanne). (2020) 11:559. doi: 10.3389/fendo.2020.00559
39. Li W, Wang H, Dong S, Tang Z-R, Chen L, Cai X, et al. Establishment and validation of a nomogram and web calculator for the risk of new vertebral compression fractures and cement leakage after percutaneous vertebroplasty in patients with osteoporotic vertebral compression fractures. Eur Spine J. (2022) 31:1108–21. doi: 10.1007/s00586-021-07064-z
40. Dong S, Li W, Tang Z-R, Wang H, Pei H, Yuan B. Development and validation of a novel predictive model and web calculator for evaluating transfusion risk after spinal fusion for spinal tuberculosis: a retrospective cohort study. BMC Musculoskelet Disord. (2021) 22:825. doi: 10.1186/s12891-021-04715-6
41. Song P, Xia W, Zhu Y, Wang M, Chang X, Jin S, et al. Prevalence of carotid atherosclerosis and carotid plaque in Chinese adults: a systematic review and meta-regression analysis. Atherosclerosis. (2018) 276:67–73. doi: 10.1016/j.atherosclerosis.2018.07.020
42. Friedman J, Hastie T, Tibshirani R. Regularization paths for generalized linear models via coordinate descent. J Stat Softw. (2010) 33:1–22.
Keywords: carotid atherosclerosis, independent risk factors, prediction model, early diagnosis, nomogram
Citation: Huang G, Jin Q, Tian X and Mao Y (2022) Development and validation of a carotid atherosclerosis risk prediction model based on a Chinese population. Front. Cardiovasc. Med. 9:946063. doi: 10.3389/fcvm.2022.946063
Received: 17 May 2022; Accepted: 08 July 2022;
Published: 02 August 2022.
Edited by:
Qingpeng Zihang, City University of Hong Kong, Hong Kong SAR, ChinaReviewed by:
Feng Jiang, Fudan University, ChinaZhiri Tang, City University of Hong Kong, Hong Kong SAR, China
Jun Lyu, First Affiliated Hospital of Jinan University, China
Zetian Jia, Second Hospital of Hebei Medical University, China
Copyright © 2022 Huang, Jin, Tian and Mao. This is an open-access article distributed under the terms of the Creative Commons Attribution License (CC BY). The use, distribution or reproduction in other forums is permitted, provided the original author(s) and the copyright owner(s) are credited and that the original publication in this journal is cited, in accordance with accepted academic practice. No use, distribution or reproduction is permitted which does not comply with these terms.
*Correspondence: Yushan Mao, bWFveXVzaGFuQG5idS5lZHUuY24=