 Ke Yun1,2†
 Shuang Zhang1,2,3,4Xiaotao Yang1,2Dongliang Man1,2Jialiang Yao1,2Wei Wang5*Xiaoxu Han1,2,3,4*†
- 1National Clinical Research Center for Laboratory Medicine, The First Affiliated Hospital of China Medical University, Shenyang, China
- 2Department of Laboratory Medicine, The First Affiliated Hospital of China Medical University, Shenyang, China
- 3Units of Medical Laboratory, Chinese Academy of Medical Sciences, Shenyang, China
- 4NHC Key Laboratory of AIDS Immunology, China Medical University, Shenyang, China
- 5Department of Physical Examination Center, The First Affiliated Hospital of China Medical University, Shenyang, China
Background: Dyslipidemia is a significant threat to global public health due to its pivotal role as a cardiovascular disease (CVD) risk factor. Calcium is a critical nutritional element required for electrical signal transduction and muscle and heart function, and calcium supplementation is widespread in the general population. However, associations between serum calcium and serum lipid profiles remain conflicting. Considering ionized calcium [Ca(2+)] is the best measure of active serum calcium and the lack of Ca(2+) analyzers, we aimed to examine the independent and joint associations between serum ionized calcium corrected by albumin ([Ca2+]corr) and the known modifiable risk factors and dyslipidemia.
Methods: We collected physical examination records, including demographic, anthropometric, laboratory tests, and clinical characteristics from individuals who had health checkups in 2019 at the health examination center of the First Affiliated Hospital of China Medical University. Subjects were categorized into Q1–Q4 groups using [Ca2+]corr quartiles, and odds ratios (ORs) with 95% confidence intervals (CIs) for dyslipidemia and associated components were calculated using logistic regression. We also performed non-linear and threshold effect analyses of [Ca2+]corr and triglyceride (TG), total cholesterol (TC), high-density lipoprotein cholesterol (HDL-C), low-density lipoprotein cholesterol (LDL-C), and non-high-density lipoprotein cholesterol (Non-HDL-C) levels.
Findings: Of 5,416 individuals aged 18–92 years, multivariable-adjusted models showed that ORs for dyslipidemia increased gradually with elevated [Ca2+]corr levels. Logistic regression analyses demonstrated that [Ca2+]corr levels were associated with the increased odds of dyslipidemia (per 1 mmol/L increase: OR = 3.53, 95% CI: 1.56–8.00, P < 0.001). When compared with individuals in the Q1 group, those in groups Q3 and Q4 had significantly higher dyslipidemia odds (ORQ3 vs. Q1 = 1.20, 95% CI: 1.01–1.42; ORQ4 vs. Q1 = 1.31, 95% CI: 1.10–1.56, all P < 0.05). Furthermore, a linear, positive relationship between [Ca2+]corr levels and dyslipidemia odds was observed (P for non-linear trend = 0.506), and the optimal cut-off point of [Ca2+]corr for dyslipidemia management was 2.26 mmol/L. A modifiable effect of albumin on the relationship between [Ca2+]corr and dyslipidemia odds was also found (P for interaction = 0.014). High [Ca2+]corr levels were positively associated with elevated TC, LDL-C, and Non-HDL-C but inversely associated with decreased HDL-C odds. Moreover, Locally weighted regression (Loess) analyses showed a non-linear, positive relationship between [Ca2+]corr and TG, TC, HDL-C, LDL-C, and Non-HDL-C levels.
Interpretation: Corrected serum ionized calcium was positively associated with increased odds of dyslipidemia and elevated TC, LDL-C, and Non-HDL-C, but inversely associated with the odds of decreased HDL-C.
Introduction
Dyslipidemia is a significant threat to global public health due to its pivotal role in cardiovascular disease (CVD) (1, 2). The condition is characterized by one or more metabolic disorders involving triglycerides (TG), total cholesterol (TC), high-density lipoprotein cholesterol (HDL-C), and low-density lipoprotein cholesterol (LDL-C) (3). With accelerated urbanization, industrialization, and westernized lifestyles, China rapidly encounters a heavy burden of serum lipid disorders. A national survey in China, including 163,641 adults, showed that the prevalence of high TC, high LDL-C, low HDL-C, and high TG was 6.9, 8.1, 20.4, and 13.8% in China (4). Thus, identifying and quantifying associated risk factors with serum lipids is warranted for the targeted prevention of dyslipidemia and CVD events.
Calcium is a crucial nutritional element required for electrical signal transduction (5) and muscle and heart function, and calcium supplementation is widespread in the general population (6). Some studies reported that appropriate calcium levels were beneficial for fat metabolism (7). However, some other studies suggested calcium may be associated with an increased risk of CVD events (8, 9), such as coronary artery calcification (10). Therefore, the literature on the relationship between serum calcium and serum lipids is inconclusive, and warrants more comprehensive analyses.
Considering ionized calcium (Ca2+) is the best measure of active serum calcium, the formula of albumin corrected serum calcium was used to estimate ionized calcium levels (11). This study investigated whether corrected serum ionized calcium ([Ca2+]corr) was associated with higher odds of dyslipidemia (and associated components), including elevated TG, elevated TC, reduced HDL-C, elevated LDL-C, and elevated Non-HDL-C levels. We sought to ascertain the optimal cut-off value of corrected serum ionized calcium for dyslipidemia odds and investigate the dose-response relationship between corrected serum ionized calcium and serum lipid parameters in Chinese adults.
Materials and Methods
Study Population
We retrospectively collected datasets containing 44,061 subjects’ health check-up medical records in 2019 from the health examination center of the First Affiliated Hospital of China Medical University (Shenyang, China). The database mainly includes medical examination records of employees from different organizations, subjects who are going to work, students who are going to school, and an individual who voluntarily attends a health check-up, etc. The medical examination center offers different medical examination packages, and the physical examination items to be carried out are independently selected by the employees or individual themselves. The health check-up database lacked information on medication use and other diseases that might affect laboratory testing, although few people take medication in the last 3 days of physical examination. The inclusion criteria of the participants included: (1) aged 18 years or older and (2) received serum calcium and serum lipid testing. The exclusion criteria included: (1) participants who lacked serum calcium or serum lipid measurements, (2) individuals aged under 18 years.
Measurements
Selected individuals were assessed for demographics, anthropometrics, laboratory and clinical parameters during their health check-ups. Firstly, a health examination form was used to collect demographics on age and sex. Secondly, height, weight and waist circumstance were measured by trained medical staff; participants wore light clothing and were barefoot. Body mass index (BMI) was then calculated using weight divided by the height squared. Systolic blood pressure (SBP) and diastolic blood pressure (DBP) were measured using an electronic sphygmomanometer while the participant was calmly seated. Thirdly, the subjects were reminded to prepare themselves before the physical examination, including (1) 3 days before the physical examination to pay attention to diet, do not eat too much greasy, indigestible food, and do not drink (2) no water or food on the day of physical examination. Blood samples were taken after an overnight fast in the morning by trained clinical nurses. Samples were centrifuged to separate serum and stored at −80°C until required tests. Collected serum biochemical parameters included serum calcium, fasting serum glucose (FSG), TC, TG, HDL-C, LDL-C, alanine aminotransferase (ALT), aspartate aminotransferase (AST), serum creatinine, serum uric acid, and albumin. Routine blood testing included counts for leucocytes, granulocytes, lymphocytes, monocytes, eosinophils, basophils, and red blood cells (RBC). We also tested hemoglobin concentration (HGB), red blood cell specific volume (HCT), mean corpuscular volume (MCV), mean corpuscular hemoglobin (MCH), mean corpuscular hemoglobin concentration (MCHC), platelet counts (PLT), platelet distribution width (PDW), large platelet ratio (P-LCR), plateletcrit (PCT), and mean platelet volume (MPV). The laboratory indicators were tested using the Roche automatic analyzer (Roche Diagnostics, Mannheim, Germany) for biochemistry parameters and Sysmex hematology analyzers (Sysmex Corporation, Kobe, Japan) for hematologic parameters.
Clinical Definitions
Dyslipidemia was defined by high TC ≥ 5.18 mmol/L (200 mg/dL), and/or high TG ≥ 1.76 mmol/L (150 mg/dL), and/or high LDL-C ≥ 3.37 mmol/L (130 mg/dL), and/or low HDL-C ≤ 1.04 mmol/L (40 mg/dL) according to the guidelines on prevention and management of dyslipidemia in Chinese adults (12). Non-high-density lipoprotein cholesterol (Non-HDL-C) was calculated as TC minus HDL-C. High Non-HDL-C was defined as ≥ 4.1 mmol/L (158 mg/dL) (13). Diabetes was defined as a FSG concentration greater than or equal to 7.0 mmol/L (126 mg/dL), or self-reported diabetes history (14). Hypertension was defined by an SBP ≥ 140 mmHg and/or DBP ≥ 90 mmHg according to Chinese hypertension guidelines (15). The estimated glomerular filtration rate (eGFR) was calculated to reflect the overall index of kidney function using the epidemiology collaboration (EPI)-Asia equation (16, 17).
For male: SCr ≤ 0.9 mg/dL, eGFR = 141 × (SCr/0.9)–0.411 × (0.993)Age × 1.057;
For male: SCr > 0.9 mg/dL, eGFR = 141 × (SCr/0.9)–1.209 × (0.993)Age × 1.057;
For female: SCr ≤ 0.7 mg/dL, eGFR = 144 × (SCr/0.7)–0.329 × (0.993)Age × 1.049;
For female: SCr > 0.7 mg/dL, eGFR = 144 × (SCr/0.7)–1.209 × (0.993)Age × 1.049;
The units for each index were: age (years), SCr (serum creatinine) (mg/dL), and eGFR (ml/min/1.73 m2).
Given that serum calcium changes with albumin concentrations (18), serum calcium was adjusted according to the following formula into corrected serum ionized calcium ([Ca2+]corr); [Ca2+]corr (mmol/L) = serum calcium (mmol/L) + 0.02 × [40 − albumin (g/L)] (11).
Statistical Analyses
Each subject was assigned a digital code during the study to identify individuals. The columes of variables with missing values > 20% were eliminated. Because physical examinees will choose different physical examination packages, and not all test items will be detected for an individual undergoing medical examination. And then, missing data were excluded by using the listwise method, and outliers of serum calcium were excluded by the Tukey method. Records with complete information on other covariates were also kept for final analyses. The Kolmogorov-Smirnov test was used for normal distribution analyses. Descriptive categorical variables were expressed as numbers and percentages, and continuous variables were described as the median and interquartile range (IQR) or the mean ± standard deviation (SD). Group differences were compared using the Chi-squared test, t-test, Mann–Whitney U test or Kruskal–Wallis H test. The stepwise variable selection method was used to select variables in multivariate-adjusted models to avoid over- or under-fitting. The multicollinearity predictor was ruled out with a variance inflation factor ≥ 5. [Ca2+]corr values were taken as continuous/categorical variables to explore associations with dyslipidemia and associated components. [Ca2+]corr levels were divided into four groups according to quartile distributions: Q1 group (1.97–2.20 mmol/L), Q2 (2.20–2.26 mmol/L), Q3 (2.26–2.31 mmol/L), and Q4 (2.31–2.52 mmol/L). Restricted cubic spline regression analyses with four knots were used to assess the dose-response association between [Ca2+]corr values and dyslipidemia. The optimal risk threshold was then determined. In addition, non-linear relationships between [Ca2+]corr and serum lipid component levels were explored using locally weighted regression (Loess) to help interpret findings. Interactions between age, gender, waist circumstance, BMI, eGFR, ALT, AST, albumin and [Ca2+]corr concerning dyslipidemia were also examined. A two-sided P < 0.05 value was considered statistically significant. All statistical analyses were performed using R software (version 3.4.01).
Ethics and Privacy Protection
The ethics committee of the First Affiliated Hospital of China Medical University approved this study (approval No. 2020-323). Informed consent was waived as this was a retrospective study. Individual information was hidden, and privacy was maintained to protect participant information.
Results
Demographic and Clinical Characteristics
A total of 5,416 participants with 42 variables (demographic, anthropometric, laboratory tests, and clinical variables) were included in this study. A flowchart of the selection process is shown in Figure 1. Of these participants aged 18–92 years (2,920 men and 2,496 women), 3,316 (61%) had dyslipidemia. The median serum calcium level was 2.34 mmol/L (IQR: 2.28–2.40 mmol/L), and the median [Ca2+]corr was 2.26 (IQR: 2.20–2.31). When compared with subjects in the Q1 group, individuals in the Q2, Q3, and Q4 group were older. They showed a higher waist circumstance and higher BMI, SBP, DBP, TG, TC, HDL-C, LDL-C, Non-HDL-C, creatinine, FSG, uric acid, AST, ALT, leucocyte, granulocyte, lymphocyte, monocyte, eosinophil, basophil, RBC, HGB, HCT, MCV, MCHC, PLT, PCT, and MPV levels, and lower albumin, PDW and P-LCR levels. These participants also had a high proportion of hypertension, dyslipidemia, high TG, high TC, high LDL-C, and high Non-HDL-C, but a low proportion of reduced HDL-C (all P < 0.05) (Table 1).
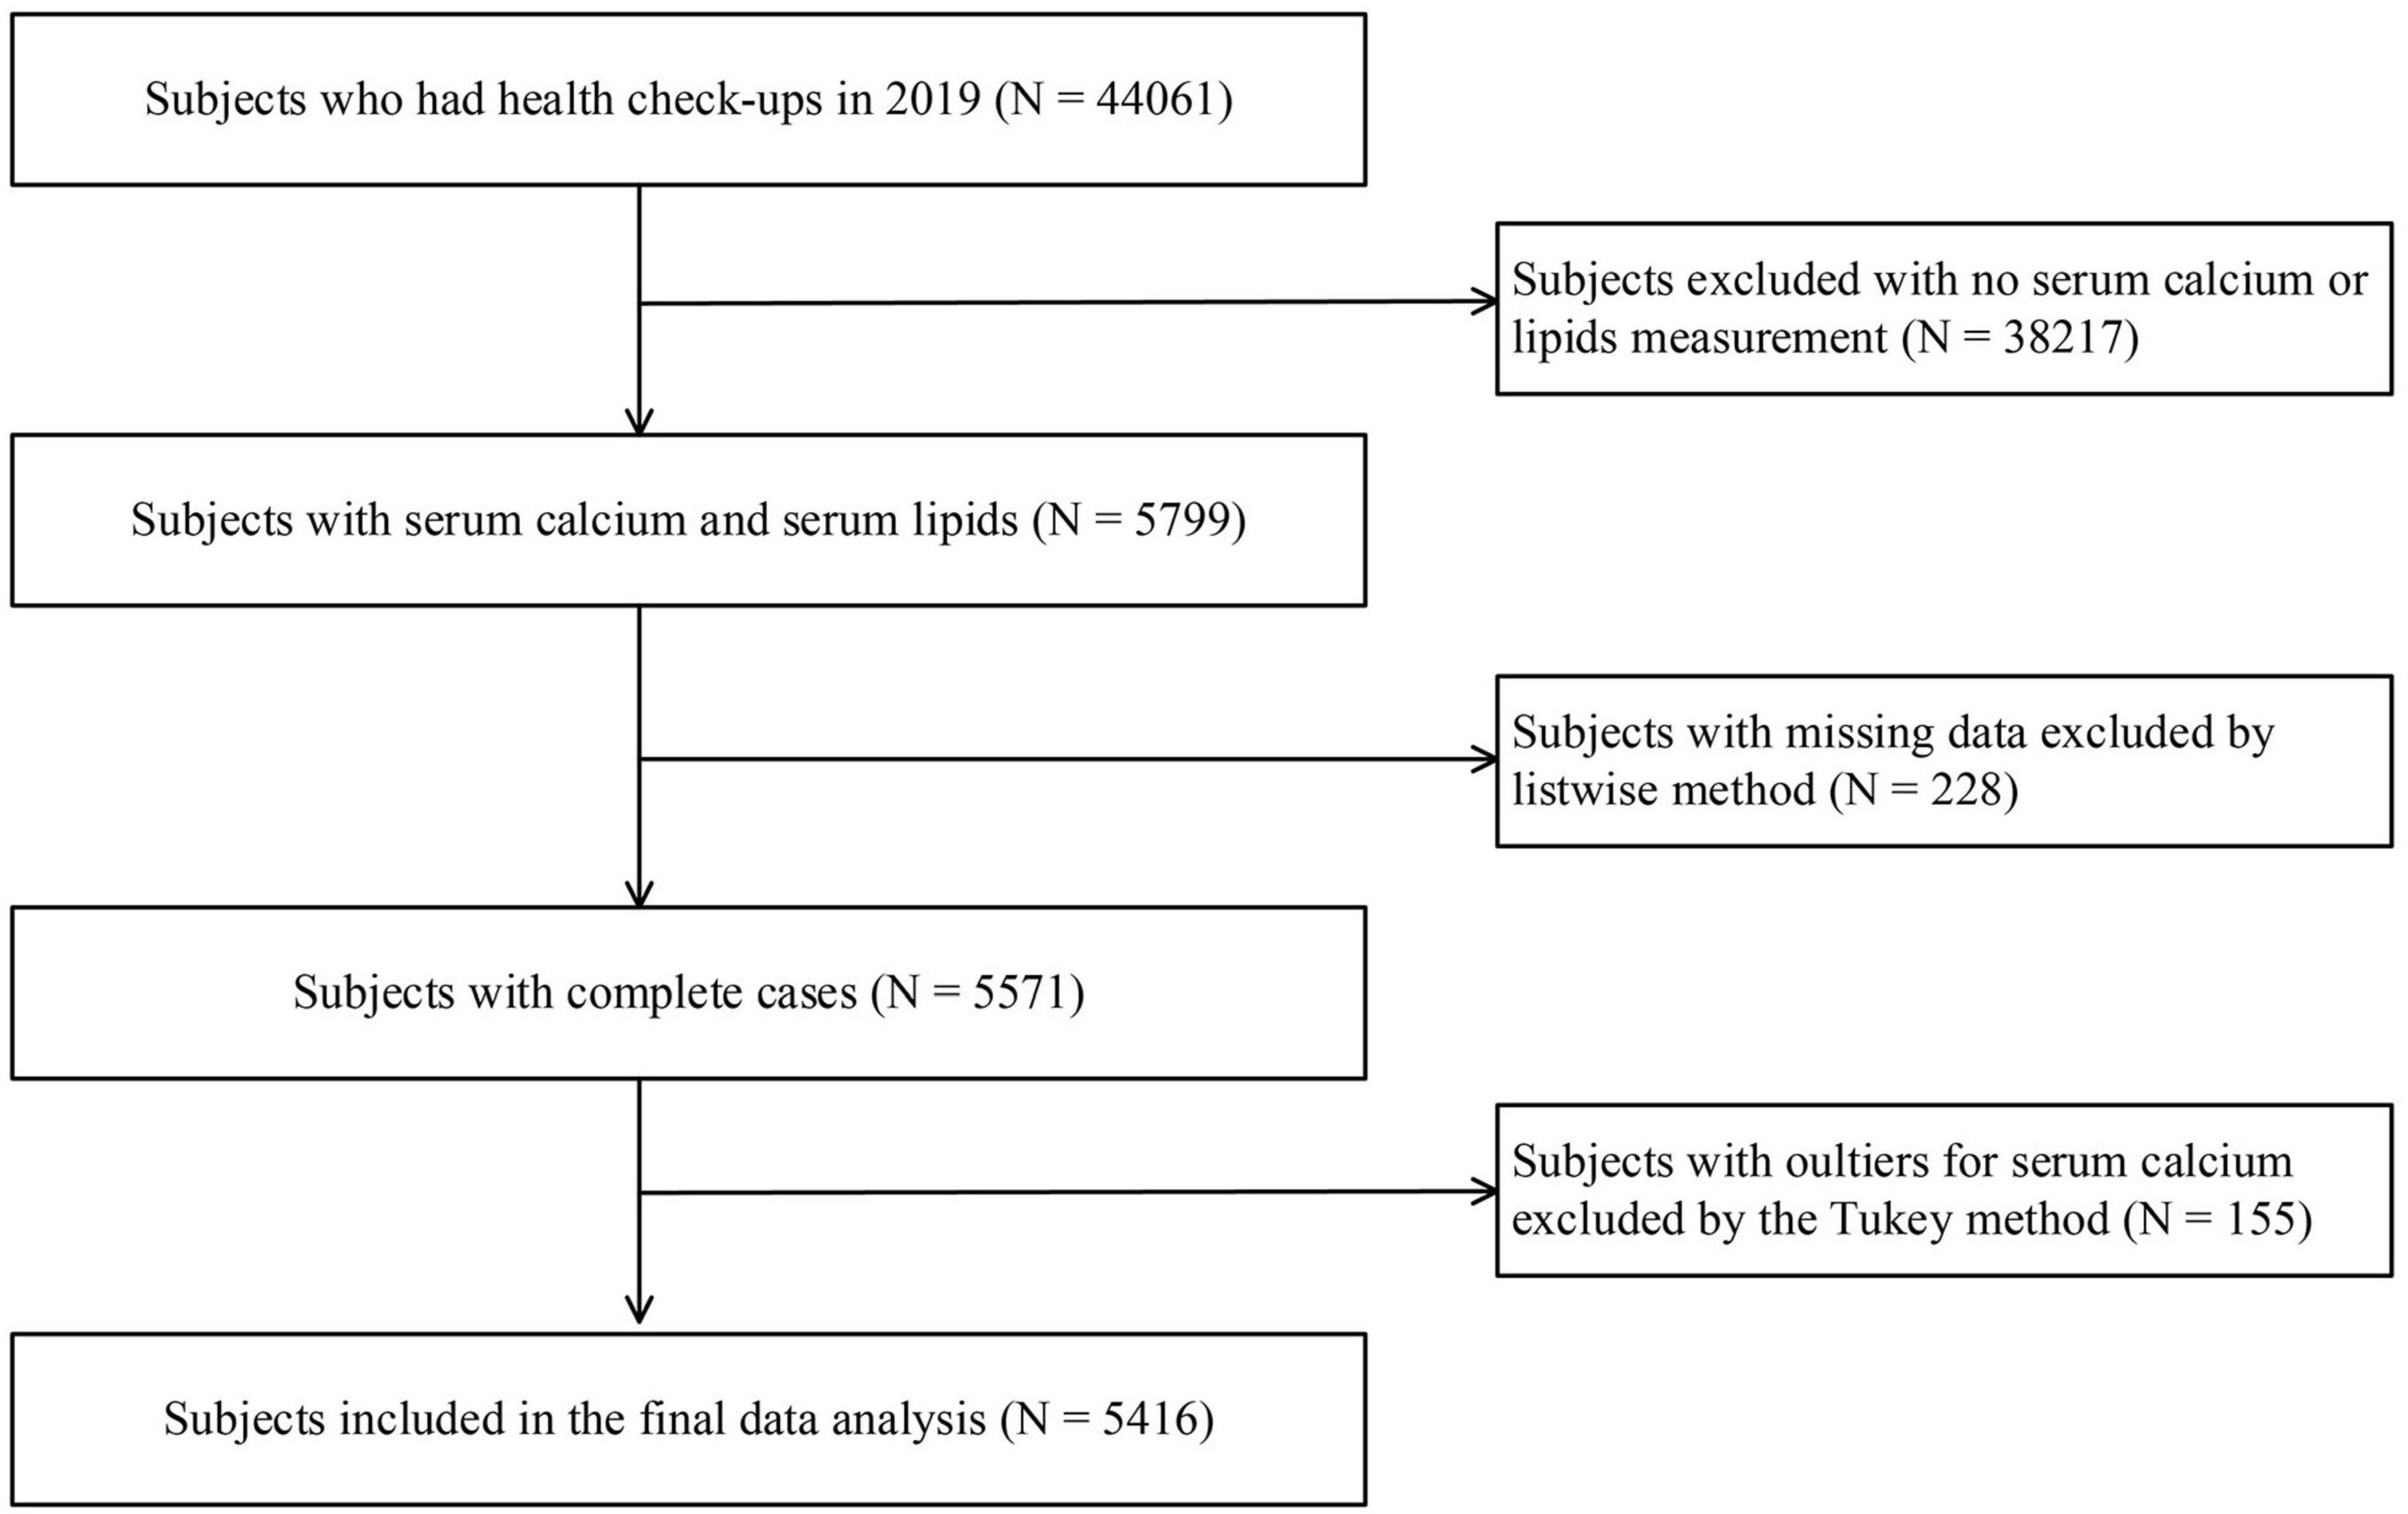
Figure 1. Flow chart of the subject selection process.
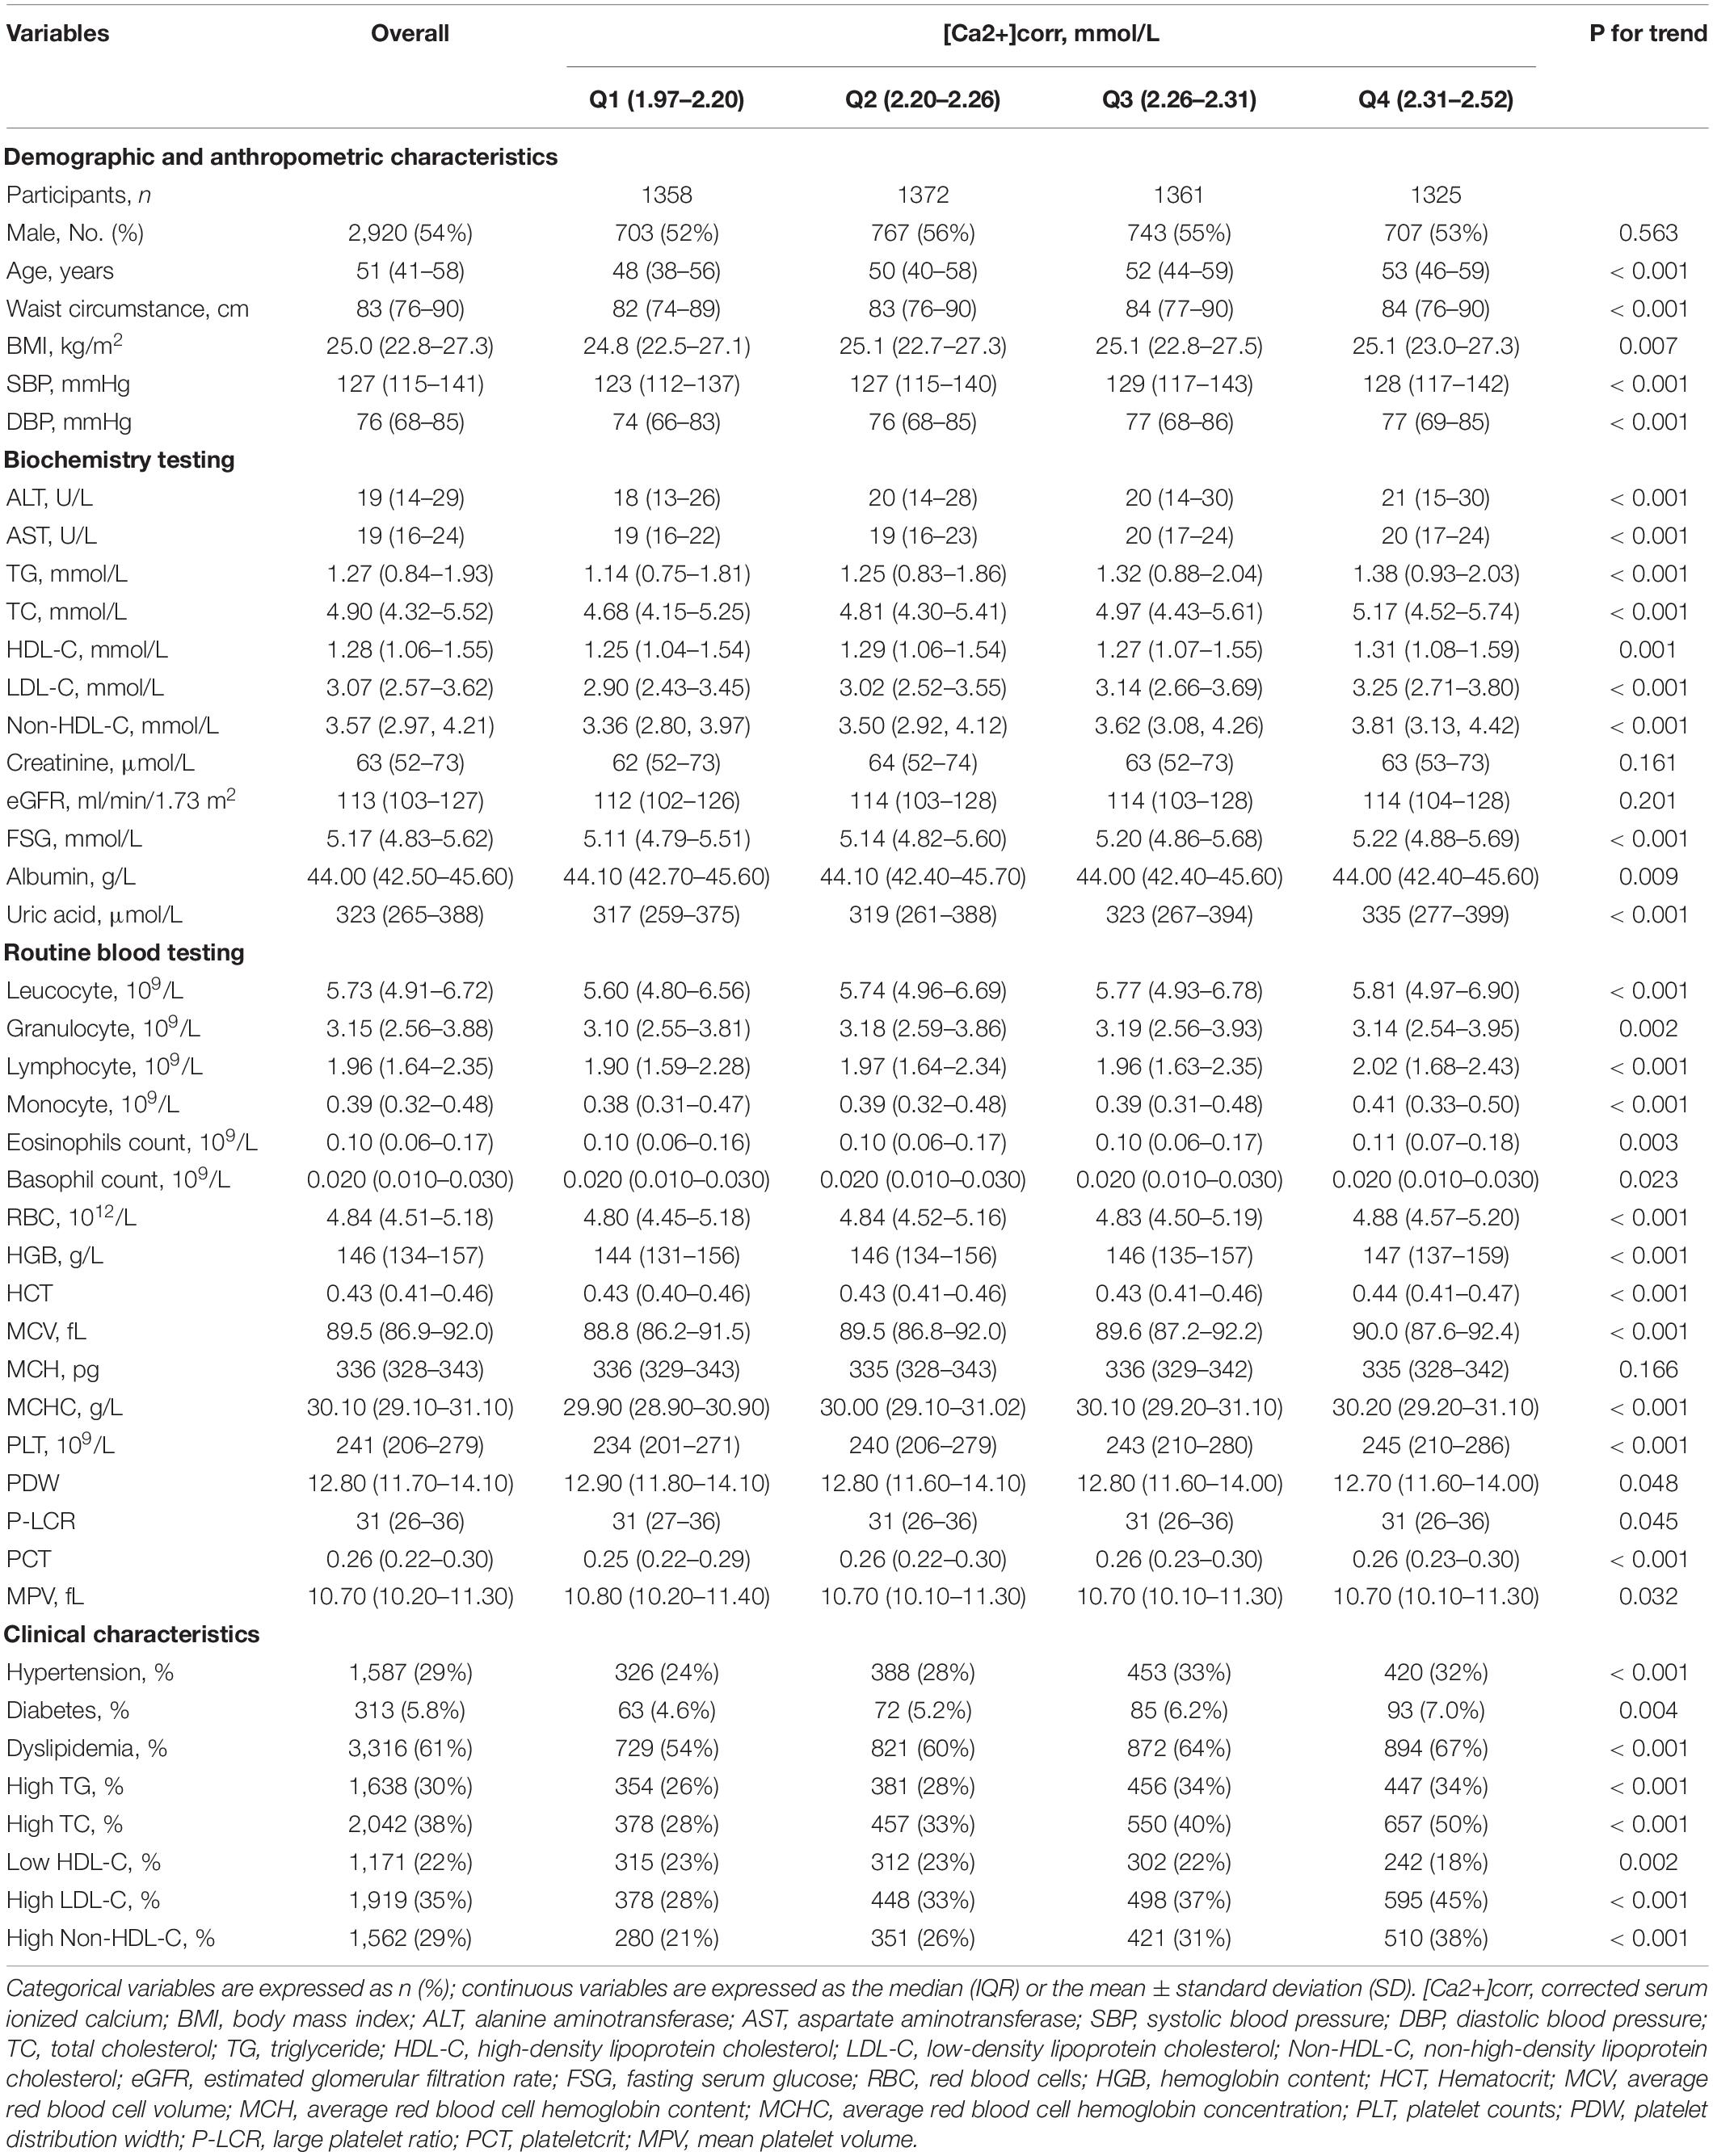
Table 1. Participant demographics and laboratory parameters according to [Ca2+]corr quartiles (N = 5416).
Associations Between [Ca2+]corr and Dyslipidemia Odds
As shown (Table 2), logistic regression analyses demonstrated that each 1 mmol/L increment of [Ca2+]corr was associated with an increased odds of dyslipidemia [adjusted odds ratio (AOR) = 3.53, 95% CI: 1.56–8.00, P = 0.002] in the multivariate-adjusted model 2. Individuals in Q2, Q3, and Q4 groups had higher dyslipidemia odds in the crude model (ORQ2 vs. Q1 = 1.29, 95% CI: 1.10–1.50; ORQ3 vs. Q1 = 1.54, 95% CI: 1.32–1.79; ORQ4 vs. Q1 = 1.79, 95% CI: 1.53–2.09). After adjusting for gender, age, waist circumference, and BMI in model 1, individuals in Q3 and Q4 had higher dyslipidemia odds when compared with individuals in the Q1 group (ORQ3 vs. Q1 = 1.32, 95% CI: 1.12–1.55, ORQ4 vs. Q1 = 1.56, 95% CI: 1.32–1.84). After adjusting for all covariables in model 1 plus clinical and laboratory parameter confounders, including SBP, DBP, a diabetes diagnosis, lymphocytes, basophils, RBC, MPV, FSG, albumin, uric acid, and ALT, participants in Q3 and Q4 groups had a higher dyslipidemia odds in model 2 (ORQ3 vs. Q1 = 1.20, 95% CI: 1.01–1.42, ORQ4 vs. Q1 = 1.31, 95% CI: 1.10–1.56). Multivariate-adjusted restricted cubic spline logistic regression analyses with four knots showed a positive linear relationship between [Ca2+]corr and dyslipidemia odds (P for non-linearity = 0.506), and the optimal cut-off value for [Ca2+]corr for dyslipidemia odds equal to 1 was 2.26 mmol/L (Figure 2).
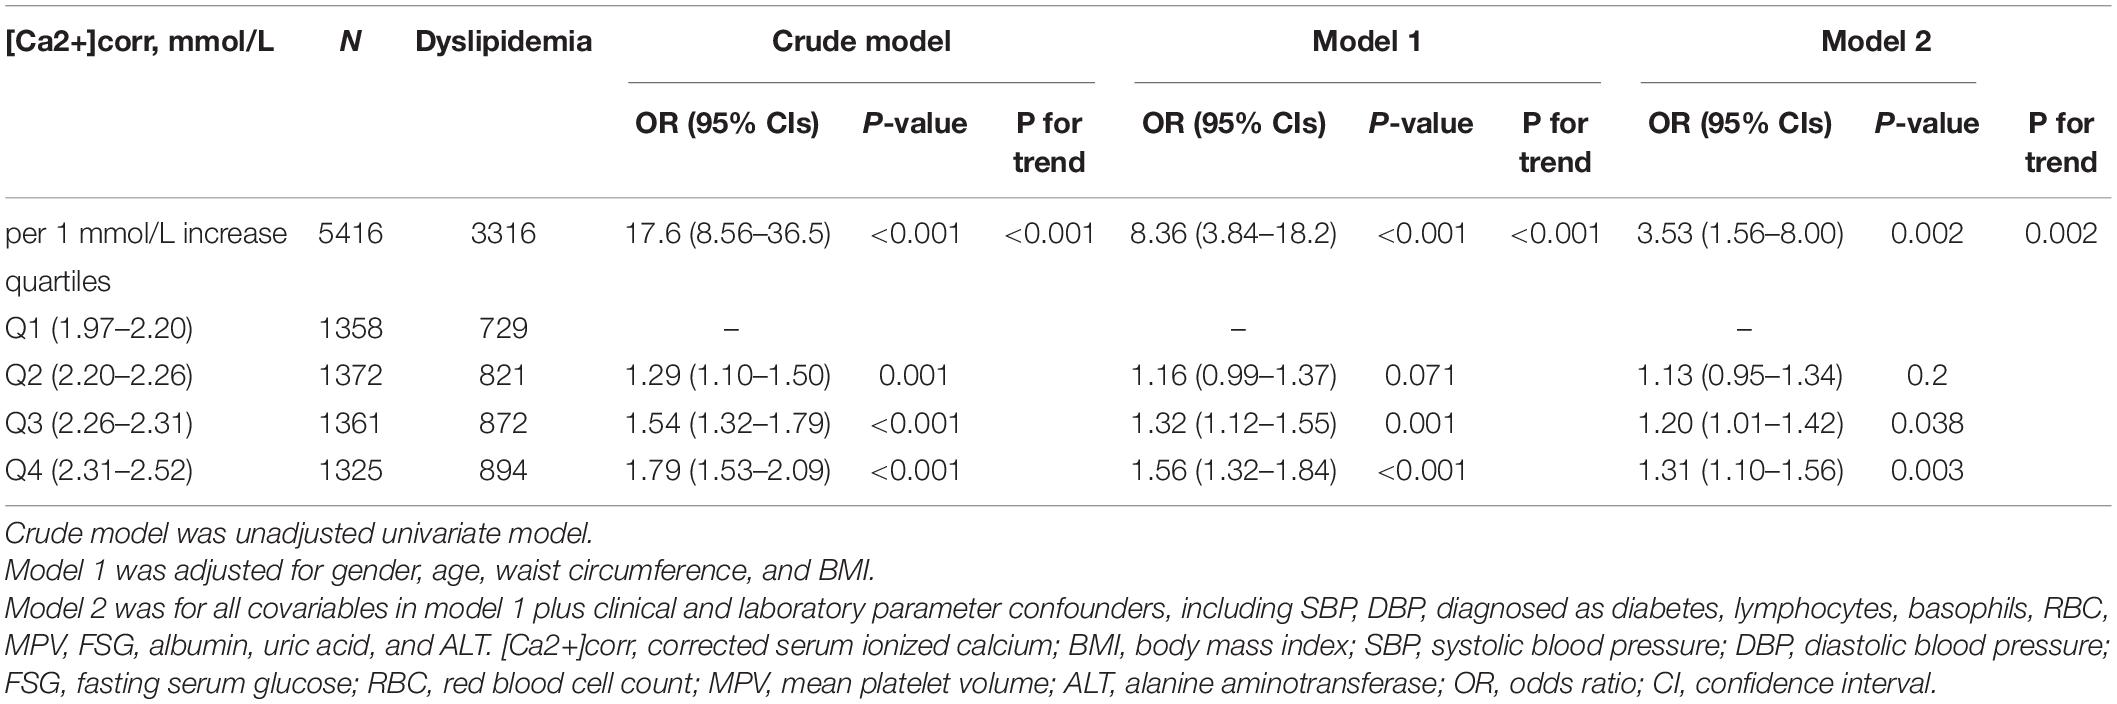
Table 2. Associations between [Ca2+]corr and dyslipidemia odds in 5,416 adults assessed using logistic regression models.
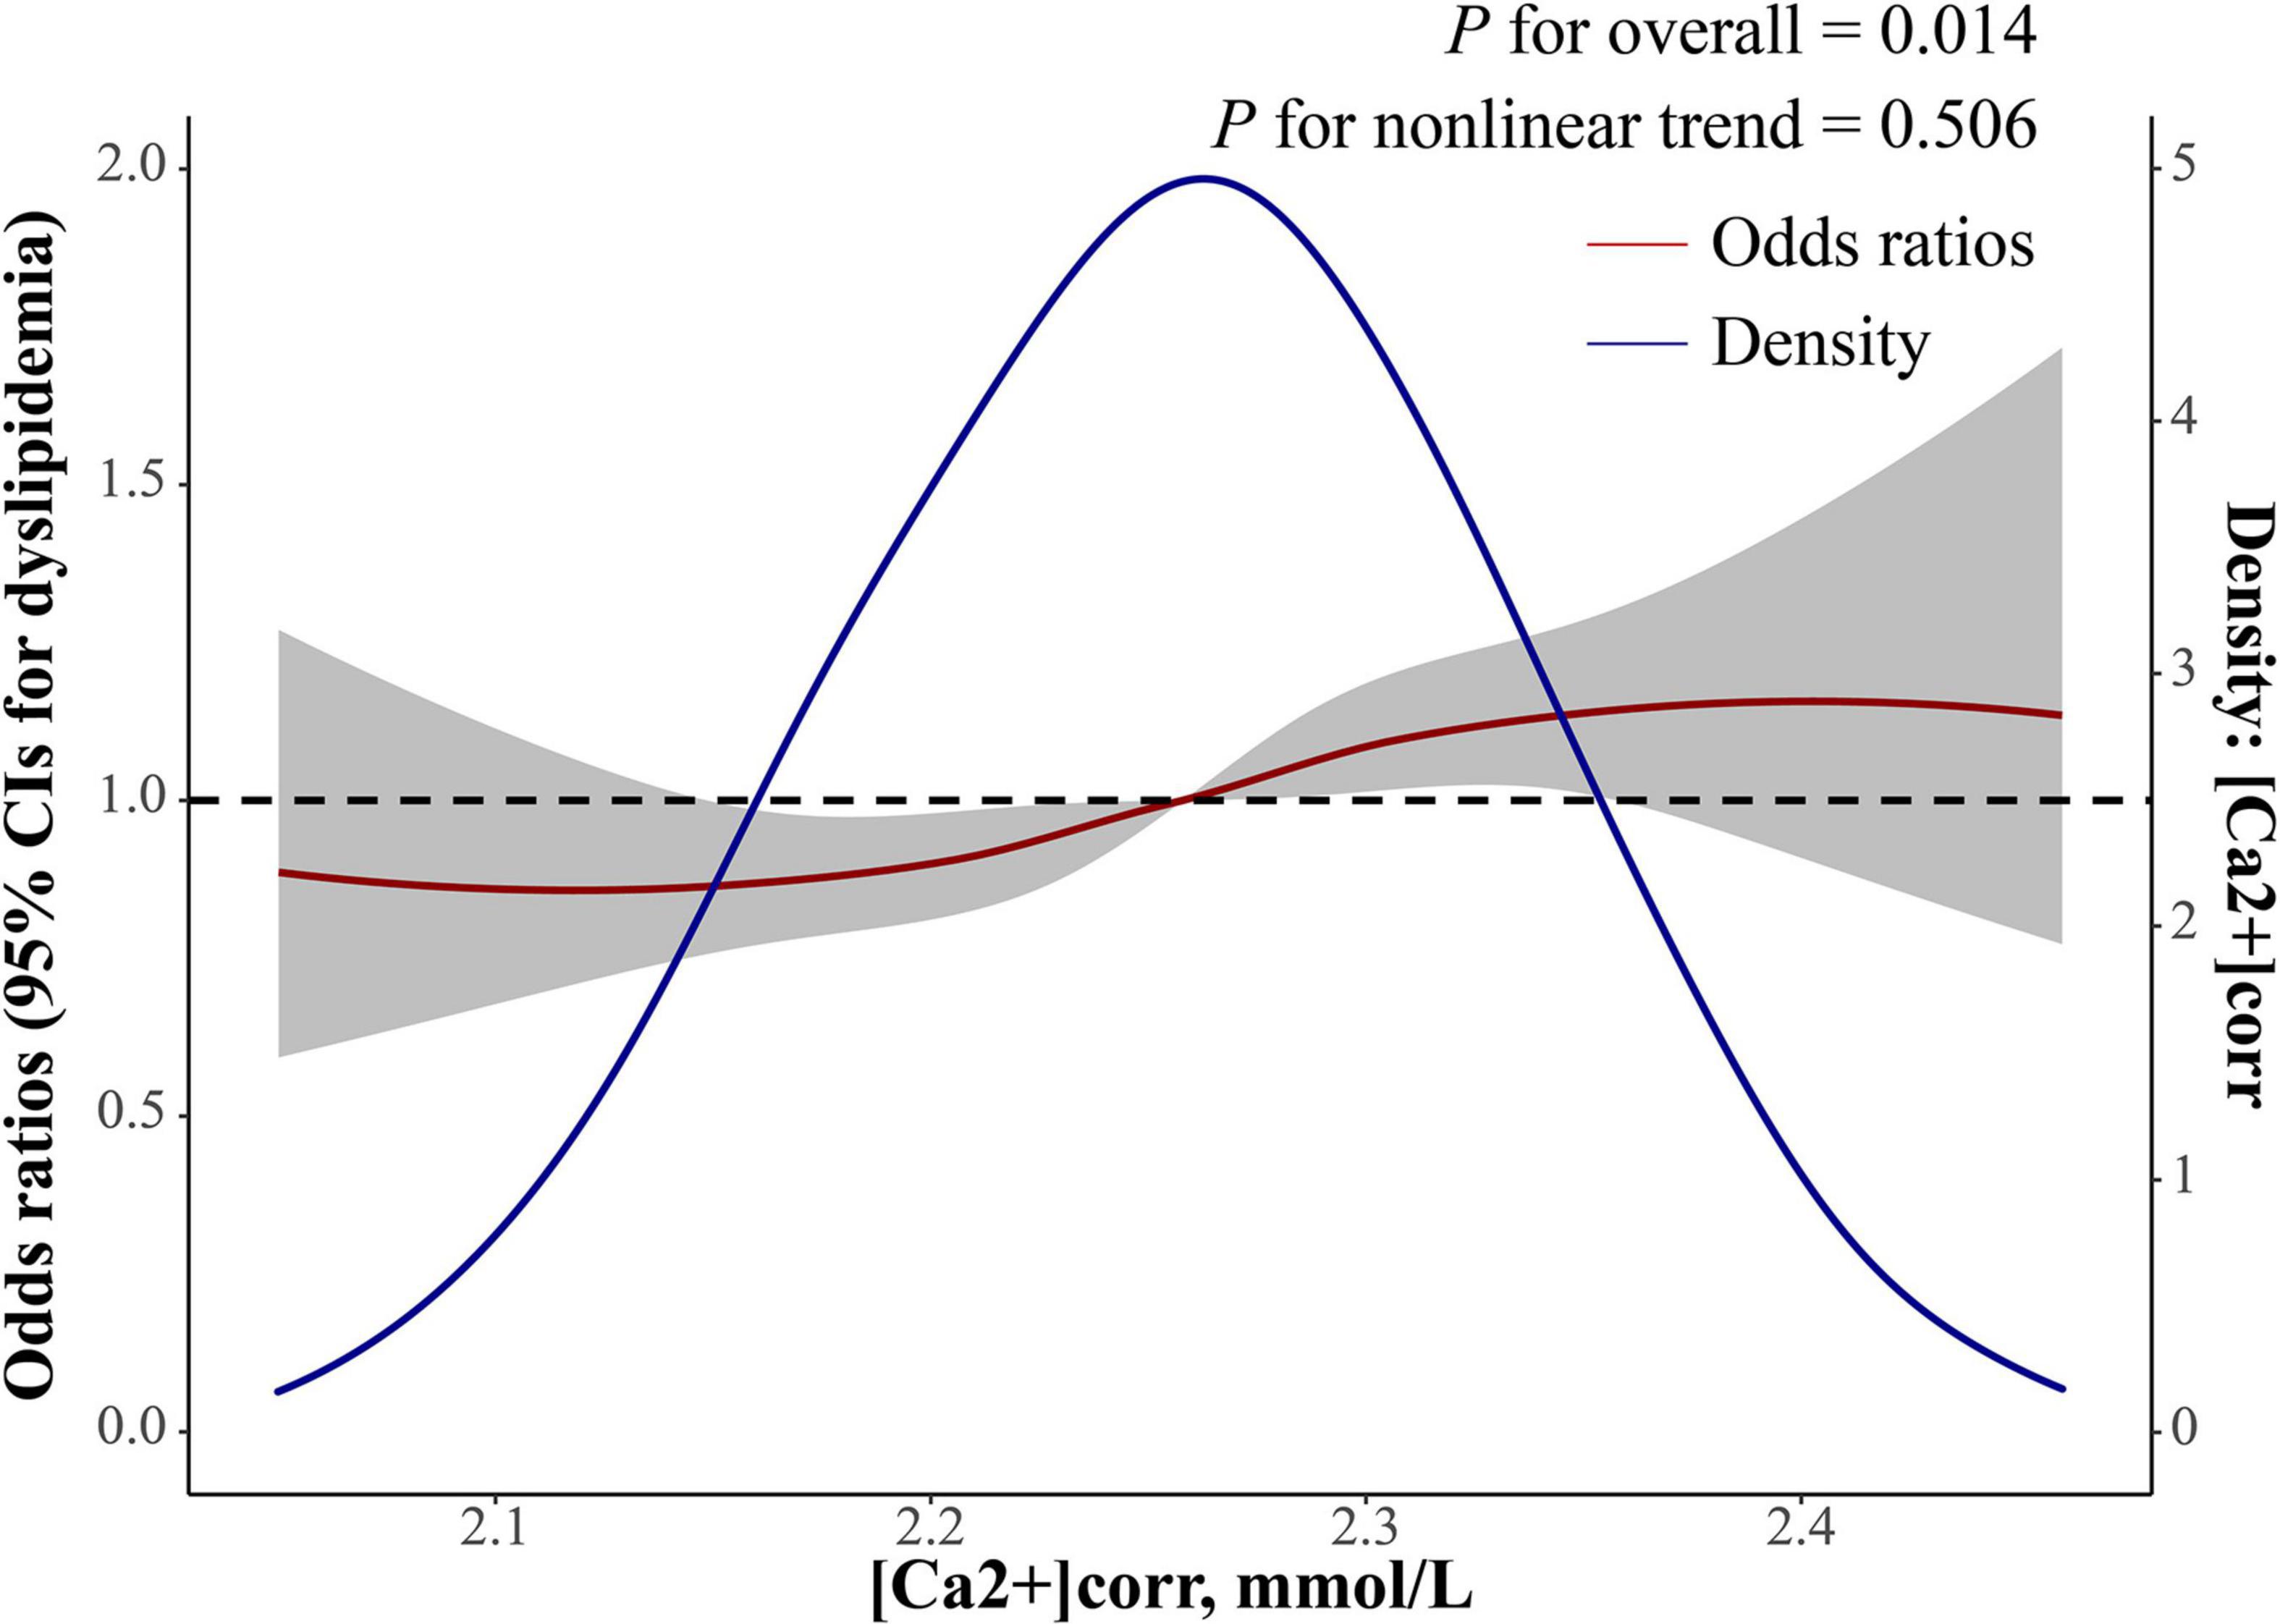
Figure 2. Dose-response relationship between [Ca2+]corr and dyslipidemia odds. The red line with a 95% confidence band is multivariate-adjusted odds ratios using a restricted cubic spline regression with four knots with a polynomial smoother. The blue line is a kernel density plot of [Ca2+]corr. [Ca2+]corr, corrected serum ionized calcium.
Stratified Analysis Between [Ca2+]corr and Dyslipidemia by Participant Characteristics
We also investigated if the association between [Ca2+]corr and dyslipidemia odds was modifiable by age, gender, waist circumstance, BMI, eGFR, ALT, AST or albumin using stratified analyses. The risk of dyslipidemia was significantly higher among people whose albumin level was higher than 46.6 g/L (P for interaction = 0.014). In subgroup analyses, there were no differences in association between the risk of dyslipidemia and [Ca2+]corr regarding age (P = 0.386), gender (P = 0.521), waist circumstance (P = 0.273), BMI (P = 0.891), eGFR (P = 0.11), ALT (P = 0.591), and AST (P = 0.832, Table 3).
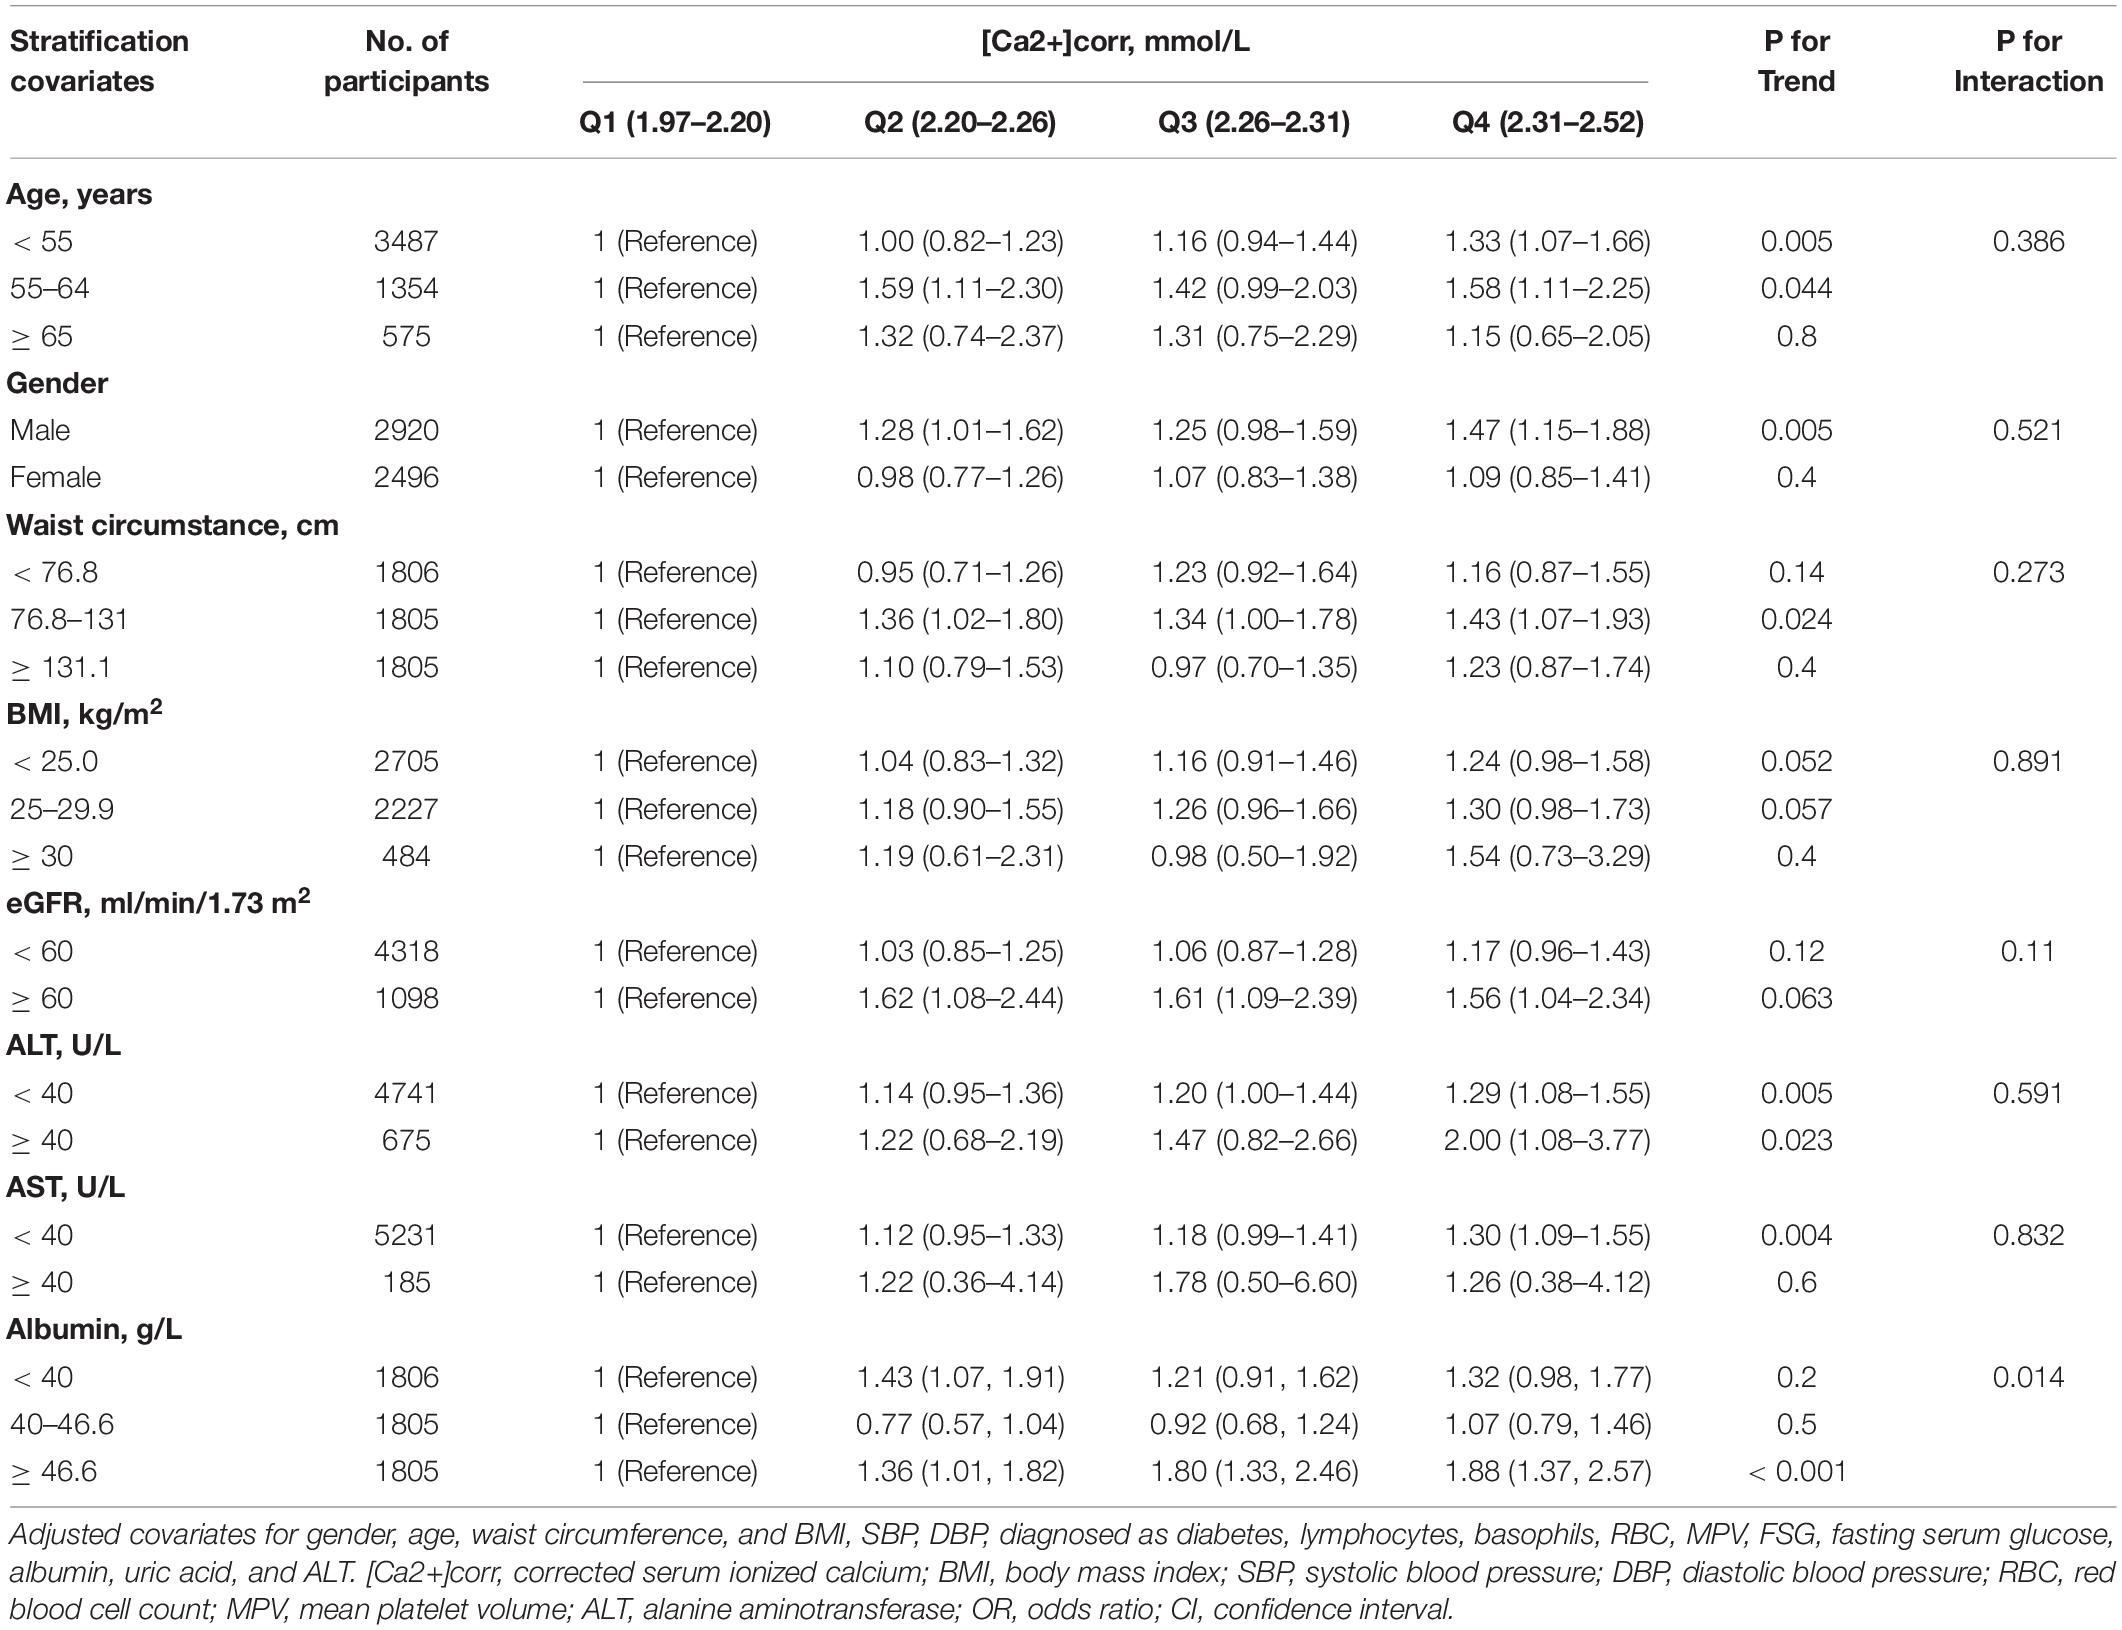
Table 3. Stratified analyses between [Ca2+]corr and dyslipidemia by participant characteristics.
Associations Between [Ca2+]corr and Total Cholesterol, Triglycerides, High-Density Lipoprotein Cholesterol, Low-Density Lipoprotein Cholesterol, and Non-high-Density Lipoprotein Cholesterol Disorders
Associations between [Ca2+]corr and serum lipid parameters disorders, including high TC, high TG, low HDL-C, high LDL-C, and high Non-HDL-C are shown in Figure 3. As indicated (Figure 3A), multivariable-adjusted ORs of individuals in the Q3 group were 1.47 (95% CI: 1.24–1.74) for high TC, 0.79 (95% CI: 0.64–0.96) for low HDL-C, 1.23 (95% CI: 1.03–1.45) for high LDL-C, and 1.40 (95% CI: 1.16–1.68) for high Non-HDL-C when compared with individuals in the Q1 group. In the Q4 group, multivariable-adjusted ORs were 2.06 (95% CI: 1.74–2.44) for high TC, 0.57 (95% CI: 0.46–0.70) for low HDL-C, 1.67 (95% CI: 1.41–1.98) for high LDL-C, and 1.86 (95% CI: 1.54–2.23) for high Non-HDL-C when compared with individuals in the Q1 group.
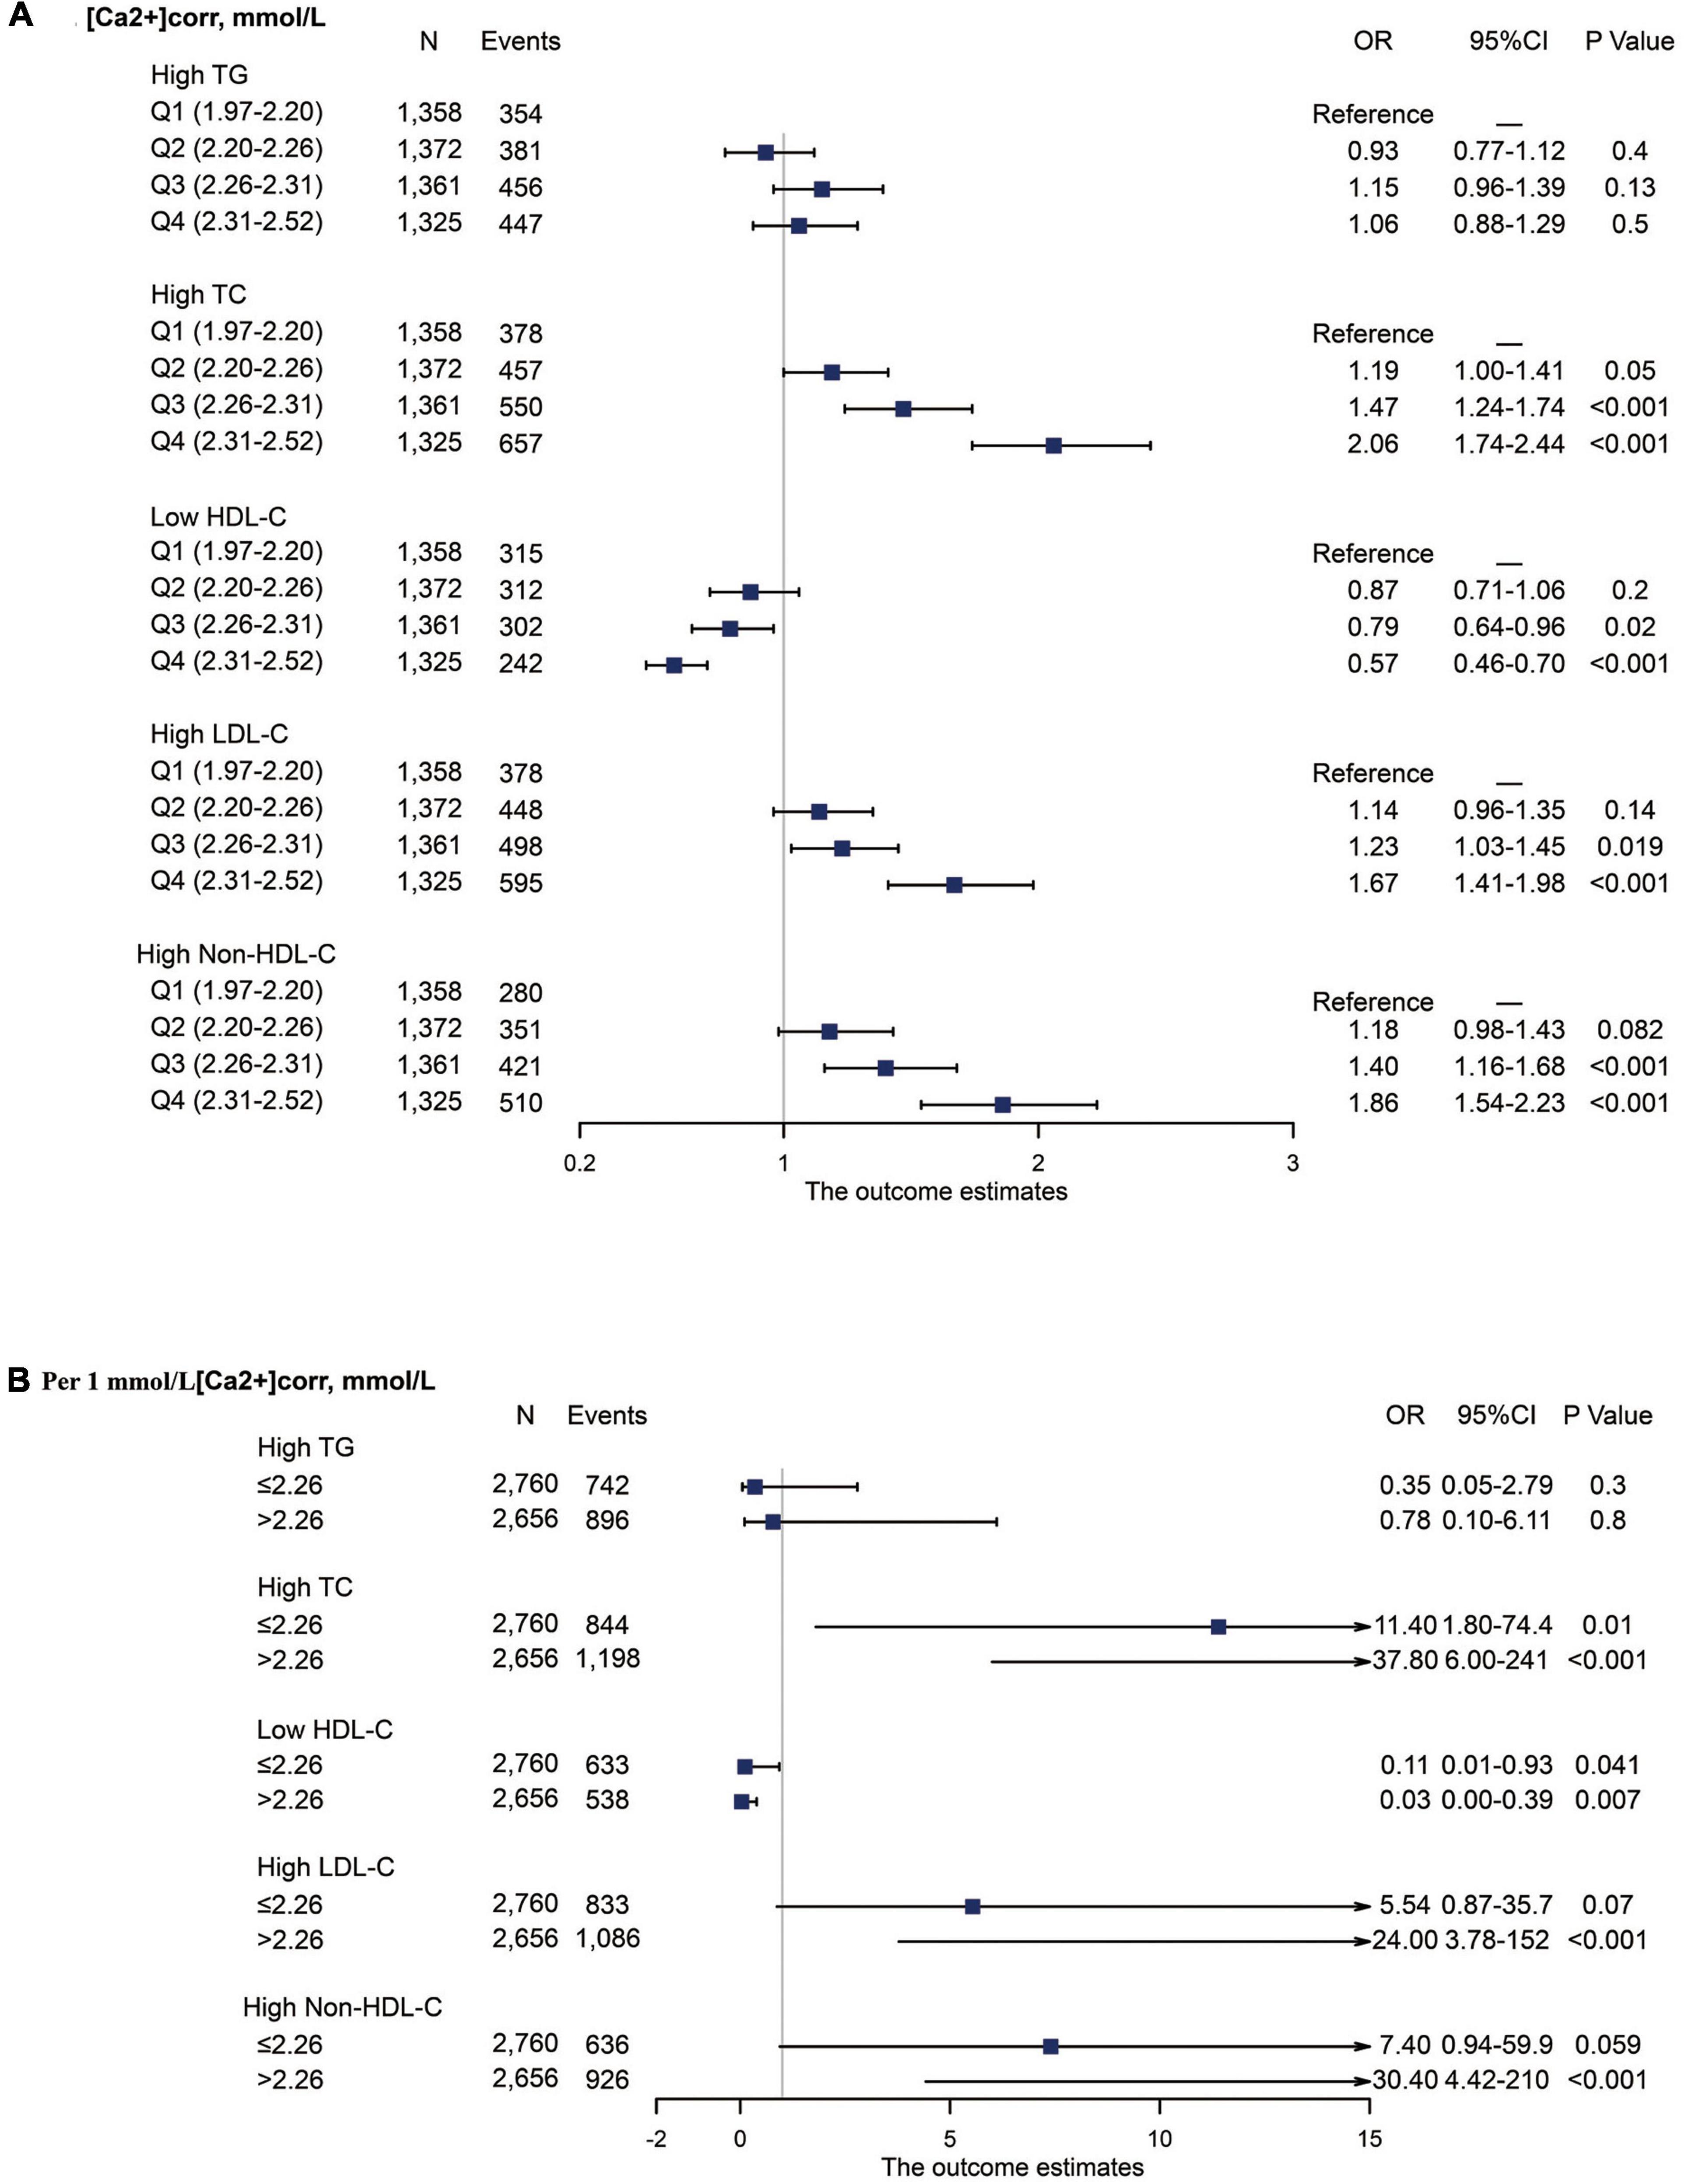
Figure 3. Forest plot of serum lipid disorder odds associated with [Ca2+]corr categories. All analyses were multivariable adjusted. (A) Odds associated with four [Ca2+]corr categories. (B) Odds associated with a 1 mmol/L [Ca2+]corr increase, stratified by an [Ca2+]corr cut-off value of 2.26 mmol/L. [Ca2+]corr, corrected serum ionized calcium; TC, total cholesterol; TG, triglyceride; HDL-C, high-density lipoprotein cholesterol; LDL-C, low-density lipoprotein cholesterol; Non-HDL-C, non-high-density lipoprotein cholesterol; OR, odds ratio; CI, confidence interval.
Stratified analyses were also performed using a cut-off value of 2.26 mmol/L for associations between each 1 mmol/L increase in [Ca2+]corr and dyslipidemia components. In individuals with [Ca2+]corr ≤ 2.26 mmol/L, multivariable-adjusted ORs were 11.4 (95% CI: 1.80–74.4) for high TC and 0.11 (95% CI: 0.01–0.93) for low HDL-C. In individuals with [Ca2+]corr > 2.26 mmol/L, multivariable-adjusted ORs were 37.8 (95% CI: 6.00–241) for high TC, 0.03 (95% CI: 0.00–0.39) for low HDL-C, 24.0 (95% CI: 3.78–152) for high LDL-C, and 30.40 (95% CI: 4.42–210) for high Non-HDL-C. No significant associations were identified for [Ca2+]corr with high TG (Figure 3B).
Dose-Response Relationship Between [Ca2+]corr and Triglycerides, Total Cholesterol, High-Density Lipoprotein Cholesterol, Low-Density Lipoprotein Cholesterol, and Non-high-Density Lipoprotein Cholesterol Levels
Loess analyses were performed to explore non-linear relationships between [Ca2+]corr and serum lipid profiles (Figure 4). The five parameters, TG, TC, HDL-C, LDL-C, and Non-HDL-C had positive non-linear dependent relationships with [Ca2+]corr after adjusting for gender, age, waist circumference, BMI, SBP, DBP, a diabetes diagnosis, lymphocytes, basophils, RBC, MPV, FSG, albumin, uric acid, and ALT (all P < 0.05). TG displayed a W-shape relationship with [Ca2+]corr, while HDL-C showed an inverted W-shape relationship. As shown (Figures 4A,C), there was a turning point for [Ca2+]corr at 2.26 mmol/L along with TG and HDL-C, after which the dependent trend was different from before. In addition, (Figures 4B,D,E), TC, LDL-C, and Non-HDL-C showed similar sigmoidal-shaped trajectories with [Ca2+]corr, and we observed a threshold effect of [Ca2+]corr near 2.16 mmol/L for TC, LDL-C and Non-HDL-C.
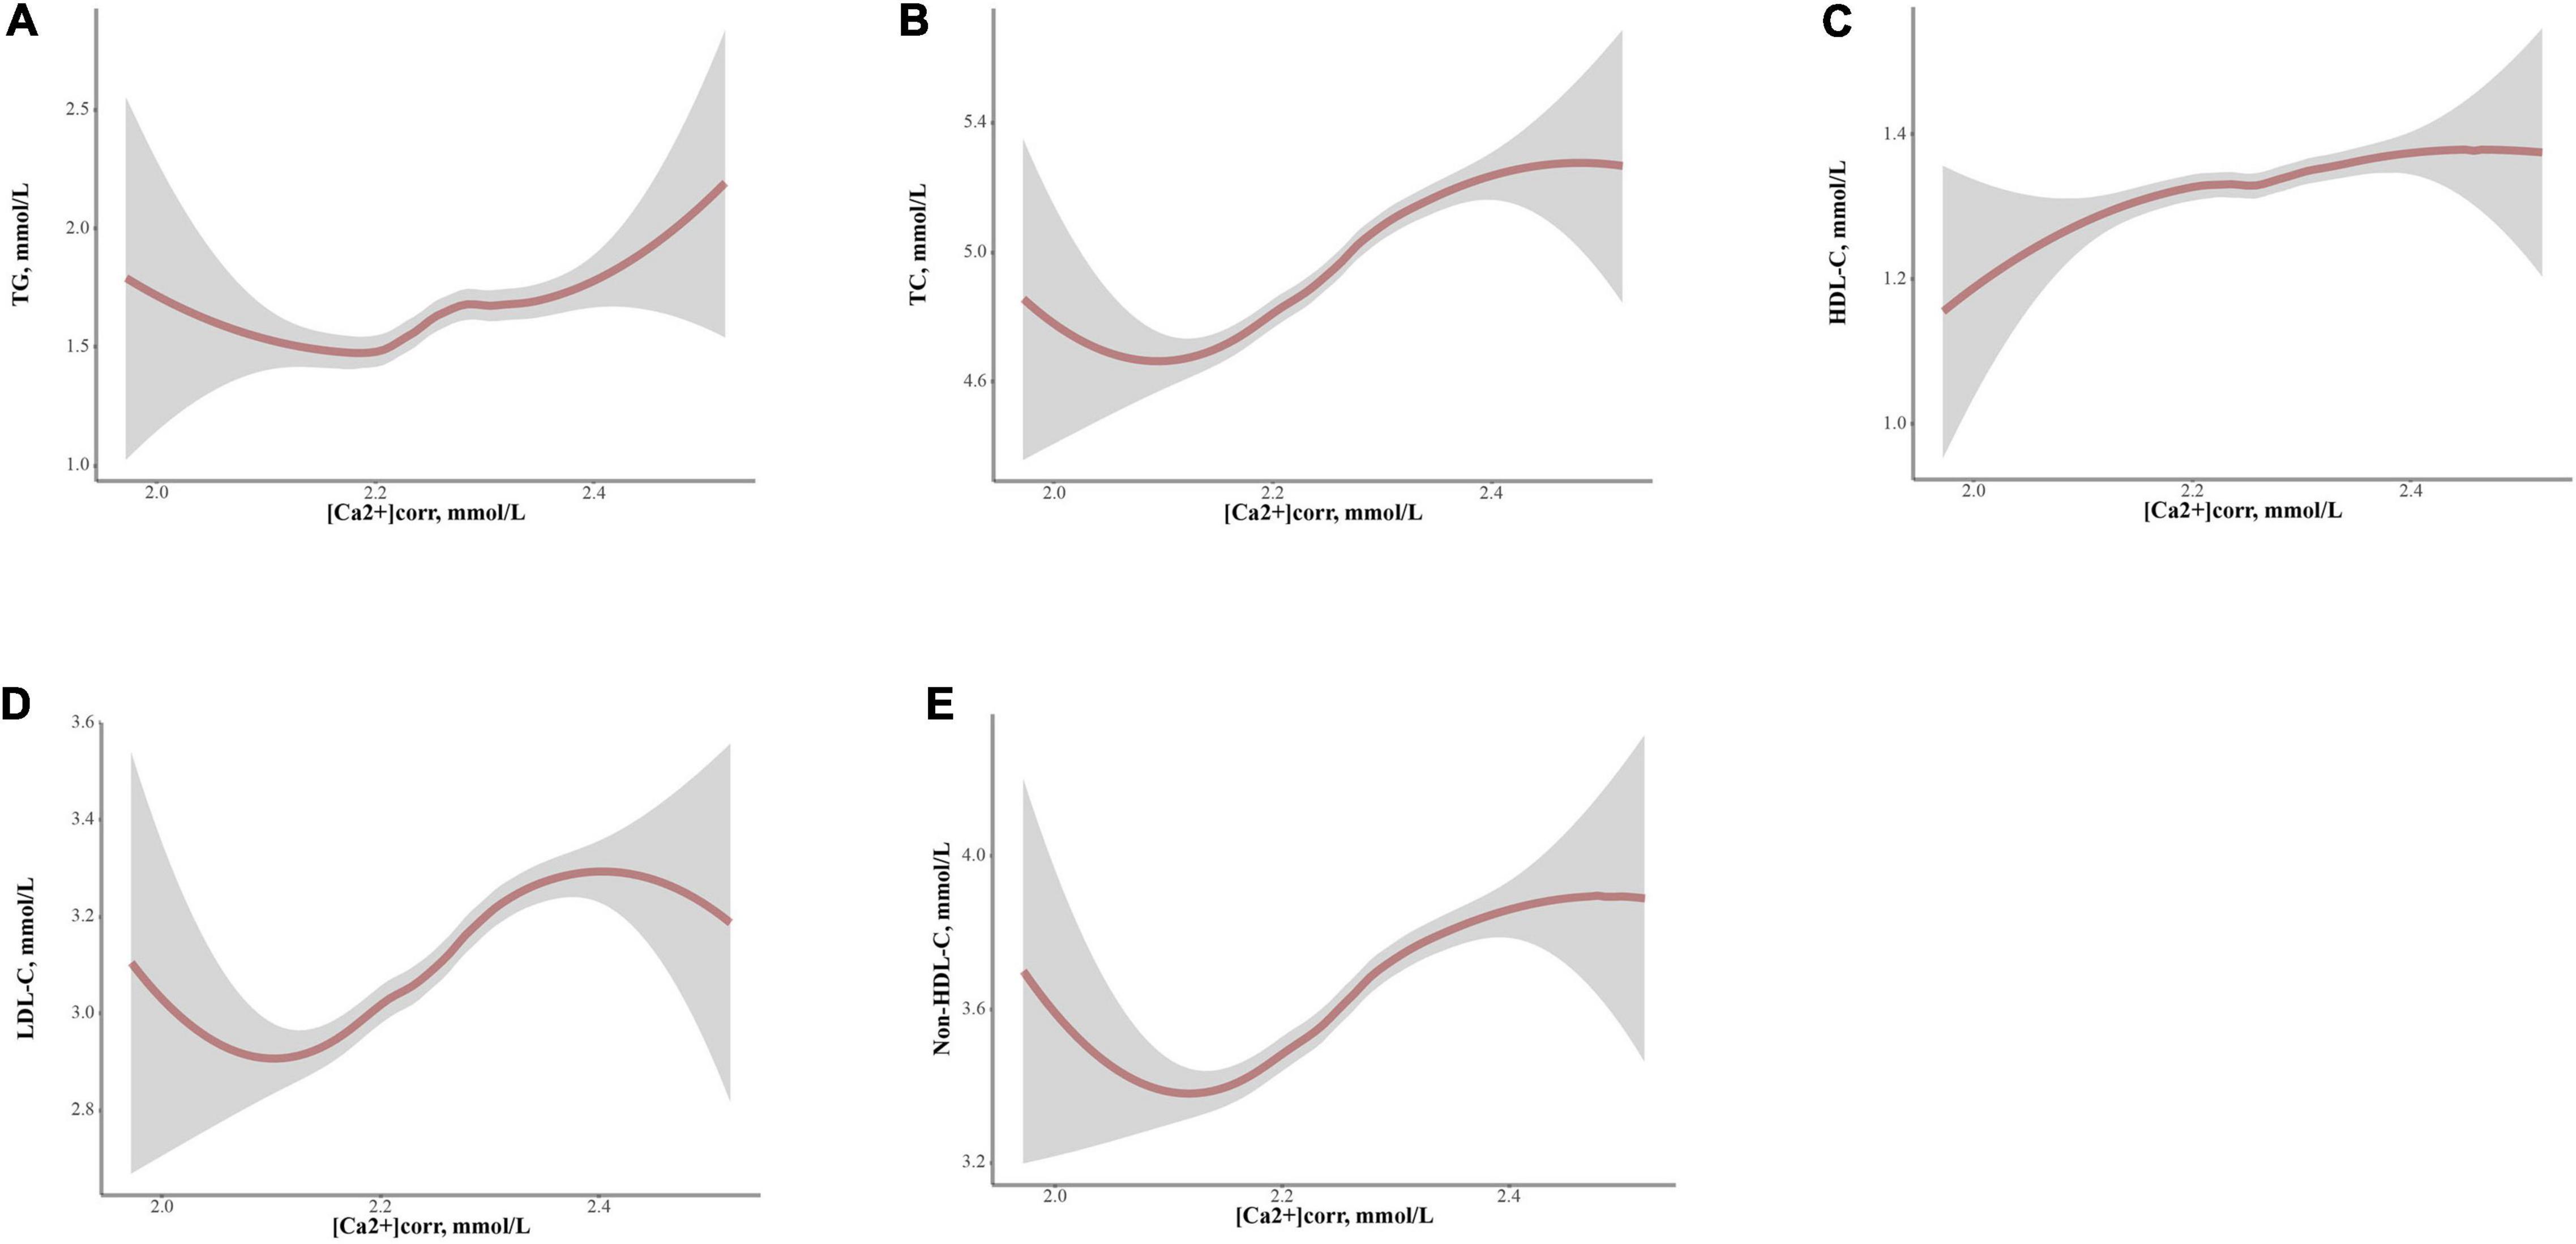
Figure 4. Locally weighted regression (Loess) analyses of [Ca2+]corr on serum lipid parameter levels in graphs of smoothed values with confidence bands. (A) TG, (B) TC, (C) HDL-C, (D) LDL-C, and (E) Non-HDL-C. [Ca2+]corr, corrected serum ionized calcium; TC, total cholesterol; TG, triglyceride; HDL-C, high-density lipoprotein cholesterol; LDL-C, low-density lipoprotein cholesterol; Non-HDL-C, non-high-density lipoprotein cholesterol.
Discussion
A thorough understanding of the relationship between dyslipidemia and influencing factors is essential for effective dyslipidemia management. In this study, relationships between [Ca2+]corr and serum lipid profiles were comprehensively analyzed. We observed that [Ca2+]corr was linearly associated with higher odds of dyslipidemia, and [Ca2+]corr was positively associated with high TC, high LDL-C and high Non-HDL-C odds but inversely associated with low HDL-C odds. This is the first study to assess dose-response associations between [Ca2+]corr and dyslipidemia odds and associated components in adults, and it may be beneficial for clinical practice and public awareness of maintaining calcium nutrition at appropriate levels.
We found that [Ca2+]corr was positively linearly associated with higher odds of dyslipidemia. Similar results were reported in Italy (19) and Iran (20) on the relationship between serum calcium and dyslipidemia. However, a Chinese pediatric population study reported an L-shaped non-linear dose-response relationship between [Ca2+]corr and dyslipidemia odds (21). This difference between adults and children could be caused by differences in exogenous calcium and lipid intake and endogenous homeostatic capabilities in different age groups (22). The potential mechanism behind this positive linear association may have been because [Ca2+]corr impairs cholesterol catabolism in the liver, increases lipid synthesis (23), and impacts lipid absorption (24). This could increase the probability of high serum lipid levels and dyslipidemia via atherosclerotic plaque formation and an increased risk of CVD events (25). Although we used albumin corrected calcium in our study, our albumin-stratified analyses still showed that the risk of dyslipidemia attributed to [Ca2+]corr was significantly higher among people with higher albumin levels. This suggests that albumin can enhance the association between calcium and blood lipids, and that might be due to the intake of foods with high albumin levels, such as nuts, eggs, and dairy products, which are also sources of calcium and lipids (26). Moreover, our study’s [Ca2+]corr optimal cut-off level provides a quantified reference for dyslipidemia management. It could guide clinical standard practices for calcium nutrition. These findings indicated that an appropriate [Ca2+]corr level was beneficial to maintaining serum lipids at reasonable levels. Still, we also raised concerns about the adverse consequences of excessive calcium nutrition, especially for individuals taking calcium supplements (25).
In terms of dyslipidemia-associated components, high [Ca2+]corr was positively associated with increased odds of elevated TC, LDL-C, and Non-HDL-C in our study. Similar findings for the positive association between [Ca2+]corr and high TC and high LDL-C were also observed in the pediatric study (21). This finding indicated that keeping [Ca2+]corr at a reasonable level might be a new lipid treatment option, and thereby provide a potential intervention target for CVD management (27, 28). Regulation of calcium ion levels can be used as an adjunct to statin therapy for patients at high risk of CVD who need to lower LDL-C levels. Interestingly, a negative association between [Ca2+]corr and reduced HDL-C odds was also observed in our study. Although this finding agreed with Bacquer et al. (29) and Peng et al. (21), others disagreed, e.g., serum calcium was not associated with HDL-C in a study by Saltevo et al. in a general Finnish population (30) and also Chou et al. in Taiwanese community-dwelling adults (31). In our study, a non-linear association between [Ca2+]corr and HDL-C was also verified by Loess analysis. Therefore, we speculate different statistical methods in some studies may cause these inconsistencies. Specifically, Saltevo et al. (32) and Chou et al. examined associations using linear analysis methods, which may have masked non-linear differences (33). Also, while Kivela et al. reported the sterol regulatory element-binding protein (SREBP) activator, vascular endothelial growth factor A, increased HDL cholesterol levels (34), the underlying association between [Ca2+]corr and HDL-C remained unclear. These findings suggested [Ca2+]corr is a double-edged sword for serum lipid regulation. The balance of benefit and risk of [Ca2+]corr on serum lipid levels needs to be carefully weighed during clinical decision making. At the same time, the potential predictive value of [Ca2+]corr in the control of dyslipidemia, even CVD, is worth more in-depth research in the future.
As for the S-shaped relationship between [Ca2+]corr and TC LDL-C, and Non-HDL-C levels, we noted a linear increase range of the trend in 2.1–2.4 mmol/L of [Ca2+]corr and a declining trend at both ends of the drawing. A plausible explanation was the reserve capacity of the secretion of parathyroid hormone on the homeostasis of calcium regulation (35). In addition, non-linear dose-response associations between [Ca2+]corr and serum lipid profiles indicated why TG/HDL-C ratios might be more valuable than isolated lipids to predict atherogenicity (36) and CVD events (37). The underlying mechanism could be that TG/HDL-C ratios as a hinge function can magnify the scale of serum lipids change as large as possible at low and high calcium levels, therefore more sensitive to depict the covariant relations between TG and HDL-C (Supplementary Figure 1). Therefore, TG/HDL-C ratios could be used as meaningful indicators for dyslipidemia monitoring, and the clinical value of TG/HDL-C ratios in calcium or serum lipid-related diseases warrants more research.
Although the relationships between [Ca2+]corr and serum lipid profiles were comprehensively clarified, our study had limitations. Firstly, this was a cross-sectional study. Therefore, causality effects should be assessed by longitudinal studies in the future. Secondly, we included health examination individuals and not patients, so association extrapolations to patient populations should be made with caution. Thirdly, several parameters influencing [Ca2+]corr homeostasis and serum lipids levels, such as vitamin D, parathyroid hormone, and disease/medication history, were not collected. Although this study cannot rule out the influence of these factors, physical examinees, if having medication, tend to take calcium supplements and lipid-lowering medicine, which might weaken the association between [Ca2+]corr and serum lipids. We still found a significant association under conservative estimation in our study. Therefore, the impact of medication use on the association could be neglected.
In conclusion, [Ca2+]corr was positively associated with increased odds of dyslipidemia and elevated TC, LDL-C, and Non-HDL-C but inversely associated with decreased HDL-C odds among Chinese adults. Thus, [Ca2+]corr should be considered a valuable indicator for dyslipidemia management.
Data Availability Statement
The original contributions presented in this study are included in the article/Supplementary Material, further inquiries can be directed to the corresponding authors.
Ethics Statement
This study was approved by the Ethics Committee of the First Affiliated Hospital of China Medical University (approval No. 2020-323). Informed consent was waived as this was a retrospective study.
Author Contributions
KY designed the study. KY, WW, and XH conducted the data collection. KY conducted the data analysis and drafted the manuscript. XH revised the manuscript. All authors read and approved the final manuscript version for publication.
Funding
This research received CAMS Innovation funding for Medical Sciences (2019-I2M-5-027), National Key R&D Program of Liaoning Province (2019JH2/10100027), National Key Research and Development Program of China (2020AAA0109400), and Liaoning Natural Science Foundation Project (2020-BS-091).
Conflict of Interest
The authors declare that the research was conducted in the absence of any commercial or financial relationships that could be construed as a potential conflict of interest.
Publisher’s Note
All claims expressed in this article are solely those of the authors and do not necessarily represent those of their affiliated organizations, or those of the publisher, the editors and the reviewers. Any product that may be evaluated in this article, or claim that may be made by its manufacturer, is not guaranteed or endorsed by the publisher.
Acknowledgments
We thank study participants whose data were used for these analyses.
Supplementary Material
The Supplementary Material for this article can be found online at: https://www.frontiersin.org/articles/10.3389/fcvm.2022.916991/full#supplementary-material
Supplementary Figure 1 | Non-linearity relationship between [Ca2+]corr and TG/HDL-C ratio. [Ca2+]corr, corrected serum ionized calcium; TG, triglyceride; HDL-C, high-density lipoprotein cholesterol.
Abbreviations
CVD, cardiovascular disease; TC, total cholesterol; TG, triglycerides; LDL-C, low-density lipoprotein cholesterol; HDL-C, high-density lipoprotein cholesterol; Non-HDL-C, non-high-density lipoprotein cholesterol; Ca2+, ionized calcium; [Ca2+]corr, corrected serum ionized calcium; FSG, fasting serum glucose; SBP, systolic blood pressure; DBP, diastolic blood pressure; BMI, body mass index; ALT, alanine aminotransferase; AST, aspartate aminotransferase; SCR, serum creatinine; eGFR, estimated glomerular filtration rate; RBC, red blood cells; HGB, hemoglobin concentration; PCT, plateletcrit; HCT, red blood cell specific volume; MCV, mean corpuscular volume; MCH, mean corpuscular hemoglobin; MCHC, mean corpuscular hemoglobin concentration; PLT, platelet counts; PDW, platelet distribution width; P-LCR, large platelet ratio; PCT, plateletcrit; MPV, mean platelet volume; OR, odds ratio; CI, confidence intervals; IQR, interquartile range; SD, standard deviation; AOR, adjusted odds ratio; Locally weighted regression (Loess).
Footnotes
References
1. Lu Y, Wang P, Zhou T, Lu J, Spatz ES, Nasir K, et al. Comparison of prevalence, awareness, treatment, and control of cardiovascular risk factors in china and the united states. J Am Heart Assoc. (2018) 7:e7462. doi: 10.1161/JAHA.117.007462
2. Munteanu MA, Gh Eor Gh EG, Stanescu A, Bratu OG, Diaconu CC. What is new regarding the treatment of dyslipidemia in the 2019 European Society of Cardiology Guidelines? Arch Balk Med Union. (2019) 54:749–52. doi: 10.31688/ABMU.2019.54.4.21
3. Musunuru K. Atherogenic dyslipidemia: cardiovascular risk and dietary intervention. Lipids. (2010) 45:907–14. doi: 10.1007/s11745-010-3408-1
4. Zhang M, Deng Q, Wang L, Huang Z, Zhou M, Li Y, et al. Prevalence of dyslipidemia and achievement of low-density lipoprotein cholesterol targets in Chinese adults: a nationally representative survey of 163,641 adults. Int J Cardiol. (2018) 260:196–203.
5. Ca BMBA. 2+ signalling in mitochondria: mechanism and role in physiology and pathology. Cell Calcium. (2003) 34:399–405. doi: 10.1016/S0143-4160(03)00145-3
6. Michos ED, Cainzos-Achirica M, Heravi AS, Appel LJ. Vitamin d, calcium supplements, and implications for cardiovascular health: JACC focus seminar. J Am Coll Cardiol. (2021) 77:437–49. doi: 10.1016/j.jacc.2020.09.617
7. Zhu W, Cai D, Wang Y, Lin N, Hu Q, Qi Y, et al. Calcium plus vitamin D3 supplementation facilitated fat loss in overweight and obese college students with very-low calcium consumption: a randomized controlled trial. Nutr J. (2013) 12:8. doi: 10.1186/1475-2891-12-8
8. Kobylecki CJ, Nordestgaard BG, Afzal S. Plasma ionized calcium and risk of cardiovascular disease: 106 774 individuals from the copenhagen general population study. Clin Chem. (2021) 67:265–75. doi: 10.1093/clinchem/hvaa245
9. Chen Q, Zhang Y, Ding D, Li D, Yang Y, Li Q, et al. Associations between serum calcium, phosphorus and mortality among patients with coronary heart disease. Eur J Nutr. (2017) 57:2457–67. doi: 10.1007/s00394-017-1518-8
10. Anderson J, Kruszka B, Delaney J, He K, Burke GL, Alonso A, et al. Calcium intake from diet and supplements and the risk of coronary artery calcification and its progression among older adults: 10-year follow-up of the multi-ethnic study of atherosclerosis (MESA). J Am Heart Assoc. (2016) 5:e3815. doi: 10.1161/JAHA.116.003815
11. Bringhurst FR, Demay MB, Krane SM, Kronenberg HM. Bone and mineral metabolism in health and disease. 16th ed. In: DL Kasper, E Braunwald, S Hauser, D Longo, JL Jameson, AS Fauci editors. Harrisons Principles of Internal Medicine. New York: McGraw (2005).
12. Joint Committee for Developing Chinese guidelines on Prevention and Treatment of Dyslipidemia in Adults. Chinese guidelines on prevention and treatment of dyslipidemia in adults. Zhonghua Xin Xue Guan Bing Za Zhi. (2007) 35:390–419.
13. Opoku S, Gan Y, Fu W, Chen D, Addo-Yobo E, Trofimovitch D, et al. Prevalence and risk factors for dyslipidemia among adults in rural and urban China: findings from the China National Stroke Screening and prevention project (CNSSPP). BMC Public Health. (2019) 19:1500. doi: 10.1186/s12889-019-7827-5
14. DSOC Association. Chinese guidelines for the prevention and treatment of type 2 diabetes (2013 Edition). Chin J Diabetes. (2014) 6:447–98.
15. Liu LS. 2010 Chinese guidelines for the management of hypertension. Chin J Hypertens. (2011) 39:579–615.
16. Stevens LA, Claybon MA, Schmid CH, Chen J, Horio M, Imai E, et al. Evaluation of the chronic kidney disease epidemiology collaboration equation for estimating the glomerular filtration rate in multiple ethnicities. Kidney Int. (2011) 79:555–62. doi: 10.1038/ki.2010.462
17. Jin B, Bai X, Han L, Liu J, Zhang W, Chen X. Association between kidney function and Framingham global cardiovascular disease risk score: a Chinese longitudinal study. PLoS One. (2014) 9:e86082. doi: 10.1371/journal.pone.0086082
18. Dickerson RN, Alexander KH, Minard G, Croce MA, Brown RO. Accuracy of methods to estimate ionized and “corrected” serum calcium concentrations in critically ill multiple trauma patients receiving specialized nutrition support. JPEN J Parenter Enteral Nutr. (2004) 28:133–41. doi: 10.1177/0148607104028003133
19. Gallo L, Faniello MC, Canino G, Tripolino C, Gnasso A, Cuda G, et al. Serum calcium increase correlates with worsening of lipid profile: an observational study on a large cohort from south italy. Medicine. (2016) 95:e2774. doi: 10.1097/MD.0000000000002774
20. Farhangi MA, Ostadrahimi A, Mahboob S. Serum calcium, magnesium, phosphorous and lipid profile in healthy Iranian premenopausal women. Biochem Medica. (2011) 21:312–20. doi: 10.11613/bm.2011.042
21. Peng Y, Hu L, Nie X, Cai S, Yan R, Liu Y, et al. The role of serum calcium levels in pediatric dyslipidemia: Are there any? Front Pediatr. (2021) 9:712160. doi: 10.3389/fped.2021.712160
22. Kim KN, Oh SY, Hong YC. Associations of serum calcium levels and dietary calcium intake with incident type 2 diabetes over 10 years: the Korean genome and epidemiology study (KoGES). Diabetol Metab Syndr. (2018) 10:50. doi: 10.1186/s13098-018-0349-y
23. Revankar CM, Cimino DF, Sklar LA, Arterburn JB, Prossnitz ER. A transmembrane intracellular estrogen receptor mediates rapid cell signaling. Science. (2005) 307:1625. doi: 10.1126/science.1106943
24. Reid IR. Effects of calcium supplementation on circulating lipids: potential pharmacoeconomic implications. Drugs Aging. (2004) 21:7–17. doi: 10.2165/00002512-200421010-00002
25. Reid IR, Gamble GD, Bolland MJ. Circulating calcium concentrations, vascular disease and mortality: a systematic review. J Intern Med. (2016) 279:524–40.
26. Van der Vusse GJ, Glatz JF, Van Nieuwenhoven FA, Reneman RS, Bassingthwaighte JB. Transport of long-chain fatty acids across the muscular endothelium. Adv Exp Med Biol. (1998) 441:181–91. doi: 10.1007/978-1-4899-1928-1_17
27. Wang WA, Liu WX, Durnaoglu S, Lee SK, Lian J, Lehner R, et al. Loss of calreticulin uncovers a critical role for calcium in regulating cellular lipid homeostasis. Sci Rep. (2017) 7:5941. doi: 10.1038/s41598-017-05734-x
28. Su L, Mittal R, Ramgobin D, Jain R, Jain R. Current management guidelines on hyperlipidemia: the silent killer. J Lipids. (2021) 2021:9883352. doi: 10.1155/2021/9883352
29. Bacquer DD, Henauw SD, Backer GD, Kornitzer M. Epidemiological evidence for an association between serum calcium and serum lipids. Atherosclerosis. (1994) 108:193.
30. Reid IR, Mason B, Horne A, Ames R, Clearwater J, Bava U, et al. Effects of calcium supplementation on serum lipid concentrations in normal older women. Am J Med. (2002) 112:343–7. doi: 10.1016/s0002-9343(01)01138-x
31. Chou CW, Fang WH, Chen YY, Wang CC, Chen WL. Association between serum calcium and risk of cardiometabolic disease among community-dwelling adults in Taiwan. Sci Rep. (2020) 10:3192. doi: 10.1038/s41598-020-60209-w
32. Saltevo J, Niskanen L, Kautiainen H, Teittinen J, Oksa H, Korpi-Hyovalti E, et al. Serum calcium level is associated with metabolic syndrome in the general population: FIN-D2D study. Eur J Endocrinol. (2011) 165:429–34. doi: 10.1530/EJE-11-0066
33. Desquilbet L, Mariotti F. Dose-response analyses using restricted cubic spline functions in public health research. Stat Med. (2010) 29:1037–57. doi: 10.1002/sim.3841
34. Kivela AM, Dijkstra MH, Heinonen SE, Gurzeler E, Jauhiainen S, Levonen AL, et al. Regulation of endothelial lipase and systemic HDL cholesterol levels by SREBPs and VEGF-A. Atherosclerosis. (2012) 225:335–40. doi: 10.1016/j.atherosclerosis.2012.09.039
35. Hagstrom E, Hellman P, Larsson TE, Ingelsson E, Berglund L, Sundstrom J, et al. Plasma parathyroid hormone and the risk of cardiovascular mortality in the community. Circulation. (2009) 119:2765–71. doi: 10.1161/CIRCULATIONAHA.108.808733
36. Millán J, Pintó X, Muoz A, Zúiga M, Pedro-Botet J. Lipoprotein ratios: physiological significance and clinical usefulness in cardiovascular prevention. Vasc Health Risk Manag. (2009) 5:757–65.
Keywords: corrected serum ionized calcium, dyslipidemia, dose-response relationship, stratified analyses, non-linear association
Citation: Yun K, Zhang S, Yang X, Man D, Yao J, Wang W and Han X (2022) Corrected Serum Ionized Calcium as a Risk Factor Related to Adult Dyslipidemia. Front. Cardiovasc. Med. 9:916991. doi: 10.3389/fcvm.2022.916991
Received: 11 April 2022; Accepted: 13 June 2022;
Published: 06 July 2022.
Edited by:
Maciej Banach, Polish Mother’s Memorial Hospital Research Institute, PolandReviewed by:
Aleksandra Klisic, Primary Health Care Center Podgorica, MontenegroSunita Dodani, Eastern Virginia Medical School, United States
Cezary Wojcik, Amgen, United States
Copyright © 2022 Yun, Zhang, Yang, Man, Yao, Wang and Han. This is an open-access article distributed under the terms of the Creative Commons Attribution License (CC BY). The use, distribution or reproduction in other forums is permitted, provided the original author(s) and the copyright owner(s) are credited and that the original publication in this journal is cited, in accordance with accepted academic practice. No use, distribution or reproduction is permitted which does not comply with these terms.
*Correspondence: Wei Wang, Njg5OXdhbmd3ZWlAMTYzLmNvbQ==; Xiaoxu Han, aGFueGlhb3h1QGNtdS5lZHUuY24=
†ORCID: Ke Yun, orcid.org/0000-0003-4030-4490; Xiaoxu Han, orcid.org/0000-0003-1427-8428