Abstract
Objective:
To develop a novel in vitro method for evaluating coronary artery ischemia using a combination of non-invasive coronary CT angiograms (CCTA) and 3D printing (FFR3D).
Methods:
Twenty eight patients with varying degrees of coronary artery disease who underwent non-invasive CCTA scans and invasive fractional flow reserve (FFR) of their epicardial coronary arteries were included in this study. Coronary arteries were segmented and reconstructed from CCTA scans using Mimics (Materialize). The segmented models were then 3D printed using a Carbon M1 3D printer with urethane methacrylate (UMA) family of rigid resins. Physiological coronary circulation was modeled in vitro as flow-dependent stenosis resistance in series with variable downstream resistance. A range of physiological flow rates (Q) were applied using a peristaltic steady flow pump and titrated with a flow sensor. The pressure drop (ΔP) and the pressure ratio (Pd/Pa) were assessed for patient-specific aortic pressure (Pa) and differing flow rates (Q) to evaluate FFR3D using the 3D printed model.
Results:
There was a good positive correlation (r = 0.87, p < 0.0001) between FFR3D and invasive FFR. Bland-Altman analysis revealed a good concordance between the FFR3D and invasive FFR values with a mean bias of 0.02 (limits of agreement: −0.14 to 0.18; p = 0.2).
Conclusions:
3D printed patient-specific models can be used in a non-invasive in vitro environment to quantify coronary artery ischemia with good correlation and concordance to that of invasive FFR.
Introduction
Obstructive coronary artery disease (CAD) is one of the most common type of cardiovascular disease (1). The evaluation and diagnosis of CAD remains a challenging task. Anatomical and functional assessment through invasive coronary angiography (ICA) is the current reference standard to indicate the presence, location, and extent of a stenosis/obstruction. Stenoses that are functionally significant (flow limiting/ischemia causing) need to be treated invasively to reduce CAD morbidity (2–5). On the contrary, invasive treatment of functionally non-significant stenoses may lead to harmful outcomes (3, 6). Thus, the independent evaluation of this disease either by non-invasive or invasive approaches is of utmost importance for the selection of appropriate and optimized therapeutic methods such as bypass surgery, stents or drug therapy while treating a patient.
Non-invasive imaging methods like coronary CT angiography (CCTA) not only help identify patients with suspected CAD, but also allow for visualization/quantification of the coronary artery stenosis (7). Although CCTA has high sensitivity in determining the functional significance of the stenosis and ruling out CAD, its corresponding specificity is lower (8–11). Hence, patients with obstructive CAD typically undergo an additional procedure like ICA to further determine the functional significance of the stenosis by invasively measuring the fractional flow reserve (FFR; ratio of average pressures distal [Pd] and proximal [Pa] to a stenosis at maximal hyperemia). FFR is the current clinical gold standard for both establishing the functional significance of a stenosis and also to guide its treatment. In order to reduce the number of unnecessary invasive procedures, non-invasive determination of the functional significance of stenoses based on CCTA images is being extensively investigated (12–14).
Recently, 3D printing, an additive manufacturing technique that enables direct fabrication of physical models based on digital objects of arbitrary geometry, has become more common; particularly for medical device and healthcare applications (15, 16). The purpose of this research is to develop a novel in vitro method to evaluate coronary artery ischemia using 3D printed coronary arteries whose 3D geometric features are derived from non-invasive coronary CT angiograms (CCTA). An in vitro flow circulation system representative of invasive measurements in a cardiac catheterization laboratory was developed to experimentally evaluate the hemodynamic parameters of pressure and flow across patient-specific 3D printed models. Our overall goal is to develop a novel non-invasive system for determining patient-specific thresholds of ischemia and to validate this system in a unique clinical trial of individuals with comprehensive physiologic measurements. In this pilot study, the concordance between the FFR values measured in vitro using 3D printed models (FFR3D) and the gold standard (invasive FFR) is also examined.
Methods
This study was performed as a prespecified secondary aim of the CREDENCE study, to investigate the mechanism by which plaque characteristics may impact fractional flow reserve via their material properties (17). An in vitro flow circulation system representative of invasive measurements in a cardiac catheterization laboratory was developed to experimentally evaluate the hemodynamic parameters of pressure and flow across a pilot cohort of twenty eight patient-specific 3D printed coronary artery models. Experiments were based on patient's image data and hemodynamic parameters, which were De-identified prior to study. The details of the study population and experimental setup are discussed below.
Study Patients
A random subset of twenty eight patients from the multicenter CREDENCE trial (Clinical Trials Gov., ID: NCT02173275) were included in this pilot study. The CREDENCE trial is a prospective, multicenter diagnostic derivation-validation controlled clinical trial that recruited 612 stable patients, without a prior diagnosis of CAD from 2014–2017. Patients were recruited across 17 centers in the Unites States, Netherlands, Japan, China, Latvia, Italy, and South Korea. The rationale and design of the CREDENCE trial has been described in a previous study (17). Briefly, enrolled patients underwent both CCTA and Myocardial perfusion imaging tests (MPI), followed by invasive coronary angiography (ICA) with FFR measurements in three epicardial coronary arteries. Eligibility criteria included referral to non-emergent ICA according to the American College of Cardiology/American Heart Association clinical practice guidelines for stable ischemic heart disease (18, 19). All the non-invasive and invasive imaging tests were interpreted blindly by core laboratories. The institutional review board of each enrolling site approved the study protocol and all patients provided written informed consent.
Image Acquisition
CCTA imaging was performed using a single or dual source CT scanner with at least 64-detector rows and a detector row width of ≤0.75 mm (17). Scans were performed retrospectively (65%), prospectively (27%), or with single-beat (8%) acquisitions. Sites were instructed to perform CCTA in accordance with quality standards set forth by the Society of Cardiovascular Computed Tomography (SCCT) guidelines (20). The CCTA images were exported into a DICOM (Digital Imaging and Communications in Medicine) format. Patient-specific 3D coronary artery models were then segmented from this CT volume data, in DICOM format, using Mimics image processing software (Mimics 18.0, Materialize, Leuven, Belgium).
Image Segmentation and 3D Printing of Coronary Vessel Models
In total, twenty eight patient-specific 3D coronary artery models [five right coronary artery (RCA), five left circumflex coronary artery (LCX) and 18 left anterior descending artery (LAD)] have been segmented from the CCTA images of 28 patients. Segmentation was performed by defining a range of thresholding value to obtain the segmentation mask of the region of interest (blood volumes for the aorta and coronary vessels) in Mimics (Mimics 18.0, Materialize, Leuven, Belgium). The thresholding value for the region of interest in general different for different patients but is within the range of soft tissue. After setting an optimal thresholding value, a region growing function was used to generate the coronary artery mask along with some unwanted mask (mask volumes unrelated to coronaries) which is later edited manually. This segmented mask was then assessed by an independent experienced cardiologist (SJ) who is blinded to both CCTA and ICA results. A patient-specific 3D aorto coronary lumen surface model, from this final segmented mask, was saved in the Steriolithography (STL) geometric file format. The meshes were then moved to GeomagicTM to simplify the mesh (by linear subdivision) and add smoothness to the mesh. The corresponding coronary vessel of interest (RCA/LCX and/or LAD) without branches, from this aorto-coronary surface geometry (lumen), was then: (i) extracted; (ii) thickened outwards by 1 mm from the lumen surface to represent arterial thickness; and (iii) coupled with appropriate barb fittings at its inlet and outlet in solid works (Dassault Systemes, France; Figure 1A). These coronary vessel models with barb fittings in STL geometric format were then printed using a Carbon M1 3D printer (Carbon Inc., California, United States) with urethane methacrylate (UMA) family of rigid resins. The Carbon M1 3D printer uses an additive manufacturing methodology called projection stereolithography apparatus (21) (SLA); which builds/fabricates models layer by layer using a curable photopolymer (liquid resin). Apart from the higher resolution, an additional advantage of using the SLA methodology to 3D print the coronary vessels is that there is no support material in the lumen that needs to be removed post-printing [for e.g., like in PolyJet printing method (22)]. Thus, 3D printing the models using an SLA methodology not only saves time (post-print cleaning), but also yields a smooth lumen surface in the 3D printed model, similar to that in the 3D geometric model.
Figure 1
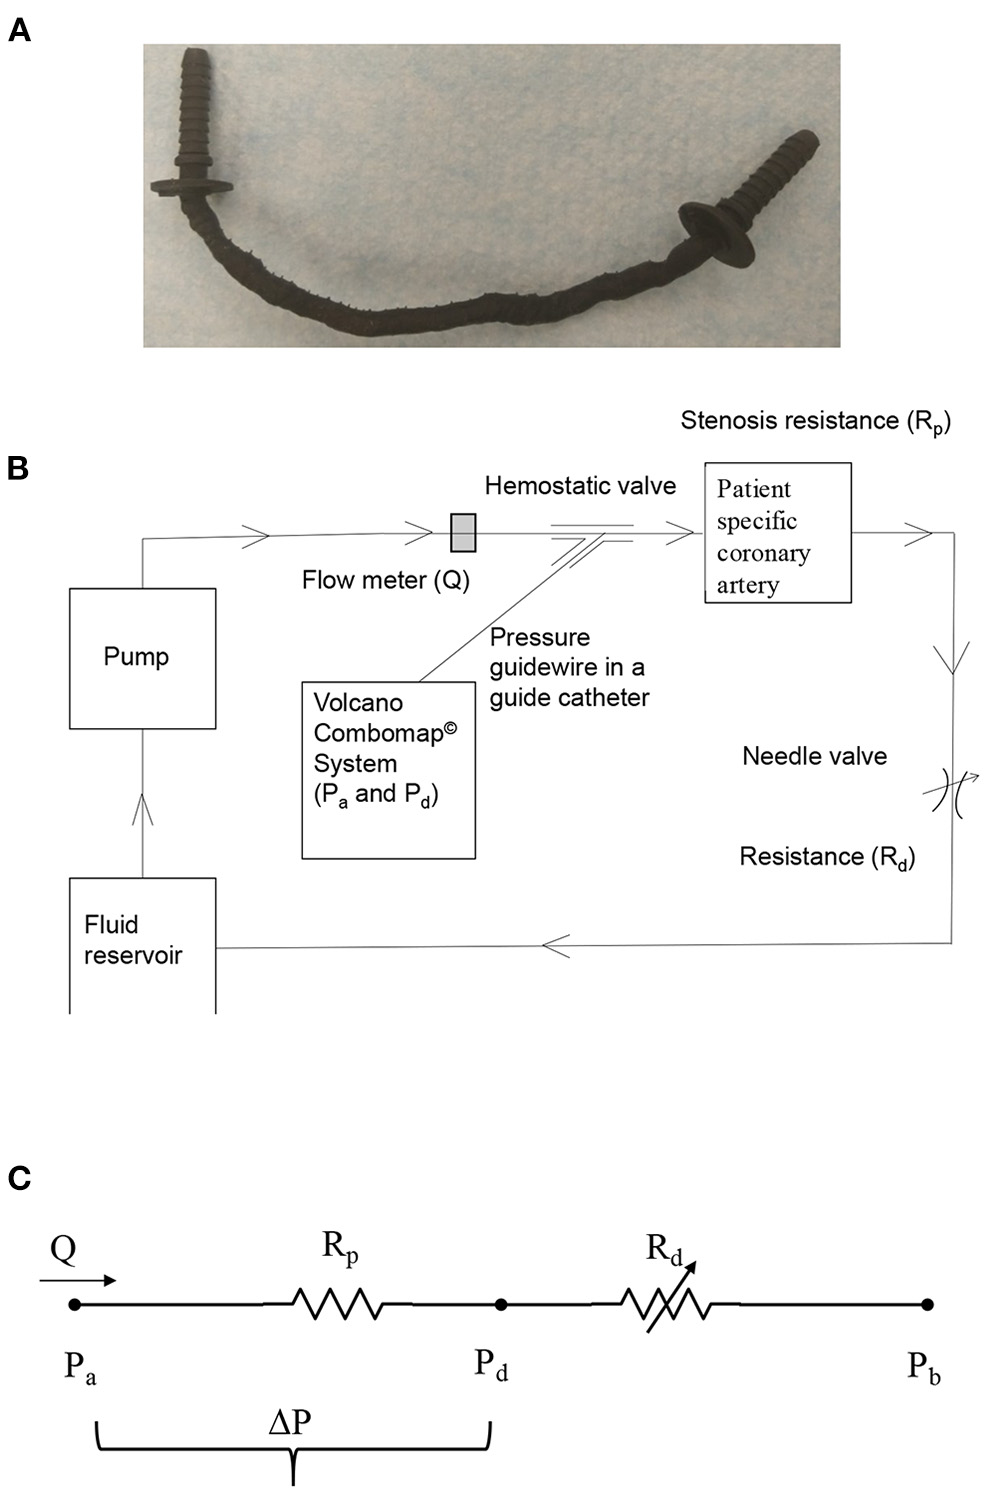
(A) 3D printed patient-specific LAD coronary artery; (B) schematic of in vitro coronary flow-loop setup for FFR3D; and (C) electrical analog model of the flow-loop with two resistances in series. Rp, stenosis resistance from the 3D printed model; Rd, coronary microvascular resistance; Q, flow through stenosed artery measured by the flowmeter; Pa, aortic pressure; Pd, pressure distal to the stenosis; ΔP = Pa-Pd, pressure-drop across stenosis; Pb, coronary outflow pressure.
In vitro Flow Circulation System
The coronary flow system, shown in Figure 1B, was used to perform the in vitro experiments under physiologic steady flow conditions of pressure and flow. The flow was maintained to be quasi-steady in the flow system and mean flow rate was used as the relevant maximum flow rate scale (perceived hyperemia). A 60:40 mixture (by volume) of distilled water and glycerol (Shelley Medical Imaging Technologies, Ontario), having a viscosity (4.5 cP) and density (1.04 g/cm3) similar to that of blood was selected for use in the experiment as the Newtonian blood-analog fluid (BAF). Previous studies have shown that Newtonian assumption has lesser influence on flow field in medium to large sized arteries such as coronary artery (23–25).
A Cole-Parmer digital gear-drive pump (model # EW-74014-42) was used to impart and vary the flow rates in the flow system. The circulation system was modeled as a flow-dependent stenosis resistance (Rp) in series with an adjustable downstream resistance (Rd; needle valve [model # EW-06394-04]) (26). The corresponding electrical analog of the model is shown in Figure 1C. The fluid reservoir is open to atmosphere, thus assuming Pb in Figure 1C to be zero. The fluid reservoir, pump, 3D printed coronary vessel model and the needle valve were connected to form a closed loop using flexible Platinum-cured Silicone tubing.
Experimental Setup
In order to mimic the pressure measurement in a cardiac catheterization laboratory setting, a 5F diagnostic catheter was advanced proximal to the stenosis section through a cannula. The aortic pressure (Pa) was measured through a fluid-filled line connected to a Namic disposable transducer (Navilyst Medical) and the coronary guiding catheter. “A 0.014” pressure sensor-tipped guidewire, connected to a Volcano ComboMap machine (Volcano Corp.,), was set to zero, advanced via an introducer needle and a hemostatic valve through the diagnostic catheter. The pressure sensor-tipped guidewire was then calibrated, normalized to the diagnostic catheter, and advanced distal to the stenosis section. The pressure distal to the stenosis (Pd) was measured through this pressure sensor-tipped guidewire. Inlet flow rate into the stenosis test section was measured using a transit-time ultrasound clamp-on flow sensor (Transonic Inc.,TS410-ME4PXL).
Experimental Protocol
The 3D printed patient specific coronary vessel models were fixed in the flow system one at a time, as shown in Figure 1B. The BAF was then allowed to circulate through the flow system for about 5 min prior to the experiment in order to achieve steady state conditions and care was taken so that the flow loop did not have any air-bubbles during the experiment. The aortic pressure (Pa) for each 3D printed model was maintained at a constant value as measured during invasive coronary angiography for the corresponding patient. This constant inlet aortic pressure (Pa) condition is achieved, under different flow rates, by varying the needle valve resistance (Rd) that mimicked adjustable microcirculatory resistance. The distal pressure (Pd) for each varying flow rate was measured only after pulling back the pressure guidewire into the diagnostic catheter, renormalizing and advancing across the stenosis, to avoid the effect of drift on the measurements. Three sets (n = 3) of experiments were carried out and the three pressure-flow data sets were averaged to obtain the pressure drop- flow rate (ΔP–Q; Supplementary Figure 1) for each. The pressure ratio (Pd/Pa) at differing prescribed flow rates (Q), applied to each of the 3D printed model was then assessed from the ΔP–Q curves (Supplementary Figure 2).
Determination of Hyperemic Flow
The physiological flow conditions like pharmacologically induced hyperemia are unknown in the in vitro experimental setup. However, the methodology for estimating hyperemia using maximal vasodilation-distal perfusion pressure plot (CFR-Pd) was previously proposed by Kirkeeide et al. (27) and reported in an in vitro setting by Sinha Roy et al. (28) assuming a resting blood flow rate of 50 mL/min for a 3 mm native diameter vessel. Utilizing this resting blood flow value, the hyperemic flow rates, Qh, were obtained using the intersection of the (CFR-Pd) line and the experimental ΔP–Q curve (Supplementary Figure 3). The CFR-Pd line was a linear curve fit based on previously reported clinical data from 32 patients' (29) group with normal microvasculature. These patients had no evidence of myocardial infarction (MI), no left ventricular hypertrophy, no valvular heart disease, and a normal left ventricular ejection fraction. The Y-intercept of the CFR-Pd line is denoted as zero-flow mean pressure (Pzf), which represents the residual pressure at no flow. Physiologically realistic Pzf values of 20 mmHg, as reported in a previous clinical study (30, 31), were also used in the maximal vasodilation CFR-Pd line (Supplementary Figure 3). The distal bed-resistance (Rd) offered by the microvasculature to the flow can then be evaluated as below:
Statistical Analysis
The association between FFR3D and FFR was assessed by Bland–Altman plots with 95% limits of agreement and spearman correlation coefficient. The receiver operating characteristic (ROC) curve with a corresponding area under the ROC curve (AUC) was performed to assess the per-vessel discrimination of functional ischemia by FFR3D, using invasive FFR ≤ 0.8 as the reference standard. Youden's index was used to determine the optimal threshold value of FFR3D. Statistical analyses were performed using Medcalc (Ostende, Belgium) with p-value <0.05 considered to indicate a statistically significant result.
Results
Baseline Patient Characteristics
The baseline clinical characteristics of the twenty eight patients/vessels (5 RCA, 5 LCX, and 18 LAD) are summarized in Table 1. The average age of the study population was at 65.3 ± 8.3 years. The prevalence of known cardiovascular risk factors among this cohort was 25% for diabetes, 64% for hypertension, 43% for Dyslipidemia, 36% for family history of CAD and 21% for past history of smoking. The study population consisted of intermediate coronary stenosis with a mean diameter stenosis of 53.7 ± 17.1% after quantitative CT measurements. Significant stenosis (>50 diameter stenosis) was observed in 61% of study population.
Table 1
| Characteristic | Data |
|---|---|
| Age (y)* | 65.3 ± 8.3 |
| Male-to-female ratio | 21:7 |
| Diabetes | 7 (25%) |
| Hypertension | 18 (64%) |
| Dyslipidemia | 12 (43%) |
| Family history of CAD | 10 (36%) |
| Past history of smoking | 6 (21%) |
| >50% stenosis by CT | 17 (61%) |
| Number of vessels (LAD/LCX/RCA) | 18/5/5 |
Baseline patient characteristics.
Data are means ± standard deviation.
Correlation and Concordance Between FFR3D (in vitro) and FFR (Invasive)
No significant difference was observed in the mean values between FFR3D and invasive FFR values (0.78 ± 0.11 and 0.76 ± 0.15, p=0.57; Figure 2). For these twenty eight models, there was also a good positive correlation as determined by the Spearman coefficient of correlation (r = 0.87, p < 0.0001; Figure 3) between the FFR3D and invasive FFR. Further, Bland–Altman analysis (Figure 4) revealed a mean bias of 0.02 (limits of agreement: −0.14 to 0.18; p = 0.2), which was proportional to the average of FFR (Spearman r = 0.42; p = 0.025). Thus, suggesting that the concordance between FFR3D and invasive FFR for the assessment of ischemic severity was good.
Figure 2
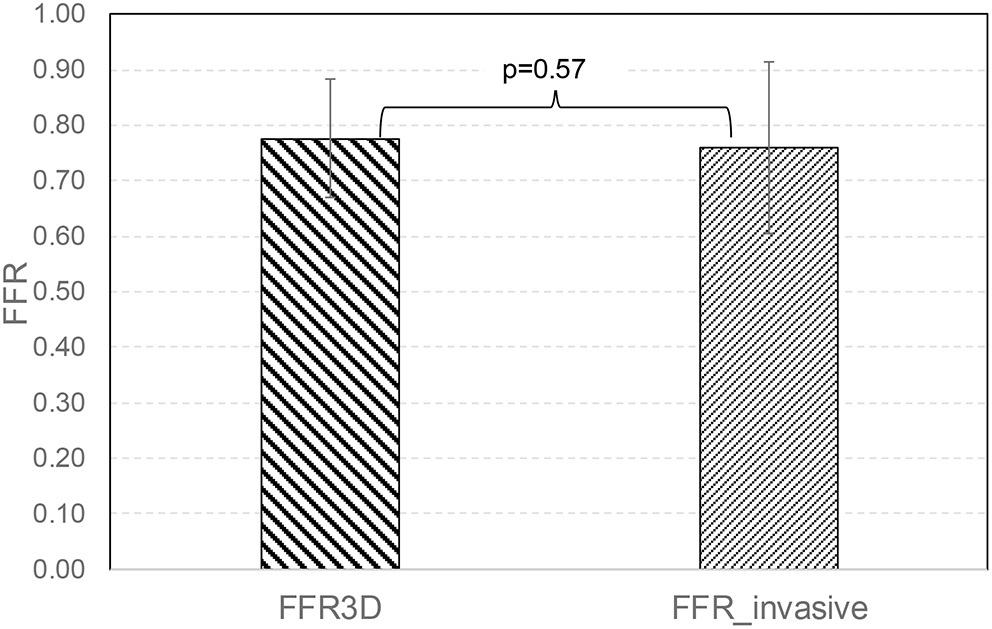
Mean value comparison between FFR3D and invasive FFR.
Figure 3
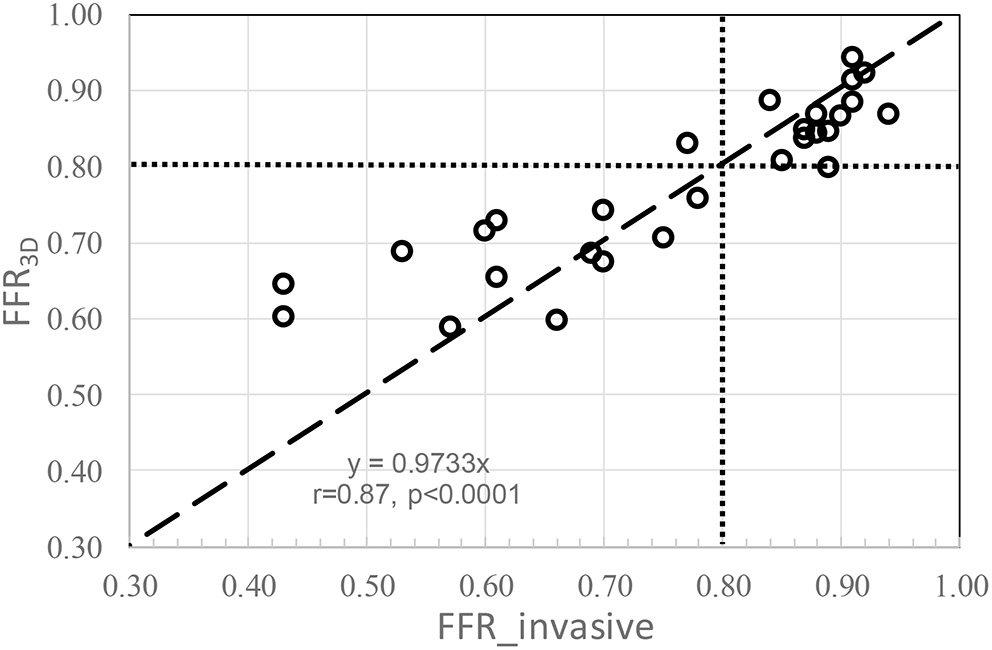
Correlation between FFR3D and invasive FFR (dotted lines represent an FFR value of 0.80).
Figure 4
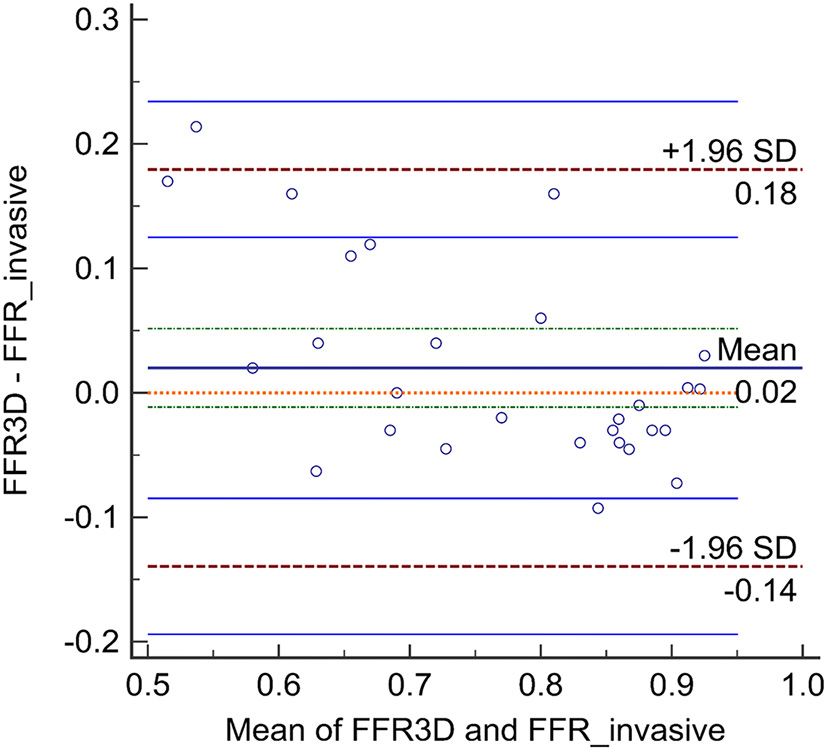
Bland-Altman analysis between FFR3D and invasive FFR.
In the twenty eight vessels, there were 15 (54%) vessels with an invasive FFR ≤ 0.8 signifying the presence of ischemia. The area under the receiver operating curve with regards to discriminating ischemic lesions by FFR3D at the invasive FFR threshold of 0.80 is displayed in Figure 5. ROC analysis for FFR3D demonstrated an AUC of 0.94 (95% CI: 0.78–0.99; p < 0.0001). Youden's index testing establishes a threshold of ≤0.76 for FFR3D, sensitivity = 86.7% (95% CI: 59.5–98.3), specificity = 100 % (95% CI: 75.3–100). This threshold value correctly classified 100% of vessels.
Figure 5
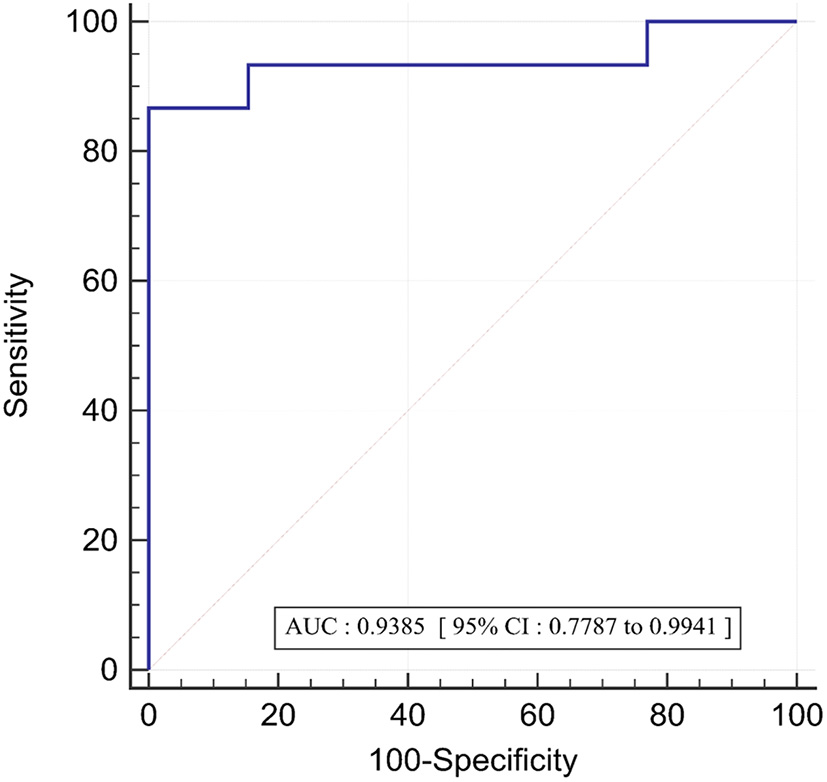
ROC curve for the prediction of functionally significant stenoses (FFR<=0.80) by FFR3D; AUC, area under the curve; ROC, receiver operating curve.
Discussion
An in vitro experimental flow-loop was developed to model physiological coronary circulation in CCTA-derived patient-specific 3D printed coronary vessel geometry as a flow-dependent stenosis resistance (Rp) in series with a downstream resistance (Rd). The in vitro flow circulation system was representative of invasive measurements in a cardiac catheterization laboratory. In this pilot study, twenty eight CCTA-derived patient-specific 3D printed coronary vessels were integrated into this flow loop one at a time to estimate the FFR value in vitro (FFR3D) and compare the same with the corresponding gold standard invasive FFR. We observed that the FFR values estimated from the 3D printed models in vitro (FFR3D) correlated well (r = 0.87; p < 0.0001) with the corresponding invasive FFR values. More importantly, in this pilot study, Bland-Altman analysis revealed a good concordance between the FFR3D and invasive FFR values with a mean bias of 0.02 (limits of agreement: −0.14 to 0.18).
Coronary artery disease (CAD) is one of the main causes of morbidity and mortality worldwide (1, 32, 33). Anatomical assessment through invasive coronary angiography (ICA) remains the gold standard for the diagnosis of CAD. Invasive measurement of fractional flow reserve (FFR); a physiological adjunct to functional stenosis severity when combined with the anatomical assessment from ICA was found to outperform the anatomical assessment alone for diagnosing and guiding treatment to CAD (34, 35). However, FFR is currently used to guide only about 6% of interventions performed in the United States (36) due to limiting factors like adenosine infusion, risk of complications due to invasiveness of using pressure wire in distal vessels for e.g., vessel dissection (occurs in about 0.5% of the procedures) and patient-related contraindications (34, 37, 38) (hypotension, asthma, etc.). To overcome these limitations, there has been a recent interest in developing and using less invasive techniques for assessing both anatomy and physiology. CCTA imaging is one such non-invasive imaging modality that will allow for assessing both anatomy and physiology [for e g., using 3D lumen reconstruction and computational fluid dynamics [CFD]; FFRCT (12–14)].
Conversely, for the first time, in this pilot study using CCTA images, we developed and evaluated a novel in vitro method to assess physiological ischemia from CCTA-derived and 3D printed coronary arteries. Briefly, the programmatic workflow in the proposed methodology on a per-patient basis involves the following three steps: (i) semi-automatic segmentation of lumen from CCTA scans (about ~ 40 min); (ii) 3D printing the segmented model (about ~60 min); and (iii) plugging the 3D model into the existing flow loop to simulate patient-specific physiological conditions and estimate FFR3D (about ~10 min). Thus, currently the total time required to estimate FFR3D from a CCTA scan is about 110 min (~2 h). With the recent developments in automatic reconstruction of coronary arteries from CCTA using deep learning technology and also the advancements in additive manufacturing technology; we believe that we can further reduce the total estimated time to about from 40 to 30 min or even lower in future.
Comparison to FFRCT
Using invasive FFR as a gold standard, the novel approach of combining CT scans and computational fluid dynamics (CFD) for estimating non-invasive FFR (FFRCT) was first evaluated by Koo et al. (12) and Min et al. (13) in a cohort of 103 and 252 patients, respectively. Norgaard et al. (14) in a separate study also concluded that FFRCT has high diagnostic performance when compared to invasive FFR and reported that mean time to computation of FFRCT results was less than 4 h. It should be noted that both FFRCT and FFR3D use segmentation approaches as a first step to generate the lumen geometry from CCTA scans. On this patient-specific lumen geometry, FFRCT uses CFD to solve the Navier-Stokes equations for fluid flow by estimating resting flow and assuming that microcirculation reacts predictably to the physiological condition of maximal hyperemia (39). FFR3D, however, uses the 3D printed models to generate the characteristic non-linear ΔP–Q curves while accounting for the physiological phenomenon of coronary autoregulation and then estimates patient-specific hyperemic condition from these curves in confluence with the linear CFR-Pd line from previous clinical measurements (26). Moreover, the measurement uncertainty (from flow sensor and pressure wire) corresponding each data point in the non-linear ΔP–Q curve (Supplementary Figure 1) was also quantified using uncertainty analysis (40, 41). The uncertainty in pressure-ratio (Pd/Pa) and flow-ratio (Q/Qb) values at each data point due to measurement errors were found to be within 1%. In addition to the above, although the shorter time required to estimate FFR3D (from this pilot study) is advantageous, we believe that a future comprehensive study comparing both FFR3D and FFRCT is still warranted.
Comparison to Quantitative Flow Ratio
Recently, Tu et al. (42) proposed an alternative method, Quantitative flow reserve (QFR), of calculating FFR during in-procedure angiography (43). Briefly, the methodology involves: (i) generating a 3D vessel contour from 2D quantitative coronary angiography (QCA); (ii) followed by hyperemic flow estimation from Thrombolysis in Myocardial Infarction (TIMI) frame count using empirical relations; and (iii) utilization of CFD or simplified analytical equations to estimate QFR at hyperemia [median time for QFR estimation is 5 min (43)]. Tu et al. (42), in their initial study, reported that there was a strong correlation (r = 0.81; p < 0.001) between QFR and invasive FFR with a mean difference of 0.06 (p = 0.054). Similar to these results, our pilot study using 3D printing methodology (FFR3D) also showed a strong correlation (r = 0.87; p < 0.0001) and a lower mean bias (0.02; p = 0.2) when compared to invasive FFR. Although there is a substantial gain in processing time for QFR (5 min) over FFR3D (110 min), it should be noted that QFR is derived from: (i) 3D vessel contour derived from 2D angiograms as opposed to volumetric data used for geometry generation in FFR3D; and (ii) hyperemia estimation from empirical equations as opposed to the physiological scenario of accounting for auto-regulation and micro-circulatory resistance in FFR3D.
Potential Clinical Implications and Future Work
As mentioned previously, physiology-guided decision making using invasive FFR in conjunction with invasive coronary angiography can improve diagnosis and treatment of CAD. However, invasive FFR is currently used to guide only about 6% of interventions performed in the United States (36). One of the main reasons for this can be either the cost of pressure wire and/or the small risk of injuring vessels during pressure wire manipulation [for e g., Side branch dissection (37)]. Alternatively, a complete non-invasive diagnostic approach of combining both anatomy and physiology using CCTA scans and 3D printing (FFR3D) will incur low cost and no risk of dissection.
Currently, the estimation of FFR3D requires some user interaction during the three steps of segmentation, 3D printing and flow loop evaluation. Technological advancements in deep learning based segmentation approaches, 3D printing methodologies (and materials) and using pressure sensing taps on the 3D printed model for direct pressure measurement could further automate and expedite the entire workflow. Moreover, beyond the estimation of FFR3D for CAD diagnosis; the 3D model could also be used for various pre-intervention planning approaches including: (i) estimating the length and type of stent needed to open the blockage; (ii) assessment of post-intervention hemodynamics after inserting a stent into the 3D model to open the vessel; and (iii) physiologically discriminate between focal and diffuse CAD by measuring the drop in pressure across a length of a vessel (i.e., pressure gradient) (44).
Assumptions
The wall of the stenosis geometry was assumed to be rigid in the in vitro experiment. A rigid wall approximation when compared to a compliant wall model is expected to provide a conservative estimate (45) (limiting case) of pressure drop as seen in hyperemia. However, further in vitro experiments with compliant stenosis models are needed for comparison. The resting blood flow was assumed to be a constant value of 50 mL/min in this study. Previously, in a preclinical study with anesthetized dogs, Gould et al. (46) reported that progressive reduction of coronary lumen has no effect on resting blood flow until the vessel is occluded by about 80–85% of the nominal vessel diameter. More recently, Nijjer et al. (47), in a large dataset of real-world patients, that underwent simultaneous intracoronary pressure and flow measurement, also reported that resting flow is preserved despite increasing stenosis severity owing to compensatory reduction in resting microvascular resistance.
The study involves predominantly focal lesions, and we assume that the side branch flow likely affects diffuse lesions differently than focal lesions. Gosling et al. (48), evaluated the effect of side branch flow on non-dimensional physiological flow indices and reported that there was no significant change/effect on the non-dimensional physiological indices (pressure based). The authors report that this phenomenon could be because side branch flow likely affects diffuse lesions differently than focal lesions. However, it should also be noted that in contrast to observations from this study, Sturdy et al. (49) and Vardhan et al. (50) reported that neglecting the side branches increased estimates of wall shear stress and pressure drop.
Limitations
Steady state average pressure and flow values were used in this in vitro experiment because FFR values are defined as the mean pressure ratios. Previously, Huo et al. (51), in an in vitro experiment compared pressure drop between pulsatile flow and steady-state flow. They reported that pressure drop across a stenosis remained relatively unchanged (<5%), provided that the mean value of the pulsatile flow rate (time-averaged over a cardiac cycle) equaled the steady state value. Nevertheless, we plan to extend the present work in the future to study the effects of unsteady pulsatile flow. The blood analog fluid used in the in vitro model has a Newtonian viscosity of 4.5 cP similar to normal blood viscosity data available in existing literature. The viscosity of blood changes with many factors, and may somewhat impact pressure drop due to variability in viscous losses.
This pilot study is limited by its small sample size. We only validated FFR3D on patients with de novo lesions. Selection bias might be involved. Further, the experiments were conducted with patient-specific single coronary vessel models; thus neglecting the effect of branching/bifurcation, serial lesions or collateral flow, which may cause additional levels of pressure drop. Consequently, future studies in a large sample size using patient-specific aorto-coronary 3D-printed models that account for the presence of bifurcation and collateral flow should extend our current work.
Conclusion
In this study, an in vitro experimental flow loop using 3D-printed patient-specific coronary arteries was developed. The flow loop essentially modeled physiological coronary circulation, as flow-dependent stenosis resistance in series with a downstream resistance. The main finding of this study was that 3D printed patient-specific models (FFR3D) can be used in a non-invasive in vitro environment to quantify coronary artery ischemia with good correlation and concordance to that of invasive FFR.
Competency In Medical Knowledge
Invasive FFR is the current gold standard not only for evaluating the functional significance of a stenosis but also to guide treatment. In this pilot study, we developed a novel non-invasive diagnostic approach of combining both anatomy and physiology using CCTA scans and 3D printing (FFR3D) to evaluate coronary artery ischemia. The FFR evaluated using 3D printed patient-specific models had a good correlation and concordance with invasive FFR.
Translational Outlook
Future studies in a large sample size using patient-specific aorto-coronary 3D-printed models that account for the presence of bifurcation and collateral flow are needed to extend our current work. Furthermore, the technological advancements in deep learning based segmentation approaches, 3D printing methodologies (and materials) and utilization of pressure sensing taps on the 3D printed model for direct pressure measurement could further automate and expedite the entire workflow while testing in a larger cohort.
Funding
This manuscript was supported, in part, by grants from the National Institutes of Health, the National Heart Lung and Blood Institute (Grant Nos. R01 HL118019, R01 HL115150, and R21 HL132277), as well as from a generous gift from the Dalio Foundation.
Publisher's Note
All claims expressed in this article are solely those of the authors and do not necessarily represent those of their affiliated organizations, or those of the publisher, the editors and the reviewers. Any product that may be evaluated in this article, or claim that may be made by its manufacturer, is not guaranteed or endorsed by the publisher.
Statements
Data availability statement
The original contributions presented in the study are included in the article/Supplementary Material, further inquiries can be directed to the corresponding author/s.
Ethics statement
The studies involving human participants were reviewed and approved by IRB, WCMC. In vitro experiments were based on patient's image data and hemodynamic parameters, which were deidentified prior to study. Written informed consent for participation was not required for this study in accordance with the National Legislation and the Institutional Requirements.
Author contributions
KK, SD, and BM: designed the study. KK, S-JJ, AZ, AC, SA, AM, PX, and RS: participated in segmenting the image data and 3D printing the in vitro models. KK, SA, and AM: in vitro experimental setup. KK: analyzed the data and drafted the manuscript with all authors. All authors read and approved the final manuscript.
Conflict of interest
Dr. Min has served on the Scientific Advisory Board of Arineta and GE Healthcare; has received funding from the Dalio Foundation, the National Institutes of Health, and GE Healthcare; and has an equity interest in MDDX and Cleerly. Dr. Shaw receives funding from the National Institutes of Health. KK is an employee at Abbott. However, he was an employee of the Dalio Institute of Cardiovascular Imaging, Weill Cornell Medicine, at the time of both executing the study and writing the manuscript. The remaining authors declare that the research was conducted in the absence of any commercial or financial relationships that could be construed as a potential conflict of interest.
Supplementary material
The Supplementary Material for this article can be found online at: https://www.frontiersin.org/articles/10.3389/fcvm.2022.909680/full#supplementary-material
References
1.
Benjamin EJ Virani SS Callaway CW Chamberlain AM Chang AR Cheng S et al . Heart disease and stroke statistics-−2018 update: a report from the american heart association. Circulation. (2018) 137:e67–e492. 10.1161/CIR.0000000000000573
2.
Pijls NH De Bruyne B Peels K Van Der Voort PH Bonnier HJ Bartunek JKJJ et al . Measurement of fractional flow reserve to assess the functional severity of coronary-artery stenoses. N Engl J Med. (1996) 334:1703–8. 10.1056/NEJM199606273342604
3.
Pijls NH Fearon WF Tonino PA Siebert U Ikeno F Bornschein B et al . Fractional flow reserve vs. angiography for guiding percutaneous coronary intervention in patients with multivessel coronary artery disease: 2 year follow-up of the FAME (Fractional Flow Reserve Versus Angiography for Multivessel Evaluation) study. J Am Coll Cardiol. (2010) 56:177–84. 10.1016/j.jacc.2010.04.012
4.
Tonino PA De Bruyne B Pijls NH Siebert U Ikeno F . van' t Veer M, et al. Fractional flow reserve versus angiography for guiding percutaneous coronary intervention. N Engl J Med. (2009) 360:213–24. 10.1056/NEJMoa0807611
5.
van Nunen LX Zimmermann FM Tonino PA Barbato E Baumbach A Engstrom T et al . Fractional flow reserve vs. angiography for guidance of PCI in patients with multivessel coronary artery disease (FAME): 5 year follow-up of a randomized controlled trial. Lancet. (2015) 386:1853–60. 10.1016/S0140-6736(15)00057-4
6.
Pijls NH Tanaka N Fearon WF . Functional assessment of coronary stenoses: can we live without it?Eur Heart J. (2013) 34:1335–44. 10.1093/eurheartj/ehs436
7.
Budoff MJ Dowe D Jollis JG Gitter M Sutherland J Halamert E et al . Diagnostic performance of 64-multidetector row coronary computed tomographic angiography for evaluation of coronary artery stenosis in individuals without known coronary artery disease: results from the prospective multicenter ACCURACY (Assessment by Coronary Computed Tomographic Angiography of Individuals Undergoing Invasive Coronary Angiography) trial. J Am Coll Cardiol. (2008) 52:1724–32. 10.1016/j.jacc.2008.07.031
8.
Bamberg F Becker A Schwarz F Marcus RP Greif M von Ziegler F et al . Detection of hemodynamically significant coronary artery stenosis: incremental diagnostic value of dynamic CT-based myocardial perfusion imaging. Radiology. (2011) 260:689–98. 10.1148/radiol.11110638
9.
Danad I Szymonifka J Twisk JWR Norgaard BL Zarins CK Knaapen P et al . Diagnostic performance of cardiac imaging methods to diagnose ischaemia-causing coronary artery disease when directly compared with fractional flow reserve as a reference standard: a meta-analysis. Eur Heart J. (2016) 38:991–8. 10.1093/eurheartj/ehw095
10.
Ko BS Cameron JD Leung M Meredith IT Leong DP Antonis PR et al . Combined CT coronary angiography and stress myocardial perfusion imaging for hemodynamically significant stenoses in patients with suspected coronary artery disease: a comparison with fractional flow reserve. JACC Cardiovascular Imaging. (2012) 5:1097–111. 10.1016/j.jcmg.2012.09.004
11.
Meijboom WB Van Mieghem CA van Pelt N Weustink A Pugliese F Mollet NR et al . Comprehensive assessment of coronary artery stenoses: computed tomography coronary angiography versus conventional coronary angiography and correlation with fractional flow reserve in patients with stable angina. J Am Coll Cardiol. (2008) 52:636–43.
12.
Koo BK Erglis A Doh JH Daniels DV Jegere S Kim HS et al . Diagnosis of ischemia-causing coronary stenoses by noninvasive fractional flow reserve computed from coronary computed tomographic angiograms. Results from the prospective multicenter DISCOVER-FLOW (Diagnosis of Ischemia-Causing Stenoses Obtained Via Noninvasive Fractional Flow Reserve) study. J Am Coll Cardiol. (2011) 58:1989–97. 10.1016/j.jacc.2011.06.066
13.
Min JK Leipsic J Pencina MJ Berman DS Koo BK van Mieghem C et al . Diagnostic accuracy of fractional flow reserve from anatomic CT angiography. JAMA. (2012) 308:1237–45. 10.1001/2012.jama.11274
14.
Norgaard BL Leipsic J Gaur S Seneviratne S Ko BS Ito H et al . Diagnostic performance of noninvasive fractional flow reserve derived from coronary computed tomography angiography in suspected coronary artery disease: the NXT trial (Analysis of Coronary Blood Flow Using CT Angiography: Next Steps). J Am Coll Cardiol. (2014) 63:1145–55. 10.1016/j.jacc.2013.11.043
15.
Mosadegh B Xiong G Dunham S Min JK . Current progress in 3D printing for cardiovascular tissue engineering. Biomed Mater. (2015) 10:034002. 10.1088/1748-6041/10/3/034002
16.
Vukicevic M Mosadegh B Min JK Little SH . Cardiac 3D printing and its future directions. JACC Cardiovasc Imaging. (2017) 10:171–84. 10.1016/j.jcmg.2016.12.001
17.
Rizvi A Hartaigh BO Knaapen P Leipsic J Shaw LJ Andreini D et al . Rationale and design of the credence trial: computed tomographic evaluation of atherosclerotic determinants of myocardial ischemia. BMC Cardiovasc Disord. (2016) 16:e190. 10.1186/s12872-016-0360-x
18.
Fihn SD Blankenship JC Alexander KP Bittl JA Byrne JG Fletcher BJ et al . 2014 ACC/AHA/AATS/PCNA/SCAI/STS focused update of the guideline for the diagnosis and management of patients with stable ischemic heart disease: a report of the American College of Cardiology/American Heart Association Task Force on Practice Guidelines, and the American Association for Thoracic Surgery, Preventive Cardiovascular Nurses Association, Society for Cardiovascular Angiography and Interventions, and Society of Thoracic Surgeons. J Am Coll Cardiol. (2014) 64:1929–49. 10.1161/CIR.0000000000000095
19.
Montalescot G Sechtem U Achenbach S Andreotti F Arden C Budaj A et al . 2013 ESC guidelines on the management of stable coronary artery disease: the task force on the management of stable coronary artery disease of the European Society of Cardiology. Eur Heart J. (2013) 34:2949–3003. 10.1093/eurheartj/eht296
20.
Leipsic J Abbara S Achenbach S Cury R Earls JP Mancini GJ et al . SCCT guidelines for the interpretation and reporting of coronary CT angiography: a report of the Society of Cardiovascular Computed Tomography Guidelines Committee. J Cardiovasc Comput Tomogr. (2014) 8:342–58. 10.1016/j.jcct.2014.07.003
21.
Tumbleston JR Shirvanyants D Ermoshkin N Janusziewicz R Johnson AR Kelly D et al . Continuous liquid interface production of 3D objects. Science. (2015) 347:1349–52. 10.1126/science.aaa2397
22.
Ionita CN Mokin M Varble N Bednarek DR Xiang J Snyder KV et al . Challenges and limitations of patient-specific vascular phantom fabrication using 3D polyjet printing. Proc SPIE Int Soc Opt Eng. (2014) 9038:90380M. 10.1117/12.2042266
23.
Min S Kang G Paeng DG Choi JH . The reasons why fractional flow reserve and instantaneous wave-free ratio are similar using wave separation analysis. BMC Cardiovasc Disord. (2021) 21:e48. 10.1186/s12872-021-01855-4
24.
Liu H Lan L Abrigo J Ip HL Soo Y Zheng D et al . Comparison of newtonian and non-newtonian fluid models in blood flow simulation in patients with intracranial arterial stenosis. Front Physiol. (2021) 12:e782647. 10.3389/fphys.2021.782647
25.
Johnston BM Johnston PR Corney S Kilpatrick D . Non-newtonian blood flow in human right coronary arteries: steady state simulations. J Biomech. (2004) 37:709–20. 10.1016/j.jbiomech.2003.09.016
26.
Kolli KK Min JK Ha S Soohoo H Xiong G . Effect of varying hemodynamic and vascular conditions on fractional flow reserve: an in vitro study. J Am Heart Assoc. (2016) 5:e003634. 10.1161/JAHA.116.003634
27.
Kirkeeide RL Gould KL Parsel L . Assessment of coronary stenoses by myocardial perfusion imaging during pharmacologic coronary vasodilation. VII Validation of coronary flow reserve as a single integrated functional measure of stenosis severity reflecting all its geometric dimensions. J Am Coll Cardiol. (1986) 7:103–13. 10.1016/S0735-1097(86)80266-2
28.
Roy AS Banerjee RK Back LH Back MR Khoury S Millard RW . Delineating the guide-wire flow obstruction effect in assessment of fractional flow reserve and coronary flow reserve measurements. Am J Physiol Heart Circ Physiol. (2005) 289:H392–7. 10.1152/ajpheart.00798.2004
29.
Wilson RF Johnson MR Marcus ML Aylward PE Skorton DJ Collins S et al . The effect of coronary angioplasty on coronary flow reserve. Circulation. (1988) 77:873–85. 10.1161/01.CIR.77.4.873
30.
Kitabata H Imanishi T Kubo T Takarada S Kashiwagi M Matsumoto H et al . Coronary microvascular resistance index immediately after primary percutaneous coronary intervention as a predictor of the transmural extent of infarction in patients with ST-segment elevation anterior acute myocardial infarction. JACC Cardiovasc Imaging. (2009) 2:263–72. 10.1016/j.jcmg.2008.11.013
31.
Van Herck PL Carlier SG Claeys MJ Haine SE Gorissen P Miljoen H et al . Coronary microvascular dysfunction after myocardial infarction: increased coronary zero flow pressure both in the infarcted and in the remote myocardium is mainly related to left ventricular filling pressure. Heart. (2007) 93:1231–7. 10.1136/hrt.2006.100818
32.
Mendis S Davis S Norrving B . Organizational update: the world health organization global status report on non-communicable diseases 2014; one more landmark step in the combat against stroke and vascular disease. Stroke. (2015) 46:e121–2. 10.1161/STROKEAHA.113.003377
33.
Roth GA Abate D Abate KH Abay SM Abbafati C Abbasi N et al . Global, regional, and national age-sex-specific mortality for 282 causes of death in 195 countries and territories, 1980–2017: a systematic analysis for the Global Burden of Disease Study 2017. Lancet. (2018) 392:1736–88. 10.1016/S0140-6736(18)32203-7
34.
Curzen N Rana O Nicholas Z Golledge P Zaman A Oldroyd K et al . Does routine pressure wire assessment influence management strategy at coronary angiography for diagnosis of chest pain? the RIPCORD study. Circ Cardiovasc Interv. (2014) 7:248–55. 10.1161/CIRCINTERVENTIONS.113.000978
35.
Toth GG Toth B Johnson NP De Vroey F Di Serafino L Pyxaras S et al . Revascularization decisions in patients with stable angina and intermediate lesions: results of the international survey on interventional strategy. Circ Cardiovasc Interv. (2014) 7:751–9. 10.1161/CIRCINTERVENTIONS.114.001608
36.
Wijns W Kolh P Danchin N Di Mario C Falk V Folliguet T et al . Guidelines on myocardial revascularization. Eur Heart J. (2010) 31:2501–55. 10.1093/eurheartj/ehq277
37.
Kumsars I Narbute I Thuesen L Niemela M Steigen TK Kervinen K et al . Side branch fractional flow reserve measurements after main vessel stenting: a Nordic-Baltic Bifurcation Study III substudy. EuroIntervention. (2012) 7:1155–61. 10.4244/EIJV7I10A186
38.
Park E Price A Vidovich MI . Adenosine-induced atrial fibrillation during fractional flow reserve measurement. Cardiol J. (2012) 19:650–1. 10.5603/CJ.2012.0121
39.
Min JK Taylor CA Achenbach S Koo BK Leipsic J Norgaard BL et al . Noninvasive fractional flow reserve derived from coronary ct angiography: clinical data and scientific principles. JACC Cardiovasc Imaging. (2015) 8:1209–22. 10.1016/j.jcmg.2015.08.006
40.
Kline SJ . Describing uncertainty in single sample experiments. Mech Engineering. (1953) 75:3–8.
41.
Moffat RJ . Describing the uncertainties in experimental results. Exp Therm Fluid Sci. (1988) 1:3–17. 10.1016/0894-1777(88)90043-X
42.
Tu S Barbato E Köszegi Z Yang J Sun Z Holm NR et al . Fractional flow reserve calculation from 3-dimensional quantitative coronary angiography and timi frame count: a fast computer model to quantify the functional significance of moderately obstructed coronary arteries. JACC Cardiovasc Imaging. (2014) 7:768–77. 10.1016/j.jcin.2014.03.004
43.
Westra J Tu S Winther S Nissen L Vestergaard MB Andersen BK et al . Evaluation of coronary artery stenosis by quantitative flow ratio during invasive coronary angiography: The WIFI II Study (Wire-Free Functional Imaging II). Circ Cardiovasc Imaging. (2018) 11:e007107. 10.1161/CIRCIMAGING.117.007107
44.
Collet C Sonck J Vandeloo B Mizukami T Roosens B Lochy S et al . Measurement of hyperemic pullback pressure gradients to characterize patterns of coronary atherosclerosis. J Am Coll Cardiol. (2019) 74:1772–84. 10.1016/j.jacc.2019.07.072
45.
Siebes M Campbell CS D'Argenio DZ . Fluid dynamics of a partially collapsible stenosis in a flow model of the coronary circulation. J Biomech Eng. (1996) 118:489–97. 10.1115/1.2796035
46.
Gould KL Lipscomb K Hamilton GW . Physiologic basis for assessing critical coronary stenosis. Instantaneous flow response and regional distribution during coronary hyperemia as measures of coronary flow reserve. Am J Cardiol. (1974) 33:87–94. 10.1016/0002-9149(74)90743-7
47.
Nijjer SS de Waard GA Sen S van de Hoef TP Petraco R Echavarria-Pinto M et al . Coronary pressure and flow relationships in humans: phasic analysis of normal and pathological vessels and the implications for stenosis assessment: a report from the Iberian-Dutch-English (IDEAL) collaborators [published online 2015]. Eur Heart J. (2016) 37:2069–80. 10.1093/eurheartj/ehv626
48.
Gosling RC Sturdy J Morris PD Fossan FE Hellevik LR Lawford P et al . Effect of side branch flow upon physiological indices in coronary artery disease. J Biomech. (2020) 103:109698. 10.1016/j.jbiomech.2020.109698
49.
Sturdy J Kjernlie JK Nydal HM Eck VG Hellevik LR . Uncertainty quantification of computational coronary stenosis assessment and model based mitigation of image resolution limitations. J Comput Sci. (2019) 31:137–50. 10.1016/j.jocs.2019.01.004
50.
Vardhan M Gounley J Chen SJ Kahn AM Leopold JA Randles A . The importance of side branches in modeling 3D hemodynamics from angiograms for patients with coronary artery disease. Sci Rep. (2019) 9:8854. 10.1038/s41598-019-45342-5
51.
Huo Y Svendsen M Choy JS Zhang ZD Kassab GS . A validated predictive model of coronary fractional flow reserve. J R Soc Interface. (2012) 9:1325–38. 10.1098/rsif.2011.0605
Summary
Keywords
CCTA, radiology, 3D printing, in vitro , blood analog fluid, fractional flow reserve, catheterization
Citation
Kolli KK, Jang S-J, Zahid A, Caprio A, Alaie S, Moghadam AAA, Xu P, Shepherd R, Mosadegh B and Dunham S (2022) Improved Functional Assessment of Ischemic Severity Using 3D Printed Models. Front. Cardiovasc. Med. 9:909680. doi: 10.3389/fcvm.2022.909680
Received
31 March 2022
Accepted
25 May 2022
Published
30 June 2022
Volume
9 - 2022
Edited by
Caglar Ozturk, Massachusetts Institute of Technology, United States
Reviewed by
Martin L. Tomov, Emory University, United States; Dong-Guk Paeng, Jeju National University, South Korea
Updates
Copyright
© 2022 Kolli, Jang, Zahid, Caprio, Alaie, Moghadam, Xu, Shepherd, Mosadegh and Dunham.
This is an open-access article distributed under the terms of the Creative Commons Attribution License (CC BY). The use, distribution or reproduction in other forums is permitted, provided the original author(s) and the copyright owner(s) are credited and that the original publication in this journal is cited, in accordance with accepted academic practice. No use, distribution or reproduction is permitted which does not comply with these terms.
*Correspondence: Kranthi K. Kolli Kranthi.kolli@gmail.com
†A full list of investigators and their affiliations are available in the supplementary material
This article was submitted to General Cardiovascular Medicine, a section of the journal Frontiers in Cardiovascular Medicine
Disclaimer
All claims expressed in this article are solely those of the authors and do not necessarily represent those of their affiliated organizations, or those of the publisher, the editors and the reviewers. Any product that may be evaluated in this article or claim that may be made by its manufacturer is not guaranteed or endorsed by the publisher.