- 1The Second Clinical College of Guangzhou University of Chinese Medicine, Guangzhou, China
- 2Department of Critical Care Medicine, Guangdong Provincial Hospital of Chinese Medicine, Guangzhou, China
Background: Non-HDL-C is well established causal risk factor for the progression of atherosclerotic cardiovascular disease. However, there remains a controversial pattern of how non-HDL-C relates to all-cause and cardiovascular mortality, and the concentration of non-HDL-C where the risk of mortality is lowest is not defined.
Methods: A population-based cohort study using data from the National Health and Nutrition Examination Survey (NHANES) from 1999 to 2014. Male participants without statin therapy were divided into the six groups according to non-HDL-C levels (<100, 100–129, 130–159, 160–189, 190–219, ≥220 mg/dl). Multivariable Cox proportional hazards models were conducted with a hazard ratio (HR) and corresponding 95% confidence interval (CI). To further explore the relationship between non-HDL-C and mortality, Kaplan–Meier survival curves, restricted cubic spline curves, and subgroup analysis were performed.
Results: Among 12,574 individuals (average age 44.29 ± 16.37 years), 1,174(9.34%) deaths during a median follow-up 98.38 months. Both low and high non-HDL-C levels were significantly associated with increased risk of all-cause and cardiovascular mortality, indicating a U-shaped association. Threshold values were detected at 144 mg/dl for all-cause mortality and 142 mg/dl for cardiovascular mortality. Below the threshold, per 30 mg/dl increase in non-HDL-C reduced a 28 and 40% increased risk of all-cause (p < 0.0001) and cardiovascular mortality (p = 0.0037), respectively. Inversely, above the threshold, per 30 mg/dl increase in non-HDL-C accelerated risk of both all-cause mortality (HR 1.11, 95% CI 1.03–1.20, p = 0.0057) and cardiovascular mortality (HR 1.30, 95% CI 1.09–1.54, p = 0.0028).
Conclusions: Non-HDL-C was U-shaped related to all-cause and cardiovascular mortality among men without statin therapy.
Introduction
Non-high-density lipoprotein cholesterol (non-HDL-C), which represents the total cholesterol content of apolipoprotein B-containing lipoproteins, includes very low-density lipoproteins (VLDL) and their metabolic remnants, intermediate-density lipoproteins (IDL), lipoprotein(a), and low-density lipoproteins (LDL) (1, 2). Non-HDL-C is well established causal risk factor for the development of atherosclerotic cardiovascular disease (1, 3, 4). Two decades ago, non-HDL-C was highlighted as an important secondary lipid therapeutic goal in the United States National Cholesterol Education Program's Adult Treatment Panel (5). Furthermore, the National Lipid Association and International Atherosclerosis Society recently recommended that non-HDL-C should be an equal target to LDL-cholesterol (LDL-C) in patients with atherosclerotic cardiovascular disease (6). Preponderantly, non-HDL-C trajectories remain fairly flat, and non-HDL-C between age 25 and 40 years is sufficient to confidently categorise individuals as high or low non-HDL-C for the next 25 to 30 years (3). Moreover, non-HDL-C can be accurately calculated in a non-fasting specimen, without incurring additional expense (7).
A systematic review and meta-analysis by our team previously demonstrated that the increased levels of non-HDL-C were significantly associated with an increased risk of mortality in patients with coronary heart disease (CHD) (8), which was similar to previous research findings in population without cardiovascular diseases (9) or patients with diabetes (10). Interestingly, a U-shaped relationship was also recently identified in different populations (11, 12). Studies detected the U-shaped association of non-HDL-C with all-cause and cardiovascular mortality among patients with hypertension or chronic kidney disease (CKD) stages 3–5 (11, 12), non-HDL-C was U-shaped associated with mortality among male hypertension in subgroup analysis, but not in female (12). Differently, one study focused on the men population, from the Israeli National Death Registry demonstrated a positive association that non-HDL-C as a useful predictor of cardiovascular disease mortality in 22 years follow-up (13). Hence, for more clearly understand how non-HDL-C relates to all-cause and cardiovascular mortality in men, the aim of the present study used data from the large population representative surveys to determine the relationship of non-HDL-C with all-cause and cardiovascular mortality, and the concentration of non-HDL-C associated with the lowest risk of mortality in men without statin therapy.
Materials and Methods
Study Population
We performed a population-based cohort study using data from the National Health and Nutrition Examination Survey (NHANES), and data were combined across 8 continuous NHANES cycles: 1999–2000, 2001–2002, 2003–2004, 2005–2006, 2007–2008, 2009–2010, 2011–2012, and 2013–2014. NHANES is a series of national surveys to evaluate the health status of the United States population with a complex, stratified, multistage, probability sampling method. The Centres for Disease Control and Prevention ratified the study protocols, and all the participants provided written informed consent. Detailed about the NHANES has been published elsewhere (14, 15).
The total number of participants in primary survey was 82,091. After excluding participants for age <18 (n = 34,735), female (n = 24,534) or without follow-up data (n = 1,085), and those in baseline with cancer or missing data (n = 3,534), acute myocardial infarction (AMI) or missing data (n = 952), heart failure (HF) or miss data (n = 331) and excluding because covariates were unavailable (n = 2,455), finally excluding for baseline with statin therapy (n = 1,891). Hence, 12,574 individuals were included in our final analysis (Figure 1).
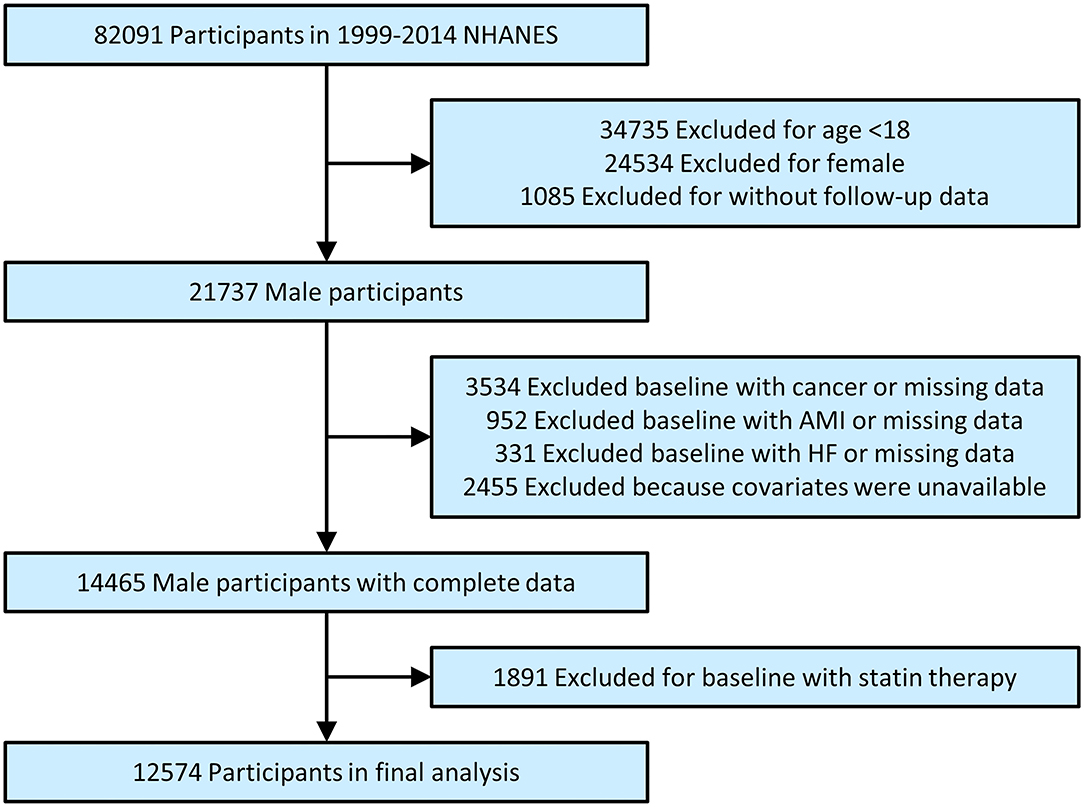
Figure 1. Study flowchart. NHANES, National health and nutrition examination survey; AMI, acute myocardial infarction; HF, heart failure.
Covariates
Fasting samples obtained from peripheral venous blood were stored at −20°C and shipped weekly for laboratory analyses. Non-HDL-C levels were calculated from total cholesterol (TC) minus HDL cholesterol (HDL-C). The measurement of TC used with an enzymatic assay method, and HDL-C was used with a heparin-manganese precipitation method or a direct immunoassay technique. Further detailed information about the collection of blood samples and lipid concentration measurement is available in another study (16). In addition, creatinine, haemoglobin, and glycated haemoglobin A1c (HbA1c) measurements were based on standardised procedures. Demographic variables such as age, gender, body weight, height, race/ethnicity (Mexican American, other Hispanic, non-Hispanic White, non-Hispanic Black, other race), education (Lower than high school, high school, more than high school), were acquired according to the household interview. Information on smoking status (current smoker, former smoker, and never smoked), and history of disease had been assessed at baseline by standard examinations, and questionnaires were administered by trained health technicians, interviewers, and physicians. The mean blood pressure was calculated as the average of three valid measurements. Nutritional status (e.g., energy intake, protein intake, carbohydrate intake, total fat intake) was acquired according to the dietary interview. A “multiple pass” 24-h dietary interview format was used to collect detailed information about all foods and beverages, which were used to estimate the total intake of energy, nutrients, and non-nutrient food components. More information is available at www.cdc.gov/nchs/nhanes.
Outcomes
The primary determination of mortality for eligible participants is based upon matching survey records to the records from the National Death Index (NDI), and other sources including the Social Security Administration, the Centres for Medicare and Medicaid Services, data collection, and for the follow-up surveys of the National Centre for Health Statistics, ascertainment of death certificates are also incorporated. Participants were eligible for mortality follow-up based on matching identifying information during their NHANES interviews, such as the last 4 digits of social security number, full name, date of birth, state of birth, state of residence, marital status, race, and sex (17). All-cause mortality and cardiovascular mortality were the endpoints of the present study. The mortality status of individuals was obtained from data from the NDI through December 31, 2015. This study classified causes of mortality referred to the codes of the international statistical classification of diseases, 10th revision (ICD-10). Cardiovascular mortality was defined by the ICD-10 codes for as I00-I09, I11, I13, and I20-I51. When treating cardiovascular mortality as an outcome, the deaths due to other causes were censored.
Statistical Analysis
The data were presented as mean values with standard deviation (SD), the median with interquartile ranges, or frequencies with percentages, as appropriate. Comparisons of the differences between groups were made with one-way ANOVA, chi-square tests, or Kruskal–Wallis H-tests by the classification of non-HDL-C levels (<100, 100–129, 130–159, 160–189, 190–219, ≥220 mg/dl). Survival analysis according to non-HDL-C stratification was performed using standardised Kaplan–Meier curves. The proportional hazard assumption was examined and met by plotting the log minus log survival curves and survival times. The multivariable Cox proportional hazards models were used for exploring the association of non-HDL-C with all-cause and cardiovascular mortality. In model 1, there was no adjustment. In model 2, we adjusted for age and race. In model 3, we adjusted for age, race, education, body mass index (BMI), systolic blood pressure, diastolic blood pressure, smoking, diabetes, hypertension, CHD, stroke, creatinine, haemoglobin, HbA1c, triglycerides, energy intake, protein intake, carbohydrate intake, and total fat intake. Restricted cubic spline models were used for nonlinear relationships with knots at 5, 35, 65, and 95 percentiles of non-HDL-C. If the relationships were non-linear, the difference of relationships at the threshold was detected by two piecewise linear regression models. The point with the highest likelihood among all the possible values was chosen to define the threshold value. The differences in the results when applying one-line or two piecewise linear regression models were compared by a logarithmic likelihood ratio test. Furthermore, the subgroup analysis includes age (<65 or ≥65 years), race (White, Black, or other race), education (lower than high school, high school, more than high school), BMI (<25 or ≥25 kg/m2), smoking (yes or no), diabetes (yes or no), hypertension (yes or no). All statistical analyses were performed using R version 3.3.2 (R Foundation for Statistical Computing, Vienna, Austria), and p < 0.05 was considered statistically significant.
Results
Baseline Characteristics
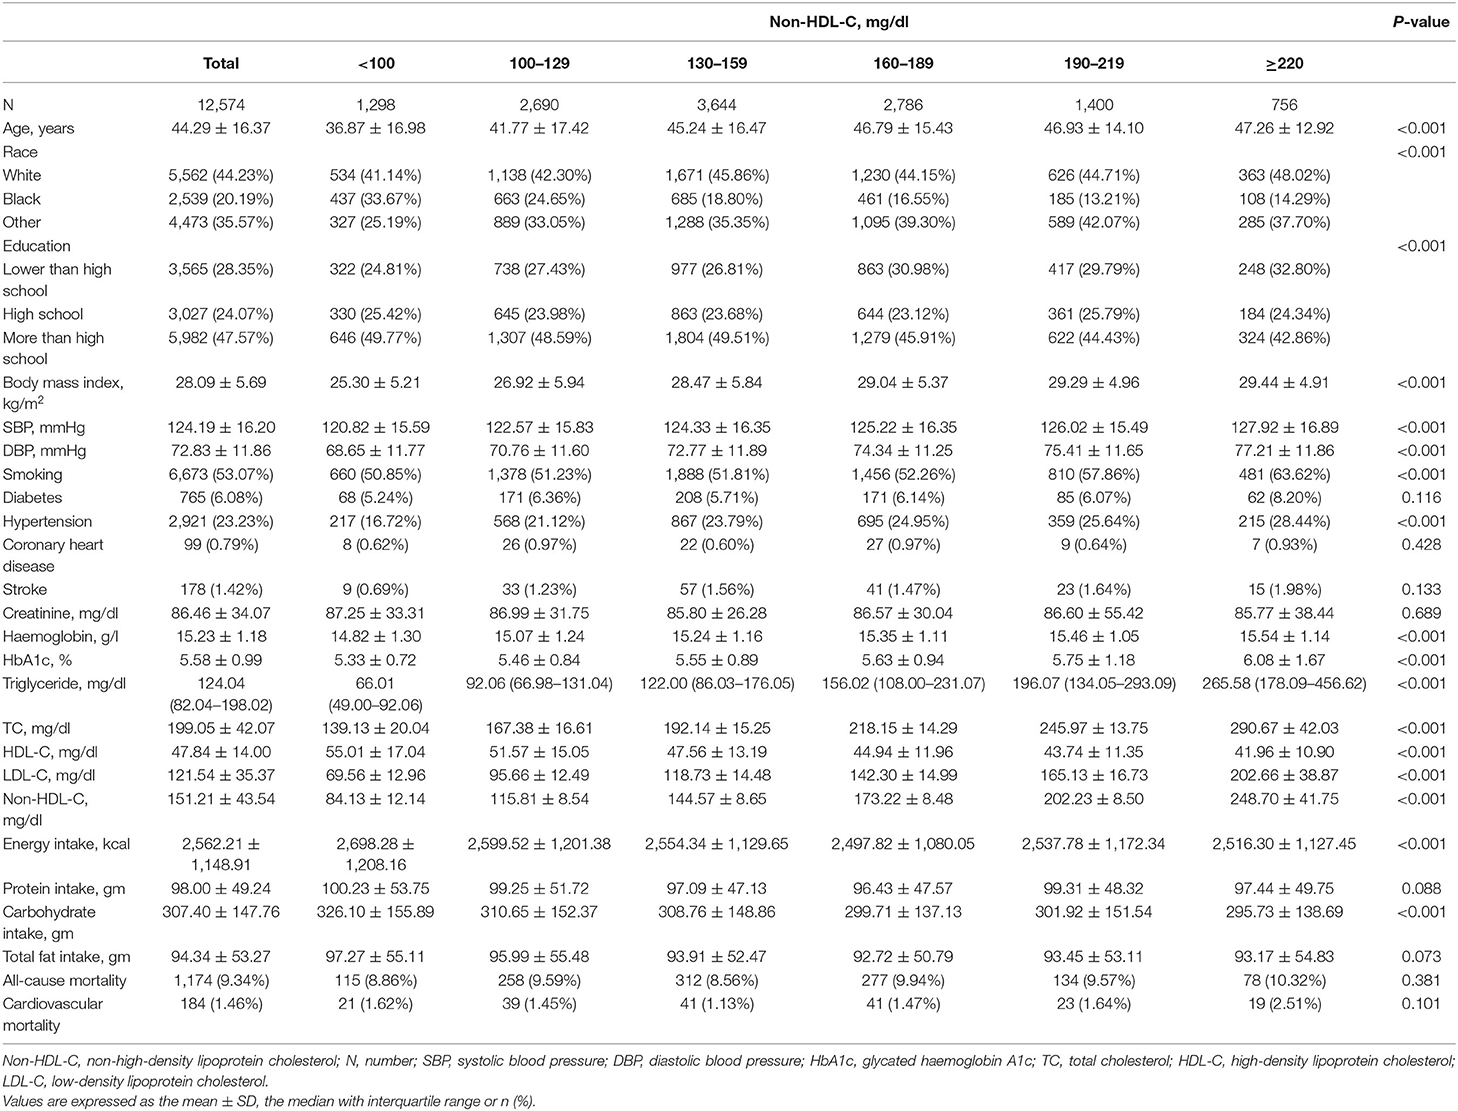
Finally, 12,574 individuals (average age 44.29 ± 16.37 years) were included in this analysis. Table 1 demonstrates baseline characteristics according to non-HDL-C levels. There were significant subgroup differences in age, race, education, BMI, systolic blood pressure, diastolic blood pressure, smoking, hypertension, haemoglobin, HbA1C, triglycerides, TC, HDL-C, LDL-C, energy intake, and carbohydrate intake (all p < 0.001), except for diabetes, CHD, stroke, creatinine, protein intake, total fat intake, all-cause, and cardiovascular mortality. We found 1,174 (9.34%) all-cause deaths and 184 (1.46%) cardiovascular deaths during a median follow-up of 98.38 ± 53.78 months.
Relationships of Non-HDL-C With All-Cause and Cardiovascular Mortality
As demonstrated in Figure 2, Kaplan–Meier survival curves were diverged according to non-HDL-C stratification. The highest risk for all-cause mortality was observed when non-HDL-C <100 mg/dl, compared to other groups (all p < 0.005). Besides, more risk for cardiovascular mortality was only observed when non-HDL-C <100 mg/dl, compared to when non-HDL-C = 130-159 or 160-189 mg/dl (all P < 0.005). The optimal non-HDL-C concentration range was between 130 and 159 mg/dl for a lower risk of all-cause and cardiovascular death.
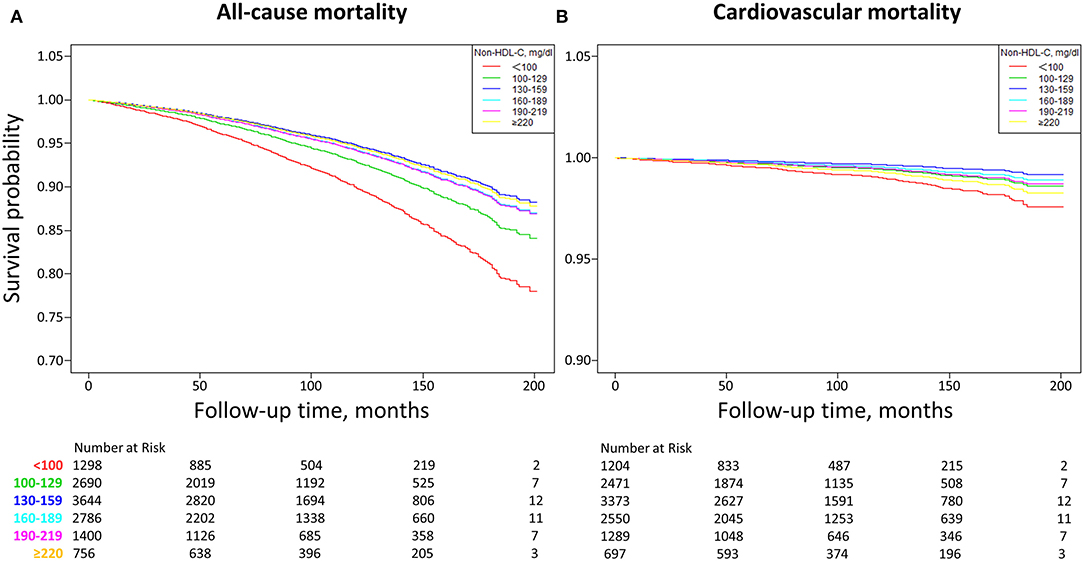
Figure 2. Kaplan-Meier survival curves of non-HDL-C with all-cause (A) and cardiovascular (B) mortality. Non-HDL-C, non-high-density lipoprotein cholesterol. (A) Other groups vs. non-HDL-C <100 mg/dl (all P < 0.005). (B) non-HDL-C = 130–159 or 160–189 mg/dl vs. non-HDL-C <100 mg/dl (all P < 0.005), non-HDL-C = 100–129 mg/dl vs. non-HDL-C <100 mg/dl (P = 0.0443), non-HDL-C = 190–219 mg/dl vs. non-HDL-C <100 mg/dl (P = 0.0546), non-HDL-C ≥220 mg/dl vs. non-HDL-C <100 mg/dl (P = 0.3687).
Table 2 summarised the multivariable Cox regression results. When non-HDL-C was treated as a continuous variable, per 30 mg/dl increment in non-HDL-C corresponded to the hazard ratio (HR) (95% confidence interval, CI) as 0.94 (95% CI 0.90–0.99, p = 0.0193) for all-cause mortality and 1.03 (95% CI 0.91–1.16, p = 0.6826) for cardiovascular mortality in model 3. When non-HDL-C was treated as a categorical variable, non-HDL-C = 130-159 mg/dl as a reference, the fully adjusted HRs for all-cause mortality were 1.98 (95% CI 1.59–2.48, p < 0.0001), 1.38 (95% CI 1.17–1.62, p = 0.0002), 1.11 (95% CI 0.95–1.31, p = 0.2007), 1.12 (95% CI 0.91–1.38, p = 0.2807) and 1.04 (95% CI 0.79–1.36, p = 0.8018) for non-HDL-C levels <100, 100–129, 160–189, 190–219, and ≥220 mg/dl, respectively. Meanwhile, for cardiovascular mortality, the fully adjusted HRs were 2.99 (95% CI 1.73–5.16, p < 0.0001), 1.72 (95% CI 1.10–2.69, p = 0.0169), 1.36 (95% CI 0.88–2.11, p = 0.1636), 1.61 (95% CI 0.94–2.73, p = 0.0811), and 2.16 (95% CI 1.17–3.98, p = 0.0134) for non-HDL-C levels <100, 100–129, 160–189, 190–219, and ≥ 220 mg/dl, respectively.
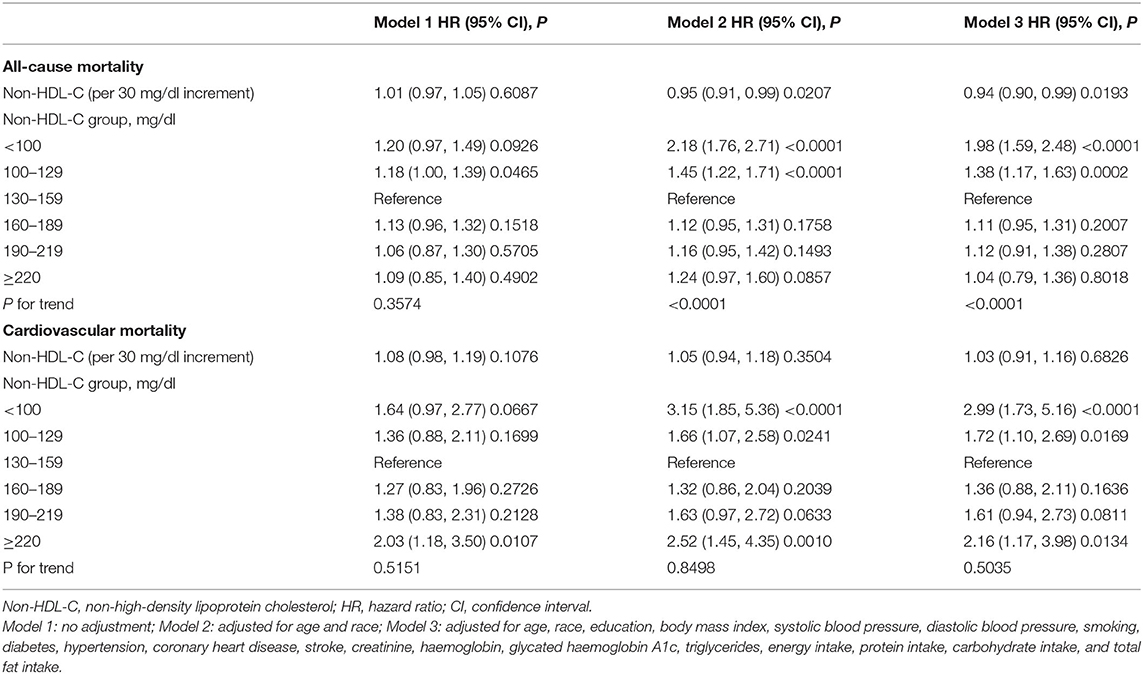
Table 2. Multivariable cox regression analysis of non-HDL-C with all-cause and cardiovascular mortality.
Non-Linear Relationships of Non-HDL-C With All-Cause and Cardiovascular Mortality
As shown in Figure 3, the multivariable adjusted restrictive cubic curves confirmed that the relationships of non-HDL-C with all-cause and cardiovascular mortality were U-shaped (All p for likelihood ratio test <0.0001). The threshold values of non-HDL-C related to the lowest risk in multivariable adjusted analyses were 144 mg/dl for all-cause mortality and 142 mg/dl for cardiovascular mortality. As shown in Table 3, below the threshold, per 30 mg/dl increase in non-HDL-C reduced a 28% increased risk of all-cause mortality (p < 0.0001) and a 40% increased risk of cardiovascular mortality (p = 0.0037). Inversely, above the threshold, per 30 mg/dl increase in non-HDL-C accelerated risk of both all-cause mortality (HR 1.11, 95% CI 1.03–1.20, p = 0.0057) and cardiovascular mortality (HR 1.30, 95% CI 1.09–1.54, p = 0.0028).
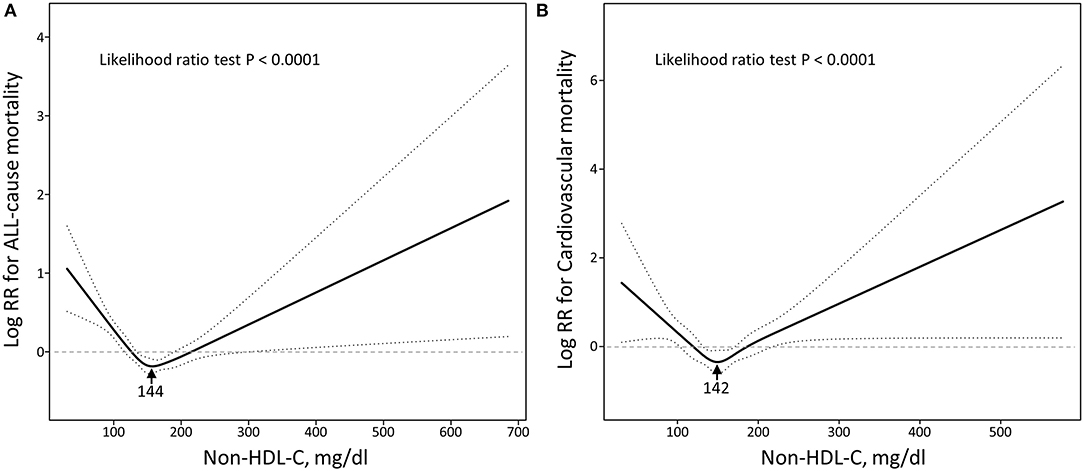
Figure 3. Restricted cubic spine models of non-HDL-C with all-cause (A) and cardiovascular (B) mortality. Non-HDL-C, non-high-density lipoprotein cholesterol. Restricted cubic spine models were adjusted for adjusted for age, race, education, body mass index, systolic blood pressure, diastolic blood pressure, smoking, diabetes, hypertension, coronary heart disease, stroke, creatinine, haemoglobin, glycated haemoglobin A1c, triglycerides, energy intake, protein intake, carbohydrate intake, and total fat intake.

Table 3. The results of two piecewise linear regression model of non-HDL-C with all-cause and cardiovascular mortality.
Subgroups Analysis of the Risk of All-Cause and Cardiovascular Mortality
The stratified analyses are demonstrated in Figure 4 (Detail data as shown in Supplementary Table S1). The non-linear relationships for all-cause mortality with statistical significance were found among participants who were aged <65 years old, and race (White). Besides, the non-linear relationships for cardiovascular mortality with statistical significance were found among participants who were race (White), BMI ≥ 25 kg/m2, and without diabetes. When non-HDL-C ≥ 142 mg/dl, per 30 mg/dl increase in non-HDL-C increased risk of cardiovascular mortality were 1.41-fold for aged <65 years old (p = 0.0040), 1.38-fold for race (White) (p = 0.0182) and 1.68-fold for race (Black) (p = 0.0017), 1.57-fold for high school education (p = 0.0002), 1.67-fold for smoking (p = 0.0002), 1.31-fold for participants without diabetes (p = 0.0054) and 1.41-fold for participants with hypertension (p = 0.0038).
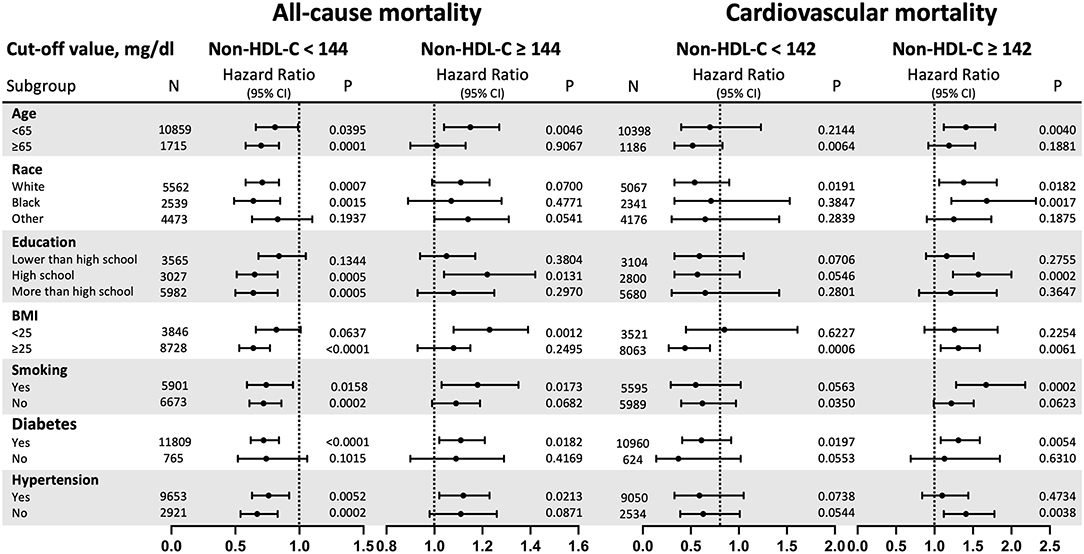
Figure 4. Subgroup analysis. Non-HDL-C, non-high-density lipoprotein cholesterol; HR, hazard ratio; CI, confidence interval; BMI, body mass index. Results are expressed as multivariable-adjusted HR in continuous analyses (Non-HDL-C per 30 mg/dl increment). When analysing a subgroup variable, age, race, education, BMI, systolic blood pressure, diastolic blood pressure, smoking, diabetes, hypertension, coronary heart disease, stroke, creatinine, haemoglobin, glycated haemoglobin A1c, triglycerides, energy intake, protein intake, carbohydrate intake, and total fat intake were all adjusted except the variable itself.
Discussion
The novel finding of the study is that both low and high non-HDL-C levels were significantly associated with increased risk of all-cause and cardiovascular mortality among men without statin therapy in U-shaped relationships. Furthermore, we confirmed that the non-HDL-C level was related to the lowest risk of all-cause and cardiovascular mortality at threshold values of 144 and 142 mg/dl, respectively. These new results are probable to have implications for the interpretation of levels of non-HDL-C in clinical practise.
Global age-standardised mean non-HDL-C remained almost unchanged from 1980 to 2018, and high non-HDL-C was responsible for an estimated 3.9 million worldwide deaths from ischemic heart disease and ischemic stroke in 2017, accounting for a third of deaths from these causes (18). Undoubtedly, it is particularly urgent to clearly understand the relationship of non-HDL-C stratification with death, and locate the best threshold values of non-HDL-C. One of our major findings is that once non-HDL-C levels are greater than threshold values, is closely contributed to higher mortality. This finding is similar to previous several studies in different populations (8, 9, 11, 13, 19–21). The potential explanation for this finding is that extremely high non-HDL-C levels play a role in accelerated atherosclerosis, leading to an increased risk of death (22). In United States population study, non-HDL-C may be best suited for the prediction of future coronary artery calcium (CAC) progression, especially since non-HDL-C levels ≥ 190 mg/dl are consistently associated with significant CAC progression in the overall population (β 16.4, 95%CI −5.63 to 27.2, p = 0.003) (23). One genetic study finding is that levels of non-HDL-C are associated with the extent of coronary atherosclerosis. Besides, the mutations of some genes like LDLR, apolipoprotein B, and proprotein convertase subtilisin/kexin type 9 (PCSK9), can result in hypercholesterolemia, and guidelines suggested that non-HDL-C ≥ 220 mg/dl could possibly imply hereditary genetic hypercholesterolemia (11, 24). Patients with hypercholesterolemia have increased non-HDL-C and are more prone to suffer from atherosclerotic cardiovascular and cardiovascular death (11, 23).
Moreover, the present study contributed evidence that lower non-HDL-C is also closely related to higher mortality in men without statin therapy, and indicated a U-shaped association. Although the disparity in the study population, in accordance with our results, several previous studies have observed the U-shaped association between non-HDL-C and mortality (11, 12). One study by Cheng and colleagues analysing data from NHANES demonstrated that relatively higher or lower non-HDL-C concentrations were linked to increased mortality, and the lowest risk was found at threshold values of 158 and 190 mg/dl for all-cause and cardiovascular mortality, respectively. The difference in threshold estimates might be attributed to different study populations, of which all patients in the study by Cheng et al. were hypertension, and had relatively higher non-HDL-C levels (25). Likewise, the U-shaped relationships between non-HDL-C and the risk of all-cause and cardiovascular mortality have been shown in patients with CKD and the optimal non-HDL-C concentration range was between 116.2 and 143.9 mg/dl (11). Similarly, a study of a general population cohort also found a U-shaped association between levels of LDL-C and the risk of all-cause mortality (26). In patients with CHD, a paradoxical association existed between baseline non-HDL-C and long-term all-cause mortality, but disappeared after taking into account the effects of malnutrition, indicating that the worse long-term prognosis in the low non-HDL-C group (<2.2 mmol/L) was mainly mediated by the underlying effect of malnutrition (27). Apart from that, an inverse association between cholesterol and mortality has been demonstrated in the elderly (28, 29). Another population-based register study including 118,160 subjects without statin therapy found that high lipoprotein levels were associated with lower mortality indicating that high lipoprotein levels do not seem to be definitely harmful in the general population (29). Similarly, participants with low serum TC seem to have a lower survival rate than participants with an elevated cholesterol level, irrespective of concomitant diseases or health status (28). Unexpectedly, the finding of a U-shaped association in our study is inconsistent with a positive association in another study (13). The differences between the two studies in the population (United States or Israel), sample size (13,562 or 4,832), and follow-up time (98.38 ± 53.78 months or 22.1 ± 3.2 years) may result in different conclusions.
However, the underlying mechanism of U-shaped association is not clear. First, one possible reason is that the participants with the lowest cholesterol levels had a poorer health status (28), or debilitation and illness have been hypothesised to cause a decrease in levels of cholesterol (26, 30, 31). Second, higher HDL-C equals to low non-HDL-C levels according to the calculation formula, extremely high HDL-C increases mortality in the general population by analysing the data from NHANES (12). The genetic variation of particular genes and variation of the size or function of HDL particles may be the underlying mechanism (12). Finally, the U-shaped association between lipoprotein levels and mortality may be similar to the obesity paradox, which is largely explained by methodological issues, including reverse causation. No matter how, more studies are needed to clarify the exact mechanism of the U-shaped association.
The advantage of the present study lies in its relatively large sample size and long-term follow-up. Regarding clinical importance, our novel findings are conducive to understanding the risk stratification of non-HDL-C and remind us that when initiating lipid-lowering therapy in clinical practise, attention should be paid to assessing the absolute risk of atherosclerotic cardiovascular disease (26, 32, 33), rather than starting treatment based solely on a moderate increase in levels of a specific lipid marker. Anyway, there are still some limitations to this study. First, during long-term follow-up, only a single measurement of serum non-HDLC concentration at baseline is available, leading to potential bias and failure to evaluate the affection of non-HDL-C trajectories on mortality. Second, although we adjusted many relevant confounding variables that were considered to influence mortality, residual confounders and hidden comorbidities might have been not eliminated. Finally, our study was performed in a nationally representative sample of men in the United States, so our results may not be easily extrapolated to the population in other regions.
Conclusion
From a population-based cohort study base on the national representative database, our study demonstrated that non-HDL-C was U-shaped and related to all-cause and cardiovascular mortality among men without statin therapy. The more clear risk stratification of non-HDL-C and comprehensive strategic management to deal with dyslipidemia deserves further investigation for confirmation.
Data Availability Statement
The datasets presented in this study can be found in online repositories. The names of the repository/repositories and accession number(s) can be found below: https://www.cdc.gov/nchs/nhanes/index.htm.
Ethics Statement
The studies involving human participants were reviewed and approved by the US Centres for Disease Control and Prevention ratified the study protocols. The patients/participants provided their written informed consent to participate in this study.
Author Contributions
R-XZ, J-PX, Y-JK, L-HG, and M-ZZ: conceived and designed the study. R-XZ, J-PX, and J-WT: collected and analysed the data. R-XZ: drafted the paper. M-ZZ: revised the manuscript. All authors have reviewed the final manuscript. All authors contributed to the article and approved the submitted version.
Funding
This work was partially supported by the National Natural Scientific Foundation (No. 82004135 to R-XZ), the Research Fund for Zhaoyang Talents of Guangdong Provincial Hospital of Chinese Medicine (No. ZY2022KY03 to R-XZ), and the Specific Research Fund for TCM Science and Technology of Guangzhou Provincial Hospital of Chinese Medicine (YN10101915 to M-ZZ).
Conflict of Interest
The authors declare that the research was conducted in the absence of any commercial or financial relationships that could be construed as a potential conflict of interest.
Publisher's Note
All claims expressed in this article are solely those of the authors and do not necessarily represent those of their affiliated organizations, or those of the publisher, the editors and the reviewers. Any product that may be evaluated in this article, or claim that may be made by its manufacturer, is not guaranteed or endorsed by the publisher.
Supplementary Material
The Supplementary Material for this article can be found online at: https://www.frontiersin.org/articles/10.3389/fcvm.2022.903481/full#supplementary-material
References
1. Brunner FJ, Waldeyer C, Ojeda F, Salomaa V, Kee F, Sans S, et al. Application of non-HDL cholesterol for population-based cardiovascular risk stratification: results from the Multinational Cardiovascular Risk Consortium. Lancet. (2019) 394:2173–83. doi: 10.1016/S0140-6736(19)32519-X
2. Emerging Risk Factors C, Di Angelantonio E, Sarwar N, Perry P, Kaptoge S, Ray KK, et al. Major lipids, apolipoproteins, and risk of vascular disease. JAMA. (2009) 302:1993–2000. doi: 10.1001/jama.2009.1619
3. Pencina KM, Thanassoulis G, Wilkins JT, Vasan RS, Navar AM, Peterson ED, et al. Trajectories of Non-HDL Cholesterol Across Midlife: implications for cardiovascular prevention. J Am Coll Cardiol. (2019) 74:70–9. doi: 10.1016/j.jacc.2019.04.047
4. Yusuf S, Joseph P, Rangarajan S, Islam S, Mente A, Hystad P, et al. Modifiable risk factors, cardiovascular disease, and mortality in 155 722 individuals from 21 high-income, middle-income, and low-income countries (PURE): a prospective cohort study. Lancet. (2020) 395:795–808. doi: 10.1016/S0140-6736(19)32008-2
5. National Cholesterol Education Program Expert Panel on Detection E, Treatment of High Blood Cholesterol in A. Third Report of the National Cholesterol Education Program (NCEP) Expert Panel on Detection, Evaluation, and Treatment of High Blood Cholesterol in Adults (Adult Treatment Panel III) final report. Circulation. (2002) 106:3143–421. doi: 10.1161/circ.106.25.3143
6. Expert Dyslipidemia P, Grundy SM. An International Atherosclerosis Society Position Paper: global recommendations for the management of dyslipidemia. J Clin Lipidol. (2013) 7:561–5. doi: 10.1016/j.jacl.2013.10.001
7. Zeng RX, Li XL, Zhang MZ, Guo YL, Zhu CG, Guo LH, et al. Non-HDL cholesterol is a better target for predicting periprocedural myocardial injury following percutaneous coronary intervention in type 2 diabetes. Atherosclerosis. (2014) 237:536–43. doi: 10.1016/j.atherosclerosis.2014.10.030
8. Liao P, Zeng R, Zhao X, Guo L, Zhang M. Prognostic value of non-high-density lipoprotein cholesterol for mortality in patients with coronary heart disease: a systematic review and meta-analysis. Int J Cardiol. (2017) 227:950–55. doi: 10.1016/j.ijcard.2016.10.106
9. Cui Y, Blumenthal RS, Flaws JA, Whiteman MK, Langenberg P, Bachorik PS, et al. Non-high-density lipoprotein cholesterol level as a predictor of cardiovascular disease mortality. Arch Intern Med. (2001) 161:1413–9. doi: 10.1001/archinte.161.11.1413
10. Li C, Ford ES, Tsai J, Zhao G, Balluz LS, Gidding SS. Serum non-high-density lipoprotein cholesterol concentration and risk of death from cardiovascular diseases among US adults with diagnosed diabetes: the Third National Health and Nutrition Examination Survey linked mortality study Cardiovasc Diabetol. (2011) 10:46. doi: 10.1186/1475-2840-10-46
11. Chiu H, Wu PY, Huang JC, Tu HP, Lin MY, Chen SC, et al. There is a U shaped association between non high density lipoprotein cholesterol with overall and cardiovascular mortality in chronic kidney disease stage 3-5. Sci Rep. (2020) 10:12749. doi: 10.1038/s41598-020-69794-2
12. Cheng Q, Liu XC, Chen CL, Huang YQ, Feng YQ, Chen JY. The U-Shaped Association of Non-High-Density Lipoprotein Cholesterol Levels With All-Cause and Cardiovascular Mortality Among Patients With Hypertension. Front Cardiovasc Med. (2021) 8:707701. doi: 10.3389/fcvm.2021.707701
13. Harari G, Green MS, Magid A, Zelber-Sagi S. Usefulness of Non-High-Density Lipoprotein Cholesterol as a Predictor of Cardiovascular Disease Mortality in Men in 22-Year Follow-Up. Am J Cardiol. (2017) 119:1193–98. doi: 10.1016/j.amjcard.2017.01.008
14. Ford ES, Giles WH, Dietz WH. Prevalence of the metabolic syndrome among US adults: findings from the third National Health and Nutrition Examination Survey. JAMA. (2002) 287:356–9. doi: 10.1001/jama.287.3.356
15. Palmer MK, Toth PP. Trends in lipids, obesity, metabolic syndrome, and diabetes mellitus in the United States: An NHANES Analysis (2003-2004 to 2013-2014). Obesity (Silver Spring). (2019) 27:309–14. doi: 10.1002/oby.22370
16. Yan YQ, Chen J, Huang YQ. A Non-linear association of high-density lipoprotein cholesterol with all-cause and cause-specific mortality in diabetic patients. Diabetes Metab Syndr Obes. (2021) 14:2851–62. doi: 10.2147/DMSO.S313006
17. National Center for Health Statistics. Office of Analysis and Epidemiology. The Linkage of National Center for Health Statistics Survey Data to the National Death Index – 2015 Linked Mortality File (LMF): Methodology Overview and Analytic Considerations. (2019). Hyattsville, Maryland. Available online at: https://www.cdc.gov/nchs/data-linkage/mortality-methods.htm (accessed May 11, 2022).
18. Collaboration NCDRF. Repositioning of the global epicentre of non-optimal cholesterol. Nature. (2020) 582:73–7. doi: 10.1038/s41586-020-2338-1
19. Echida Y, Ogawa T, Otsuka K, Ando Y, Nitta K. Serum non-high-density lipoprotein cholesterol (non-HDL-C) levels and cardiovascular mortality in chronic hemodialysis patients. Clin Exp Nephrol. (2012) 16:767–72. doi: 10.1007/s10157-012-0615-5
20. Huang YQ, Liu XC, Lo K, Liu L, Yu YL, Chen CL, et al. The U Shaped Relationship Between High-Density Lipoprotein Cholesterol and All-Cause or Cause-Specific Mortality in Adult Population. Clin Interv Aging. (2020) 15:1883–96. doi: 10.2147/CIA.S271528
21. Lee EY, Yang Y, Kim HS, Cho JH, Yoon KH, Chung WS, et al. Effect of visit-to-visit LDL-, HDL-, and non-HDL-cholesterol variability on mortality and cardiovascular outcomes after percutaneous coronary intervention. Atherosclerosis. (2018) 279:1–9. doi: 10.1016/j.atherosclerosis.2018.10.012
22. Stone NJ, Robinson JG, Lichtenstein AH, Bairey Merz CN, Blum CB, Eckel RH, et al. 2013 ACC/AHA guideline on the treatment of blood cholesterol to reduce atherosclerotic cardiovascular risk in adults: a report of the American College of Cardiology/American Heart Association Task Force on Practice Guidelines. Circulation. (2014) 129:S1–45. doi: 10.1161/01.cir.0000437738.63853.7a
23. Zalawadiya SK, Veeranna V, Panaich S, Kottam A, Afonso L. Non-high-density lipoprotein cholesterol and coronary artery calcium progression in a multiethnic US population. Am J Cardiol. (2014) 113:471–4. doi: 10.1016/j.amjcard.2013.10.027
24. Defesche JC, Gidding SS, Harada-Shiba M, Hegele RA, Santos RD, Wierzbicki AS. Familial hypercholesterolaemia. Nat Rev Dis Primers. (2017) 3:17093. doi: 10.1038/nrdp.2017.93
25. Contreras F, Lares M, Castro J, Velasco M, Rojas J, Guerra X, et al. Determination of non-HDL cholesterol in diabetic and hypertensive patients. Am J Ther. (2010) 17:337–40. doi: 10.1097/MJT.0b013e3181c1233c
26. Johannesen CDL, Langsted A, Mortensen MB, Nordestgaard BG. Association between low density lipoprotein and all cause and cause specific mortality in Denmark: prospective cohort study. BMJ. (2020) 371:m4266. doi: 10.1136/bmj.m4266
27. Wang B, Guo Z, Li H, Zhou Z, Lu H, Ying M, et al. Non-HDL cholesterol paradox and effect of underlying malnutrition in patients with coronary artery disease: a 41,182 cohort study. Clin Nutr. (2022) 41:723–30. doi: 10.1016/j.clnu.2022.01.027
28. Tuikkala P, Hartikainen S, Korhonen MJ, Lavikainen P, Kettunen R, Sulkava R, et al. Serum total cholesterol levels and all-cause mortality in a home-dwelling elderly population: a six-year follow-up. Scand J Prim Health Care. (2010) 28:121–7. doi: 10.3109/02813432.2010.487371
29. Bathum L, Depont Christensen R, Engers Pedersen L, Lyngsie Pedersen P, Larsen J, Nexoe J. Association of lipoprotein levels with mortality in subjects aged 50 + without previous diabetes or cardiovascular disease: a population-based register study. Scand J Prim Health Care. (2013) 31:172–80. doi: 10.3109/02813432.2013.824157
30. Jacobs D, Blackburn H, Higgins M, Reed D, Iso H, McMillan G, et al. Report of the conference on low blood cholesterol: mortality associations. Circulation. (1992) 86:1046–60. doi: 10.1161/01.CIR.86.3.1046
31. Ranieri P, Rozzini R, Franzoni S, Barbisoni P, Trabucchi M. Serum cholesterol levels as a measure of frailty in elderly patients. Exp Aging Res. (1998) 24:169–79. doi: 10.1080/036107398244300
32. Burgess S, Davies NM, Thompson SG, Consortium EP-I. Instrumental variable analysis with a nonlinear exposure-outcome relationship. Epidemiology. (2014) 25:877–85. doi: 10.1097/EDE.0000000000000161
Keywords: non-HDL cholesterol, all-cause mortality, cardiovascular mortality, U-shaped relationship, men
Citation: Zeng R-X, Xu J-P, Kong Y-J, Tan J-W, Guo L-H and Zhang M-Z (2022) U-Shaped Relationship of Non-HDL Cholesterol With All-Cause and Cardiovascular Mortality in Men Without Statin Therapy. Front. Cardiovasc. Med. 9:903481. doi: 10.3389/fcvm.2022.903481
Received: 24 March 2022; Accepted: 06 June 2022;
Published: 07 July 2022.
Edited by:
Alexander Akhmedov, University of Zurich, SwitzerlandReviewed by:
Yang Peng, The University of Queensland, AustraliaDongfeng Zhang, Qingdao University, China
Copyright © 2022 Zeng, Xu, Kong, Tan, Guo and Zhang. This is an open-access article distributed under the terms of the Creative Commons Attribution License (CC BY). The use, distribution or reproduction in other forums is permitted, provided the original author(s) and the copyright owner(s) are credited and that the original publication in this journal is cited, in accordance with accepted academic practice. No use, distribution or reproduction is permitted which does not comply with these terms.
*Correspondence: Min-Zhou Zhang, bWluemhvdXpoYW5nQGd6dWNtLmVkdS5jbg==
 Rui-Xiang Zeng
 Jun-Peng Xu
 Yong-Jie Kong1,2
 Min-Zhou Zhang