 Augustin C. Ogier
 Aurelien Bustin
 Hubert Cochet2,3
 Juerg Schwitter
 Ruud B. van Heeswijk
- 1Department of Diagnostic and Interventional Radiology, Lausanne University Hospital, University of Lausanne, Lausanne, Switzerland
- 2IHU LIRYC, Electrophysiology and Heart Modeling Institute, Université de Bordeaux, INSERM, Centre de Recherche Cardio-Thoracique de Bordeaux, U1045, Bordeaux, France
- 3Department of Cardiovascular Imaging, Hôpital Cardiologique du Haut-Lévêque, CHU de Bordeaux, Avenue de Magellan, Pessac, France
- 4Cardiac MR Center, Cardiology Service, Lausanne University Hospital, University of Lausanne, Lausanne, Switzerland
Parametric mapping of the heart has become an essential part of many cardiovascular magnetic resonance imaging exams, and is used for tissue characterization and diagnosis in a broad range of cardiovascular diseases. These pulse sequences are used to quantify the myocardial T1, T2, , and T1ρ relaxation times, which are unique surrogate indices of fibrosis, edema and iron deposition that can be used to monitor a disease over time or to compare patients to one another. Parametric mapping is now well-accepted in the clinical setting, but its wider dissemination is hindered by limited inter-center reproducibility and relatively long acquisition times. Recently, several new parametric mapping techniques have appeared that address both of these problems, but substantial hurdles remain for widespread clinical adoption. This review serves both as a primer for newcomers to the field of parametric mapping and as a technical update for those already well at home in it. It aims to establish what is currently needed to improve the reproducibility of parametric mapping of the heart. To this end, we first give an overview of the metrics by which a mapping technique can be assessed, such as bias and variability, as well as the basic physics behind the relaxation times themselves and what their relevance is in the prospect of myocardial tissue characterization. This is followed by a summary of routine mapping techniques and their variations. The problems in reproducibility and the sources of bias and variability of these techniques are reviewed. Subsequently, novel fast, whole-heart, and multi-parametric techniques and their merits are treated in the light of their reproducibility. This includes state of the art segmentation techniques applied to parametric maps, and how artificial intelligence is being harnessed to solve this long-standing conundrum. We finish up by sketching an outlook on the road toward inter-center reproducibility, and what to expect in the future.
Introduction
In recent years, cardiac magnetic resonance (CMR) parametric mapping has seen a steady increase in use in the clinical setting. Parametric mapping is the quantification of one or more of the drivers of MR contrast, the relaxation times, in each pixel of an image. These relaxation times or relaxation parameters are quantifiable properties of a tissue in a magnetic field, and strongly depend on physiological properties of that tissue. This leads to large advantages of parametric maps over qualitative imaging, since these maps should no longer be dependent on scan-specific parameters such as radiofrequency (RF) coil proximity, receiver chain efficiency, or magnetic field inhomogeneities. Quantified relaxation times also reduce inter-observer variability, allow for a patient's tissue parameters to be tracked through therapy, and allows for individual patient values to be compared. In theory, these parameter maps should thus be highly reproducible, since they only depend on the interaction of physics and biology. Unfortunately, while parametric mapping can indeed uniquely and quantitatively inform on tissue properties such as interstitial fibrosis and iron deposits, most mapping techniques are in practice not as independent of confounding influences as described above. Different vendors and even different scanners at the same magnetic field strength in the same hospital often led to different baseline relaxation times. Because of these differences, the latest international consensus statement on parametric mapping of the heart (1) recommends establishing reference values in healthy volunteers for each mapping technique, scanner, and hospital. Similarly, recent international guidelines on CMR reference ranges report broad vendor-specific reference ranges (2). This indicates that parametric mapping is currently reproducible at the level of the individual MR scanner, but that relaxation parameters can often not be directly compared between different mapping techniques, or between different hospitals.
The goal of this technical review is therefore to give a overview of current parametric mapping and to project its road toward more general reproducibility. It is intended both as a primer for those new to the field and as an update on the state of the art for those stuck in it. To this end, we will first briefly describe several ways to evaluate the quality and reproducibility of a mapping technique, such as accuracy and sensitivity, and will follow this with basic links between the physics and biology of relaxation times in the heart. Next, we will give an overview of commonly applied techniques to map relaxation times as well as limitations in reproducibility of these techniques. This will be followed by an overview of recent technical improvements from a reproducibility angle, and we will finish with an outlook of what we should expect or try to bring about in the near future.
General considerations
Metrological Terminology
We will define several metrological and mathematical principles that are related to reproducibility so that we can discuss the various mapping techniques in unambiguous terms (3, 4). Reproducibility itself is the degree to which the result of an experiment can be repeated by a different team with a different setup. It should not be confused with repeatability (same team, same setup) or replicability (different team, same setup). Most parametric mapping techniques are highly repeatable and decently replicable. It should also be noted that a repeatable measurement should be robust, meaning that it should continue to be sensitive and accurate in the same center and with the same team in the presence of small variations in experimental conditions that are not always present [in CMR this often means motion (5) and magnetic field inhomogeneities (6)].
The reproducibility of a mapping technique can be described in more detail in terms of accuracy and precision: these characteristics should be determined for all mapping techniques for a given indication and relaxation time. Here, accuracy is defined as the closeness to a gold-standard technique (such as a spin echo (SE) pulse sequence). The term accuracy is often used in a qualitative sense, while its numerical value is indicated by the bias. Precision is how close multiple measurements are to one another and is often also used qualitatively. Its quantitative (and inverse) representation is the variability, which is generally measured as the standard deviation, coefficient of variation (i.e., the standard deviation divided by the mean), or interquartile range (IQR). Accuracy can be derived from the mean relaxation times of a tissue measured with two techniques, while precision is often taken as the inverse of the standard deviation of that relaxation time in a region of interest (ROI).
By setting a cut-off value for a relaxation time that indicates disease, one can assess the sensitivity and specificity of a mapping technique for that disease. Here, sensitivity is the true positive rate: the percentage of true disease cases we positively identify with our defined cut-off. Specificity is the true negative rate, or the percentage of true disease-free cases we correctly ruled out with our cut-off.
While the majority of parametric mapping studies report measures of accuracy and precision, most techniques are too early in their scientific testing cycle to have set cut-offs, and thus do not have globally accepted sensitivities and specificities.
Myocardial Relaxation Parameters
The most common parametric mapping techniques in the heart quantify the T1, T2, (“T2-star”), and T1ρ (“T1-rho”) relaxation times. They were first described by Bloch (7), Bloembergen et al. (8), and Redfield (9) in their seminal papers, and are at times discussed as relaxation rates Rn = 1/Tn. Relaxation times are characteristic times of decay curves that describe their respective relaxation, and strongly depend on the interactions of water molecules with their surroundings. A measured relaxation time in a pixel is an averaged result of several environments and processes, such as intracellular and extracellular water. While the tissue of a subject will have a relaxation time that we want to measure, even these “true” relaxation times in a voxel will thus be a representation of several compartments (and sub-compartments) with a unique relaxation time each. Furthermore, even these true values may significantly differ from a population average due the subject's age, gender, and other factors (2).
T1 relaxation is the increase of longitudinal magnetization and is mainly caused by an irreversible energy loss to the surroundings. The longitudinal relaxation of a signal S follows:
where A = 1 to describe recovery after saturation and A = 2 to describe an inversion (although it can be any value between 0 and 2), S0 is the equilibrium signal, and t is the weighting duration. Longitudinal relaxation of the myocardium is relatively efficient for ordered watery tissues such as the healthy myocardium at clinical field strengths, and its energy loss becomes slower (and the relaxation time is therefore longer) both when there is an increase in free water and when there is an increase in large molecules (10). The former occurs in the case of edema, and the latter in the case of interstitial fibrosis or amyloid deposition, making myocardial T1 relaxation sensitive to both of these processes. The T1 relaxation can furthermore be used to calculate the myocardial extracellular volume (ECV) fraction (11), which is highly sensitive to diffuse and chronic myocardial injuries. The ECV can be calculated by assuming an equilibrium exchange between the blood and myocardium for a gadolinium-based contrast agent (GBCA) (12), and combining the partition coefficient of the GBCA with the hematocrit (Ht). Ht is the volume percentage of red blood cells in blood, and is a robust approximation of the volume that a GBCA cannot flow into in blood. The partition coefficient P of the GBCA can in turn be established from the T1 relaxation times in the myocardium and blood pre- and post-injection of the GBCA:
To correctly measure the ECV, steady-state GBCA concentrations in the various compartments must be achieved, which depends on the GBCA dose and typically takes 10–15 min for scar tissue and standard doses. When Ht is not available, a “synthetic Ht” can be derived from its linear relation with the pre-GBCA blood T1 relaxation time, resulting in a synthetic ECV (13).
T2 relaxation is the decrease of transverse relaxation and is mainly caused by an energy exchange between spins that results in a dephasing of their magnetization (7), and can in practice never be slower than T1 relaxation in biological systems. Its exponential decay can be described by:
In the myocardium, T2 relaxation is acutely sensitive to the average degree of freedom of water (14, 15). If large proteins denature and release their bound water as free water (intracellular edema), T2 relaxation becomes less efficient and immediately slows down. When extracellular edema occurs, the T2 relaxation time increases further. Conversely, in the case of dehydration, there is less free water, and T2 values decrease.
relaxation is the effective transverse relaxation and is the sum of T2 relaxation and the effect of macroscopic magnetic field inhomogeneities ΔBi (8). Due to these inhomogeneities, the dephasing of the magnetization is faster than pure T2 relaxation. relaxation can be described as:
where γ is the gyromagnetic ratio. Since is sensitive to ΔBi, it is particularly sensitive to biological processes that cause magnetic field inhomogeneities. In the myocardium this mostly means the excessive storage of iron complexes, which may be caused by hemochromatosis (hereditary or post-transfusion iron overload) or intramyocardial hemorrhage (after acute myocardial infarction). Such excess iron (especially in the context of long-term transfusion therapies) is difficult for the body to remove by itself, and requires toxic chelation therapy. This therapy needs to be carefully dosed to reduce its side effects and, importantly, to increase patient compliance. Sources of iron can be methemoglobin (involved in hemorrhage), ferritin, and hemosiderin (involved in iron overload). It can be noted that T1 and T2 relaxation also decrease in the presence of concentrated iron compounds, but to a lesser degree.
Finally, T1ρ relaxation is T1 relaxation in the r(h)otating frame (9, 16). Despite its name containing the term T1, it is a transverse signal decrease, behaves like T2 relaxation in Equation 2, and has relaxation times between those of T1 and T2 relaxations. T1ρ relaxation can be achieved by spin-locking (SL) the magnetization in the transverse plane with a continuous low-amplitude RF pulse that prevents normal T2 relaxation. Under the influence of this SL pulse, the transverse magnetization can interact with its surroundings; hence the T1 name. However, the frequency ωSL at which this interaction can take place is directly proportional to the amplitude BSL of the SL pulse (since frequency ωSL = γBSL), which for these low-power pulses means that the magnetization can only interact with molecules that slowly tumble in the low-kHz range: the domain of macromolecules. In the myocardium, this means that T1ρ relaxation is very specifically sensitive to increased concentrations of collagen, amyloid, and other large proteins. Contrary to the other relaxation types, T1ρ relaxation depends not only on the physiology and the main magnetic field, but also on the applied spin-lock frequency.
Routine Myocardial Parametric Mapping
Here we will discuss common myocardial parameter mapping techniques that have routinely been applied in clinical practice, and compare their advantages as well as their sources of bias and variability. Any reported relaxation time is the result of the combination of the subject, hardware, acquisition, reconstruction algorithm, and map analysis that were used; consequently, all steps in obtaining a relaxation time can add bias or uncertainty to its measurement (Figure 1).
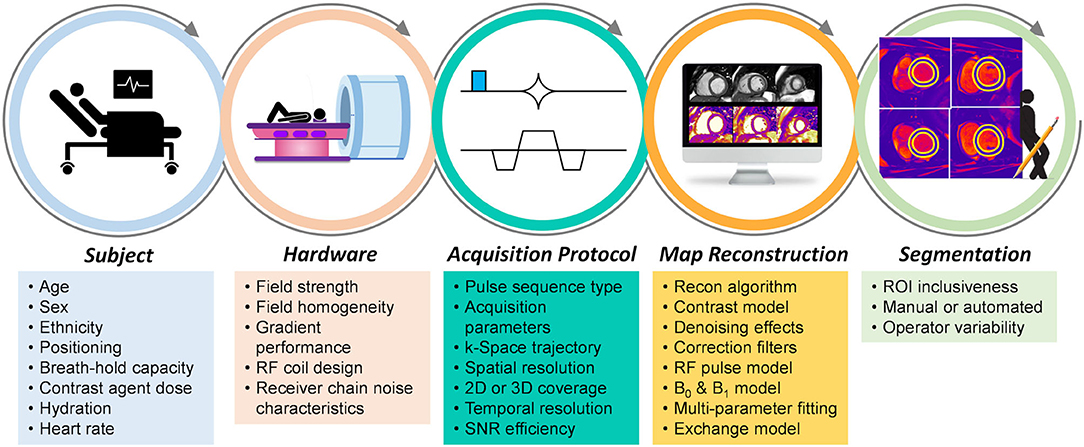
Figure 1. Sources of bias and variability in the myocardial mapping workflow. Various factors at each step contribute to the bias and variability of the obtained relaxation time when using myocardial parametric mapping. Not all factors contribute significantly to all mapping techniques, while some factors cancel one another, and some are included on purpose to increase sensitivity.
A relaxation time is commonly mapped by acquiring multiple images with a difference in the weighting time t of that relaxation time such that the dynamic range of the contrast is as large as possible (Figure 2). This enables the relaxation time to be fitted in each pixel, either with its own analytical equation as described above, or by matching the signal time course in the images to a premade dictionary (17).
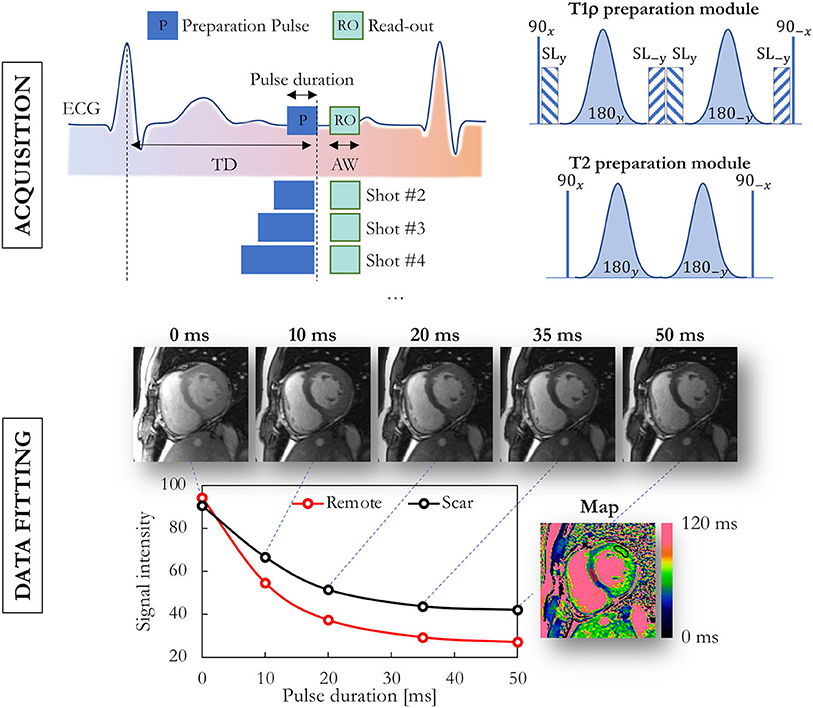
Figure 2. Data acquisition and fitting process in routine myocardial parametric mapping. Multiple images at the same location are acquired with different preparation modules, illustrated here for T1ρ and T2 mapping. Semi-adiabatic T1ρ and T2 preparation modules are shown on the top-right. The obtained images with varying contrast are then fitted on a per-pixel basis, and a false-color map is used to display the obtained values. TD, trigger delay; ECG, electrocardiogram; AW, acquisition window; SL, spin lock.
T1 Mapping
Many cardiac pulse sequences are currently used in the CMR community to directly quantify T1 values for each voxel in the myocardium. The earliest attempts to measure myocardial T1 values used the Look Locker inversion time (TI) scout method to characterized diseased tissue (18). Later on, Look Locker sequences were used to image the heart at different inversion times and estimate the final T1 map by fitting an exponential model through the corresponding pixels. While widely used, such a technique acquires the slices at different cardiac phases, and thus the cardiac shape can vary between the slices, resulting in inaccurate T1 maps.
Myocardial T1 mapping with the Modified Look-Locker (MOLLI) sequence was proposed in 2004 by Messroghli et al. (19) as a variant of Look Locker acquisitions. This sequence consists of a single-shot bSSFP image acquisition that is ECG-triggered at end-diastole, allowing for the precise reconstruction of a T1 map by merging multiple inversion-recovery (IR) experiments according to their inversion times. The standard MOLLI protocol provides precise T1 maps over a wide range of T1 values that cover the myocardial signal curve (e.g., 11 T1-weighted images are usually acquired over 17 heartbeats) and can be used in both pre- and post-contrast administration. The order of acquisitions and waiting periods of this sequence is indicated as 5(3)3, meaning that 5 images are acquired in the 5 heartbeats after the first inversion pulse, followed by a 3-heartbeat waiting period and a second inversion with another 3 acquired images in 3 heartbeats.
A major disadvantage of MOLLI is that the curve fitting yields an “apparent” T1 of the tissue, rather than the “true” T1. The apparent T1, also known as , is a function of the true T1, heart rate, and other imaging parameters, such as the flip angle, views per segment, and TR, which all contribute to its bias. This bias is furthermore not constant: it increases at higher true T1 relaxation times. Finally, is also sensitive to non-ideal slice profiles and RF transmission field (B1) inhomogeneities. Consequently, when using Look-Locker IR methods, is always shorter than the true T1.
Alternative MOLLI techniques have been proposed to alleviate some of these disadvantages. The use of a minimum number of seconds instead of heartbeats as timing between the inversion pulses, i.e., 5s(3s)5s instead of 5(3)3, removes most of the bias at higher heart rates (20). A shortened version of the pulse sequence called ShMOLLI uses a 5(1)1(1)1 scheme that require shorter breath holds and is insensitive to the heartrate (21).
The slice-interleaved T1 (STONE) technique (22) is a free-breathing multi-slice T1 mapping technique and is both more accurate and precise than MOLLI. Here, a lung-liver navigator is used to enable a longer acquisition of multiple slices. The available time is exploited by cycling through acquisitions of the different slices in subsequent heartbeats, thus allowing the magnetization in each slice to relax for multiple heartbeats between readouts and avoiding the issues with the apparent T1 relaxation time. Interestingly, it has similar precision and repeatability at 1.5T when the acquisition is GRE and when it is bSSFP (23).
The highest accuracy for T1 measurement is achieved with the single-point approach, where an image at a single delay time is acquired after each magnetization preparation. The magnetization preparation may be an inversion-recovery or a saturation-recovery (SR). Single-point imaging has the advantages that it is independent of most imaging parameters, insensitive to non-ideal slice profiles and B1 error, and directly measures the true T1, so no T1 correction methods are necessary. However, such techniques have a significantly lower precision than Look-Locker-based techniques due to both the limited amount of signal recovery that occurs within a heartbeat and the use of half the dynamic range. The SMART1Map pulse sequence (24) for example uses single-point SR bSSFP images and long magnetization recovery times after each saturation pulse by allowing multiple-heartbeat recovery times to accurately measure long T1 values. Saturation recovery single-shot acquisition (SASHA) similarly uses multiple shots (25), but uses an image without saturation preparation as an “infinite” recovery image (Figure 3). It also acquires 9 images with a shorter recovery time instead of 5 images with high SNR in order to improve precision.
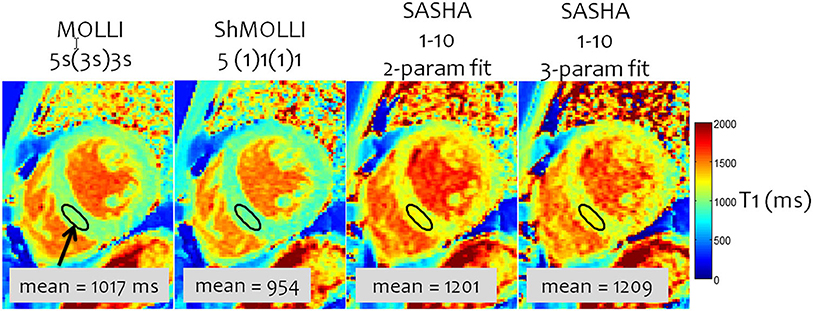
Figure 3. A comparison of inversion- and saturation-based myocardial T1 mapping sequences. MOLLI has the lowest variability due to the inversion and large number of samples, but the lowest accuracy because of the approximate nature of the Look-Locker correction and magnetization transfer. SASHA with a 2-parameter fitting has a small T1 underestimation; 3-parameter fitting is more accurate but has a significantly higher variability. Adapted from Kellman and Hansen (20) with permission.
The exact parameters that are used with the fitting model of Equation 1 affect the accuracy and precision of both inversion and saturation recovery based T1 mapping (20). For inversion, the recovery parameter A can be fixed at or very near 2 (due to T1ρ recovery during adiabatic pulses), which then results in a two-parameter fit that maximizes precision at the cost of accuracy. Conversely, A can be left free in a three-parameter fit to account for field inhomogeneities and hardware imperfections, thus maximizing accuracy at the cost of precision due to the added degree of freedom. Similarly, for saturation recovery, A in Equation 1 can be fixed to 1 for a two-parameter fit and high precision, or it can be left free to improve accuracy (25).
While T1 mapping is normally performed in mid-diastole because of the relatively long rest period (and thus longer sampling time), it can also be performed at end-systole (26, 27). The end-systolic rest period is almost always more consistent than its mid-diastolic counterpart, and especially remains so during very high heartrates and episodes of frequent extrasystoles or atrial fibrillation (28, 29), when mid-diastolic imaging may become problematic. The T1 values themselves only show small and mostly non-significant differences between the two cardiac phases. If motion is correctly accounted for, the thicker myocardial wall may also contribute to lower partial-volume contaminations from neighboring blood and lipid tissue.
When a patient has an implanted cardiac device such as a pacemaker or implantable cardioverter-defibrillator (ICD), the B0 and B1 fields can be significantly distorted in the myocardium, and normal T1 mapping pulse sequences may result in large T1 estimation errors. The AIR (arrhythmia-insensitive rapid) T1 mapping pulse sequence avoids these sensitivities through several adaptations (30). These include GRE instead of bSSFP imaging and adiabatic saturation pulses to handle magnetic field inhomogeneities, as well as acquiring only two images to accelerate the acquisition. These adaptations result in a lower precision than IR- and bSSFP-based sequences such as MOLLI, although it has similar repeatability (31). A version of the AIR sequence that incorporates a wideband (8.9 kHz) saturation pulse was demonstrated to be even more robust in the presence of ICDs (32).
Saturation and inversion recovery preparations can also be combined to share the advantages of both, resulting in SAPPHIRE (33), which reduces the impact of high heart rates and arrhythmia. Here, each ECG trigger is directly followed by a SR pulse that removes all magnetization memory and thus the need for rest periods, insensitivity to heartrate variability, and increased short-T1 signal homogeneity. A subsequent IR pulse with a variable inversion time then adds a large dynamic range of T1 weighting. Like most mapping techniques that involve saturation, SAPPHIRE has a lower precision, higher accuracy and similar reproducibility as IR-based T1 mapping sequences (34).
There are several well-established clinical applications of T1 mapping. It has been shown to sensitively aid in the detection of fibrosis in myocarditis (35), amyloid deposition (36), iron overload (37), and Fabry's disease (38, 39). The combination of pre- and post-GBCA T1 maps can be used to calculate extracellular volume (ECV) maps, which are highly sensitive to diffuse fibrosis in conditions such as hypertrophic (40) and dilated (41) cardiomyopathy as well as chronic infarction (42) and cardiac allograft vasculopathy (43, 44). While native T1 mapping is sensitive to these diseases, it comes at the costs of limited specificity. Liu et al. found elevated T1 values in 13 out of 15 different tested cardiovascular diseases (45). One reason might be that mapping techniques sacrifice spatial resolution to yield quantitative information per pixel. This reduced spatial resolution of current mapping techniques is limiting its usefulness to detect typical intra-myocardial patterns of damage, e.g., to discriminate subendocardial from subepicardial damage, which is clinically highly relevant for diagnosis. Further developments of T1 mapping techniques might therefore aim at higher spatial resolution to allow for this intra-myocardial discrimination.
T2 Mapping
Myocardial T2 mapping is primarily used for the diagnosis of (acute) edema and for the indirect detection of inflammation through such edema. Initially, breath-held turbo spin echo (TSE) pulse sequences were used (46, 47), but these were highly sensitive to motion due to the need for tissue to experience the entire refocusing pulse train. Interestingly, there has also been a minor comeback in TSE-based techniques in recent years (48), perhaps due to the availability of faster and more robust hardware.
In recent years, TSE-based techniques have been mostly replaced by fast and motion-robust acquisitions that are preceded by a T2-preparation module (T2-prep). A T2-prep consists of an unlocalized set of RF pulses that tips down all magnetization, refocuses it as needed, and then tips it back up (Figure 2). This T2-prepared mapping was first described with spiral imaging (49) and then with Cartesian bSSFP (50) for BOLD MRI of the heart. These techniques were shortened to a single breath-hold acquisition by Giri and colleagues (51), which has become the most widespread myocardial T2 mapping technique. The T2 relaxation is characterized from 3 to 4 differently T2-weighted images that are each acquired within a single heartbeat (i.e., single-shot images). A relatively low number of robust and precise images are acquired in order to allow sufficient T1 recovery between these images and thus to mostly avoid a heartrate-dependent bias of the T2 fit, resulting in a technique that is robust and has low intra-observer, interobserver and inter-scan variability, and does not depend on heart rate (52). The technique has among others been shown to aid in the diagnosis of myocarditis (35, 53), where it had a high sensitivity compared to other CMR imaging techniques for the detection or exclusion of biopsy-proven myocarditis (Figure 4). T2 mapping has also been applied for the diagnosis of the area at risk after myocardial infarction (54, 55), the monitoring of the effects of chemotherapy on the heart (56), and acute rejection of the transplanted heart (57, 58).
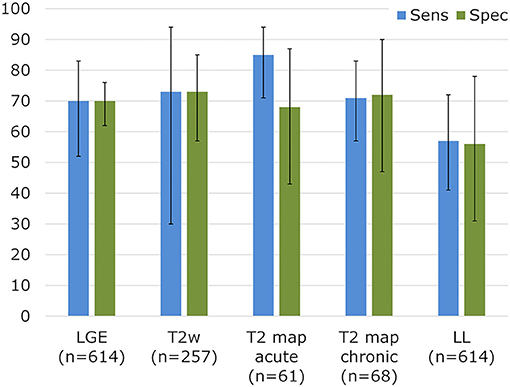
Figure 4. Sensitivity and specificity for established CMR parameters in biopsy-proven myocarditis. Diagnostic performance for myocarditis detection in a meta-analysis for LGE, T2-weighted imaging, and Lake Louise (LL) criteria. T2 mapping results vs. biopsies were collected from Lurz et al. (35). Adapted with permission from Mahrholdt et al. (53).
Similar T2-prepared techniques were later optimized for free breathing with a navigator (59, 60), which allowed the technique to be applied in patient that struggle to hold their breath. T2-prep bSSFP was shown to also perform reasonably well at 3T (61), although more artifacts can be observed at higher magnetic field strength. Alternatively, gradient-recalled echo (GRE) imaging can be used to make the sequence more robust, although this comes at the cost of a sacrifice in precision (60, 62). A minor risk at low-SNR situations is that heavily T2-weighted signal may decay into the noise floor of the image, which may lead to artificially elevated T2 values. To avoid this, a fitting offset can be added (60, 63, 64). Similar to T1 fitting, leaving this offset free increases accuracy, while fixing it to a predetermined value increases its precision. T2 mapping can also be performed at end-systole in the case of very high heart rates or atrial fibrillation (26). While this forces a shorter acquisition window, it also leads to fewer partial volume effects. If faster mapping is desired, a saturation pulse can be added at the start of the acquisition, as always at the cost of precision (63). Several variations of the T2-prep module itself can be applied. The original version by Brittain and colleagues (65) can be set to be very short but is vulnerable to main magnetic field (B0) inhomogeneities, especially at higher magnetic field strengths. Alternatively, a semi-adiabatic version can be used (66), or a version with integrated fat-saturation capabilities (67, 68) to eliminate artifacts from bright lipids. These semi-adiabatic T2-prep modules use normal tip-down and tip-up pulses but have adiabatic refocusing pulses. It should be noted that the magnetization is spin-locked during these adiabatic pulses, and depending on their phase (69), T1ρ or T2ρ relaxation may occur instead of the desired T2 relaxation.
T2 gradient spin echo (T2-GraSE) (70–72) has more recently been adopted in the clinical setting as a robust and fast alternative to T2-prep bSSFP. GraSE imaging consists of a TSE sequence in which each of N echo is subdivided into a series of M echoplanar (EPI) readouts. The N = 6–9 TSE echoes are then used to generate a series of T2-weighted images to calculate the map, while the M = 3–7 EPI readouts per echo are used for spatial encoding and thus enable a faster acquisition. The technique has a similar performance in robustness, repeatability, and precision as T2-prep bSSFP and out-performs purely TSE-based T2 mapping (73). As its parent TSE, GraSE is still sensitive to motion artifacts, although to a lesser degree. Its EPI readout also requires well-calibrated gradient performance, which in turn requires a state-of-the-art scanner. GraSE has been successfully used for the diagnosis of hypertrophic cardiomyopathy (74), aortic stenosis (75), and myocarditis (76).
Several groups have explored the extension of T2-prepared cardiac T2 mapping to 3D in order to cover the entire heart and to detect small foci of inflammation. These techniques have been based on isotropic 3D radial bSSFP (77), Cartesian bSSFP (78), and stack-of-stars bSSFP (79). 3D T2 mapping has been used for detection of graft rejection (80), myocarditis (81), and inflammatory cardiomyopathy (82).
Mapping
Myocardial mapping is the reference CMR technique for the diagnosis of diseases that involve an increase in myocardial iron content (83). While mapping was originally performed as a series of single-echo GRE images with increasing TE (84), it is nowadays mostly performed with multi-echo GRE (ME-GRE) sequences. In ME-GRE, 8 or 9 images with different TEs are acquired in a single breath-hold (85). A drawback of this approach is the sensitivity to magnetic susceptibility (especially near the cardiac veins) and to magnetic field inhomogeneities (in the lateral segments nearer to the lungs), low precision, and blood partial volume effects. Because of the vulnerabilities, ME-GRE maps are commonly only evaluated in the septal segments. It should be noted that this is only a minor detractor in the case of most iron storage diseases, since they are diffuse pathologies. A dark blood preparation Fitting of the decay with an offset and cropping the images that decay into the noise floor (86) have been proposed by He and colleagues to decrease bias, but like the extra degree of freedom in T1 and T2 fitting, risks decreasing precision. More recently, a respiratory-navigated ME-GRE variant (87) was proposed to overcome the precision issues by averaging several images for each echo time.
mapping has been shown to correlate well with the cardiac iron concentration (88), and its application in β-thalassemia major has led to a paradigm shift in the management of the disease (89): by introducing mapping into clinical routine, the mortality of β-thalassemia patients decreased by 71% in a large UK registry (90). The transferability of the diagnostic quality of ME-GRE has been validated in a multi-center trial (91).
Several groups have also studied use of mapping for the quantification of intramyocardial hemorrhage (IMH) after the revascularization of myocardial infarction (92). A recent study by Chen et al. found that mapping has a very high sensitivity and specificity for the detection of IMH, but that the detected IMH volume with a generally accepted absolute threshold of 20 ms underestimates the volume detected with a subject-specific threshold (93).
T1ρ Mapping
Myocardial T1-rho (T1ρ) mapping has emerged as a promising CMR tool to quantify myocardial fibrosis without injection of contrast agent. T1ρ mapping is performed by playing out a variable T1ρ preparation module before a fast acquisition, similar to T2-prepared T2 mapping (94). The T1ρ -prep module consists of tip-down, refocusing and tip-up RF pulses, interspersed with continuous low-power spin-locking pulses (Figure 2). T1ρ mapping of the heart was initially explored in animal models, mostly to discriminate between infarct and healthy myocardium (95–99).
Given the promise of gadolinium-free fibrosis quantification (Figure 5), T1ρ mapping was initially explored in clinical studies of chronic infarction (100), hypertrophic cardiomyopathy (101, 102) and dilated cardiomyopathy (103). It was also successfully applied to map the myocardium in patients with end-stage renal disease where GBCAs could not be injected (104).
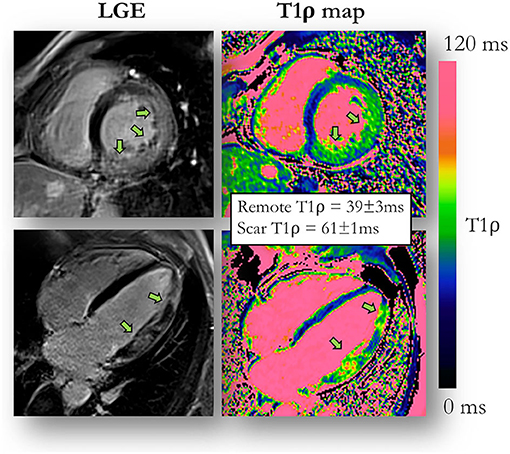
Figure 5. T1ρ mapping compared to late gadolinium enhancement (LGE) imaging. An example of a 51-year-old male patient with acute myocarditis and evidence of myocardial injury both on LGE images and contrast-agent-free myocardial T1ρ mapping. Adapted with permission from Bustin et al. (94).
Most of these studies were applied with a spin-lock frequency around 500 Hz, which most likely leaves the T1ρ values obtained from the different single-center studies as comparable to one another as those obtained with other mapping modalities. However, it is currently not clear to which degree the different T1ρ preparation modules (with hard or adiabatic RF pulses, with and without phase cycling schemes) are comparable. For example, the adiabatic pulses are relatively long compared to part of the spin-lock durations, but spin-lock the magnetization at a different frequency.
Recent Steps Toward Improved Reproducibility
The principal cause for the continued success of qualitative over quantitative CMR techniques can be found with the fast and straightforward encoding of MR data in qualitative imaging. In contrast to qualitative CMR, quantitative imaging tries to account for physical effects and interactions that happen during data collection to produce clinically valuable maps. This comes with a price: (i) lengthy acquisitions since multi-parametric information needs to be collected, (ii) inefficient data acquisition since most mapping techniques probe only one parameter at a time (e.g., T1 or T2), (iii) inaccurate maps since relaxation times are estimated using a simple exponential model that, by definition, is subject to some limitations, and (iv) a lower spatial resolution that hinders accurate and localized segmentation. Here we discuss recent technologies that have been designed to address the above obstacles.
Acquisition and Reconstruction Strategies: Multiparametric Mapping and Beyond
Recently described multiparametric mapping technologies take a step toward easier, faster, and more reproducible quantitative MRI of the beating heart by challenging the longstanding dominance of single-contrast-weighted imaging. These novel techniques promise to simplify myocardial mapping by for example providing simultaneous myocardial T1 and T2 maps and functional imaging with 2D or 3D coverage from a single scan. These technologies can be categorized into two groups: continuous and triggered acquisitions (Figure 6).
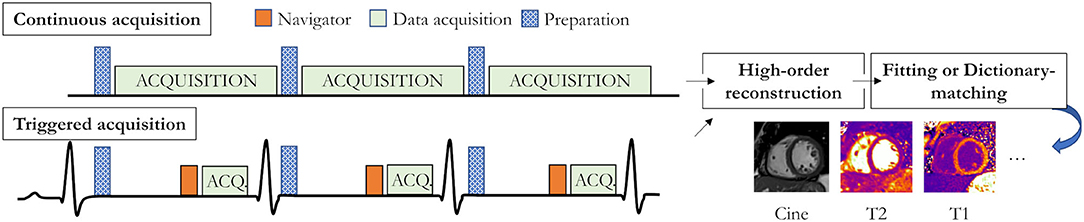
Figure 6. Recent acquisition strategies for single scan multiparametric cardiac mapping. Both accurate and precise continuous acquisition (top) and triggered acquisition (bottom) strategies have been proposed. Preparation modules could for example be an inversion pulse (as shown in the triggered diagram) or a T2 preparation module.
Continuous techniques, such as MR fingerprinting (MRF) (17, 105, 106) or MR multitasking (107), attempt to capture the continuous transient state of the magnetization history with continuous data collection. By combining highly undersampled acquisition with variable modules (e.g., both saturation and inversion), and dictionary-based matching instead of the established curve fitting approaches, MRF offers co-registered multi-parametric maps with unprecedented speed. The cardiac MRF framework was initially proposed to simultaneously collect T1, T2, S0, and B0 maps with significantly faster scan times than conventional mapping techniques (Figure 7). It also promises several other advantages, such as the easy extension to other physical parameters (e.g., magnetization transfer, diffusion, , and T1ρ), to biophysical model correction (e.g., integrating the slice profile, B0 field, or B1 field in the MRF dictionary), and to higher data encoding efficiency [e.g., simultaneous multi-slice (108) or 3D whole-heart].
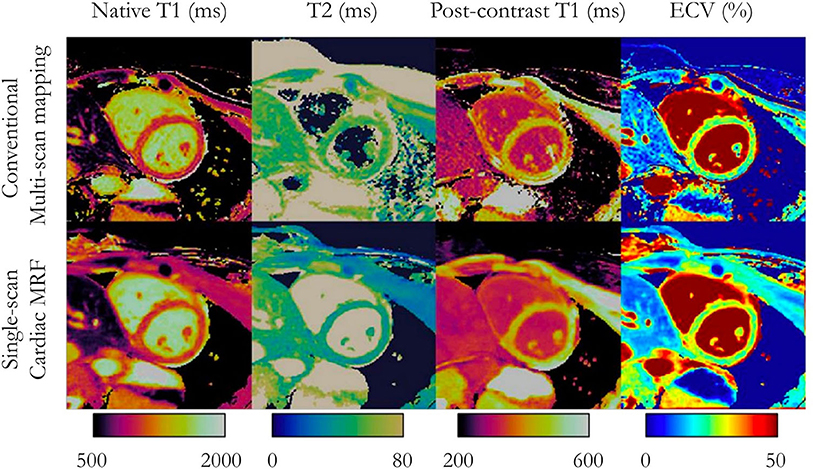
Figure 7. Multi-parameter mapping. Comparisons between conventional multi-scan native T1, T2, post-contrast T1, and synthetic ECV maps (top) with single-scan magnetic resonance fingerprinting (bottom) in a patient with no cardiac disease finding. Adapted with permission from Jaubert et al. (106). MRF, magnetic resonance fingerprinting; ECV, extracellular volume fraction.
Another uninterrupted MR technique for motion-resolved multiparametric cardiac mapping is the multitasking technique proposed by Christodoulou et al. (107). This technology aims to capture the multiple dynamics (e.g., cardiac and respiratory motion, parameter mapping, or contrast perfusion) in a unified ECG-free free-breathing framework. A high-order low-rank tensor decomposition framework is designed to naturally exploit the multiple dynamics given by this data-rich acquisition technology and to deliver high-quality cardiac maps in any given cardiac or respiratory states.
Triggered techniques acquire a small number of fully-sampled (or moderately undersampled) time-point images (often in mid-diastole) through the smart combination of preparation pulses (e.g., saturation, inversion, T2-preparation). Akçakaya et al. (109) proposed to interleave saturation-recovery and T2 preparation to acquire myocardial 2D T1 and T2 maps in a single breath-hold. Milotta et al. (110) took one step further to collect co-registered 3D whole-heart T1/T2 maps and water/fat imaging in a single 10-min free-breathing scan by combining inversion recovery and T2 preparation. These acquisition technologies promise to substantially reduce the scan duration, breathing instructions, and post-processing requirements, and thus increase parameter mapping reproducibility.
The application of artificial intelligence (AI) to improve map reconstruction is a very recent phenomenon. Nezafat and colleagues (111) have trained a neural network to remove streaking artifacts from radial T1 maps, while Guo et al. (112) trained a network to reconstruct precise T1 maps from only the first four images of a MOLLI pulse sequence, thus drastically shortening the needed breath hold. While these initial results are highly encouraging, it should be kept in mind that the single-center reproducibility of parametric mapping will likely also have its effect on the training of neural networks, suggesting that AI-enhanced mapping reconstructions may produce biases in other centers.
Finally, multi-parametric mapping is ideally suited to radiomics applications (113), where a large number of radiomic features is extracted from a single image (or map). Although, this goes beyond current clinical applications of parametric mapping, it may very well lead to significant knowledge discovery in a broad range of cardiac diseases. The first radiomic studies based on T1 mapping have shown to provide high diagnostic accuracy for the detection of microvascular obstruction (114) and hypertrophic cardiomyopathy phenotypes (115). However, it should be kept in mind that parametric mapping can only be included in radiomic analyses if the mapping techniques are consistent and reproducible in all patients; this may preclude its current use in multi-centric radiomic studies (116).
Unfortunately, the reproducibility of the above-mentioned technologies is still impacted by confounding factors. Continuous techniques are affected by slice profile and B1 imperfections (117–119) and by preparation pulse inefficiency (e.g., inversion, saturation, and T2-preparation). Mapping errors due to these imperfections can be significantly reduced by including these effects into the MRF dictionary (although this is computationally expensive), or by naturally acquiring data in 3D. Reproducibility can also be increased by considering intra voxel dephasing, off-resonance frequency, multi-compartment models, partial volume, and magnetization transfer variables (120–122) during dictionary generation.
Post-processing Strategies: Fully Automated Quantification
Segmentation is an essential step to extract quantitative values from CMR parametric mapping. The delineation of regions of interest has remained a manual process in most clinical studies that use these parametric maps. Manual segmentation is a time-consuming process and is prone to subjective analysis errors inducing significant inter- and intra-observer variability. Furthermore, clinical recommendations do not necessarily suggest the segmentation of the entire heart, but only the delineation of some areas of pathology and healthy tissue for comparison (1). Several combinations of segmenting and reporting have been employed: (1) segmenting only a myocardial region with visibly elevated relaxation times together with a small apparently non-elevated region in the opposite myocardium (45, 51), (2) segmenting the myocardium according to the AHA guidelines (123) and reporting these (48, 73), (3) reporting a single whole-heart relaxation time (33, 43, 124), and (4) reporting single-slice relaxation times (36, 40). This lack of segmentation consensus is likely to affect reproducibility and comparison of parametric values between subjects and studies. Manual partial delineation of the myocardium might follow different guidelines depending on the cardiomyopathy (45). Given the possible inhomogeneity of parametric values in the heart, a complete segmentation of the myocardium, allowing division according to standard AHA segments, appears to be the most suitable approach going forward to provide reproducible results (73).
To enable more reproducible measurements of the values extracted from the parametric maps and to reduce the burden of manual analysis, automated segmentation methods are warranted. Automatic methods aim to provide a level of accuracy equal to the inter-expert variability of trained clinicians with extensive expertise in cardiac segmentation, and to reduce the duration of the segmentation. Such automatic methods would therefore remove the barrier for clinical use by non-experts by providing fast user-friendly tools that enable the consistent extraction of reproducible biomarkers from CMR parametric mapping. While several methods have been proposed for the segmentation of qualitative contrast-weighted imaging such as cine or late gadolinium enhancement images (125), only a few automated methods have so far addressed the issue of segmenting CMR parametric mapping to potentially offer a less operator-dependent process.
To correct the motion between the T1-weigthed images that are used for the generation of T1 maps, an active shape model approach has been proposed for the segmentation of the left ventricle blood and myocardium (126). This approach still required manual initialization and, as with all deformable models, it requires a substantial parameterization of the model, which is closely related to the nature of the datasets for which the model is trained. Consequently, it may be difficult to transfer this model to other types of CMR parametric mapping.
Deep learning (DL)-based approaches outperform traditional methods such as model-based and atlas-based methods, and have become the most promising solutions for CMR image segmentation. Using fully convolutional networks based on the U-Net architecture, methods have been proposed for the segmentation of native T1 maps of the left ventricular myocardium (127, 128) and together with the right ventricle (129). The integration of advanced features such as attention and densely connected layer mechanisms, has so far not yielded better results than a standard U-Net for myocardial segmentation of CMR parametric maps (128). However, since DL-based methods may be inconsistent for semantic medical image segmentation due to the high variability of the training dataset, quality control procedures can be incorporated to ensure the consistency of the computed segmentations. These quality controls can be additional modules that refine the segmentation via geometric a priori knowledge on the shape of the desired segmentations (127) or modules directly integrated to the neural network, which generates uncertainty information maps to reject inaccurate segmentation (129).
Although promising results have been reported for the segmentation on T1 native maps, one must keep in mind that the neural network training phase strongly relies on a tuning phase of the network hyperparameters that must be empirically performed, thereby reducing the fully automatic aspect of the method. Deep learning solutions must also be optimized by experts for a given dataset, and this commonly takes hours of implementation. The training models developed for one type of CMR image or map are therefore not directly applicable to other CMR modalities. Furthermore, DL-based methods derive part of their success from access to large databases. While there are several public databases of CMR cine or late gadolinium enhancement images (125), public databases of substantial annotated CMR parametric maps are still non-existent. These databases should also best represent the large phenotypic variability present in the disease states of the different cardiomyopathies where specific myocardial architectures must be considered. To face this issue of limited availability of manually segmented data, several methods have been proposed to artificially enlarge smaller datasets, such as data augmentation, transfer learning with fine-tuning, weakly and semi-supervised learning, self-supervised learning, and unsupervised learning. Leveraging transfer learning, Zhu et al. recently used a convolutional neural network pre-trained on T1 maps to automatically segment the left ventricular myocardium on T2 and ECV maps with an encouraging accuracy (130). Inter-modality registration methods also offer an alternative to modality domain change. Since DL-based methods perform better on qualitative images, Farrag et al. thus propagated a DL-based segmentation computed on cinematic images to T1 maps (128). However, this approach requires several specific acquisitions and faces the well-known inter-modality registration challenges.
Outlook and Conclusion
Parametric mapping has become a routine part of CMR exams in clinical practice. These routine mapping techniques are often preferred over their qualitative counterparts due to multiple advantages, such as lower artifact ambiguity and facilitation of comparison between patients and throughout therapy. Furthermore, currently used techniques have an acceptable level of accuracy and precision, while their sources of bias and variability are well-understood. This renders these techniques appropriate for single-center studies and usage in routine exams. While full generalizability (131) may still be quite a way off, recent multiparametric and model-based map reconstructions enable the removal of many biases. For the adoption of parametric mapping by non-academic institutions, not only will inter-site reproducibility of the techniques need to be demonstrated, but the ease of use of the acquisition and analysis will also need to improve. Especially the reproducibility of acquisition planning and image segmentation remain significant rate-limiting steps. Free-running 2D techniques may improve the reproducibility of the scan planning, since fewer sequence timings need to be determined and set, while 3D free-running techniques may be less susceptible to anatomical confounders, since the entire heart is acquired in a standard anatomical orientation.
A sometimes-overlooked cornerstone of reproducibility is open access to sample data and source code: the sharing of datasets enables others to check their tools for bias against established techniques, while map reconstruction and analysis frameworks such as the Bay Area Reconstruction Toolbox (BART, https://mrirecon.github.io/bart/), the Michigan Image Reconstruction Toolbox (MIRT, https://github.com/JeffFessler/MIRT), and many others (4) can be used to harmonize map reconstruction. Efforts toward reproducibility and standardization can often be accelerated if there is an overarching international organization that many parties trust. To this end, several international networks such as the Quantitative Image Biomarker Alliance (QIBA) (132) of the Radiological Society of North America (RSNA) and the Quantitative MR Study Group (4) of the International Society for Magnetic Resonance in Medicine (ISMRM) have been established, and have put up roadmaps for the development of new quantitative imaging techniques that may help accelerate their acceptance for clinical practice.
From a clinical perspective, T1 mapping holds great promise to differentiate disease states from health. The quantification of ECV is of particular clinical interest for the diagnosis of cardiac amyloidosis, as some forms can now be treated successfully by novel drugs. Furthermore, the detection of Fabry's disease by low native T1 values is key for this diagnosis. On the other hand, most cardiac diseases are associated with elevated native T1 values, and without an etiological diagnosis, a targeted treatment is not possible. Therefore, clinical randomized controlled trials are needed to demonstrate the added value of native T1 measurements, since currently, an elevated T1 value does not lead to a direct management decisions. A specific technical aspect that may benefit from improvement relates to the spatial resolution of T1 mapping. In the past, a major goal of CMR imaging in post-infarct patients was the delineation of scar extent to decide for example on revascularization or on cardiac resynchronization therapy. Nowadays, the focus is on detection of arrhythmic substrates in patients at risk for ventricular tachycardias or sudden cardiac death to decide on ablation and placement of an implantable cardioverter defibrillator (ICD). This scar analysis requires very high spatial resolution, an aspect of T1 mapping that could be improved. The availability of T2 mapping techniques has improved the detection of myocardial edema due to fewer artifacts than typically associated with T2-weighted sequences. It also allows the quantitatively monitoring of disease activity and response to treatment, e.g., in rheumatic diseases, which affect the entire myocardium. Whether a T2-mapping-guided treatment approach in myocarditis or rheumatic disease is superior to a conventionally guided treatment needs to be documented by clinical trials. The application of mapping to guide therapy in thalassemia patients reduced mortality by 71% and is therefore the showcase model of how CMR can change patient outcome. Finally, T1ρ mapping holds promise for the quantification of injury when GBCA cannot be injected, and remains to be further characterized and explored.
In conclusion, the advent of the mapping techniques could substantially improve our ability to accurately and reproducibly measure myocardial tissue characteristics. Current routine parametric mapping techniques have well-characterized sources of bias and variability and are widely accepted for single-center studies. In response to these challenges in reproducibility, a wide range of more accurate and precise techniques that leverage multiparametric and physical modeling, 3D coverage, deep learning, and automated segmentation have recently been developed. This increased reproducibility should be established though multi-center studies.
Author Contributions
RvH, AB, and AO contributed to the conception and design of the manuscript. All authors contributed to manuscript revision, read, and approved the submitted version.
Funding
This work was financially supported by the Swiss National Science Foundation (SNSF grants 32003B_182615 and CRSII5_202276 to RvH), by funding from the French National Research Agency under grant agreements Equipex MUSIC ANR-11-EQPX-0030, ANR-21-CE17-0034-01, and Programme d'Investissements d'Avenir ANR-10-IAHU04-LIRYC, and from the European Council under grant agreement ERC n715093 (to HC), and by Bayer Healthcare, Schweiz AG (to JS). AB acknowledges a Lefoulon-Delalande Foundation fellowship administered by the Institute of France.
Conflict of Interest
JS declares research funding from Bayer Healthcare Schweiz AG. The funder was not in any way involved in this study.
The remaining authors declare that the research was conducted in the absence of any commercial or financial relationships that could be construed as a potential conflict of interest.
Publisher's Note
All claims expressed in this article are solely those of the authors and do not necessarily represent those of their affiliated organizations, or those of the publisher, the editors and the reviewers. Any product that may be evaluated in this article, or claim that may be made by its manufacturer, is not guaranteed or endorsed by the publisher.
References
1. Messroghli DR, Moon JC, Ferreira VM, Grosse-Wortmann L, He T, Kellman P, et al. Clinical recommendations for cardiovascular magnetic resonance mapping of T1, T2, T2* and extracellular volume: a consensus statement by the Society for Cardiovascular Magnetic Resonance (SCMR) endorsed by the European Association for Cardiovascular Imaging (EACVI). J Cardiovasc Magn Reson. (2017) 19:75. doi: 10.1186/s12968-017-0389-8
2. Kawel-Boehm N, Hetzel SJ, Ambale-Venkatesh B, Captur G, Francois CJ, Jerosch-Herold M, et al. Reference ranges (“normal values”) for cardiovascular magnetic resonance (CMR) in adults and children: 2020 update. J Cardiovasc Magn Reson. (2020) 22:87. doi: 10.1186/s12968-020-00683-3
3. Hagiwara A, Fujita S, Ohno Y, Aoki S. Variability and standardization of quantitative imaging: monoparametric to multiparametric quantification, radiomics, and artificial intelligence. Invest Radiol. (2020) 55:601–16. doi: 10.1097/RLI.0000000000000666
4. Weingärtner S, Desmond KL, Obuchowski NA, Baessler B, Zhang Y, Biondetti E, et al. Development, validation, qualification, and dissemination of quantitative MR methods: overview and recommendations by the ISMRM quantitative MR study group. Magn Reson Med. (2022) 87:1184–206. doi: 10.1002/mrm.29084
5. van Heeswijk RB, Bonanno G, Coppo S, Coristine A, Kober T, Stuber M. Motion compensation strategies in magnetic resonance imaging. Crit Rev Biomed Eng. (2012) 40:99–119. doi: 10.1615/CritRevBiomedEng.v40.i2.20
6. Rajiah P, Kay F, Bolen M, Patel AR, Landeras L. Cardiac magnetic resonance in patients with cardiac implantable electronic devices: challenges and solutions. J Thorac Imaging. (2020) 35:W1–17. doi: 10.1097/RTI.0000000000000462
8. Bloembergen N, Purcell EM, Pound RV. Relaxation effects in nuclear magnetic resonance absorption. Phys Rev. (1948) 73:679–712. doi: 10.1103/PhysRev.73.679
9. Redfield AG. Nuclear magnetic resonance saturation and rotary saturation in solids. Phys Rev. (1955) 98:1787–809. doi: 10.1103/PhysRev.98.1787
10. Robinson AA, Chow K, Salerno M. Myocardial T1 and ECV measurement. JACC Cardiovasc Imaging. (2019) 12:2332–44. doi: 10.1016/j.jcmg.2019.06.031
11. Ugander M, Oki AJ, Hsu LY, Kellman P, Greiser A, Aletras AH, et al. Extracellular volume imaging by magnetic resonance imaging provides insights into overt and sub-clinical myocardial pathology. Eur Heart J. (2012) 33:1268–78. doi: 10.1093/eurheartj/ehr481
12. Schwitter J, Saeed M, Wendland MF, Derugin N, Canet E, Brasch RC, et al. Influence of severity of myocardial injury on distribution of macromolecules: extravascular versus intravascular gadolinium-based magnetic resonance contrast agents. J Am Coll Cardiol. (1997) 30:1086–94. doi: 10.1016/S0735-1097(97)00245-3
13. Treibel TA, Fontana M, Maestrini V, Castelletti S, Rosmini S, Simpson J, et al. Automatic measurement of the myocardial interstitium: synthetic extracellular volume quantification without hematocrit sampling. JACC Cardiovasc Imaging. (2016) 9:54–63. doi: 10.1016/j.jcmg.2015.11.008
14. Tscholakoff D, Higgins CB, McNamara MT, Derugin N. Early-phase myocardial infarction: evaluation by MR imaging. Radiology. (1986) 159:667–72. doi: 10.1148/radiology.159.3.3704148
15. Friedrich MG. Myocardial edema–a new clinical entity? Nat Rev Cardiol. (2010) 7:292–6. doi: 10.1038/nrcardio.2010.28
16. Wang L, Regatte RR. T1ρ MRI of human musculoskeletal system. J Magn Reson Imaging. (2015) 41:586–600. doi: 10.1002/jmri.24677
17. Hamilton JI, Jiang Y, Chen Y, Ma D, Lo WC, Griswold M, et al. MR fingerprinting for rapid quantification of myocardial T1, T2, and proton spin density. Magn Reson Med. (2017) 77:1446–58. doi: 10.1002/mrm.26668
18. Wagenseil JE, Johansson LOM, Lorenz CH. Characterization of t1 relaxation and blood-myocardial contrast enhancement of NC100150 injection in cardiac MRI. J Magn Reson Imaging. (1999) 10:784–9. doi: 10.1002/(sici)1522-2586(199911)10:5<784::aid-jmri24>3.0.co;2-a
19. Messroghli DR, Radjenovic A, Kozerke S, Higgins DM, Sivananthan MU, Ridgway JP. Modified look-locker inversion recovery (MOLLI) for high-resolution T1 mapping of the heart. Magn Reson Med. (2004) 52:141–6. doi: 10.1002/mrm.20110
20. Kellman P, Hansen MS. T1-mapping in the heart: accuracy and precision. J Cardiovasc Magn Reson. (2014) 16:2. doi: 10.1186/1532-429X-16-2
21. Piechnik SK, Ferreira VM, Dall'Armellina E, Cochlin LE, Greiser A, Neubauer S, Robson MD. Shortened modified look-locker inversion recovery (ShMOLLI) for clinical myocardial T1-mapping at 15 and 3 T within a 9 heartbeat breathhold. J Cardiovasc Magn Reson. (2010) 12:69. doi: 10.1186/1532-429X-12-69
22. Weingärtner S, Roujol S, Akçakaya M, Basha TA, Nezafat R. Free-breathing multislice native myocardial T1 mapping using the slice-interleaved T1 (STONE) sequence. Magn Reson Med. (2015) 74:115–24. doi: 10.1002/mrm.25387
23. Jang J, Bellm S, Roujol S, Basha TA, Nezafat M, Kato S, et al. Comparison of spoiled gradient echo and steady-state free-precession imaging for native myocardial T1 mapping using the slice-interleaved T1 mapping (STONE) sequence. NMR Biomed. (2016) 29:1486–96. doi: 10.1002/nbm.3598
24. Slavin GS, Hood MN, Ho VB, Stainsby JA. Breath-held myocardial T1 mapping using multiple single-point saturation recovery. In: Proc ISMRM, Vol. 20. (2012). p. 1244.
25. Chow K, Flewitt JA, Green JD, Pagano JJ, Friedrich MG, Thompson RB. Saturation recovery single-shot acquisition (SASHA) for myocardial T(1) mapping. Magn Reson Med. (2014) 71:2082–95. doi: 10.1002/mrm.24878
26. Tessa C, Diciotti S, Landini N, Lilli A, Del Meglio J, Salvatori L, et al. Myocardial T1 and T2 mapping in diastolic and systolic phase. Int J Cardiovasc Imaging. (2015) 31:1001–10. doi: 10.1007/s10554-015-0639-5
27. Ferreira VM, Wijesurendra RS, Liu A, Greiser A, Casadei B, Robson MD, et al. Systolic ShMOLLI myocardial T1-mapping for improved robustness to partial-volume effects and applications in tachyarrhythmias. J Cardiovasc Magn Reson. (2015) 17:77. doi: 10.1186/s12968-015-0182-5
28. Zhao L, Li S, Ma X, Greiser A, Zhang T, An J, et al. Systolic MOLLI T1 mapping with heart-rate-dependent pulse sequence sampling scheme is feasible in patients with atrial fibrillation. J Cardiovasc Magn Reson. (2016) 18:13. doi: 10.1186/s12968-016-0232-7
29. Shinbo H, Tomioka S, Ino T, Koyama K. Systolic modified Look–Locker inversion recovery myocardial T1 mapping improves the accuracy of T1 and extracellular volume fraction measurements of patients with high heart rate or atrial fibrillation. Radiol Phys Technol. (2020) 13:405–13. doi: 10.1007/s12194-020-00594-z
30. Fitts M, Breton E, Kholmovski EG, Dosdall DJ, Vijayakumar S, Hong KP, et al. Arrhythmia insensitive rapid cardiac T1 mapping pulse sequence. Magn Reson Med. (2013) 70:1274–82. doi: 10.1002/mrm.24586
31. Hong K, Collins J, Lee DC, Wilcox JE, Markl M, Carr J, et al. Optimized AIR and investigational MOLLI cardiac T1 mapping pulse sequences produce similar intra-scan repeatability in patients at 3T. NMR Biomed. (2016) 29:1454–63. doi: 10.1002/nbm.3597
32. Hong K, Jeong E-K, Wall TS, Drakos SG, Kim D. Wideband arrhythmia-insensitive-rapid (AIR) pulse sequence for cardiac T1 mapping without image artifacts induced by an implantable-cardioverter-defibrillator. Magn Reson Med. (2015) 74:336–45. doi: 10.1002/mrm.25712
33. Weingärtner S, Akçakaya M, Basha T, Kissinger KV, Goddu B, Berg S, et al. Combined saturation/inversion recovery sequences for improved evaluation of scar and diffuse fibrosis in patients with arrhythmia or heart rate variability. Magn Reson Med. (2014) 71:1024–34. doi: 10.1002/mrm.24761
34. Roujol S, Weingartner S, Foppa M, Chow K, Kawaji K, Ngo LH, et al. Accuracy, precision, and reproducibility of four T1 mapping sequences: a head-to-head comparison of MOLLI, ShMOLLI, SASHA, and SAPPHIRE. Radiology. (2014) 272:683–9. doi: 10.1148/radiol.14140296
35. Lurz P, Luecke C, Eitel I, Föhrenbach F, Frank C, Grothoff M, et al. Comprehensive cardiac magnetic resonance imaging in patients with suspected myocarditis: the myoracer-trial. J Am Coll Cardiol. (2016) 67:1800–11. doi: 10.1016/j.jacc.2016.02.013
36. Karamitsos TD, Piechnik SK, Banypersad SM, Fontana M, Ntusi NB, Ferreira VM, et al. Noncontrast T1 mapping for the diagnosis of cardiac amyloidosis. JACC Cardiovasc Imaging. (2013) 6:488–97. doi: 10.1016/j.jcmg.2012.11.013
37. Sado DM, Maestrini V, Piechnik SK, Banypersad SM, White SK, Flett AS, et al. Noncontrast myocardial T1 mapping using cardiovascular magnetic resonance for iron overload. J Magn Reson Imaging. (2015) 41:1505–11. doi: 10.1002/jmri.24727
38. Pica S, Sado DM, Maestrini V, Fontana M, White SK, Treibel T, et al. Reproducibility of native myocardial T1 mapping in the assessment of Fabry disease and its role in early detection of cardiac involvement by cardiovascular magnetic resonance. J Cardiovasc Magn Reson. (2014) 16:99. doi: 10.1186/s12968-014-0099-4
39. Thompson RB, Chow K, Khan A, Chan A, Shanks M, Paterson I, et al. T1 mapping with cardiovascular MRI is highly sensitive for Fabry disease independent of hypertrophy and sex. Circ Cardiovasc Imaging. (2013) 6:637–45. doi: 10.1161/CIRCIMAGING.113.000482
40. Swoboda PP, McDiarmid AK, Erhayiem B, Broadbent DA, Dobson LE, Garg P, et al. Assessing myocardial extracellular volume by T1 mapping to distinguish hypertrophic cardiomyopathy from athlete's heart. J Am Coll Cardiol. (2016) 67:2189–90. doi: 10.1016/j.jacc.2016.02.054
41. Sado DM, Flett AS, Banypersad SM, White SK, Maestrini V, Quarta G, et al. Cardiovascular magnetic resonance measurement of myocardial extracellular volume in health and disease. Heart. (2012) 98:1436–41. doi: 10.1136/heartjnl-2012-302346
42. Messroghli DR, Walters K, Plein S, Sparrow P, Friedrich MG, Ridgway JP, et al. MyocardialT1 mapping: application to patients with acute and chronic myocardial infarction. Magn Reson Med. (2007) 58:34–40. doi: 10.1002/mrm.21272
43. van Heeswijk RB, Bastiaansen JAM, Iglesias JF, Degrauwe S, Rotman S, Barras J-L, et al. Quantification of myocardial interstitial fibrosis and extracellular volume for the detection of cardiac allograft vasculopathy. Int J Cardiovasc Imaging. (2020) 36:533–42. doi: 10.1007/s10554-019-01733-3
44. Husain N, Watanabe K, Berhane H, Gupta A, Markl M, Rigsby CK, et al. Multi-parametric cardiovascular magnetic resonance with regadenoson stress perfusion is safe following pediatric heart transplantation and identifies history of rejection and cardiac allograft vasculopathy. J Cardiovasc Magn Res. (2021) 23:135. doi: 10.1186/s12968-021-00803-7
45. Liu JM, Liu A, Leal J, McMillan F, Francis J, Greiser A, et al. Measurement of myocardial native T1 in cardiovascular diseases and norm in 1291 subjects. J Cardiovasc Magn Reson. (2017) 19:74. doi: 10.1186/s12968-017-0386-y
46. Lund G, Morin RL, Olivari MT, Ring WS. Serial myocardial T2 relaxation time measurements in normal subjects and heart transplant recipients. J Heart Transplant. (1988) 7:274–9.
47. Marie PY, Angioi M, Carteaux JP, Escanye JM, Mattei S, Tzvetanov K, et al. Detection and prediction of acute heart transplant rejection with the myocardial T2 determination provided by a black-blood magnetic resonance imaging sequence. J Am Coll Cardiol. (2001) 37:825–31. doi: 10.1016/S0735-1097(00)01196-7
48. Meloni A, Nicola M, Positano V, D'Angelo G, Barison A, Todiere G, et al. Myocardial T2 values at 1.5 T by a segmental approach with healthy aging and gender. Eur Radiol. (2022) doi: 10.1007/s00330-021-08396-6. [Epub ahead of print].
49. Foltz WD, Al-Kwifi O, Sussman MS, Stainsby JA, Wright GA. Optimized spiral imaging for measurement of myocardial T2 relaxation. Magn Reson Med. (2003) 49:1089–97. doi: 10.1002/mrm.10467
50. Huang TY, Liu YJ, Stemmer A, Poncelet BP. T2 measurement of the human myocardium using a T2-prepared transient-state TrueFISP sequence. Magn Reson Med. (2007) 57:960–6. doi: 10.1002/mrm.21208
51. Giri S, Chung YC, Merchant A, Mihai G, Rajagopalan S, Raman SV, et al. T2 quantification for improved detection of myocardial edema. J Cardiovasc Magn Reson. (2009) 11:56. doi: 10.1186/1532-429X-11-56
52. Wassmuth R, Prothmann M, Utz W, Dieringer M, von Knobelsdorff-Brenkenhoff F, Greiser A, et al. Variability and homogeneity of cardiovascular magnetic resonance myocardial T2-mapping in volunteers compared to patients with edema. J Cardiovasc Magn Reson. (2013) 15:27. doi: 10.1186/1532-429X-15-27
53. Mahrholdt H, Greulich S, Schulz-Menger J. “CMR in myocarditis.,” In: Schwitter J, editor. CMR Update, 3rd ed. Lausanne, Switzerland (2022).
54. Langhans B, Nadjiri J, Jähnichen C, Kastrati A, Martinoff S, Hadamitzky M. Reproducibility of area at risk assessment in acute myocardial infarction by T1- and T2-mapping sequences in cardiac magnetic resonance imaging in comparison to Tc99m-sestamibi SPECT. Int J Cardiovasc Imaging. (2014) 30:1357–63. doi: 10.1007/s10554-014-0467-z
55. Masci P-G, Pavon AG, Muller O, Iglesias J-F, Vincenti G, Monney P, et al. Relationship between CMR-derived parameters of ischemia/reperfusion injury and the timing of CMR after reperfused ST-segment elevation myocardial infarction. J Cardiovasc Magn Reson. (2018) 20:50. doi: 10.1186/s12968-018-0474-7
56. Galán-Arriola C, Lobo M, Vílchez-Tschischke JP, López GJ, de Molina-Iracheta A, Pérez-Martínez C, et al. Serial magnetic resonance imaging to identify early stages of anthracycline-induced cardiotoxicity. J Am Coll Cardiol. (2019) 73:779–91. doi: 10.1016/j.jacc.2018.11.046
57. Usman AA, Taimen K, Wasielewski M, McDonald J, Shah S, Giri S, et al. Cardiac magnetic resonance T2 mapping in the monitoring and follow-up of acute cardiac transplant rejection: a pilot study. Circ Cardiovasc Imaging. (2012) 5:782–90. doi: 10.1161/CIRCIMAGING.111.971101
58. Dorniak K, Stopczyńska I, Van Heeswijk RB, Zaczyńska-Buchowiecka M, Fijałkowska J, Glińska A, et al. Cardiac magnetic resonance imaging with T2 mapping for the monitoring of acute heart transplant rejection in patients with problematic endomyocardial biopsy: in anticipation of new recommendations. Kardiol Pol. (2021) 79:339–43. doi: 10.33963/KP.15852
59. Giri S, Shah S, Xue H, Chung Y-C, Pennell ML, Guehring J, et al. Myocardial T2 mapping with respiratory navigator and automatic nonrigid motion correction. Magn Reson Med. (2012) 68:1570–8. doi: 10.1002/mrm.24139
60. van Heeswijk RB, Feliciano H, Bongard C, Bonanno G, Coppo S, Lauriers N, et al. Free-breathing 3 T magnetic resonance T2-mapping of the heart. JACC Cardiovasc Imaging. (2012) 5:1231–9. doi: 10.1016/j.jcmg.2012.06.010
61. von Knobelsdorff-Brenkenhoff F, Prothmann M, Dieringer MA, Wassmuth R, Greiser A, Schwenke C, et al. Myocardial T1 and T2 mapping at 3 T: reference values, influencing factors and implications. J Cardiovasc Magn Reson. (2013) 15:53. doi: 10.1186/1532-429X-15-53
62. Darçot E, Yerly J, Colotti R, Masci PG, Chaptinel J, Feliciano H, et al. Accelerated and high-resolution cardiac T2 mapping through peripheral k-space sharing. Magn Reson Med. (2019) 81:220–33. doi: 10.1002/mrm.27374
63. Akcakaya M, Basha TA, Weingartner S, Roujol S, Berg S, Nezafat R. Improved quantitative myocardial T2 mapping: Impact of the fitting model. Magn Reson Med. (2015) 74:93–105. doi: 10.1002/mrm.25377
64. Bano W, Feliciano H, Coristine AJ, Stuber M, van Heeswijk RB. On the accuracy and precision of cardiac magnetic resonance T2 mapping: a high-resolution radial study using adiabatic T2 preparation at 3 T. Magn Reson Med. (2017) 77:159–69. doi: 10.1002/mrm.26107
65. Brittain JH, Hu BS, Wright GA, Meyer CH, Macovski A, Nishimura DG. Coronary angiography with magnetization-prepared T2 contrast. Magn Reson Med. (1995) 33:689–96. doi: 10.1002/mrm.1910330515
66. Nezafat R, Stuber M, Ouwerkerk R, Gharib AM, Desai MY, Pettigrew RI. B1-insensitive T2 preparation for improved coronary magnetic resonance angiography at 3 T. Magn Reson Med. (2006) 55:858–64. doi: 10.1002/mrm.20835
67. Coristine AJ, van Heeswijk RB, Stuber M. Fat signal suppression for coronary MRA at 3T using a water-selective adiabatic T2 -preparation technique. Magn Reson Med. (2014) 72:763–9. doi: 10.1002/mrm.24961
68. Arn L, van Heeswijk RB, Stuber M, Bastiaansen JAM. A robust broadband fat-suppressing phaser T2-preparation module for cardiac magnetic resonance imaging at 3T. Magn Reson Med. (2021) 86:1434–44. doi: 10.1002/mrm.28785
69. Mangia S, Liimatainen T, Garwood M, Michaeli S. Rotating frame relaxation during adiabatic pulses vs. conventional spin lock: simulations and experimental results at 4 T. Magn Reson Imaging. (2009) 27:1074–87. doi: 10.1016/j.mri.2009.05.023
70. Sprinkart AM, Luetkens JA, Träber F, Doerner J, Gieseke J, Schnackenburg B, et al. Gradient Spin Echo (GraSE) imaging for fast myocardial T2 mapping. J Cardiovasc Magn Reson. (2015) 17:12. doi: 10.1186/s12968-015-0127-z
71. Fernández-Jiménez R, Sánchez-González J, Aguero J, Del Trigo M, Galán-Arriola C, Fuster V, et al. Fast T2 gradient-spin-echo (T2-GraSE) mapping for myocardial edema quantification: first in vivo validation in a porcine model of ischemia/reperfusion. J Cardiovasc Magn Reson. (2015) 17:92. doi: 10.1186/s12968-015-0199-9
72. Baeßler B, Schaarschmidt F, Stehning C, Schnackenburg B, Maintz D, Bunck AC. Cardiac T2-mapping using a fast gradient echo spin echo sequence - first in vitro and in vivo experience. J Cardiovasc Magn Reson. (2015) 17:67. doi: 10.1186/s12968-015-0177-2
73. Baeßler B, Schaarschmidt F, Stehning C, Schnackenburg B, Maintz D, Bunck AC. A systematic evaluation of three different cardiac T2-mapping sequences at 15 and 3T in healthy volunteers. Eur J Radiol. (2015) 84:2161–70. doi: 10.1016/j.ejrad.2015.08.002
74. Amano Y, Yanagisawa F, Tachi M, Hashimoto H, Imai S, Kumita S. Myocardial T2 Mapping in patients with hypertrophic cardiomyopathy. J Comput Assist Tomogr. (2017) 41:344–8. doi: 10.1097/RCT.0000000000000521
75. Fehrmann A, Treutlein M, Rudolph T, Rudolph V, Weiss K, Giese D, et al. Myocardial T1 and T2 mapping in severe aortic stenosis: Potential novel insights into the pathophysiology of myocardial remodelling. Eur J Radiol. (2018) 107:76–83. doi: 10.1016/j.ejrad.2018.08.016
76. Baeßler B, Schaarschmidt F, Dick A, Stehning C, Schnackenburg B, Michels G, et al. Mapping tissue inhomogeneity in acute myocarditis: a novel analytical approach to quantitative myocardial edema imaging by T2-mapping. J Cardiovasc Magn Res. (2015) 17:115. doi: 10.1186/s12968-015-0217-y
77. van Heeswijk RB, Piccini D, Feliciano H, Hullin R, Schwitter J, Stuber M. Self-navigated isotropic three-dimensional cardiac T2 mapping. Magn Reson Med. (2015) 73:1549–54. doi: 10.1002/mrm.25258
78. Ding H, Fernandez-de-Manuel L, Schar M, Schuleri KH, Halperin H, He L, et al. Three-dimensional whole-heart T2 mapping at 3T. Magn Reson Med. (2015) 74:803–16. doi: 10.1002/mrm.25458
79. Yang H-J, Sharif B, Pang J, Kali A, Bi X, Cokic I, et al. Free-breathing, motion-corrected, highly efficient whole heart T2 mapping at 3T with hybrid radial-cartesian trajectory. Magn Reson Med. (2016) 75:126–36. doi: 10.1002/mrm.25576
80. van Heeswijk RB, Piccini D, Tozzi P, Rotman S, Meyer P, Schwitter J, et al. Three-dimensional self-navigated T2 mapping for the detection of acute cellular rejection after orthotopic heart transplantation. Transplant Direct. (2017) 3:e149. doi: 10.1097/TXD.0000000000000635
81. Bustin A, Hua A, Milotta G, Jaubert O, Hajhosseiny R, Ismail TF, et al. High-spatial-resolution 3D whole-heart MRI T2 mapping for assessment of myocarditis. Radiology. (2021) 298:578–86. doi: 10.1148/radiol.2021201630
82. Dorniak K, Di Sopra L, Sabisz A, Glinska A, Roy CW, Gorczewski K, et al. Respiratory motion-registered isotropic whole-heart T2 mapping in patients with acute non-ischemic myocardial injury. Front Cardiovasc Med. (2021) 8:712383. doi: 10.3389/fcvm.2021.712383
83. Triadyaksa P, Oudkerk M, Sijens PE. Cardiac mapping: techniques and clinical applications. J Magn Reson Imaging. (2020) 52:1340–51. doi: 10.1002/jmri.27023
84. Anderson L. Cardiovascular T2-star (T2*) magnetic resonance for the early diagnosis of myocardial iron overload. Eur Heart J. (2001) 22:2171–9. doi: 10.1053/euhj.2001.2822
85. Westwood M, Anderson LJ, Firmin DN, Gatehouse PD, Charrier CC, Wonke B, et al. single breath-hold multiecho T2* cardiovascular magnetic resonance technique for diagnosis of myocardial iron overload. J Magn Reson Imaging. (2003) 18:33–9. doi: 10.1002/jmri.10332
86. He T, Gatehouse PD, Smith GC, Mohiaddin RH, Pennell DJ, Firmin DN. Myocardial T2* measurements in iron overloaded thalassemia. Magn Reson Med. (2008) 60:1082–9. doi: 10.1002/mrm.21744
87. Kellman P, Xue H, Spottiswoode BS, Sandino CM, Hansen MS, Abdel-Gadir A, et al. Free-breathing T2* mapping using respiratory motion corrected averaging. J Cardiovasc Magn Reson. (2015) 17:3. doi: 10.1186/s12968-014-0106-9
88. Carpenter J-P, He T, Kirk P, Roughton M, Anderson LJ, de Noronha SV, et al. On T2* magnetic resonance and cardiac iron. Circulation. (2011) 123:1519–28. doi: 10.1161/CIRCULATIONAHA.110.007641
89. Carpenter J-P, Roughton M, Pennell DJ. The myocardial iron in thalassemia (MINT) Investigators. International survey of T2* cardiovascular magnetic resonance in -thalassemia major. Haematologica. (2013) 98:1368–74. doi: 10.3324/haematol.2013.083634
90. Modell B, Khan M, Darlison M, Westwood MA, Ingram D, Pennell DJ. Improved survival of thalassaemia major in the UK and relation to T2* cardiovascular magnetic resonance. J Cardiovasc Magn Reson. (2008) 10:42. doi: 10.1186/1532-429X-10-42
91. Kirk P, He T, Anderson LJ, Roughton M, Tanner MA, Lam WWM, et al. International reproducibility of single breathhold T2* MR for cardiac and liver iron assessment among five thalassemia centers. J Magn Reson Imaging. (2010) 32:315–9. doi: 10.1002/jmri.22245
92. Zia MI, Ghugre NR, Connelly KA, Strauss BH, Sparkes JD, Dick AJ, et al. Characterizing myocardial edema and hemorrhage using quantitative T2 and T2* mapping at multiple time intervals post ST-segment elevation myocardial infarction. Circ Cardiovasc Imaging. (2012) 5:566–72. doi: 10.1161/CIRCIMAGING.112.973222
93. Chen Y, Ren D, Guan X, Yang H-J, Liu T, Tang R, et al. Quantification of myocardial hemorrhage using T2* cardiovascular magnetic resonance at 15T with ex-vivo validation. J Cardiovasc Magn Res. (2021) 23:104. doi: 10.1186/s12968-021-00779-4
94. Bustin A, Toupin S, Sridi S, Yerly J, Bernus O, Labrousse L, et al. Endogenous assessment of myocardial injury with single-shot model-based non-rigid motion-corrected T1 rho mapping. J Cardiovasc Magn Reson. (2021) 23:119. doi: 10.1186/s12968-021-00781-w
95. Musthafa H-SN, Dragneva G, Lottonen L, Merentie M, Petrov L, Heikura T, et al. Longitudinal rotating frame relaxation time measurements in infarcted mouse myocardium in vivo. Magn Reson Med. (2013) 69:1389–95. doi: 10.1002/mrm.24382
96. Witschey WR, Zsido GA, Koomalsingh K, Kondo N, Minakawa M, Shuto T, et al. In vivo chronic myocardial infarction characterization by spin locked cardiovascular magnetic resonance. J Cardiovasc Magn Reson. (2012) 14:37. doi: 10.1186/1532-429X-14-37
97. Witschey WRT, Pilla JJ, Ferrari G, Koomalsingh K, Haris M, Hinmon R, et al. Rotating frame spin lattice relaxation in a swine model of chronic, left ventricular myocardial infarction. Magn Reson Med. (2010) 64:1453–60. doi: 10.1002/mrm.22543
98. Yin Q, Abendschein D, Muccigrosso D, O'Connor R, Goldstein T, Chen R, et al. Non-contrast CMR index for assessing myocardial fibrosis. Magn Reson Imaging. (2017) 42:69–73. doi: 10.1016/j.mri.2017.04.012
99. Zhang Y, Zeng W, Chen W, Chen Y, Zhu T, Sun J, et al. MR extracellular volume mapping and non-contrast T1ρ mapping allow early detection of myocardial fibrosis in diabetic monkeys. Eur Radiol. (2019) 29:3006–16. doi: 10.1007/s00330-018-5950-9
100. van Oorschot JW, El Aidi H, Jansen Jansen of Lorkeers SJ, Gho JM, Froeling M, Visser F. Endogenous assessment of chronic myocardial infarction with T1ρ-mapping in patients. J Cardiovasc Magn Reson. (2014) 16:104. doi: 10.1186/s12968-014-0104-y
101. Wang C, Zheng J, Sun J, Wang Y, Xia R, Yin Q, et al. Endogenous contrast T1rho cardiac magnetic resonance for myocardial fibrosis in hypertrophic cardiomyopathy patients. J Cardiol. (2015) 66:520–6. doi: 10.1016/j.jjcc.2015.03.005
102. Thompson EW, Kamesh Iyer S, Solomon MP Li Z, Zhang Q, Piechnik S, Werys K, et al. Endogenous T1ρ cardiovascular magnetic resonance in hypertrophic cardiomyopathy. J Cardiovasc Magn Reson. (2021) 23:120. doi: 10.1186/s12968-021-00813-5
103. van Oorschot JWM, Güçlü F, de Jong S, Chamuleau SAJ, Luijten PR, Leiner T, et al. Endogenous assessment of diffuse myocardial fibrosis in patients with T 1ρ -mapping. J Magn Reson Imaging. (2017) 45:132–8. doi: 10.1002/jmri.25340
104. Wang L, Yuan J, Zhang S-J, Gao M, Wang Y-C, Wang Y-X, et al. Myocardial T1 rho mapping of patients with end-stage renal disease and its comparison with T1 mapping and T2 mapping: a feasibility and reproducibility study. J Magn Reson Imaging. (2016) 44:723–31. doi: 10.1002/jmri.25188
105. Jaubert O, Cruz G, Bustin A, Schneider T, Koken P, Doneva M, et al. Free-running cardiac magnetic resonance fingerprinting: Joint T1/T2 map and Cine imaging. Magn Reson Imaging. (2020) 68:173–82. doi: 10.1016/j.mri.2020.02.005
106. Jaubert O, Cruz G, Bustin A, Hajhosseiny R, Nazir S, Schneider T, et al. T1, T2, and fat fraction cardiac MR fingerprinting: preliminary clinical evaluation. J Magn Reson Imaging. (2021) 53:1253–65. doi: 10.1002/jmri.27415
107. Christodoulou AG, Shaw JL, Nguyen C, Yang Q, Xie Y, Wang N, et al. Magnetic resonance multitasking for motion-resolved quantitative cardiovascular imaging. Nat Biomed Eng. (2018) 2:215–26. doi: 10.1038/s41551-018-0217-y
108. Hamilton JI, Jiang Y, Ma D, Chen Y, Lo W-C, Griswold M, et al. Simultaneous multislice cardiac magnetic resonance fingerprinting using low rank reconstruction. NMR Biomed. (2019) 32:e4041. doi: 10.1002/nbm.4041
109. Akçakaya M, Weingärtner S, Basha TA, Roujol S, Bellm S, Nezafat R. Joint myocardial T1 and T2 mapping using a combination of saturation recovery and T2-preparation. Magn Reson Med. (2016) 76:888–96. doi: 10.1002/mrm.25975
110. Milotta G, Bustin A, Jaubert O, Neji R, Prieto C, Botnar RM. 3D whole-heart isotropic-resolution motion-compensated joint T1 /T2 mapping and water/fat imaging. Magn Reson Med. (2020) 84:3009–26. doi: 10.1002/mrm.28330
111. Nezafat M, El-Rewaidy H, Kucukseymen S, Hauser TH, Fahmy AS. Deep convolution neural networks based artifact suppression in under-sampled radial acquisitions of myocardial T1 mapping images. Phys Med Biol. (2020) 65:225024. doi: 10.1088/1361-6560/abc04f
112. Guo R, El-Rewaidy H, Assana S, Cai X, Amyar A, Chow K, et al. Accelerated cardiac T1 mapping in four heartbeats with inline MyoMapNet: a deep learning-based T1 estimation approach. J Cardiovasc Magn Reson. (2022) 24:6. doi: 10.1186/s12968-021-00834-0
113. Gillies RJ, Kinahan PE, Hricak H. Radiomics: images are more than pictures, they are data. Radiology. (2016) 278:563–77. doi: 10.1148/radiol.2015151169
114. Ma Q, Ma Y, Yu T, Sun Z, Hou Y. Radiomics of non-contrast-enhanced T1 mapping: diagnostic and predictive performance for myocardial injury in acute ST-segment-elevation myocardial infarction. Korean J Radiol. (2021) 22:535–46. doi: 10.3348/kjr.2019.0969
115. Antonopoulos AS, Boutsikou M, Simantiris S, Angelopoulos A, Lazaros G, Panagiotopoulos I, et al. Machine learning of native T1 mapping radiomics for classification of hypertrophic cardiomyopathy phenotypes. Sci Rep. (2021) 11:23596. doi: 10.1038/s41598-021-02971-z
116. Raisi-Estabragh Z, Gkontra P, Jaggi A, Cooper J, Augusto J, Bhuva AN, et al. Repeatability of cardiac magnetic resonance radiomics: a multi-centre multi-vendor test-retest study. Front Cardiovasc Med. (2020) 7:586236. doi: 10.3389/fcvm.2020.586236
117. Ma D, Coppo S, Chen Y, McGivney DF, Jiang Y, Pahwa S, et al. Slice profile and B1 corrections in 2D magnetic resonance fingerprinting. Magn Reson Med. (2017) 78:1781–9. doi: 10.1002/mrm.26580
118. Buonincontri G, Sawiak SJMR. Fingerprinting with simultaneous B1 estimation. Magn Reson Med. (2016) 76:1127–35. doi: 10.1002/mrm.26009
119. Serry FM, Ma S, Mao X, Han F, Xie Y, Han H, et al. Dual flip-angle IR-FLASH with spin history mapping for B1+ corrected T1 mapping: application to T1 cardiovascular magnetic resonance multitasking. Magn Reson Med. (2021) 86:3182–91. doi: 10.1002/mrm.28935
120. Assländer J, Glaser SJ, Hennig J. Pseudo steady-state free precession for MR-fingerprinting. Magn Reson Med. (2017) 77:1151–61. doi: 10.1002/mrm.26202
121. Hilbert T, Xia D, Block KT, Yu Z, Lattanzi R, Sodickson DK, et al. Magnetization transfer in magnetic resonance fingerprinting. Magn Reson Med. (2020) 84:128–41. doi: 10.1002/mrm.28096
122. Tang S, Fernandez-Granda C, Lannuzel S, Bernstein B, Lattanzi R, Cloos M, et al. Multicompartment magnetic resonance fingerprinting. Inverse Probl. (2018) 34:094005. doi: 10.1088/1361-6420/aad1c3
123. Cerqueira MD, Weissman NJ, Dilsizian V, Jacobs AK, Kaul S, Laskey WK, et al. Standardized myocardial segmentation and nomenclature for tomographic imaging of the heart. Circulation. (2002) 105:539–42. doi: 10.1161/hc0402.102975
124. Kellman P, Wilson JR, Xue H, Ugander M, Arai AE. Extracellular volume fraction mapping in the myocardium, part 1: evaluation of an automated method. J Cardiovasc Magn Reson. (2012) 14:63. doi: 10.1186/1532-429X-14-63
125. Chen C, Qin C, Qiu H, Tarroni G, Duan J, Bai W, et al. Deep learning for cardiac image segmentation: a review. Front Cardiovasc Med. (2020) 7:25. doi: 10.3389/fcvm.2020.00025
126. El-Rewaidy H, Nezafat M, Jang J, Nakamori S, Fahmy AS, Nezafat R. Nonrigid active shape model-based registration framework for motion correction of cardiac T1 mapping: ASM-based registration for cardiac T1 mapping. Magn Reson Med. (2018) 80:780–91. doi: 10.1002/mrm.27068
127. Fahmy AS, El-Rewaidy H, Nezafat M, Nakamori S, Nezafat R. Automated analysis of cardiovascular magnetic resonance myocardial native T1 mapping images using fully convolutional neural networks. J Cardiovasc Magn Reson. (2019) 21:7. doi: 10.1186/s12968-018-0516-1
128. Farrag NA, Lochbihler A, White JA, Ukwatta E. Evaluation of fully automated myocardial segmentation techniques in native and contrast-enhanced T1-mapping cardiovascular magnetic resonance images using fully convolutional neural networks. Med Phys. (2021) 48:215–26. doi: 10.1002/mp.14574
129. Puyol-Antón E, Ruijsink B, Baumgartner CF, Masci P-G, Sinclair M, Konukoglu E, et al. Automated quantification of myocardial tissue characteristics from native T1 mapping using neural networks with uncertainty-based quality-control. J Cardiovasc Magn Reson. (2020) 22:60. doi: 10.1186/s12968-020-00650-y
130. Zhu Y, Fahmy AS, Duan C, Nakamori S, Nezafat R. Automated myocardial T2 and extracellular volume quantification in cardiac MRI using transfer learning–based myocardium segmentation. Radiol Artif Intell. (2020) 2:e190034. doi: 10.1148/ryai.2019190034
131. Keenan KE, Delfino JG, Jordanova KV, Poorman ME, Chirra P, Chaudhari AS, et al. Challenges in ensuring the generalizability of image quantitation methods for MRI. Med Phys. (2022) 49:2820–355. doi: 10.1002/mp.15195
Keywords: relaxation times, cardiovascular magnetic resonance (CMR), review, reproducibility, heart, quantitative MRI (qMRI), parametric mapping
Citation: Ogier AC, Bustin A, Cochet H, Schwitter J and van Heeswijk RB (2022) The Road Toward Reproducibility of Parametric Mapping of the Heart: A Technical Review. Front. Cardiovasc. Med. 9:876475. doi: 10.3389/fcvm.2022.876475
Received: 15 February 2022; Accepted: 11 April 2022;
Published: 06 May 2022.
Edited by:
Michael Schär, Johns Hopkins University, United StatesReviewed by:
Ahmed S. Fahmy, Harvard Medical School, United StatesSrikant Kamesh Iyer, Canon Medical Research Institute USA, Inc, United States
Copyright © 2022 Ogier, Bustin, Cochet, Schwitter and van Heeswijk. This is an open-access article distributed under the terms of the Creative Commons Attribution License (CC BY). The use, distribution or reproduction in other forums is permitted, provided the original author(s) and the copyright owner(s) are credited and that the original publication in this journal is cited, in accordance with accepted academic practice. No use, distribution or reproduction is permitted which does not comply with these terms.
*Correspondence: Ruud B. van Heeswijk, cnV1ZC5tcmlAZ21haWwuY29t