 Yingbei Weng†
 Yangpei Peng
 Huaqiang Xiang
 Kangting Ji
- Department of Cardiology, The Second Affiliated Hospital and Yuying Children’s Hospital of Wenzhou Medical University, Wenzhou, China
Objectives: The purpose of this study was to investigate the independent effect of the ratio of red blood cell distribution width (RDW) to albumin (RA) on all-cause mortality in patients after percutaneous coronary intervention (PCI).
Methods: Clinical data were obtained from the Multiparameter Intelligent Monitoring in Intensive Care-III (MIMIC-III) database version 1.4 and the database of Second Affiliated Hospital and Yuying Children’s Hospital of Wenzhou Medical University. We used the MIMIC-III database for model training, and data collected from the Second Affiliated Hospital of Wenzhou Medical University for validation. The primary outcome of our study was 90-day mortality. Cox proportional hazards regression model was used to estimate hazard ratio (HR) for the association between RA and all-cause mortality in patients after PCI. Pearson correlation analysis was conducted to assess the relationship between RA and Gensini score or cardiac troponin I (cTnI).
Results: A total of 707 patients were eligible in MIMIC-III database, including 432 males, with a mean age of 70.29 years. For 90-day all-cause mortality, in the adjusted multivariable model, the adjusted HRs [95% confidence intervals (CIs)] for the second (RA: 3.7–4.5 ml/g) and third (RA >4.5 ml/g) tertiles were 2.27 (1.11, 4.64) and 3.67 (1.82, 7.40), respectively, compared to the reference group (RA <3.7 ml/g) (p < 0.05). A similar relationship was also observed for 30-day all-cause mortality and 1-year all-cause mortality. No significant interaction was observed in subgroup analysis. Receiver operating characteristic (ROC) curve analysis proved that the ability of RA to predict the 90-day mortality was better than that of RDW or albumin alone. The correlation coefficient between Gensini score and RA was 0.254, and that between cTnI and RA was 0.323.
Conclusion: RA is an independent risk factor for all-cause mortality in patients after PCI. The higher the RA, the higher the mortality. RA has a good predictive ability for all-cause mortality in patients after PCI, which is better than RDW or albumin alone. RA may be positively correlated with the severity of coronary artery disease (CAD) in patients with CAD.
Introduction
Coronary artery disease (CAD) is an atherosclerotic disease dominated by inflammation (1, 2). CAD was reported to be one of the most common causes of death in developed and developing countries (3, 4). It is estimated that 18.2 million Americans aged 20 years or older suffered from CAD between 2013 and 2016, and the total CAD prevalence was about 6.7%, representing a substantial increase compared to previous years. According to 2017 United States mortality data, 365,914 Americans succumbed to CAD (5). Percutaneous coronary intervention (PCI) has already been one of the most commonly used interventions for CAD (6). Although reasonable and timely PCI can improve the prognosis of CAD patients, CAD still has a high rate of disability and mortality. Therefore, this calls for effective and convenient prognostic biomarkers that can help doctors to make medical decisions and identify high-risk patients.
Atherosclerotic lesions can be described as an inflammatory disease characterized by a series of highly specific cellular and molecular responses (1, 7–10). Red blood cell distribution width (RDW) is one of the parameters measured in blood routine testing. As an easily accessible marker of systemic inflammation, RDW has been identified as a new prognostic factor for many diseases, including cardio-cerebrovascular diseases and various infectious diseases (11). Moreover, a low serum albumin level is strongly negatively correlated with the risk of death from cardiovascular diseases (12). Recent studies have shown that the ratio of RDW to albumin (RA) is associated with the prognosis of a variety of diseases, including aortic aneurysm, diabetic retinopathy, and shock (13–15). However, it is unknown whether combining RDW with albumin can more effectively predict the prognosis of patients after PCI.
In this study, real world data were used to assess the association between RA and outcome of patients after PCI.
Materials and Methods
Study Population
All data were obtained from the databases of Multiparameter Intelligent Monitoring in Intensive Care (MIMIC-III) and our hospital (the Second Affiliated Hospital of Wenzhou Medical University).
MIMIC-III database version 1.4 is a large single-centered database containing the data of more than 50,000 adult patients admitted to the intensive care unit (ICU) in different hospitals. MIMIC-III database was approved by the Institutional Review Boards of the Beth Israel Deaconess Medical Center and the Massachusetts Institute of Technology.
With regard to the data obtained from our hospital, the Institute of Institutional Research and Ethics of the Second Affiliated Hospital of Wenzhou Medical University approved the experiments involving human subjects. The ethical review approval number is 2021-K-71-01. Informed consent was not required as the data were anonymous.
Subjects to be included had to meet the following criteria: (1) patients after PCI; patient records with PCI treatment were retrieved from the MIMIC-III database using Structured Query Language (SQL). In our hospital, we enroll patients by reviewing their coronary angiography records and surgical records; (2) adult patients (age ≥18 years). The exclusion criteria were as follows: (1) more than 10% of the patient’s individual data is missing; (2) when there are outliers in patient data: the value exceeds mean ± 3 standard deviation (SD); (3) RDW or albumin data are missing. The first ICU admission records were used when patients had multiple hospitalizations.
RA Assessment
Blood samples were collected from subjects within 24 h after admission to the ICU. RDW and albumin were measured by medical instruments. RDW was expressed as percent (%) and albumin was expressed as g/dl. RA was calculated as the ratio of RDW to albumin.
Assessment of Other Covariates
Structured query language was used to extract the data recorded on the first day of admission from the database, including demographic data, basic vital signs, comorbidities, basic laboratory parameters, and pre-treatment scoring systems. Demographic information included race, gender, and age. Basic vital signs included blood pressure, respiratory rate, heart rate, body temperature, and saturation of pulse oxygen (SpO2). Complications included hypertension, arrhythmia, heart valve disease, congestive heart failure, pulmonary circulation disorders, chronic pulmonary disease, peripheral vascular disease, coagulopathy, electrolyte disorder, nervous system diseases, hypothyroidism, and obesity. Laboratory parameters included RDW, albumin, hemoglobin, hematocrit, platelet, white blood cell count, creatinine, urea nitrogen, chloride, sodium, bicarbonate, and anion gap. In addition, simplified acute physiology score II (SAPSII) and acute physiology score III (APSIII) were included. During variable selection, variables with missing values ≥40% were directly excluded.
Furthermore, Gensini score and cardiac troponin I (cTnI) were additionally extracted from the database of our hospital. The Gensini score was used to assess the severity of coronary artery stenosis, as shown in Supplementary Table 1. The Gensini score was the sum of individual coronary segment scores (16), separately defined by two independent doctors.
Outcomes
In this study, the primary outcomes were 90-day mortality, while the secondary outcomes were 30-day mortality, 1-year mortality, length of stay in ICU, and length of hospital stay. The observation time was from the patient’s first admission at the hospital until death.
Statistical Analyses
The included patients were divided into three groups according to the RA level, and their baseline characteristics were described. Smooth curve fitting and Kaplan–Meier curves were generated. Cox proportional hazard regression was used to evaluate the association between all-cause mortality and RA, and the results were shown as a hazard ratio (HR) with a 95% confidence interval (CI) (17). Three multivariate analysis models were established for each outcome. In model 1, the covariates were not adjusted; in model 2, the adjusted covariates included race, gender, and age; and in model 3, we further adjusted for SpO2, respiratory rate, heart rate, diastolic blood pressure, temperature, congestive heart failure, heart valve disease, nervous system diseases, pulmonary circulation disorders, hypertension, chronic pulmonary disease, hypothyroidism, obesity, coagulopathy, white blood cell count, serum chloride, bicarbonate, platelet, hematocrit, and anion gap. The choice of covariates was based on the estimated value of impact >10% (18), and the low RA level group (RA <3.7 ml/g) was set as the reference group. Subgroup analysis was used to determine the influence of RA on 90-day all-cause mortality in different subgroups. Receiver operating characteristic (ROC) curve analysis was performed to predict the prognostic efficiency of the RA. Moreover, we compared the RA with other prognostic indicators to verify the superiority of RA in predicting the prognosis of such patients. The RA value was analyzed by Pearson correlation analysis using Gensini score and cTnI, respectively.
All analyses were conducted using R software (Version 3.6.11). All p-values were two-sided, and p < 0.05 was considered statistically significant.
Results
Characteristics of Patients
In total, 707 patients were included (Figure 1). Table 1 shows the baseline characteristics of patients grouped by RA level. As seen in the table, the higher RA group was older, had lower blood pressure, faster heart rate, higher SAPSII and APSIII scores (p < 0.001), and a higher chance of complications, including congestive heart failure, heart valve disease, electrolyte disorder, peripheral vascular disease, coagulopathy, and chronic pulmonary disease (all p < 0.01), compared to the lower group. They also had higher levels of RDW, serum creatinine, serum urea nitrogen, and anion gap, as well as lower levels of albumin, platelet, hemoglobin, hematocrit, serum sodium, and bicarbonate (all p < 0.05). As shown in the table, the higher RA group had higher all-cause mortality, longer ICU stay, and shorter overall survival (p < 0.001). Moreover, the baseline characteristics of patients grouped by 90-day all-cause mortality are shown in Supplementary Table 2. In addition, Supplementary Table 3 shows the baseline characteristics of patients in the cohort of our hospital. The higher RA group was older, had a faster heart rate, and had a higher risk of congestive heart failure, arrhythmia, and cardiogenic shock. In addition, the higher the RA, the higher the Gensini score and the longer the length of hospital stay.
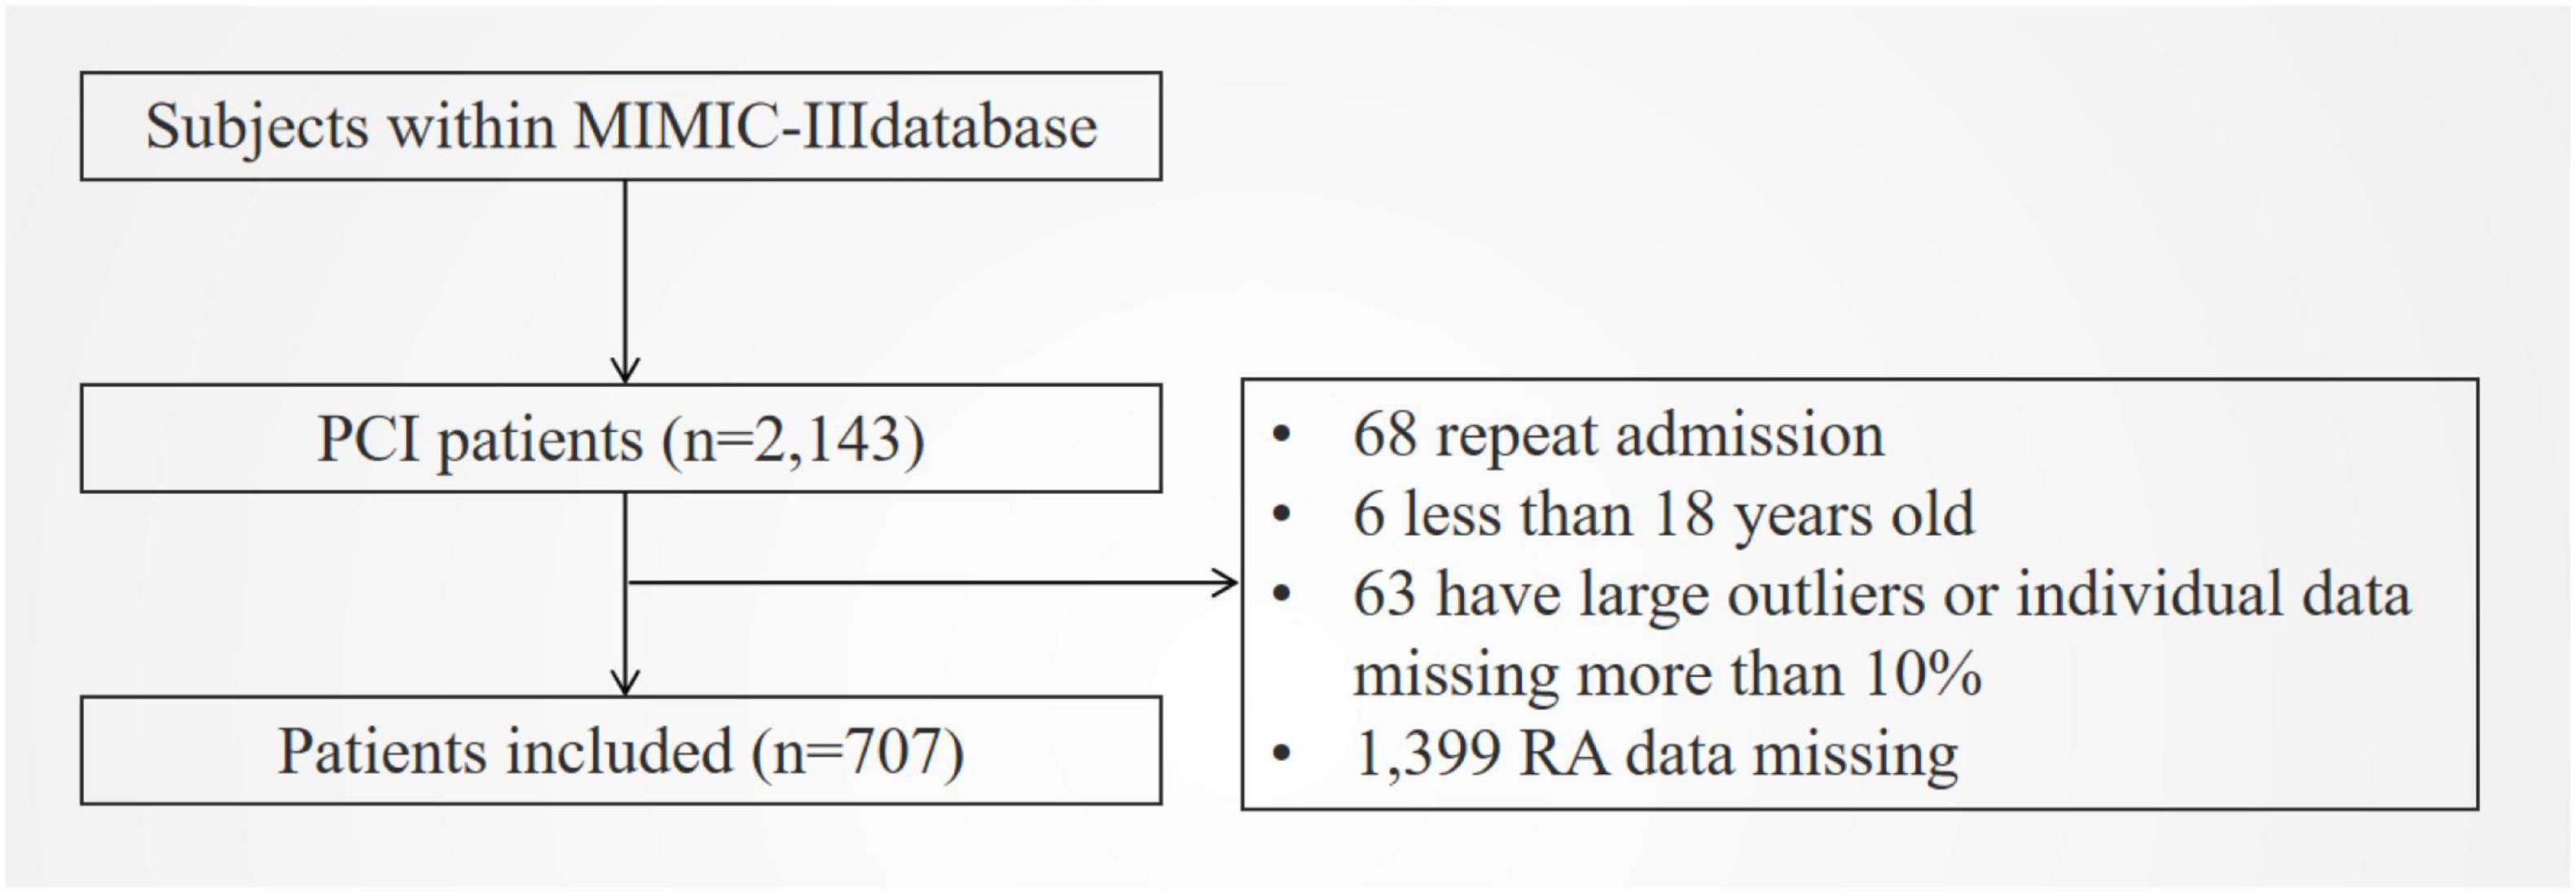
Figure 1. Flowchart of included patients. MIMIC III, Multiparameter Intelligent Monitoring in Intensive Care Database III; PCI, percutaneous coronary intervention; RA, the ratio of red cell volume distribution width to albumin.
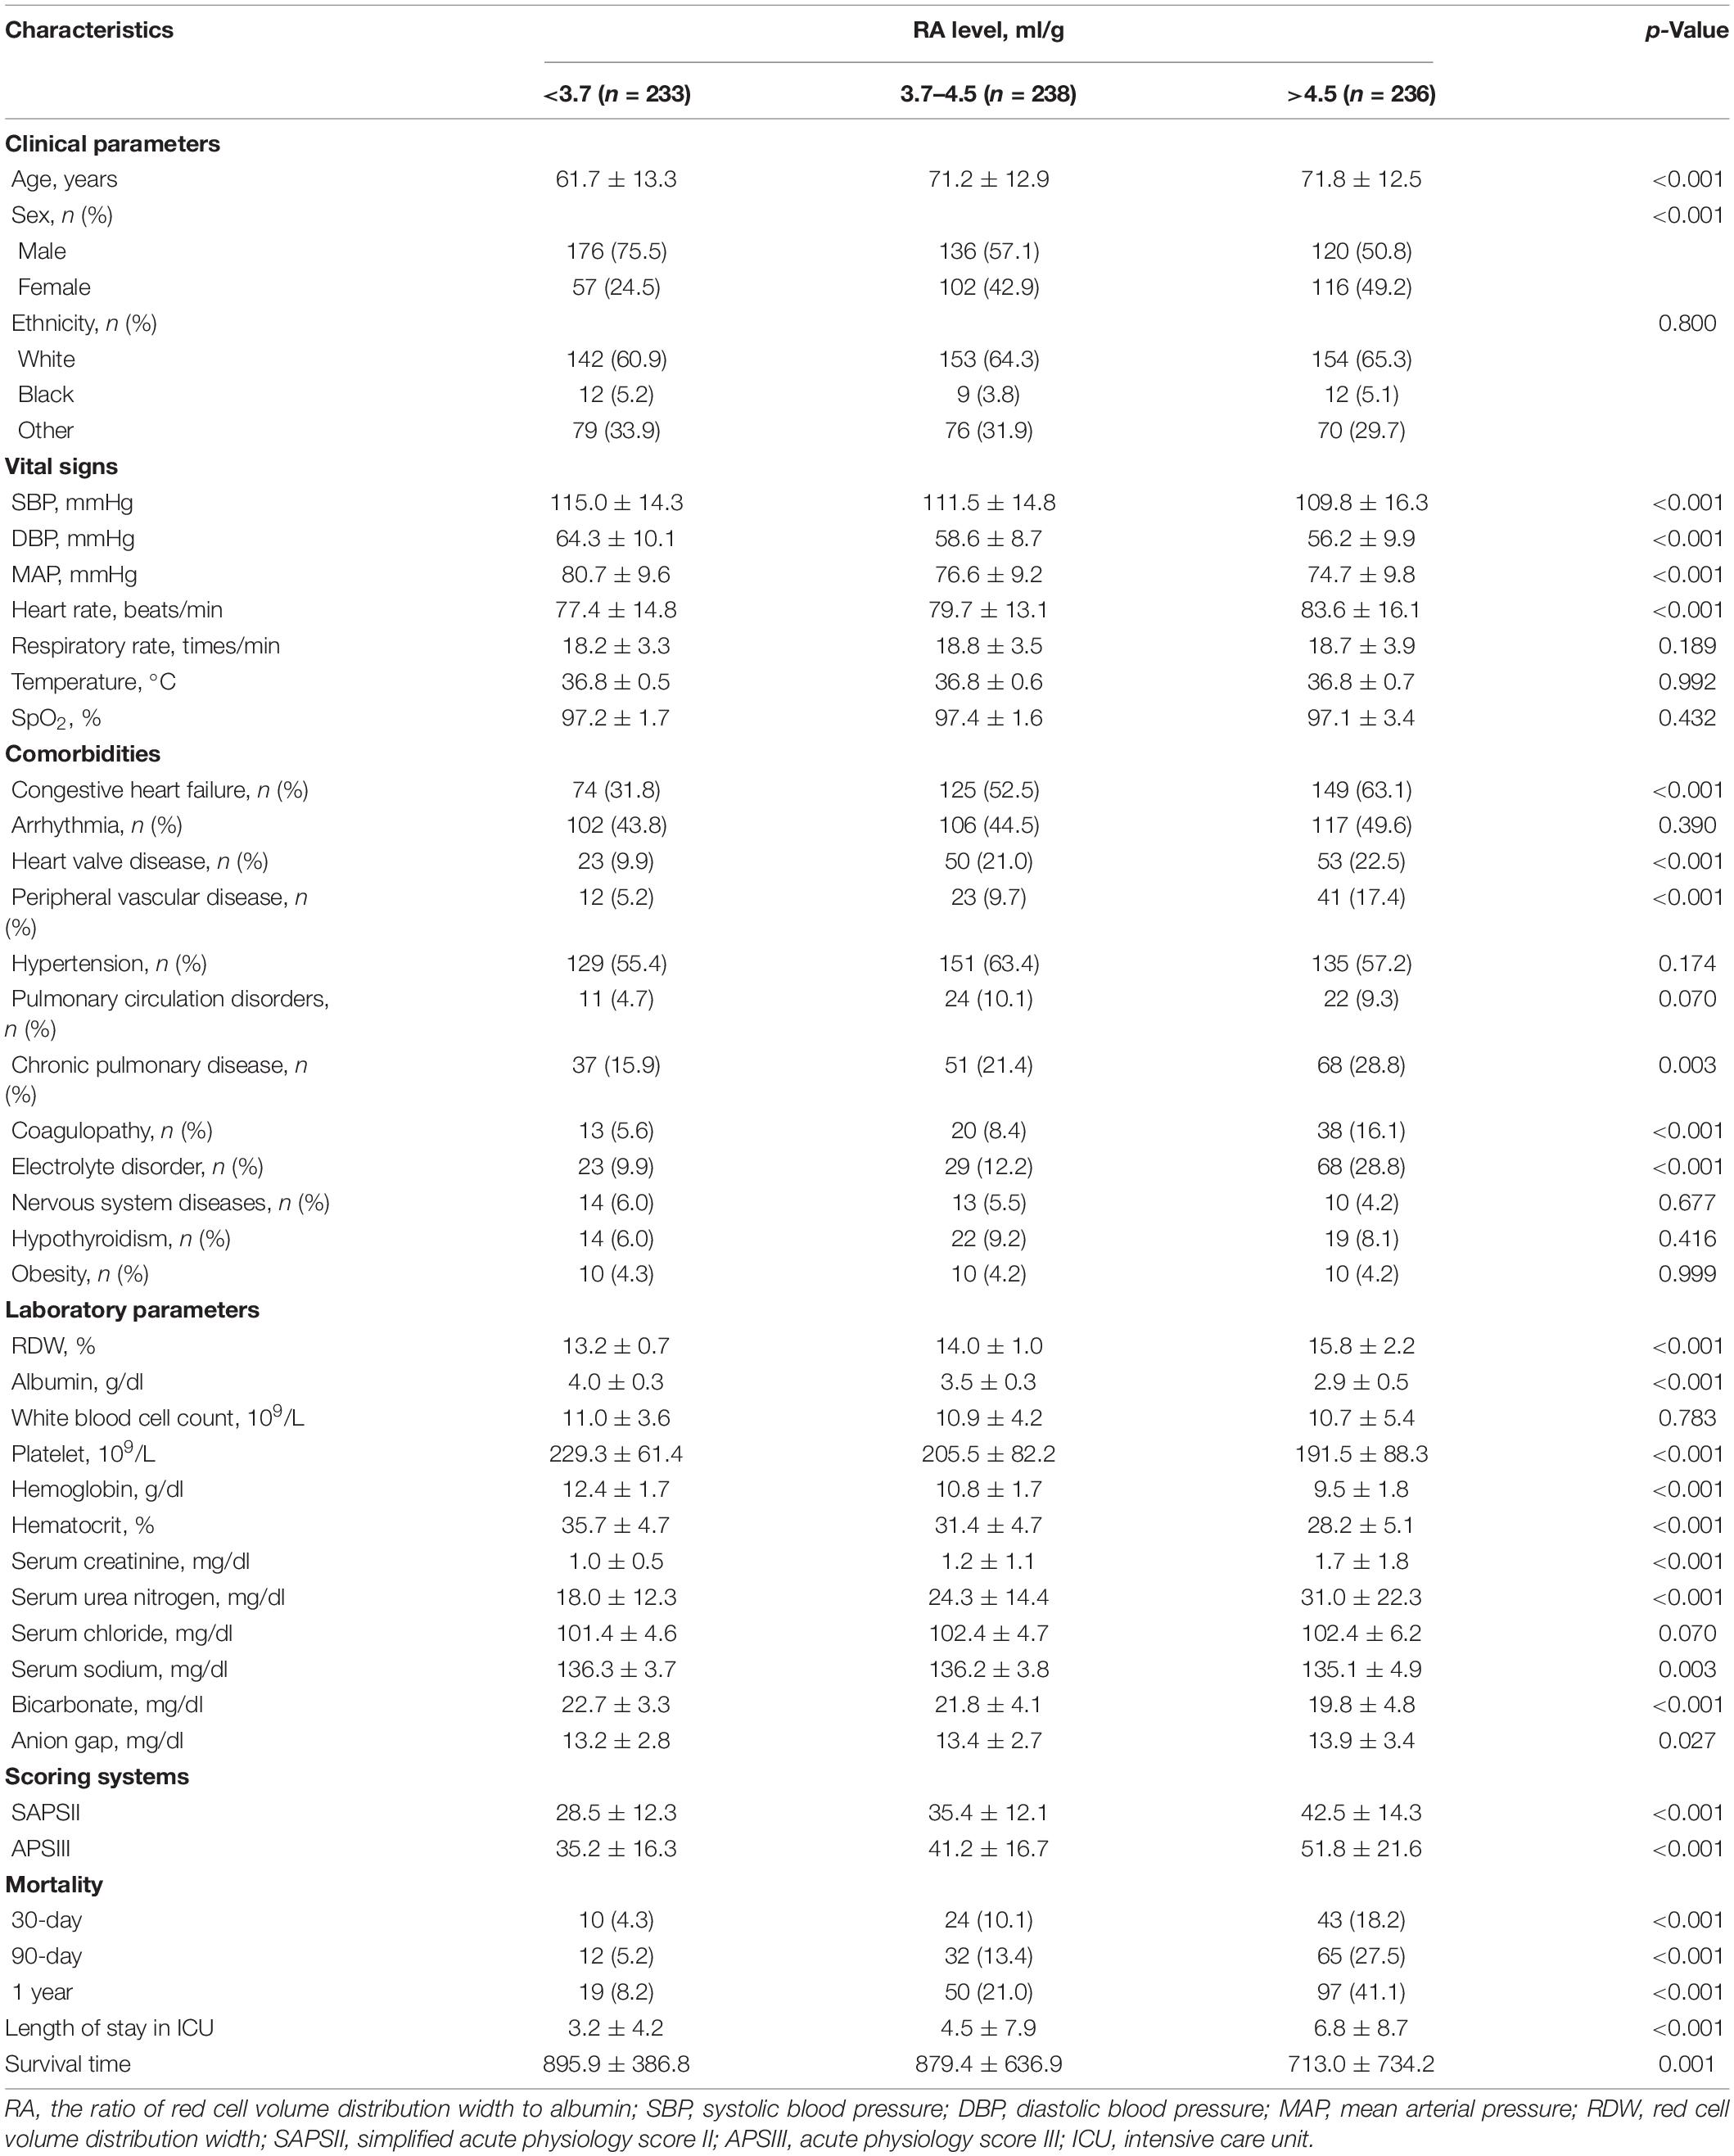
Table 1. Baseline characteristics of the study population.
Association Between RA and Outcomes
To demonstrate linearity of RA and 90-day all-cause mortality of patients after PCI, smooth curve fitting was performed (Figure 2). After adjusting for possible covariates, the linear relationship was observed. In addition, smooth curve fitting was also performed for 30-day and 1-year all-cause mortality and the same relationship was observed (Supplementary Figures 1, 2).
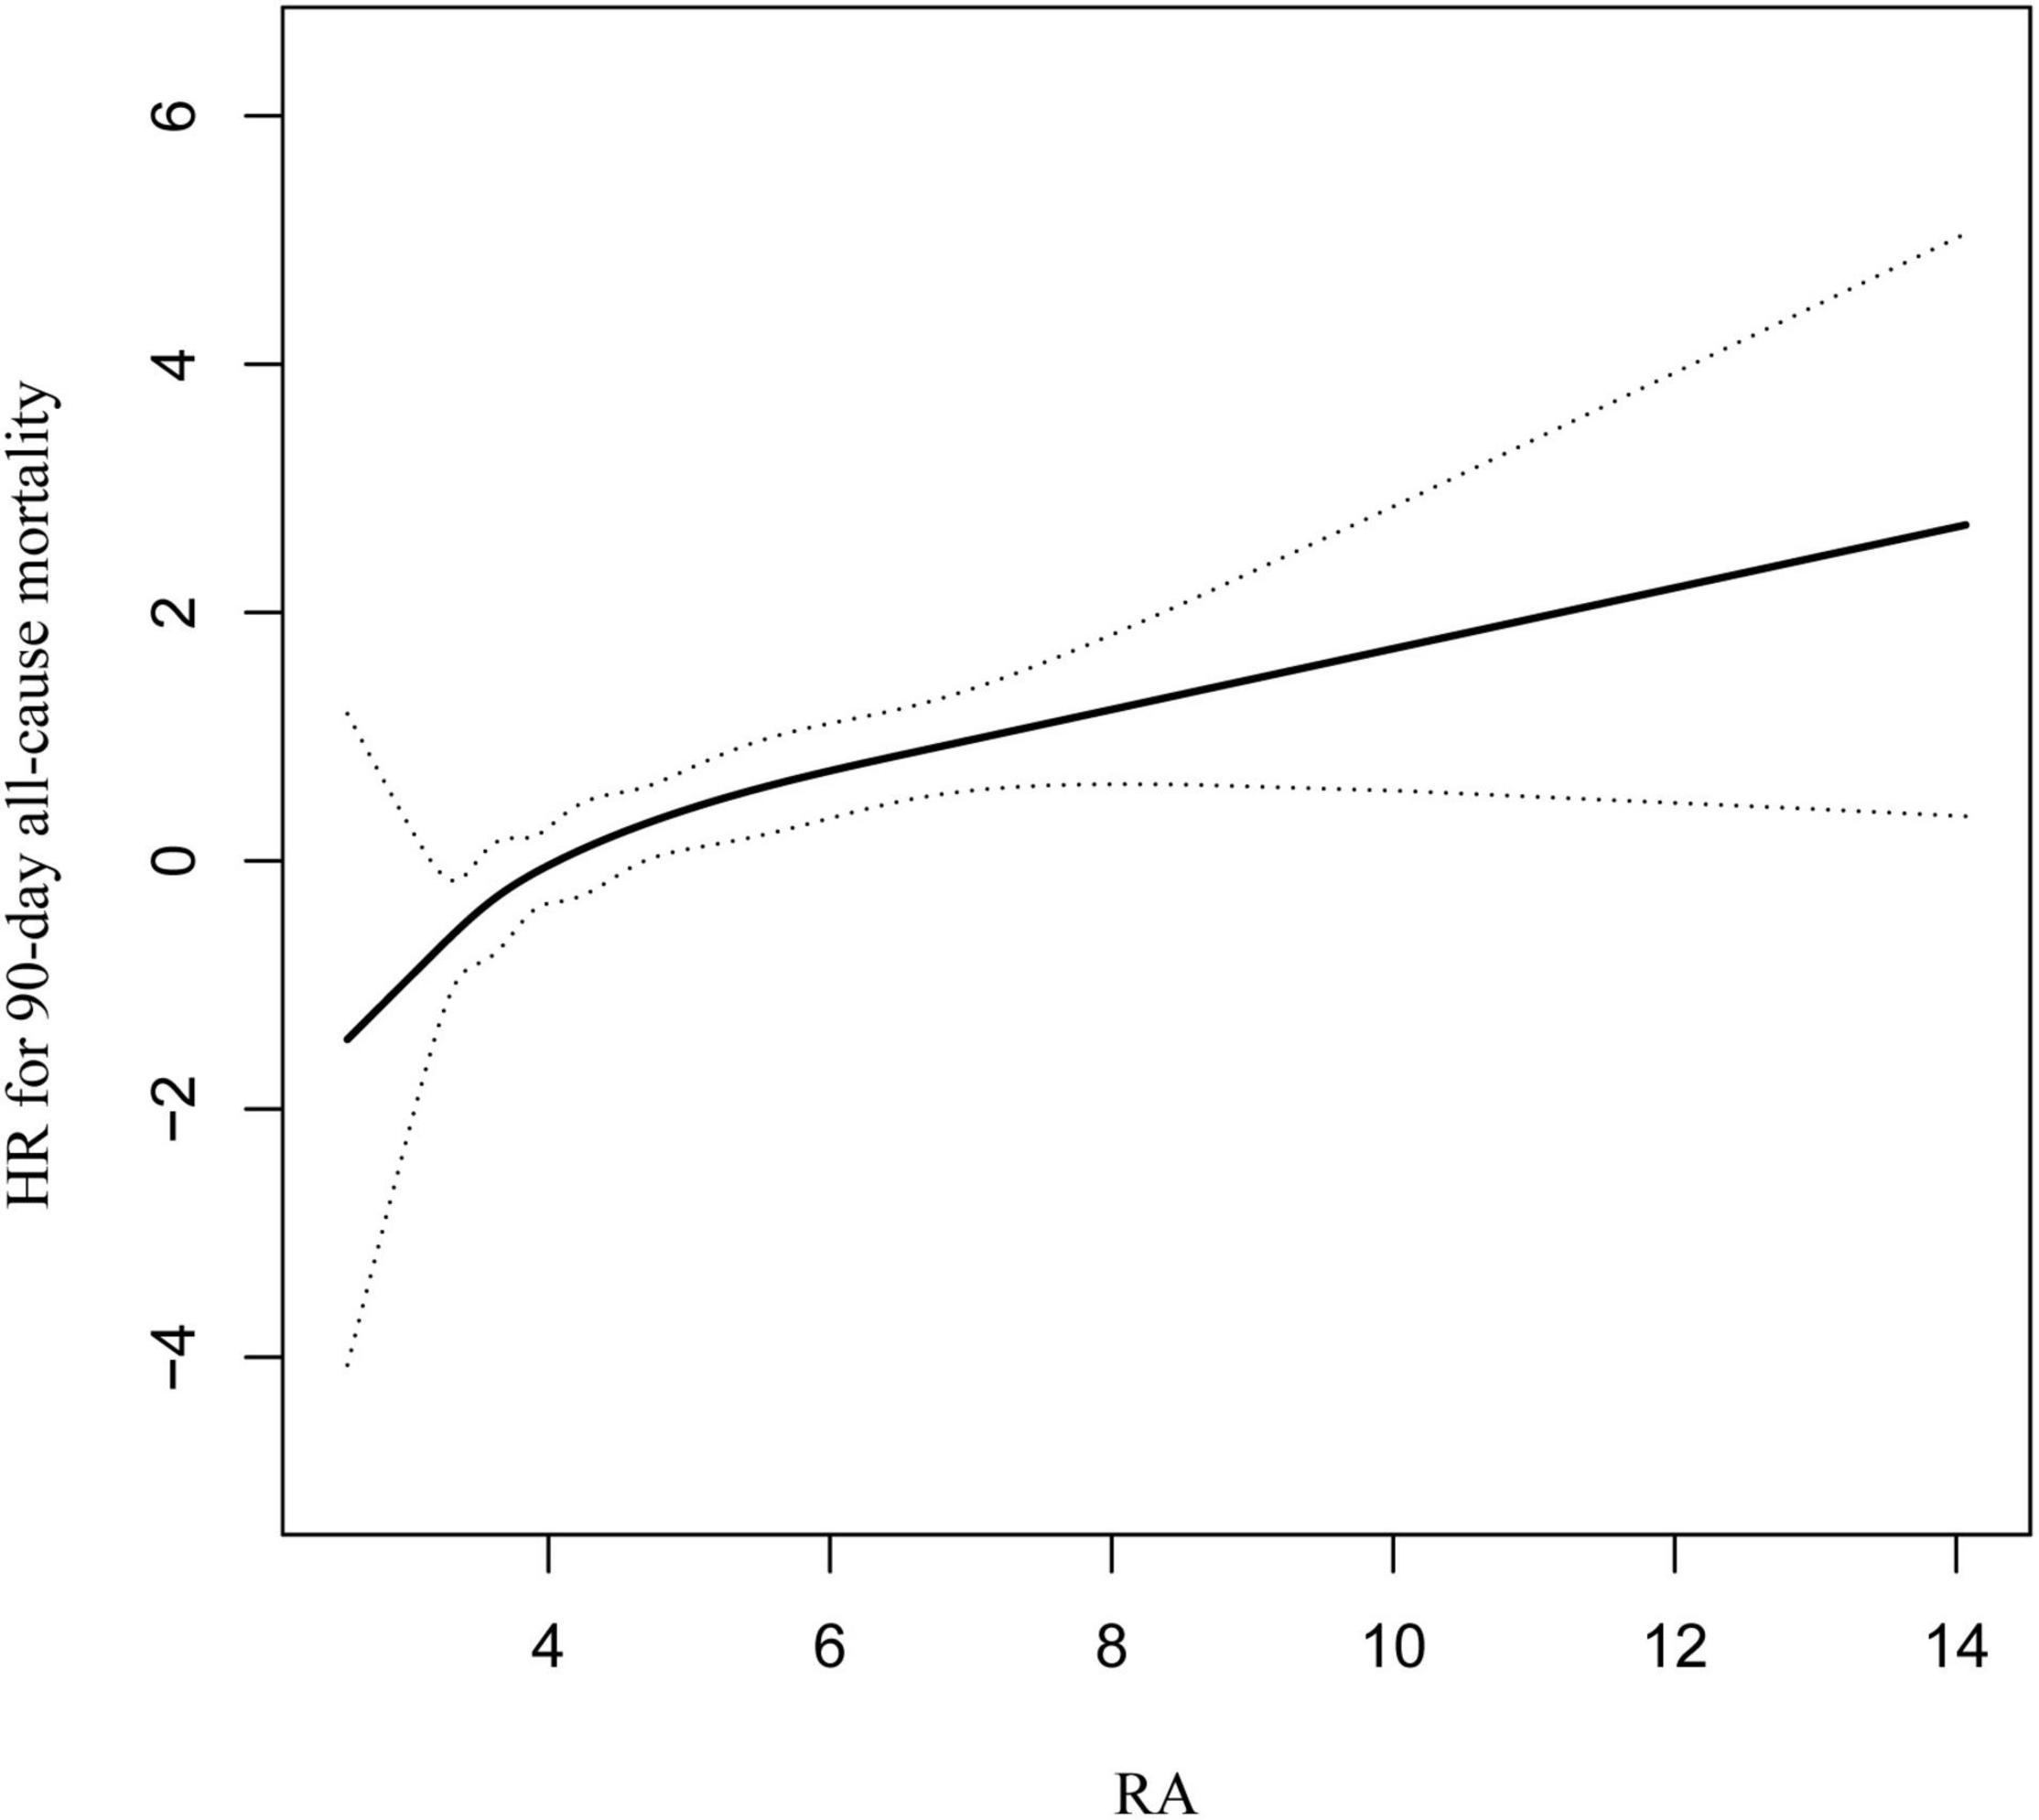
Figure 2. Curve fitting of RA and 90-day all-cause mortality in patients with coronary heart disease, who had undergone PCI.
Figure 3 shows the 90-day survival curves of patients after PCI, stratified by the tertiles of RA. The figure shows significantly lower cumulative survivals with higher RA tertiles. Similar correlations were also observed in 30-day and 1-year survival curves (Supplementary Figures 3, 4).
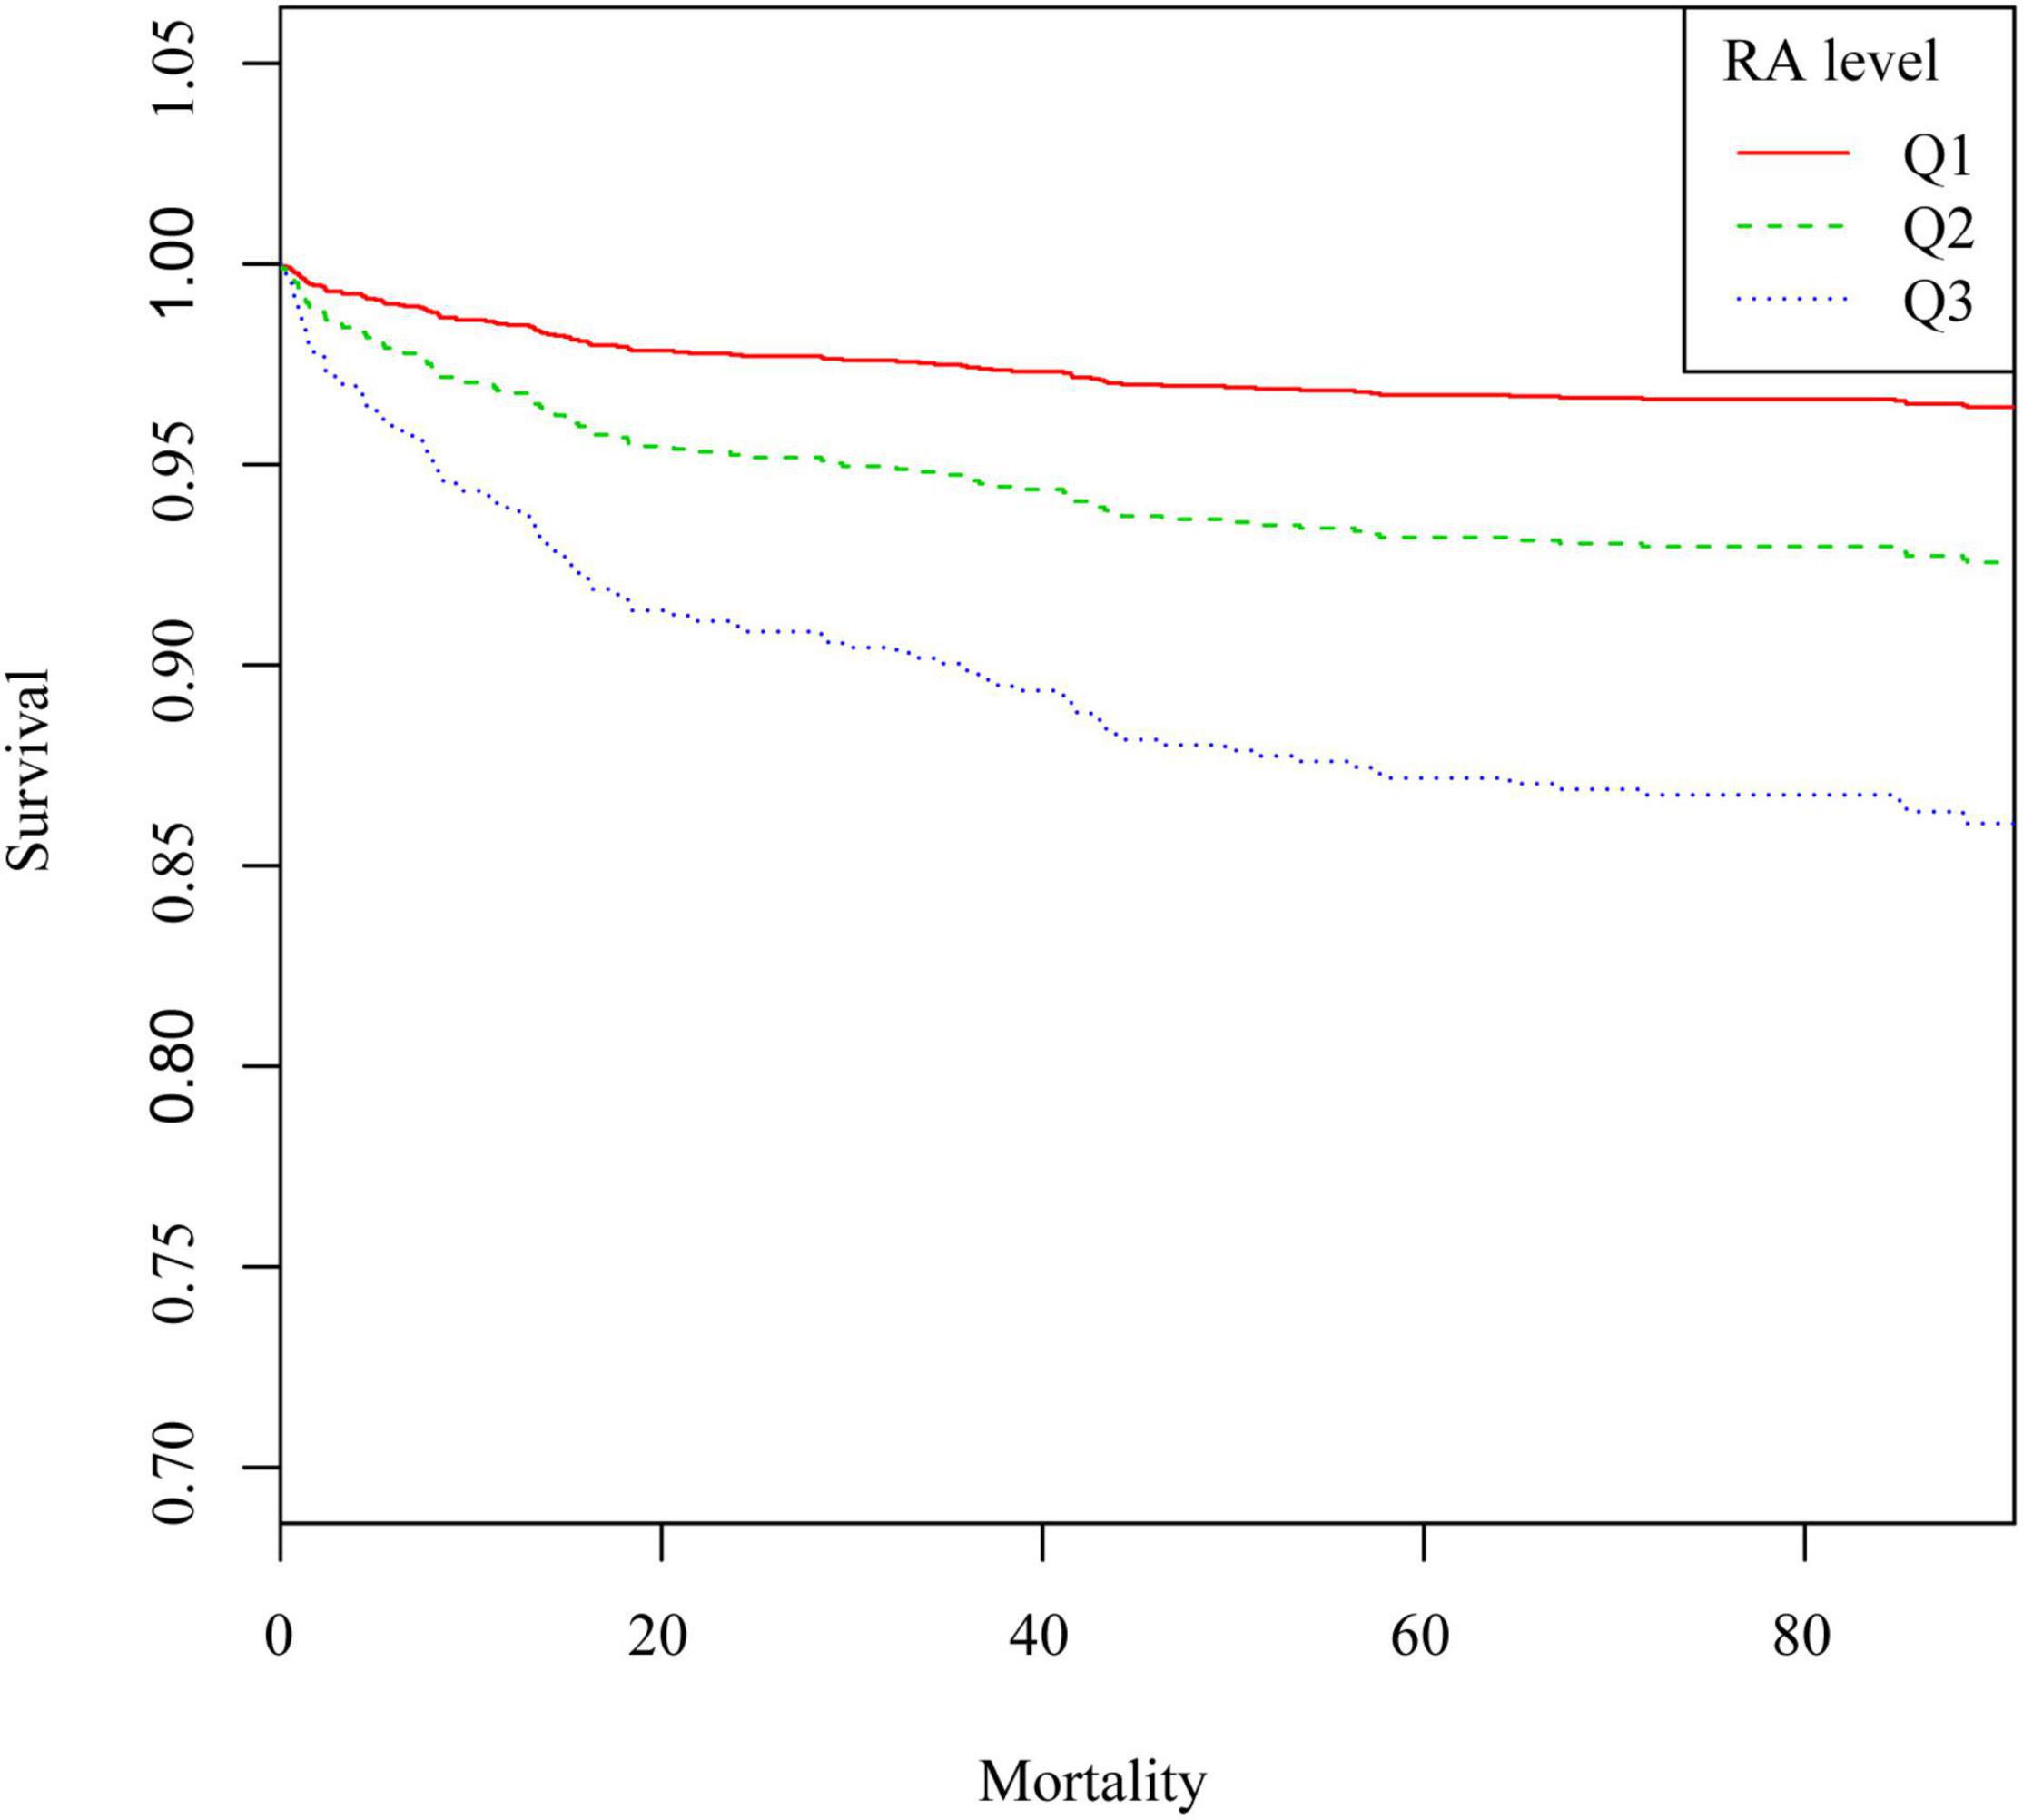
Figure 3. Kaplan–Meier survival curve of 90-day all-cause mortality in patients after PCI. Q1, RA < 3.7 ml/g; Q2, RA was 3.7–4.5 ml/g; Q3, RA > 4.5 ml/g.
Table 2 shows the results of the relationship between RA and each outcome indicator. With regard to the 90-day all-cause mortality, in the unadjusted model, the HRs (95% CIs) for the second (RA: 3.7–4.5 ml/g) and third (RA >4.5 ml/g) tertiles were 2.73 (1.41, 5.30) and 6.03 (3.26, 11.17), respectively, compared to the reference group (RA <3.7 ml/g) (p < 0.05). This association remained statistically significant even after adjusting for race, gender, age, SpO2, respiratory rate, heart rate, diastolic blood pressure, temperature, congestive heart failure, heart valve disease, nervous system diseases, pulmonary circulation disorders, hypertension, chronic pulmonary disease, hypothyroidism, obesity, coagulopathy, white blood cell count, serum chloride, bicarbonate, platelet, hematocrit, and anion gap. The adjusted HRs (95% CIs) for the second (RA: 3.7–4.5 ml/g) and third (RA >4.5 ml/g) tertiles were 2.27 (1.11, 4.64) and 3.67 (1.82, 7.40), respectively, compared to the reference group (RA <3.7 ml/g) (p < 0.05). When analyzing RA as a continuous variable, the HRs (95% CIs) in the three models were 1.36 (1.24, 1.49), 1.48 (1.31, 1.67), and 1.43 (1.24, 1.65), respectively (all p < 0.001). A similar relationship was also observed for the outcome of 30-day or 1-year all-cause mortality. Furthermore, the linear regression results of the relationship between RA and length of hospital stay or ICU stay were also expressed. It showed that the beta values (95% CIs) for the length of ICU stay in the three models were 1.15 (0.70, 1.60), 1.17 (0.70, 1.63), and 0.89 (0.43, 1.36), respectively (all p < 0.001). The β values (95% CIs) for the length of hospital stay in the three models were respectively 1.80 (1.21, 2.39), 1.82 (1.21, 2.43), and 1.45 (0.84, 2.06).
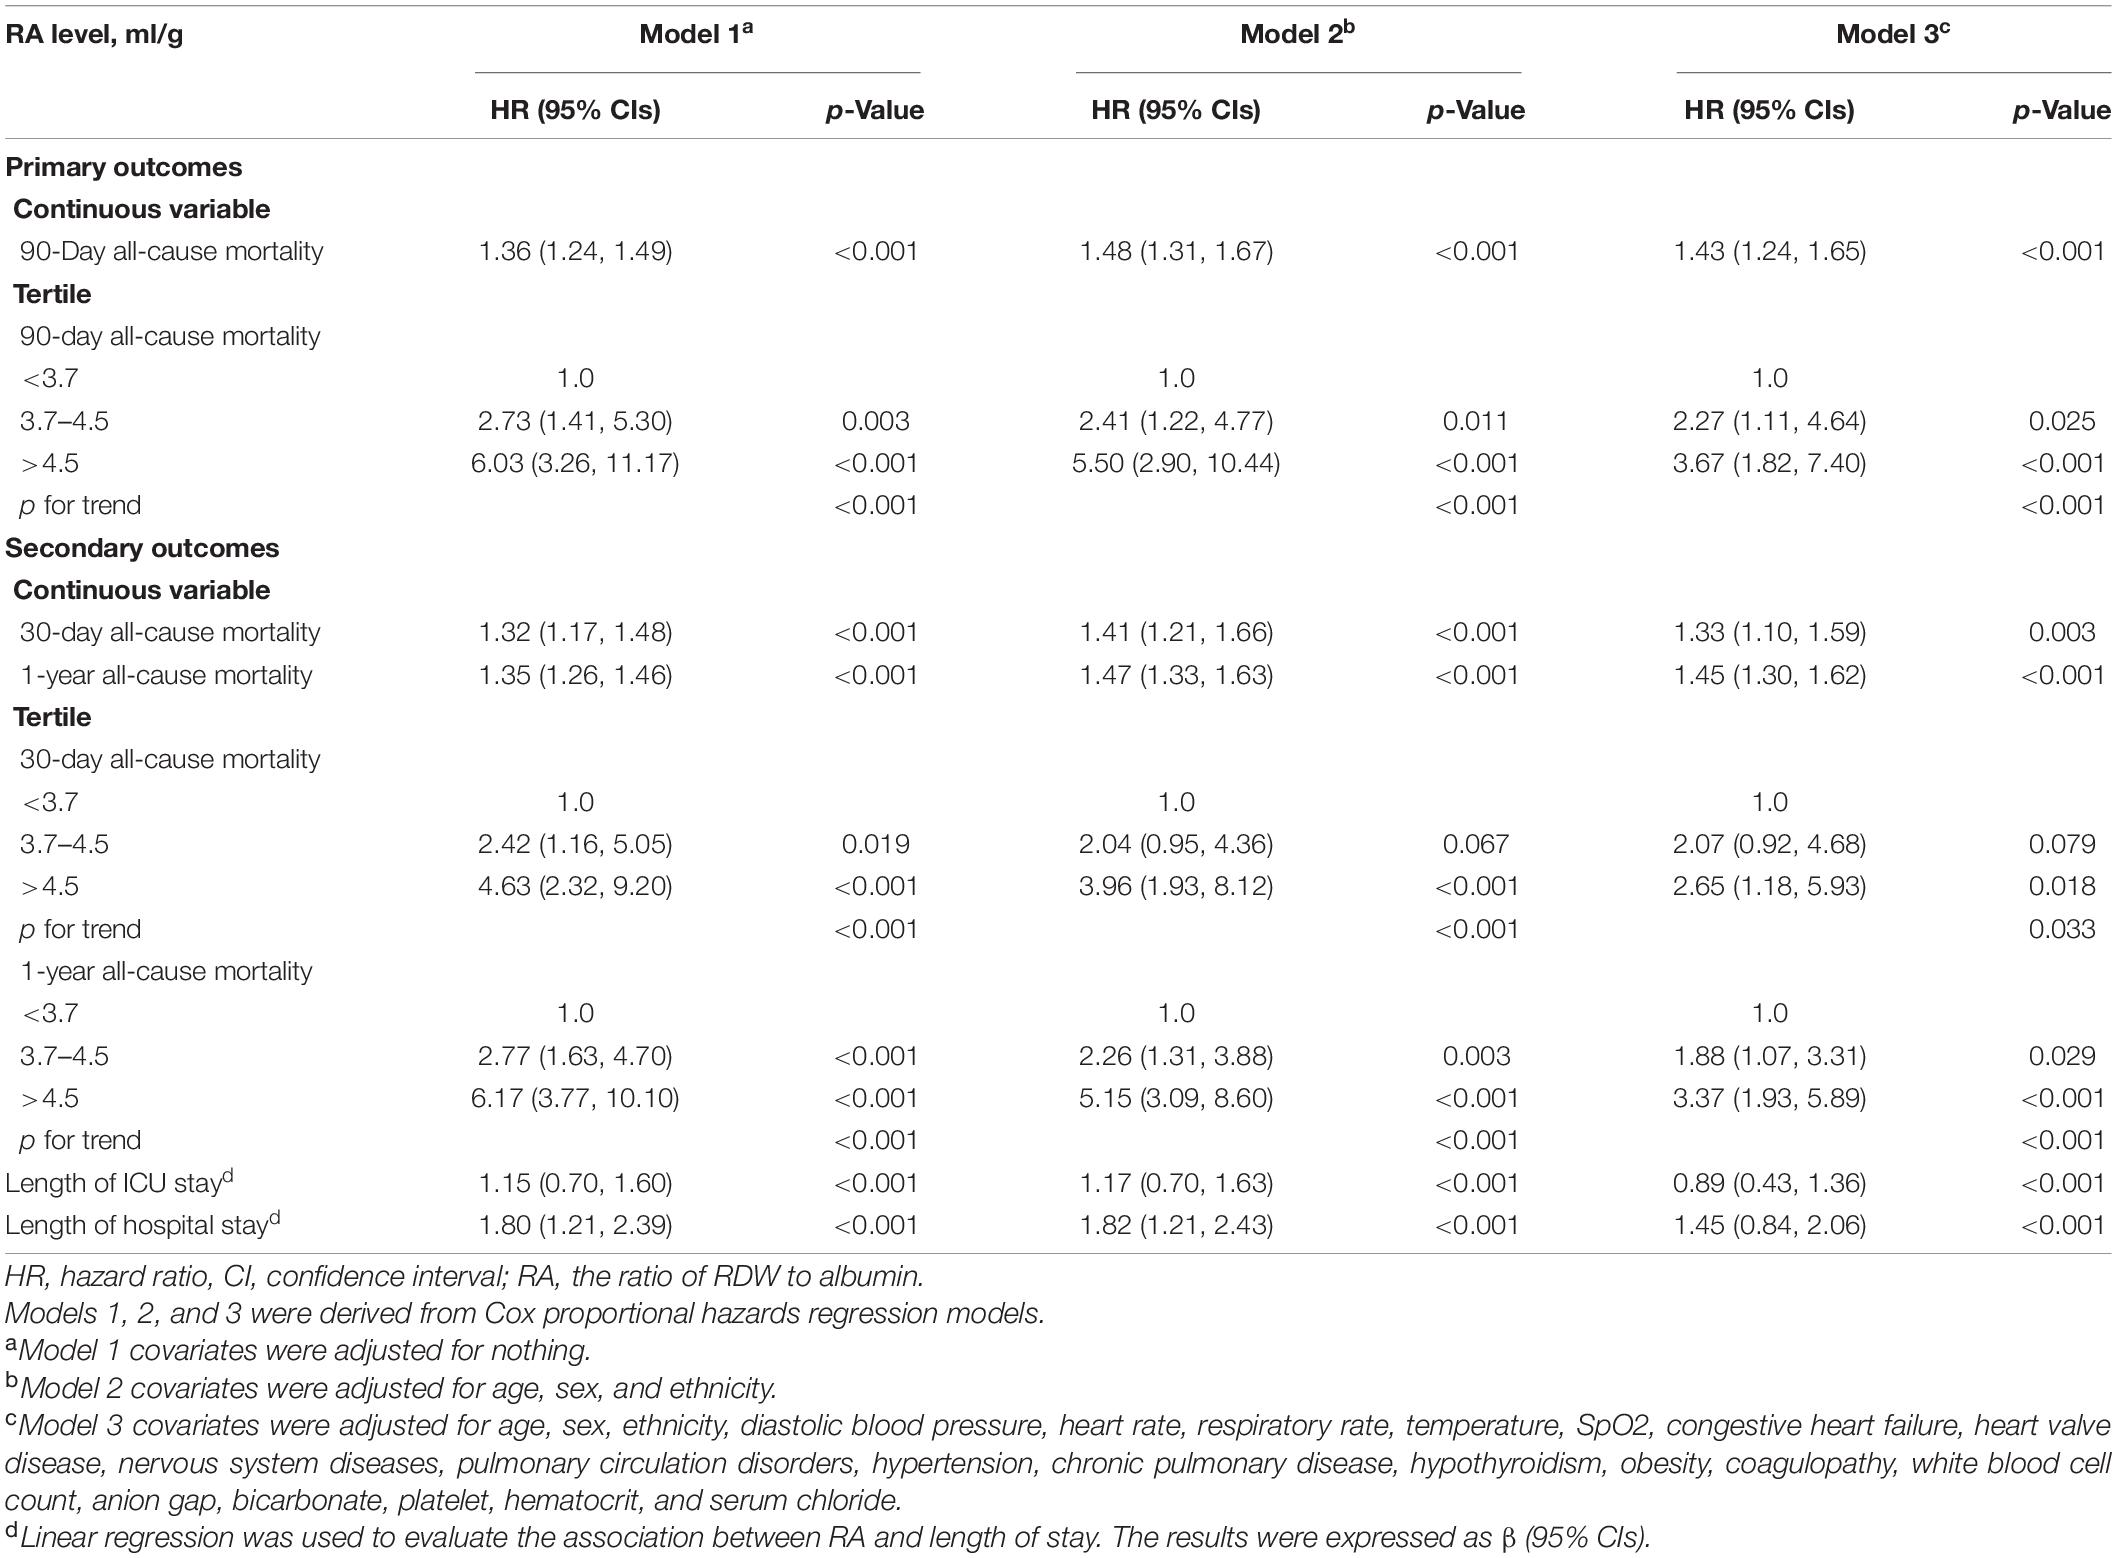
Table 2. Hazard ratio (HR) [95% confidence intervals (CIs)] for all-cause mortality across groups of ratio of red blood cell distribution width (RDW) to albumin (RA) level.
Table 3 shows the results of subgroup analyses. The related common comorbidities were analyzed in the subgroup analysis, and no significant interaction was observed.
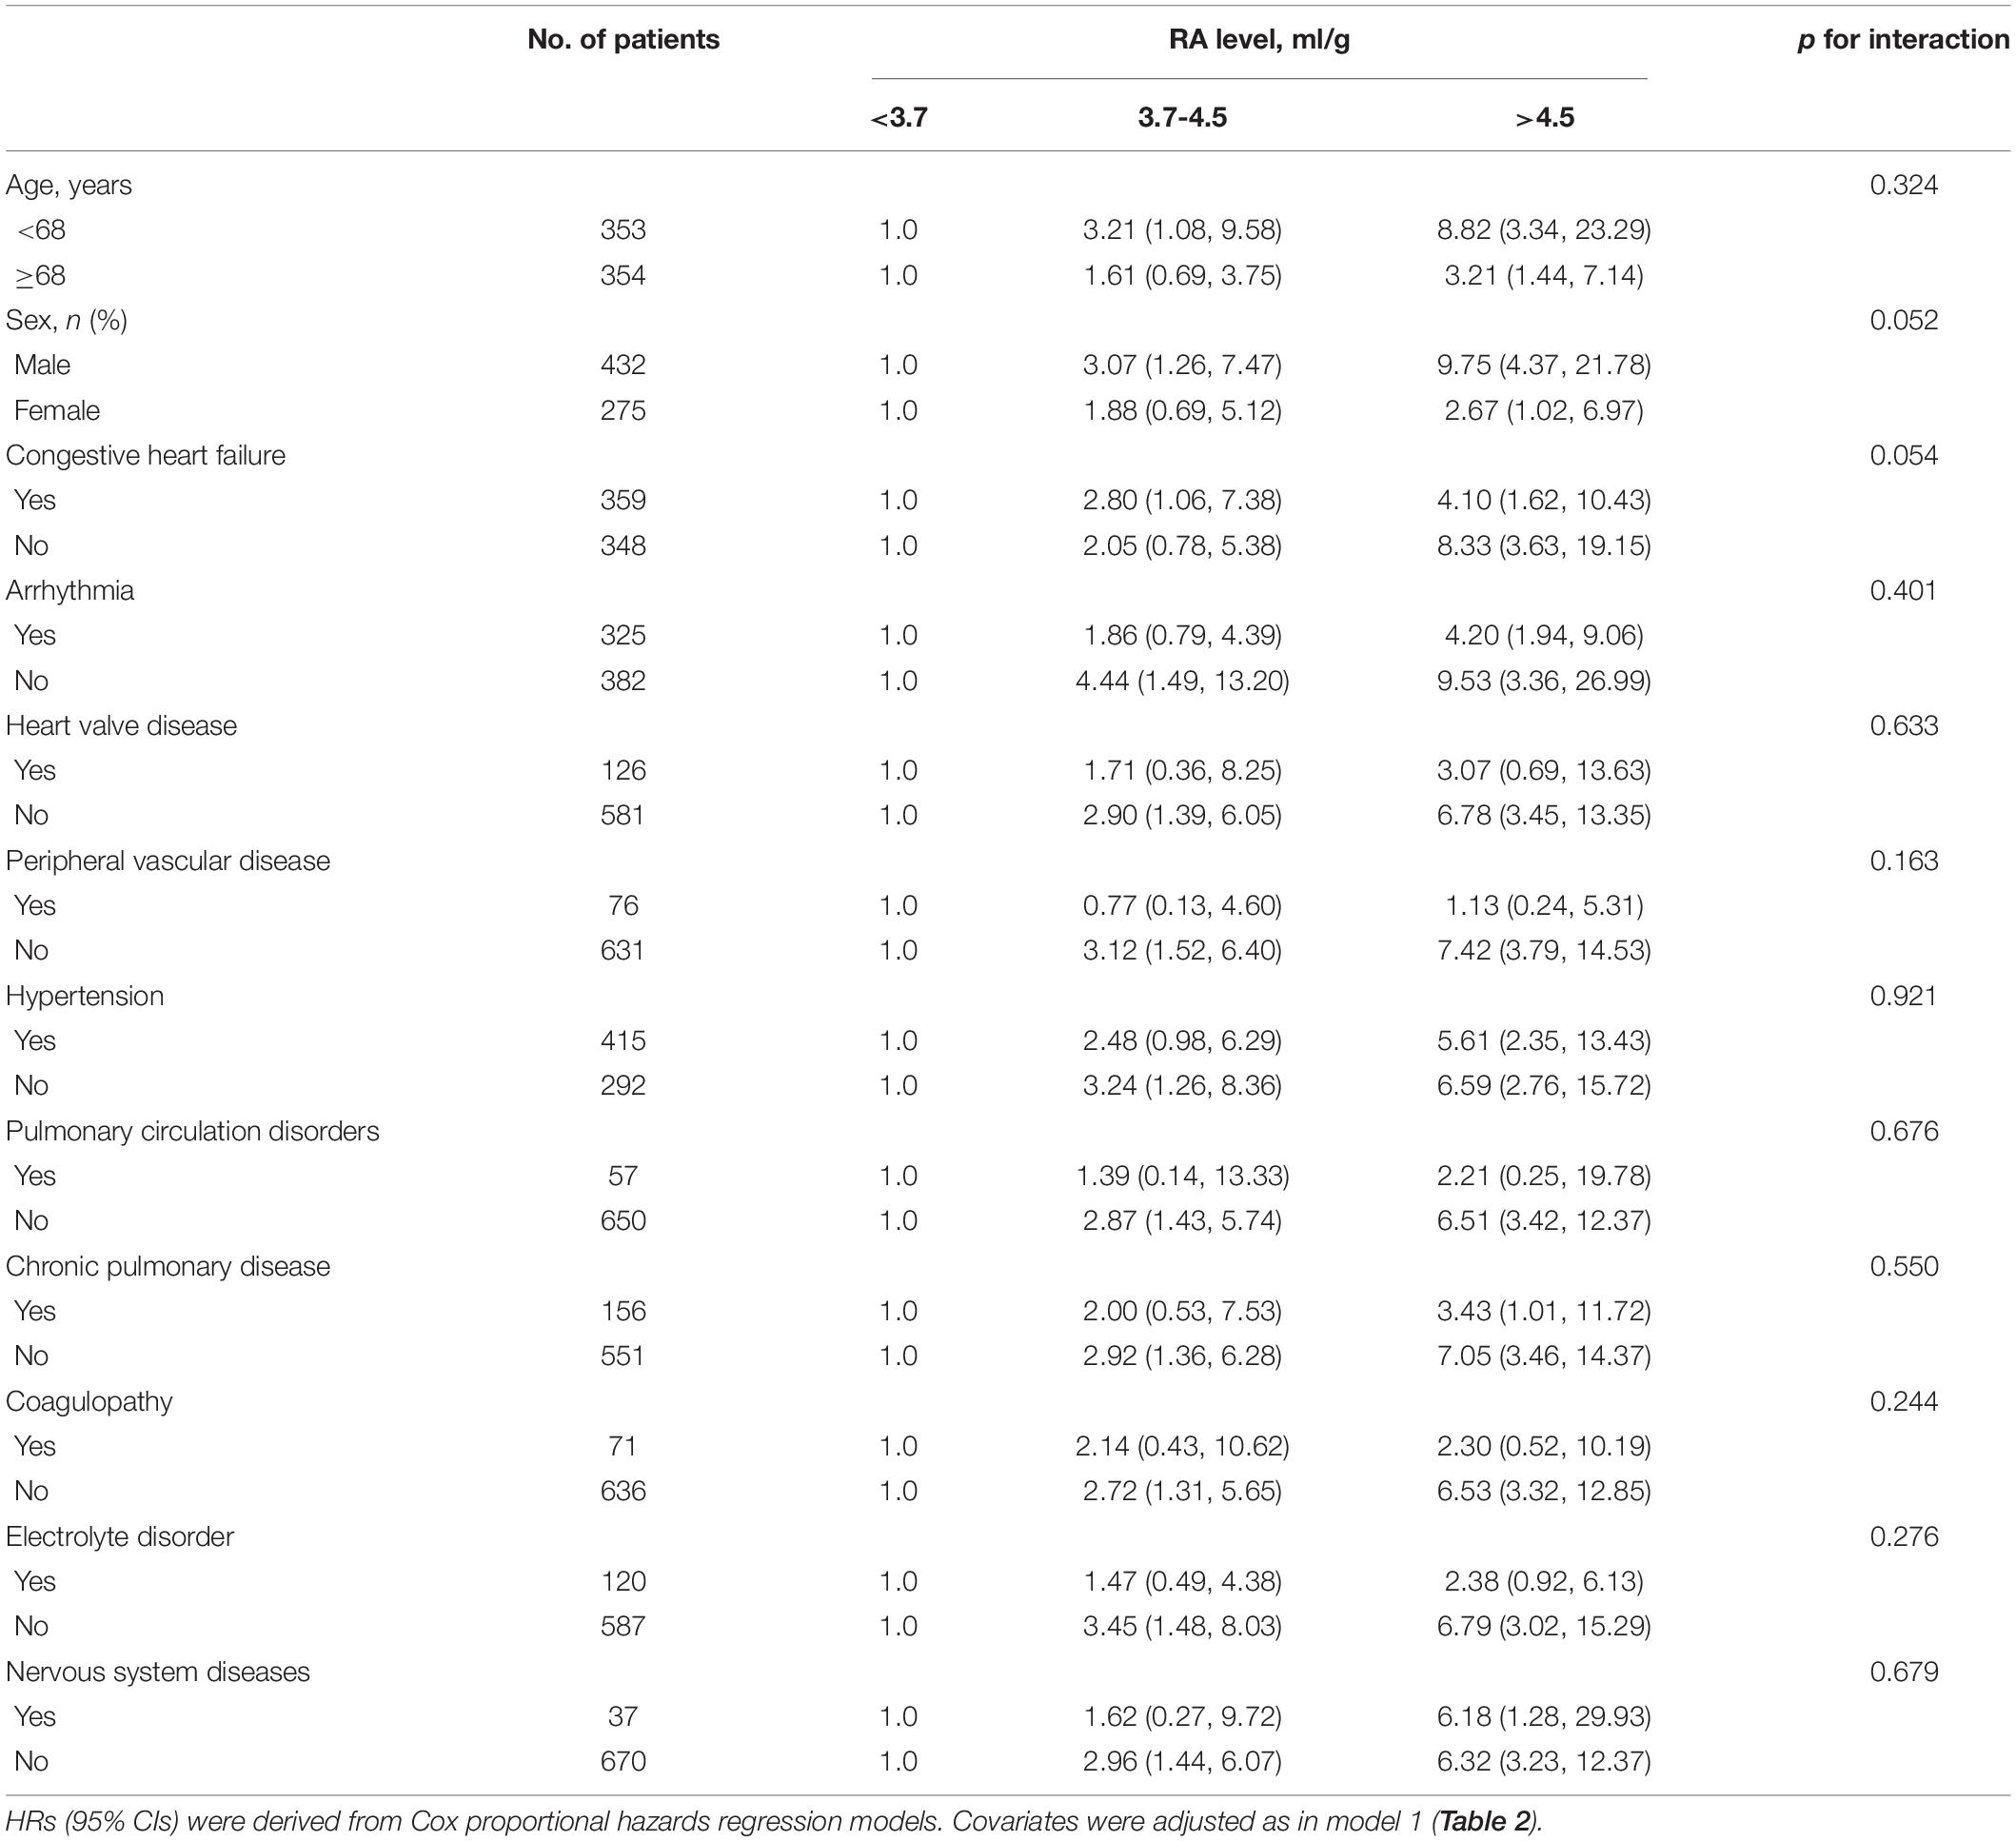
Table 3. Subgroup analysis of the associations between 90-day all-cause mortality and the RA level.
Receiver Operating Characteristic Analysis
Different ROC curves were respectively constructed for RA, RDW, and albumin, as well as RA combined with APSIII score (Figure 4). It was observed that the areas under the ROC curves (AUCs) (95% CIs) for RA, RDW, and albumin were 0.699 (0.647, 0.782), 0.672 (0.616, 0.728), and 0.643 (0.586, 0.699), respectively. A comparison of the AUCs proved that the ability of RA to predict the 90-day mortality was better than that of RDW or albumin. Moreover, the AUCs (95% CIs) for RA combined with SAPSIII score and APSIII score were 0.764 (0.719, 0.811) and 0.736 (0.684, 0.787), respectively (p < 0.05). Analysis showed that the predictive ability of RA combined with APSIII score was better than that of APSIII score alone.
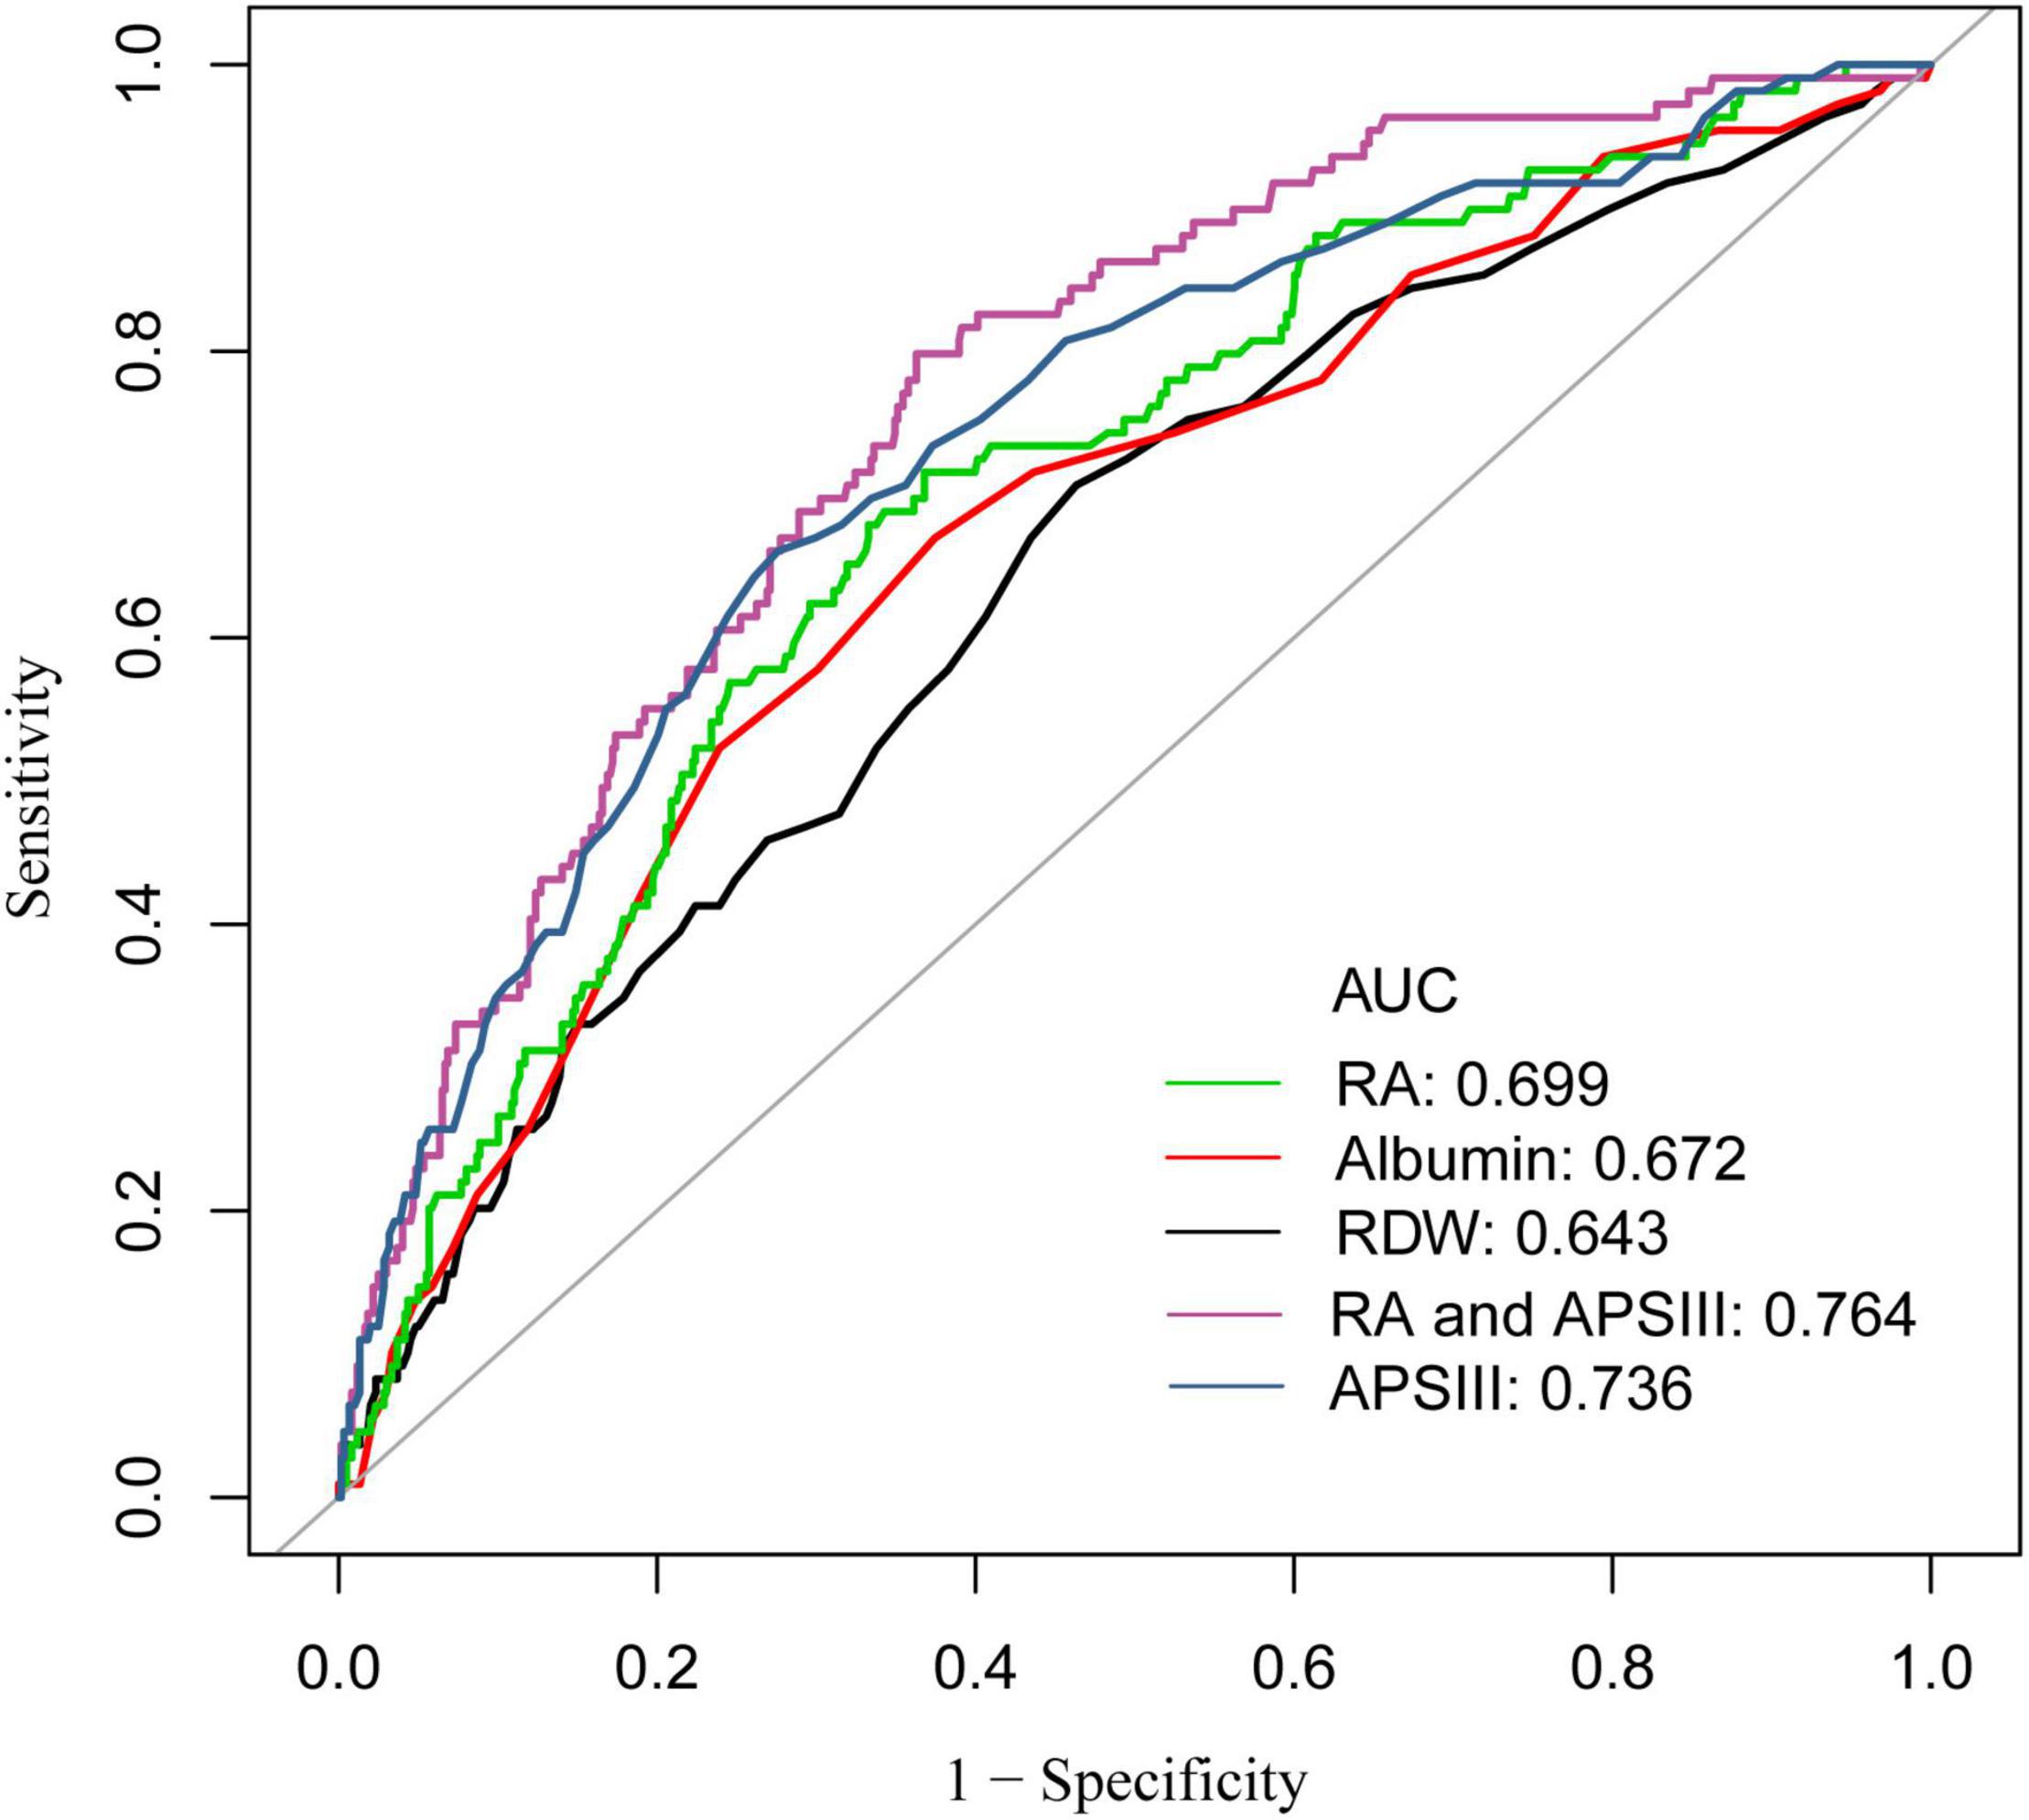
Figure 4. Receiver operator characteristic (ROC) curve analysis for 90-day mortality of patients with coronary heart disease, who have undergone PCI. AUC, area under the curve; RA, the ratio of red cell volume distribution width to albumin; RDW, red cell distribution width; APSIII, acute physiology score III.
Pearson Correlation Analysis
We plotted the scatter plots of Gensini score and cTnI with RA, respectively, for the data of patients in the cohort of our hospital. Results showed that both of them were positively correlated with RA (Figures 5A,B). In addition, Pearson correlation analysis was performed, and the obtained results are shown in Table 4. The correlation coefficient between Gensini score and RA was 0.254, which was better than RDW and albumin alone. A similar result was also observed in the relationship between cTnI and RA. The correlation coefficient between cTnI and RA was 0.323 (all p < 0.05).

Figure 5. (A) Scatter plot of the relationship between RA and Gensini score. (B) Scatter plot of the relationship between RA and cTnI. RA, the ratio of red cell volume distribution width to albumin; cTnI, cardiac troponin I.
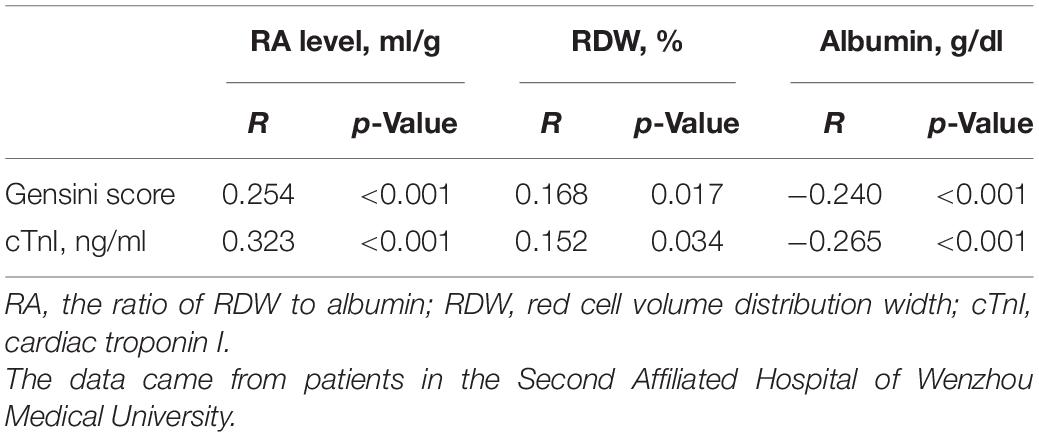
Table 4. Pearson correlation analysis of the RA and clinical indicators.
Discussion
This is the first study which has shown that RA is an independent risk factor for patients after PCI and high level of RA increases the length of hospital stay, even after adjusting for possible covariates. The ROC curve revealed that RA had a wonderful ability to predict all-cause mortality in patients after PCI, and its use in combination with APSIII score could enhance the predictive ability of APSIII score alone. The subgroup analysis further showed that the relationship between RA and all-cause mortality was stable. Moreover, data obtained from the cohort of our hospital showed that RA was positively correlated with Gensini score or cTnI in patients after PCI, and the correlation was stronger than RDW or albumin alone. This suggests that RA is associated with the severity of coronary artery lesions in patients with CAD.
However, the specific mechanism of the relationship between various biomarkers and mortality after PCI has not been clarified. Studies have shown that low hemoglobin levels are associated with an increased risk of all-cause mortality in patients after PCI. This may be due to the fact that low hemoglobin levels reflect to a certain extent the decline of the host’s immune response and malnutrition, which reflects the patient’s low resistance to external invasion (19). Previous studies have shown that inflammation is strongly associated with atherosclerosis and modulates the progression of coronary plaque after PCI (20–22). Chronic low-level inflammation regulates plaque formation in atherosclerosis, which subsequently leads to plaque instability and thrombosis (23–25). Evidence also suggests that reducing the classic inflammatory cascade can help reduce coronary artery-related adverse events (26).
RDW is a hematological index reflecting the volumetric heterogeneity of red blood cells (RBC) volumn size (27). RDW is automatically calculated using blood cell counters (28). Previous studies have shown that high RDW is an independent predictor of all-cause mortality in patients with CAD, even after PCI (29, 30). Inflammation affects the function of the bone marrow and inhibits maturation of RBCs, thereby leading to increased reticulocytosis and RDW. In addition, oxidative stress induces an increase in RDW by shortening RBC life span and making RBC enter the peripheral circulation prematurely, which may explain the above phenomenon (31).
Serum albumin, synthesized in the liver, is a biochemical marker of nutritional status and a major component of colloidal osmotic pressure (32, 33). Albumin is a negative acute phase protein whose synthesis rate is negatively correlated with inflammatory activity (33, 34). Experimental evidence has shown that albumin has antioxidant activity, and plays a protective role by thinning the blood and reducing oxidative stress (35–37). Several studies have shown that serum albumin level is associated with the outcomes of various diseases including cardio-cerebrovascular diseases, mainly due to malnutrition and inflammation (15, 33, 38–40). Moreover, low serum albumin concentration has been reported to be associated with adverse clinical outcomes of ischemic heart disease (41–44). A study involving more than 1,000 patients with CAD reported that reduction of albumin predicted higher all-cause mortality after PCI (45).
This study reached a similar conclusion that RA was an independent predictor of all-cause mortality in patients after PCI. RA, a combination of two classical clinical assessment parameters, showed a better prognostic value than RDW or albumin alone, as intuitively demonstrated by AUC. Moreover, RA combined with APSIII score can enhance the predictive power of the APSIII score. In addition, the data obtained from our hospital showed that RA was also positively correlated with cTnI and Gensini score. This might be attributed to the enhancement of inflammatory response in the human body by high RA level, thereby leading to the increased severity of coronary heart disease. RA, as a potential new biomarker, can be obtained quickly and easily in laboratory tests on admission, with certain advantages of simplicity. Given its low cost, good availability, and high prognostic value, RA has clinical significance for clinicians to make quick judgments on patients after PCI.
This study has several advantages. First, this is the first study to explore the association between RA and outcomes of patients after PCI. Second, the data are not only from an online database but also validated with data from our own hospital, and the results are broadly applicable. Third, the analysis fully adjusted for potential confounders that might influence the results, and the results were repeatedly validated using multiple models. Moreover, the mechanism was explored using clinical data obtained from our institution. However, the study has some limitations. First, we used a retrospective study design, and the bias of retrospective study itself cannot be ignored. Therefore, prospective studies are required to address this issue. Second, there may be selection bias in our study. Although RA is readily available in clinical practice, the loss of RA in the database is still prevalent. Due to the limitations of the database, we cannot obtain comprehensive data of the patient from the MIMIC-III database, such as the main etiology of the patient’s admission, cardiac function classification, and echocardiography results, which may have an impact on the prognosis of the patient. Therefore, further studies are needed to verify the results of this article. Next, we will collect further data and try other new methods, such as ensemble modeling and machine learning, to fully validate and refine the results of this study (46).
Conclusion
RA is an independent risk factor for all-cause mortality in patients after PCI. The higher the RA, the higher the mortality. RA has a good predictive ability for all-cause mortality in patients after PCI, which is better than RDW or albumin alone. RA may be positively correlated with the severity of CAD in patients with CAD.
Data Availability Statement
The original contributions presented in the study are included in the article/Supplementary Material, further inquiries can be directed to the corresponding authors.
Ethics Statement
The studies involving human participants were reviewed and approved by the Institute of Institutional Research and Ethics of the Second Affiliated Hospital of Wenzhou Medical University. Written informed consent for participation was not required for this study in accordance with the national legislation and the institutional requirements.
Author Contributions
All authors were involved in drafting the manuscript or revising it critically for important intellectual content, and approved the final version to be published. LW had full access to all of the data in the study and took responsibility for the integrity of the data and the accuracy of the data analysis. YW, YX, and BW contributed to the study conception and design. HX contributed to the acquisition of data. YW and YP contributed to the analysis and interpretation of data. KJ and XG contributed to excellent technical assistance with data management.
Conflict of Interest
The authors declare that the research was conducted in the absence of any commercial or financial relationships that could be construed as a potential conflict of interest.
Publisher’s Note
All claims expressed in this article are solely those of the authors and do not necessarily represent those of their affiliated organizations, or those of the publisher, the editors and the reviewers. Any product that may be evaluated in this article, or claim that may be made by its manufacturer, is not guaranteed or endorsed by the publisher.
Supplementary Material
The Supplementary Material for this article can be found online at: https://www.frontiersin.org/articles/10.3389/fcvm.2022.869816/full#supplementary-material
Supplementary Figure 1 | Curve fitting of RA and 30-day all-cause mortality in patients with coronary heart disease, who had undergone PCI.
Supplementary Figure 2 | Curve fitting of RA and 1-year all-cause mortality in patients with coronary heart disease, who had undergone PCI.
Supplementary Figure 3 | Kaplan–Meier survival from in 30-day all-cause mortality for patients in RA tertiles. Q1, RA < 3.7 ml/g; Q2, RA was 3.7–4.5 ml/g; Q3, RA > 4.5 ml/g.
Supplementary Figure 4 | Kaplan–Meier survival from in 1-year all-cause mortality for patients in RA tertiles. Q1, RA < 3.7 ml/g; Q2, RA was 3.7–4.5 ml/g; Q3, RA > 4.5 ml/g.
Supplementary Table 1 | Gensini score rule.
Supplementary Table 2 | Baseline characteristics of the study population.
Supplementary Table 3 | Baseline characteristics of the study population.
Footnotes
References
2. Álvarez-Álvarez MM, Zanetti D, Carreras-Torres R, Moral P, Athanasiadis G. A survey of sub-Saharan gene flow into the Mediterranean at risk loci for coronary artery disease. Eur J Hum Genet. (2017) 25:472–6. doi: 10.1038/ejhg.2016.200
3. Global Burden of Disease Study 2013 Collaborators. Global, regional, and national incidence, prevalence, and years lived with disability for 301 acute and chronic diseases and injuries in 188 countries, 1990-2013: a systematic analysis for the global burden of disease study 2013. Lancet. (2015) 386:743–800. doi: 10.1016/S0140-6736(15)60692-4
4. Bhatnagar P, Wickramasinghe K, Williams J, Rayner M, Townsend N. The epidemiology of cardiovascular disease in the UK 2014. Heart. (2015) 101:1182–9. doi: 10.1136/heartjnl-2015-307516
5. Virani SS, Alonso A, Benjamin EJ, Bittencourt MS, Callaway CW, Carson AP, et al. Heart Disease and stroke statistics-2020 update: a report from the American heart association. Circulation. (2020) 141:e139–596. doi: 10.1161/CIR.0000000000000757
6. Kandan SR, Johnson TW. Management of percutaneous coronary intervention complications. Heart. (2019) 105:75–86. doi: 10.1136/heartjnl-2017-311155
7. Ross R, Glomset JA. Atherosclerosis and the arterial smooth muscle cell: proliferation of smooth muscle is a key event in the genesis of the lesions of atherosclerosis. Science. (1973) 180:1332–9. doi: 10.1126/science.180.4093.1332
8. Ross R. The pathogenesis of atherosclerosis–an update. N Engl J Med. (1986) 314:488–500. doi: 10.1056/nejm198602203140806
9. Ross R. The pathogenesis of atherosclerosis: a perspective for the 1990s. Nature. (1993) 362:801–9. doi: 10.1038/362801a0
10. Ross R. Rous-whipple award lecture. atherosclerosis: a defense mechanism gone awry. Am J Pathol. (1993) 143:987–1002.
11. Mozos I. Mechanisms linking red blood cell disorders and cardiovascular diseases. Biomed Res Int. (2015) 2015:682054. doi: 10.1155/2015/682054
12. Grimm G, Haslacher H, Kampitsch T, Endler G, Marsik C, Schickbauer T, et al. Sex differences in the association between albumin and all-cause and vascular mortality. Eur J Clin Invest. (2009) 39:860–5. doi: 10.1111/j.1365-2362.2009.02189.x
13. Zhao N, Hu W, Wu Z, Wu X, Li W, Wang Y, et al. The red blood cell distribution width-albumin ratio: a promising predictor of mortality in stroke patients. Int J Gen Med. (2021) 14:3737–47. doi: 10.2147/IJGM.S322441
14. Long J, Xie X, Xu D, Huang C, Liu Y, Meng X, et al. Association between red blood cell distribution width-to-albumin ratio and prognosis of patients with aortic aneurysms. Int J Gen Med. (2021) 14:6287–94. doi: 10.2147/IJGM.S328035
15. Zhao F, Liu M, Kong L. Association between red blood cell distribution width-to-albumin ratio and diabetic retinopathy. J Clin Lab Anal. (2022) 36:e24351. doi: 10.1002/jcla.24351
16. Gensini GG. A more meaningful scoring system for determining the severity of coronary heart disease. Am J Cardiol. (1983) 51:606. doi: 10.1016/s0002-9149(83)80105-2
17. Sun H, Que J, Peng Y, Ye H, Xiang H, Han Y, et al. The neutrophil-lymphocyte ratio: a promising predictor of mortality in coronary care unit patients – a cohort study. Int Immunopharmacol. (2019) 74:105692. doi: 10.1016/j.intimp.2019.105692
18. Jaddoe VW, de Jonge LL, Hofman A, Franco OH, Steegers EA, Gaillard R. First trimester fetal growth restriction and cardiovascular risk factors in school age children: population based cohort study. BMJ. (2014) 348:g14. doi: 10.1136/bmj.g14
19. Leonardi S, Gragnano F, Carrara G, Gargiulo G, Frigoli E, Vranckx P, et al. Prognostic implications of declining hemoglobin content in patients hospitalized with acute coronary syndromes. J Am Coll Cardiol. (2021) 77:375–88. doi: 10.1016/j.jacc.2020.11.046
20. Wolf D, Ley K. Immunity and inflammation in atherosclerosis. Circ Res. (2019) 124:315–27. doi: 10.1161/circresaha.118.313591
21. Hansson GK. Inflammation, atherosclerosis, and coronary artery disease. N Engl J Med. (2005) 352:1685–95.
22. Libby P, Ridker PM, Hansson GK. Inflammation in atherosclerosis: from pathophysiology to practice. J Am Coll Cardiol. (2009) 54:2129–38. doi: 10.1016/j.jacc.2009.09.009
23. García N, Zazueta C, Aguilera-Aguirre L. Oxidative stress and inflammation in cardiovascular disease. Oxid Med Cell Longev. (2017) 2017:5853238.
24. Zhu Y, Xian X, Wang Z, Bi Y, Chen Q, Han X, et al. Research progress on the relationship between atherosclerosis and inflammation. Biomolecules. (2018) 8:80. doi: 10.3390/biom8030080
25. Williams JW, Huang LH, Randolph GJ. Cytokine circuits in cardiovascular disease. Immunity. (2019) 50:941–54. doi: 10.1016/j.immuni.2019.03.007
26. Libby P. Interleukin-1 beta as a target for atherosclerosis therapy: biological basis of CANTOS and beyond. J Am Coll Cardiol. (2017) 70:2278–89. doi: 10.1016/j.jacc.2017.09.028
27. Roberts GT, El Badawi SB. Red blood cell distribution width index in some hematologic diseases. Am J Clin Pathol. (1985) 83:222–6. doi: 10.1093/ajcp/83.2.222
29. Tonelli M, Sacks F, Arnold M, Moye L, Davis B, Pfeffer M. Relation between red blood cell distribution width and cardiovascular event rate in people with coronary disease. Circulation. (2008) 117:163–8. doi: 10.1161/CIRCULATIONAHA.107.727545
30. Poludasu S, Marmur JD, Weedon J, Khan W, Cavusoglu E. Red cell distribution width (RDW) as a predictor of long-term mortality in patients undergoing percutaneous coronary intervention. Thromb Haemost. (2009) 102:581–7. doi: 10.1160/TH09-02-0127
31. Peng Y, Guan X, Wang J, Ma J. Red cell distribution width is correlated with all-cause mortality of patients in the coronary care unit. J Int Med Res. (2020) 48:300060520941317. doi: 10.1177/0300060520941317
32. Che R, Huang X, Zhao W, Jiang F, Wu L, Zhang Z, et al. Low serum albumin level as a predictor of hemorrhage transformation after intravenous thrombolysis in ischemic stroke patients. Sci Rep. (2017) 7:7776. doi: 10.1038/s41598-017-06802-y
33. Don BR, Kaysen G. Serum albumin: relationship to inflammation and nutrition. Semin Dial. (2004) 17:432–7. doi: 10.1111/j.0894-0959.2004.17603.x
34. LeFevre ML. Screening for abdominal aortic aneurysm: U.S. preventive services task force recommendation statement. Ann Intern Med. (2014) 161:281–90. doi: 10.7326/m14-1204
35. Belayev L, Busto R, Zhao W, Clemens JA, Ginsberg MD. Effect of delayed albumin hemodilution on infarction volume and brain edema after transient middle cerebral artery occlusion in rats. J Neurosurg. (1997) 87:595–601. doi: 10.3171/jns.1997.87.4.0595
36. Reinhart WH, Nagy C. Albumin affects erythrocyte aggregation and sedimentation. Eur J Clin Invest. (1995) 25:523–8. doi: 10.1111/j.1365-2362.1995.tb01739.x
37. Zoellner H, Höfler M, Beckmann R, Hufnagl P, Vanyek E, Bielek E, et al. Serum albumin is a specific inhibitor of apoptosis in human endothelial cells. J Cell Sci. (1996) 109(Pt 10):2571–80. doi: 10.1242/jcs.109.10.2571
38. Goldwasser P, Feldman J. Association of serum albumin and mortality risk. J Clin Epidemiol. (1997) 50:693–703. doi: 10.1016/s0895-4356(97)00015-2
39. Seet RC, Lim EC, Chan BP, Ong BK. Serum albumin level as a predictor of ischemic stroke outcome. Stroke. (2004) 35:2435; author reply 2435–6.
40. Dziedzic T, Slowik A, Szczudlik A. Serum albumin level as a predictor of ischemic stroke outcome. Stroke. (2004) 35:e156–8.
41. Wada H, Dohi T, Miyauchi K, Shitara J, Endo H, Doi S, et al. Impact of serum albumin levels on long-term outcomes in patients undergoing percutaneous coronary intervention. Heart Vessels. (2017) 32:1085–92. doi: 10.1007/s00380-017-0981-8
42. Plakht Y, Gilutz H, Shiyovich A. Decreased admission serum albumin level is an independent predictor of long-term mortality in hospital survivors of acute myocardial infarction. Soroka acute myocardial infarction II (SAMI-II) project. Int J Cardiol. (2016) 219:20–4. doi: 10.1016/j.ijcard.2016.05.067
43. Djoussé L, Rothman KJ, Cupples LA, Levy D, Ellison RC. Serum albumin and risk of myocardial infarction and all-cause mortality in the Framingham offspring study. Circulation. (2002) 106:2919–24. doi: 10.1161/01.cir.0000042673.07632.76
44. Nelson JJ, Liao D, Sharrett AR, Folsom AR, Chambless LE, Shahar E, et al. Serum albumin level as a predictor of incident coronary heart disease: the atherosclerosis risk in communities (ARIC) study. Am J Epidemiol. (2000) 151:468–77. doi: 10.1093/oxfordjournals.aje.a010232
45. Johnson AE, Pollard TJ, Shen L, Lehman LW, Feng M, Ghassemi M, et al. MIMIC-III, a freely accessible critical care database. Sci Data. (2016) 3:160035. doi: 10.1038/sdata.2016.35
Keywords: all-cause mortality, coronary artery disease, percutaneous coronary intervention, the ratio of red blood cell volume distribution width, albumin
Citation: Weng Y, Peng Y, Xu Y, Wang L, Wu B, Xiang H, Ji K and Guan X (2022) The Ratio of Red Blood Cell Distribution Width to Albumin Is Correlated With All-Cause Mortality of Patients After Percutaneous Coronary Intervention – A Retrospective Cohort Study. Front. Cardiovasc. Med. 9:869816. doi: 10.3389/fcvm.2022.869816
Received: 05 February 2022; Accepted: 14 April 2022;
Published: 24 May 2022.
Edited by:
Paolo Emilio Puddu, Université de Caen Normandie, FranceReviewed by:
Zhongheng Zhang, Sir Run Run Shaw Hospital, ChinaFelice Gragnano, University of Campania Luigi Vanvitelli, Italy
Copyright © 2022 Weng, Peng, Xu, Wang, Wu, Xiang, Ji and Guan. This is an open-access article distributed under the terms of the Creative Commons Attribution License (CC BY). The use, distribution or reproduction in other forums is permitted, provided the original author(s) and the copyright owner(s) are credited and that the original publication in this journal is cited, in accordance with accepted academic practice. No use, distribution or reproduction is permitted which does not comply with these terms.
*Correspondence: Kangting Ji, amlrdEB3bXUuZWR1LmNu; Xueqiang Guan, d3pzZ3hxQDE2My5jb20=
†These authors have contributed equally to this work