 Zakariye Ashkir
 Saul Myerson
 Stefan Neubauer1
 Carl-Johan Carlhäll
 Tino Ebbers
94% of researchers rate our articles as excellent or good
Learn more about the work of our research integrity team to safeguard the quality of each article we publish.
Find out more
REVIEW article
Front. Cardiovasc. Med. , 22 July 2022
Sec. Cardiovascular Imaging
Volume 9 - 2022 | https://doi.org/10.3389/fcvm.2022.866131
This article is part of the Research Topic Advances in Cardiac Imaging and Heart Failure Management View all 42 articles
Left ventricular diastolic dysfunction is a major cause of heart failure and carries a poor prognosis. Assessment of left ventricular diastolic function however remains challenging for both echocardiography and conventional phase contrast cardiac magnetic resonance. Amongst other limitations, both are restricted to measuring velocity in a single direction or plane, thereby compromising their ability to capture complex diastolic hemodynamics in health and disease. Time-resolved three-dimensional phase contrast cardiac magnetic resonance imaging with three-directional velocity encoding known as ‘4D flow CMR’ is an emerging technology which allows retrospective measurement of velocity and by extension flow at any point in the acquired 3D data volume. With 4D flow CMR, complex aspects of blood flow and ventricular function can be studied throughout the cardiac cycle. 4D flow CMR can facilitate the visualization of functional blood flow components and flow vortices as well as the quantification of novel hemodynamic and functional parameters such as kinetic energy, relative pressure, energy loss and vorticity. In this review, we examine key concepts and novel markers of diastolic function obtained by flow pattern analysis using 4D flow CMR. We consolidate the existing evidence base to highlight the strengths and limitations of 4D flow CMR techniques in the surveillance and diagnosis of left ventricular diastolic dysfunction.
Left ventricular diastolic dysfunction (LVDD) is characterized by increased ventricular stiffening coupled with impaired myocardial relaxation. Although these processes occur naturally with aging, they are accelerated and worsened in many cardiovascular conditions.
Left ventricular diastolic dysfunction is a major cause of heart failure syndrome in the form of heart failure with preserved ejection fraction (HFpEF), which carries a poor prognosis (1, 2). Due to persistently raised intra chamber pressures and remodeling, it can lead to atrial fibrillation (3), pulmonary hypertension (4) and right ventricular failure (5). As an early marker of cardiac impairment and one that often precedes clinical manifestation of disease, the timely diagnosis of LVDD is important for patient management.
The diagnosis of HFpEF however remains challenging because of a lack of consensus on the assessment of left ventricular (LV) diastolic function, and because our understanding of complex diastolic hemodynamics is incomplete. Furthermore, many patients are incorrectly diagnosed because the symptoms of heart failure may overlap with manifestations of other conditions (e.g., respiratory illness). As a result, there is high need for good imaging assessment of LVDD, to provide a positive reason for diagnosing this condition, and avoid overreliance on symptoms to make the diagnosis of HFpEF.
In this review, we examine a potentially useful diagnostic tool in diastolic heart failure—diastolic left ventricular blood flow assessment with four-dimensional flow cardiac magnetic resonance (4D flow CMR). This is an emerging technology which has the potential not only to improve early detection of LVDD, but also to expand our understanding of diastolic hemodynamics and ventricular function by going beyond the conventional parameters of LV diastolic function.
Echocardiography has traditionally been the modality of choice for non-invasive assessment of LV diastolic function. Current American Society of Echocardiography (ASE) and European Association of Cardiovascular imaging (EACVI) guidelines (6) recommend a combination of myocardial and blood flow velocities to diagnose LVDD, using measurements of trans-mitral, mitral annular and tricuspid regurgitation velocities. The presence of atrial dilatation and abnormal pulmonary venous flow can further support the diagnosis of LVDD. Newer techniques such as strain rate imaging and three-dimensional (3D) echo can also provide additional information on LV diastolic function. Although echocardiography is well-validated for LVDD diagnosis and has obvious practical benefits, measurement accuracy is vulnerable to inter-operator variability and suboptimal acoustic windows (e.g., due to patient body habitus or comorbidities). Furthermore, the accuracy of one of the important parameters for assessing LVDD (E/e′) is very dependent on good alignment of the Doppler beam with the long axis of the left ventricular walls and mitral valve, which is often difficult to achieve. Even when echocardiographic measurements are of sufficient quality and accuracy, conflicting results in LV diastolic function parameters (some within normal range, whilst others are pathological) and a large ‘intermediate’ range of values (between normal and abnormal) contribute to a large proportion of patients being classified as having ‘indeterminate’ diastolic function according to current EACVI/ASE algorithms (7).
Cardiac magnetic resonance (CMR) is recognized as the gold standard modality for measurement of cardiac chamber dimensions, volumes, and systolic function, but it can also be used to assess LV diastolic function. Two-dimensional phase contrast CMR (referred to as “2D PC-CMR” for the purpose of this review) measurements of trans-mitral, mitral annular and pulmonary venous velocities, as well as flow, enable diagnosis and assessment of LVDD (8). Diastolic function may also be assessed using 3D volumetric assessment of diastolic LV filling (9) and by strain imaging (10). Combined with advanced techniques such as tissue characterization, the sensitivity of CMR to diagnose important underlying etiologies such as hypertrophic cardiomyopathy (11) and cardiac amyloidosis is enhanced (12). Despite these complimentary approaches to echocardiography, there is currently no universally accepted approach for assessing LV diastolic function on CMR. Velocity/flow measurement using both echocardiography and 2D-PC CMR are further constrained to a single direction and plane. This results in an inability to fully characterize blood flow dynamics, since blood flow is a three-dimensional phenomenon in constant motion, with different velocities, directions, and acceleration at different times during the cardiac cycle.
Four-dimensional flow cardiac MRI (4D flow CMR) involves the acquisition of time-resolved three-dimensional phase contrast imaging with three-directional velocity encoding (13, 14). With the time resolved 3D velocity data obtained, complex aspects of blood flow and myocardial function can be studied throughout the cardiac cycle.
Using 4D flow CMR, the velocity vector is measured everywhere in a 3D volume over the cardiac cycle allowing the retrospective creation of velocity maps, and by extension flow, at any point in the acquired 3D data volume (14, 15). 4D flow CMR can therefore facilitate the quantification of complex hemodynamic and functional parameters such as kinetic energy, relative pressure, energy loss and vorticity.
In the past decade with greater experience and advances in acquisition techniques, post processing and analysis, 4D flow CMR has become more feasible and clinically relevant as summarized by Crandon et al. (16) and Demirkiran et al. (17). Image acquisition can be performed using free breathing techniques, and 4D flow CMR has shown good reproducibility (18, 19) with proven reliability when compared to 2D PC-CMR and echo (20–22).
In terms of assessment of LV diastolic function, 4D flow techniques such as retrospective valve tracking, can be used to accurately measure conventional flow parameters of LV diastolic function such as mitral inflow velocities with good correlation with echocardiographic measurements (21, 23, 24). More recently, novel and more complex flow pattern-based parameters have also been used to study diastolic flow hemodynamics. This review is the first to focus on diastolic flow pattern analysis using 4D flow CMR and its potential clinical application.
Many different flow pattern-based parameters have been explored by 4D flow CMR studies for more in-depth evaluation of LV diastolic flow hemodynamics and diastolic function (Figure 1). Additionally, as 4D flow CMR enables voxel wise mapping of many of these novel parameters (e.g., kinetic energy and vorticity), they can be used to analyze localized flow patterns allowing focused study of specific regions such as the left ventricular outflow tract (LVOT) (25, 26). A summary of the studies of LV flow patterns divided based on analysis of global flow, vortex flow or (functional) component flow provides a useful reference framework (summarized in Tables 1–6).
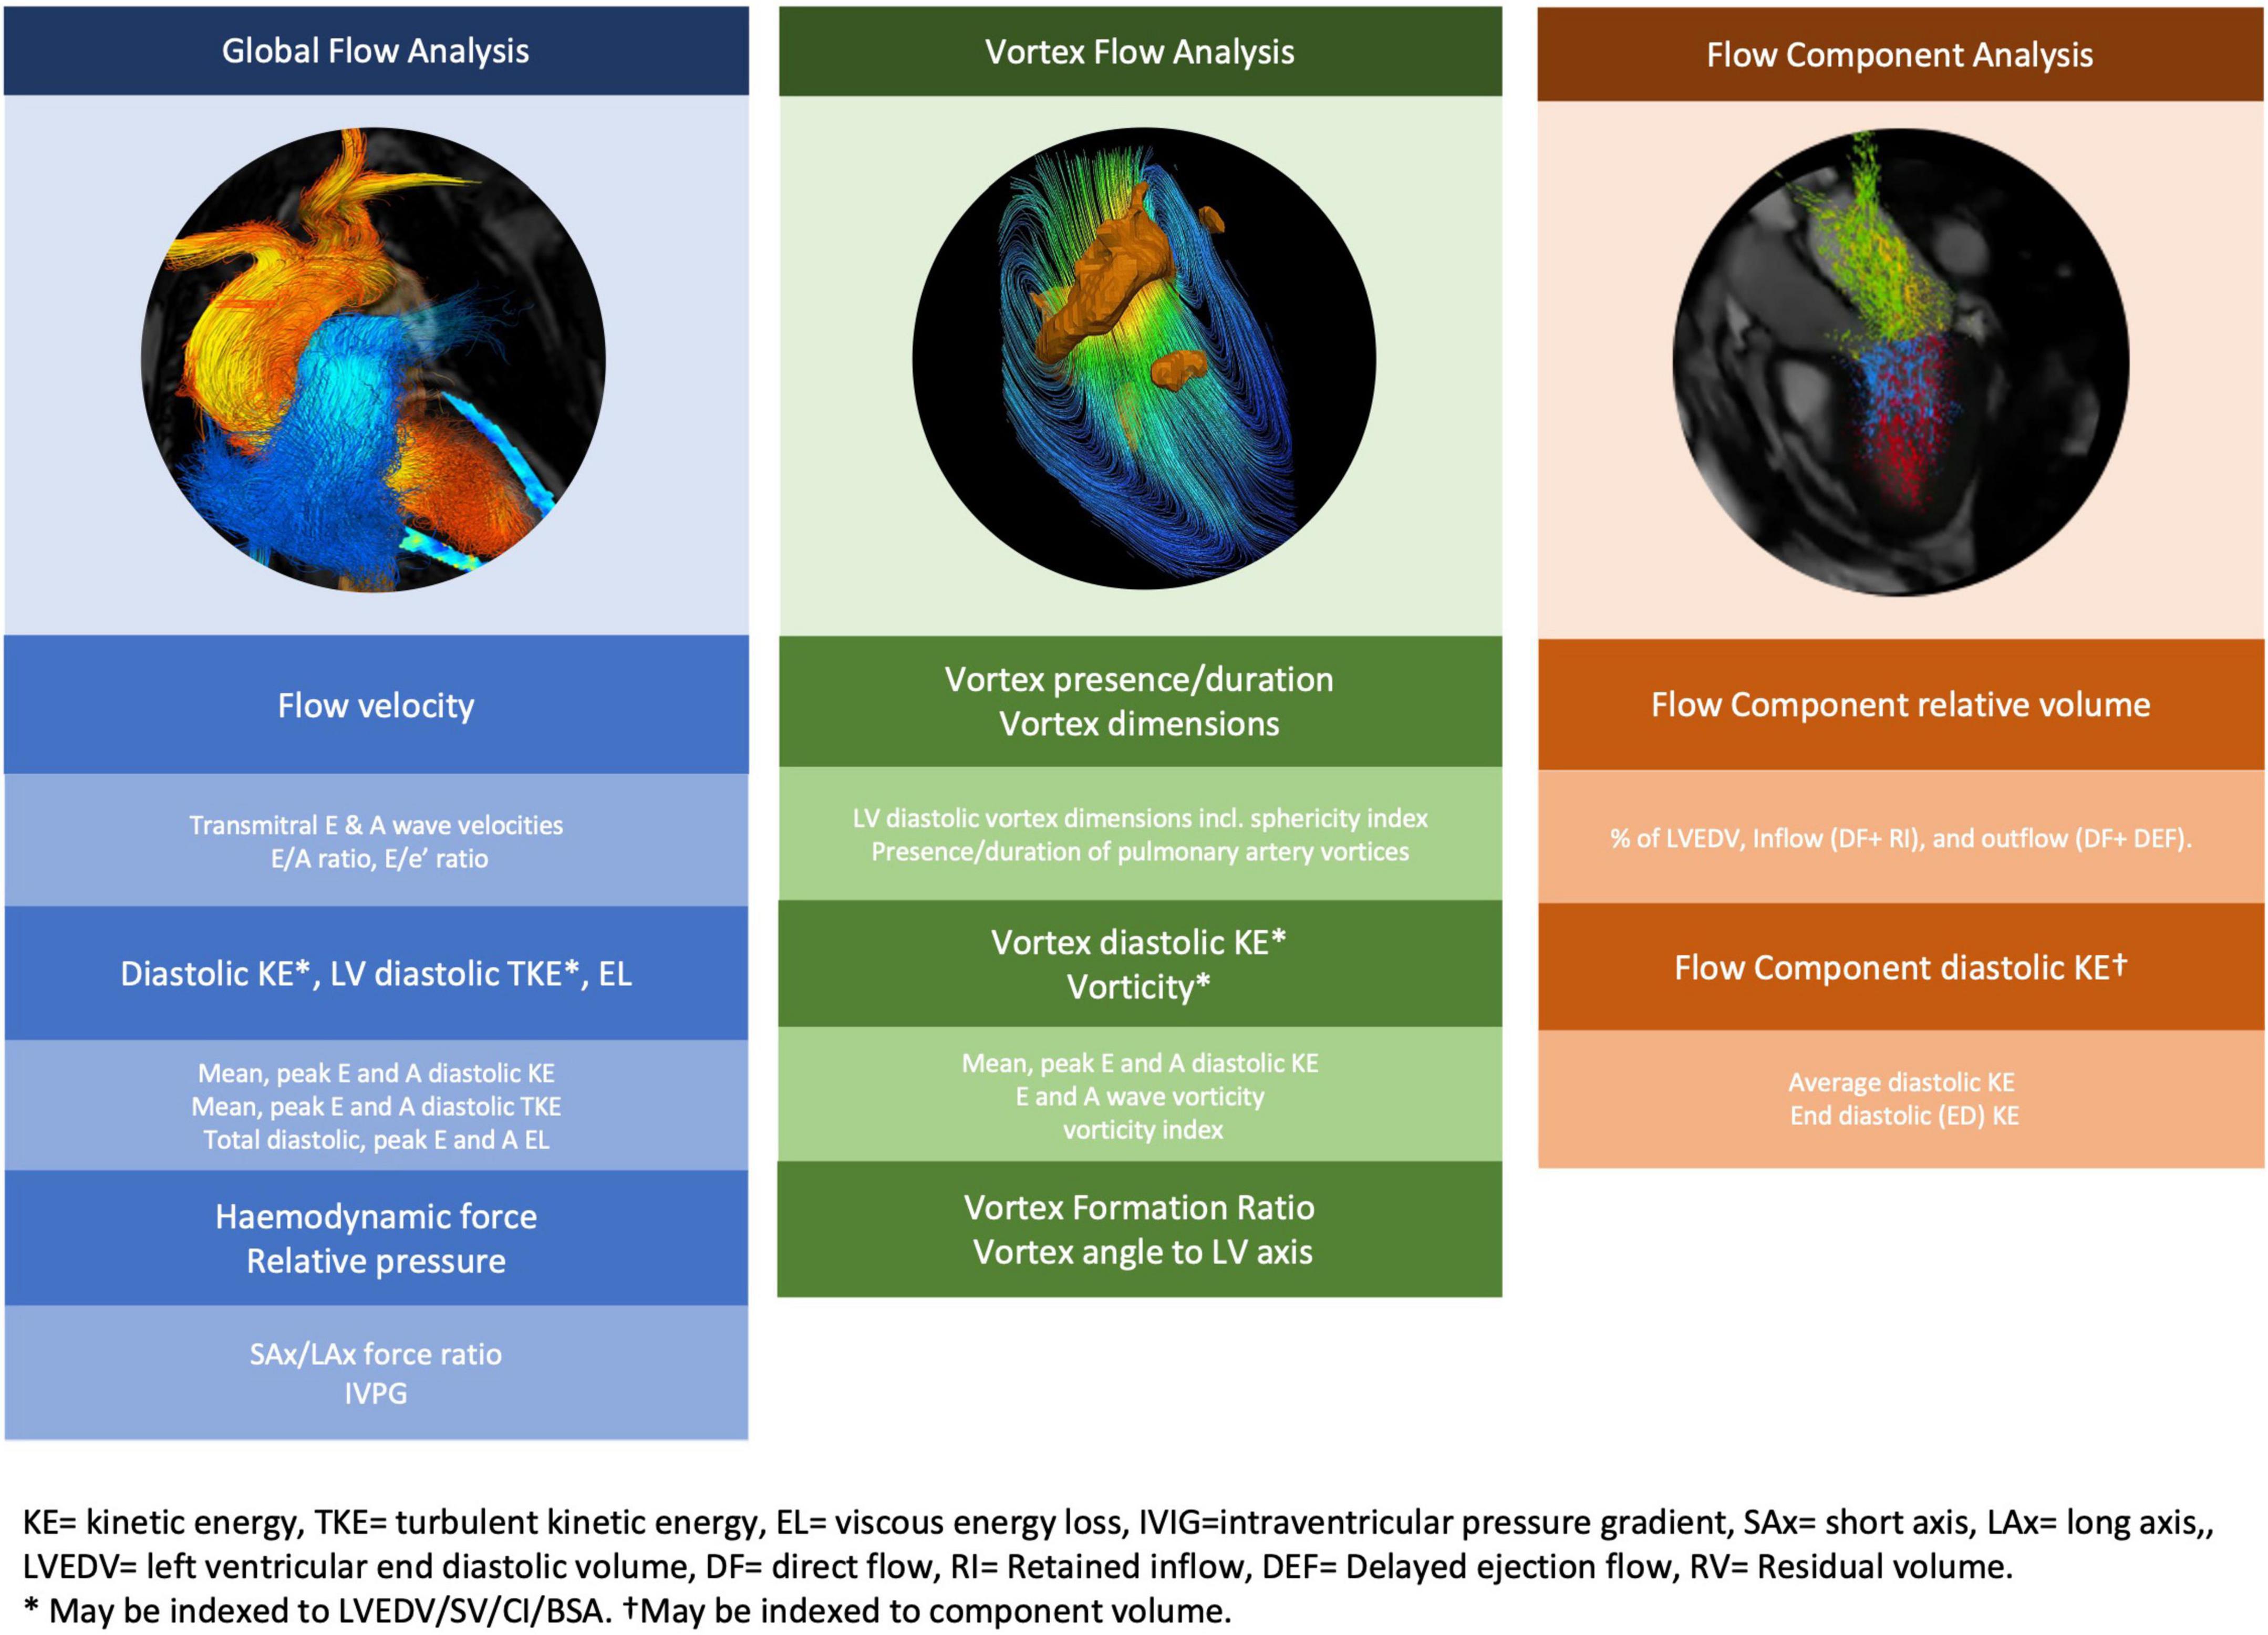
Figure 1. Novel 4D flow CMR parameters of left ventricular diastolic function. Novel 4D flow CMR parameters are obtained from analysis of global flow, vortex flow and/or functional flow components.
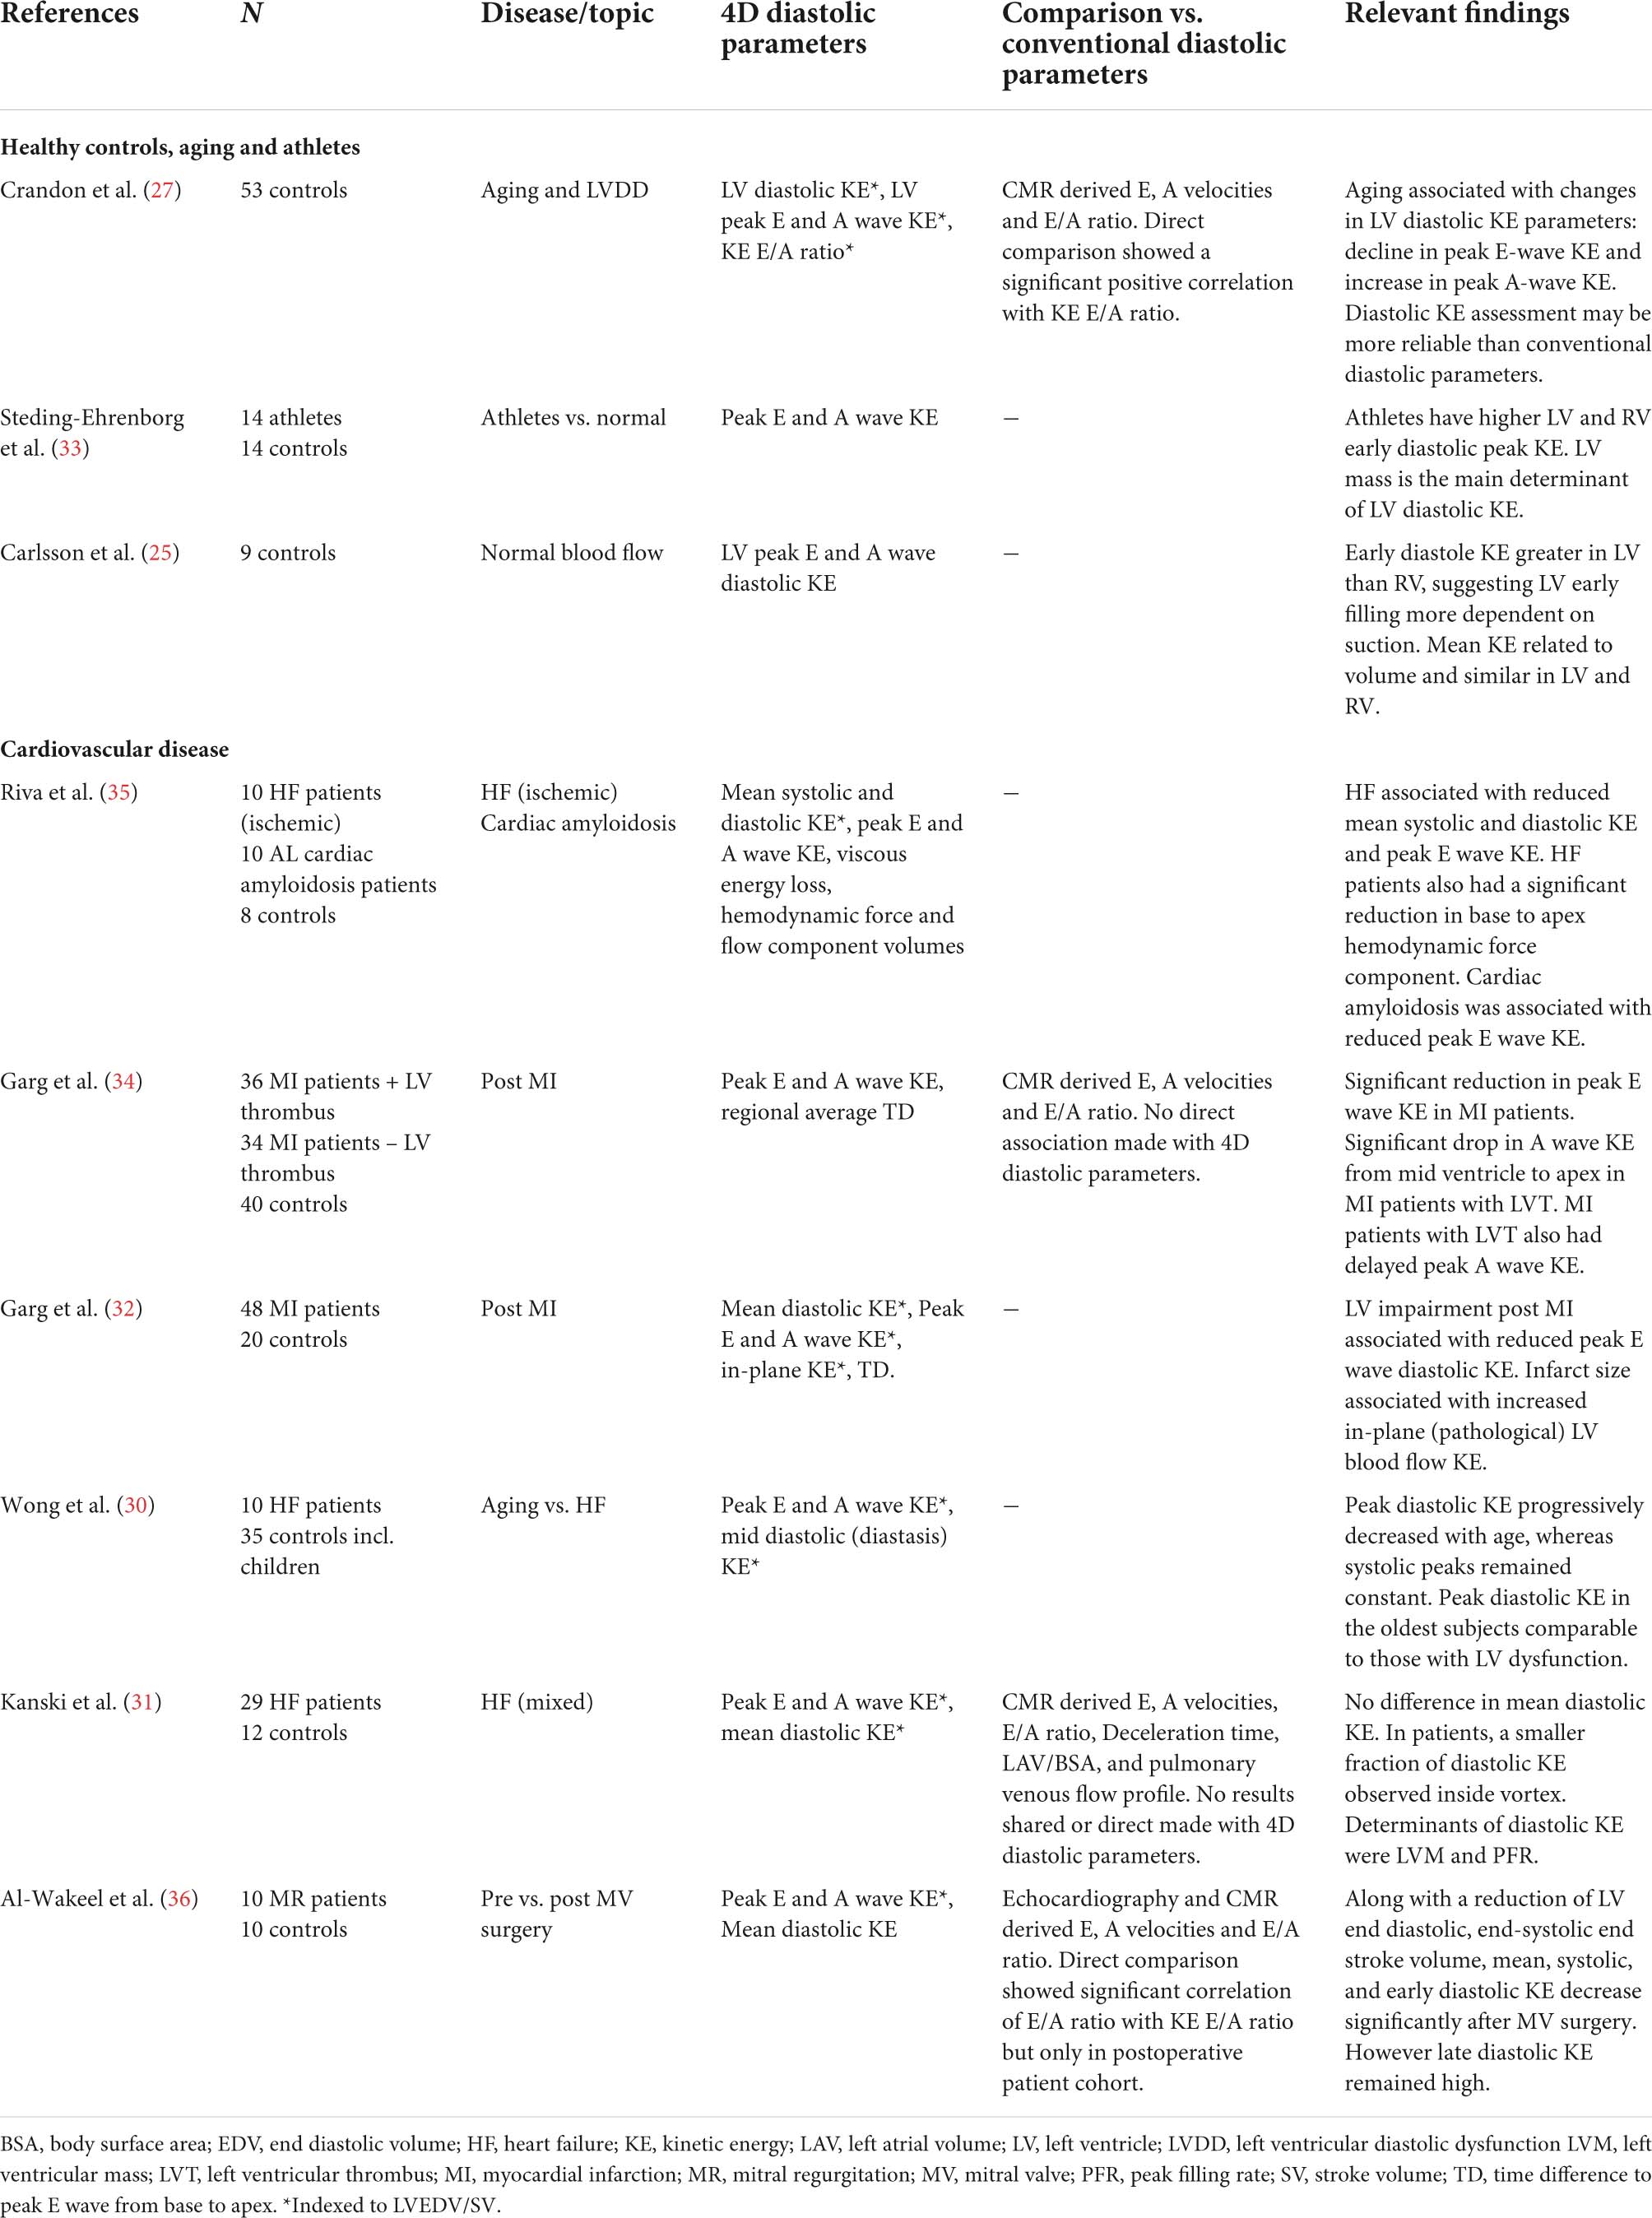
Table 1. Four-dimensional flow CMR studies assessing left ventricular diastolic function using global flow diastolic KE.
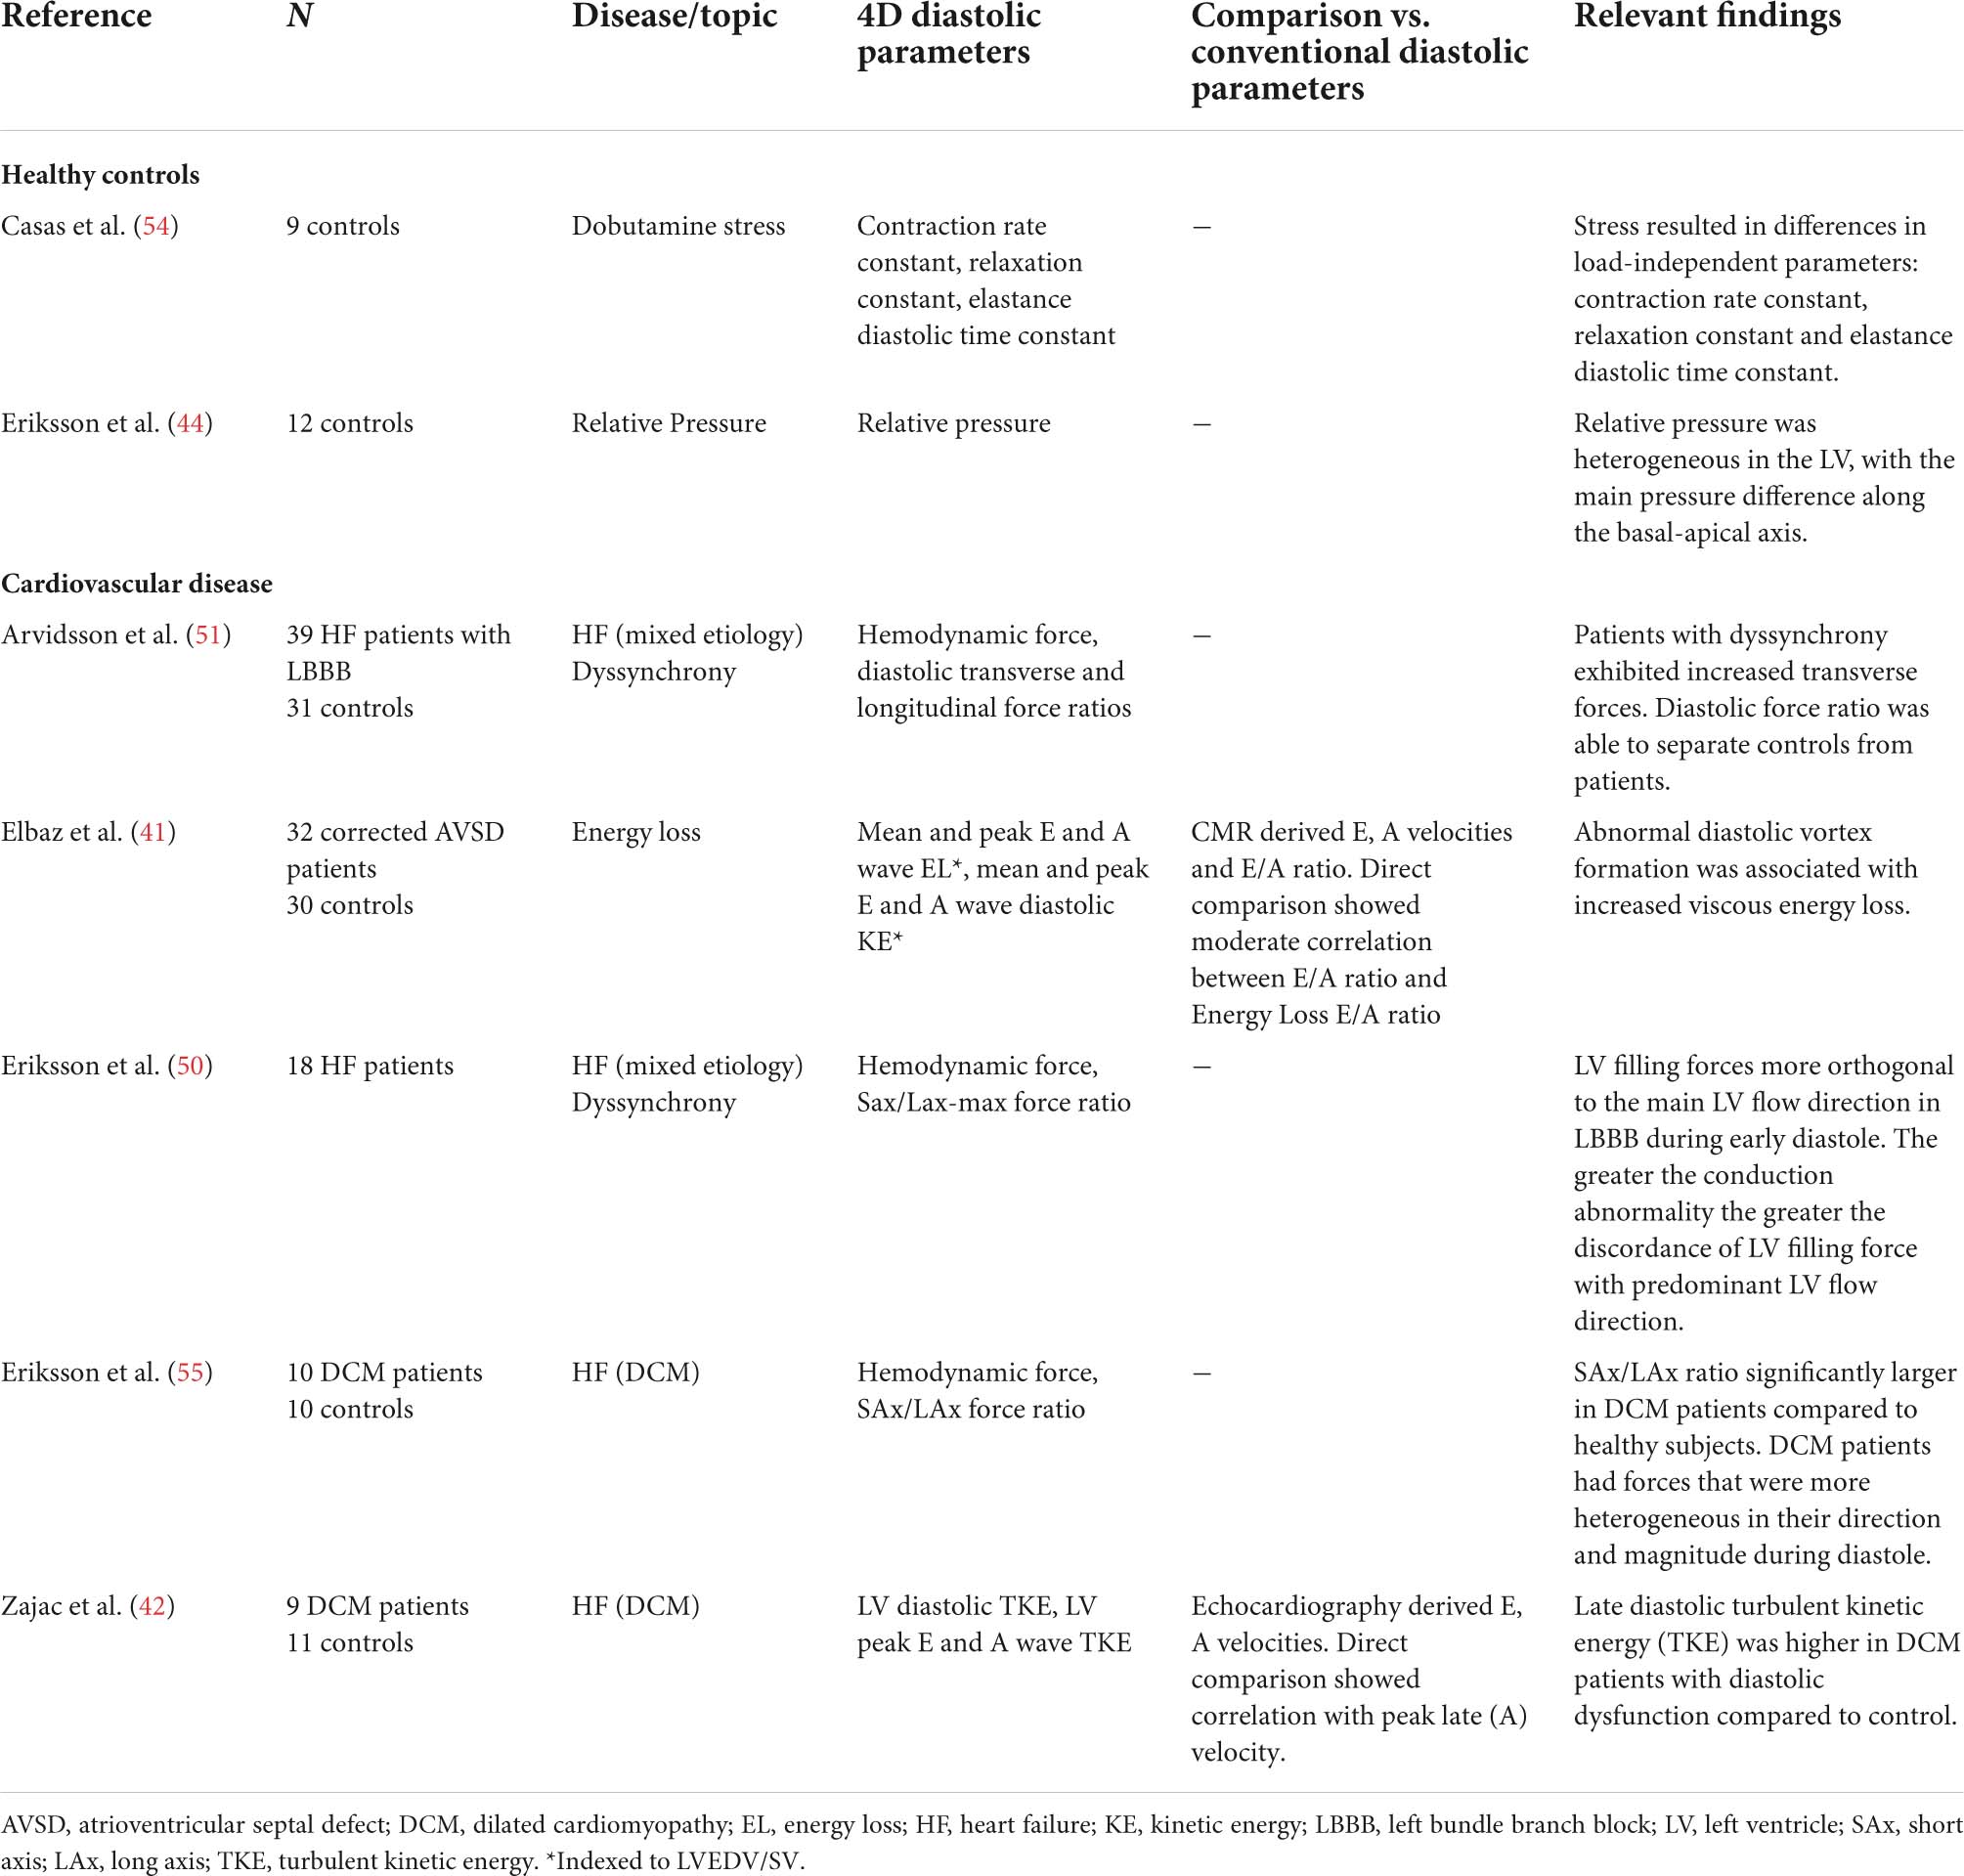
Table 2. Four-dimensional flow CMR studies assessing left ventricular diastolic function using other novel 4D global flow parameters.
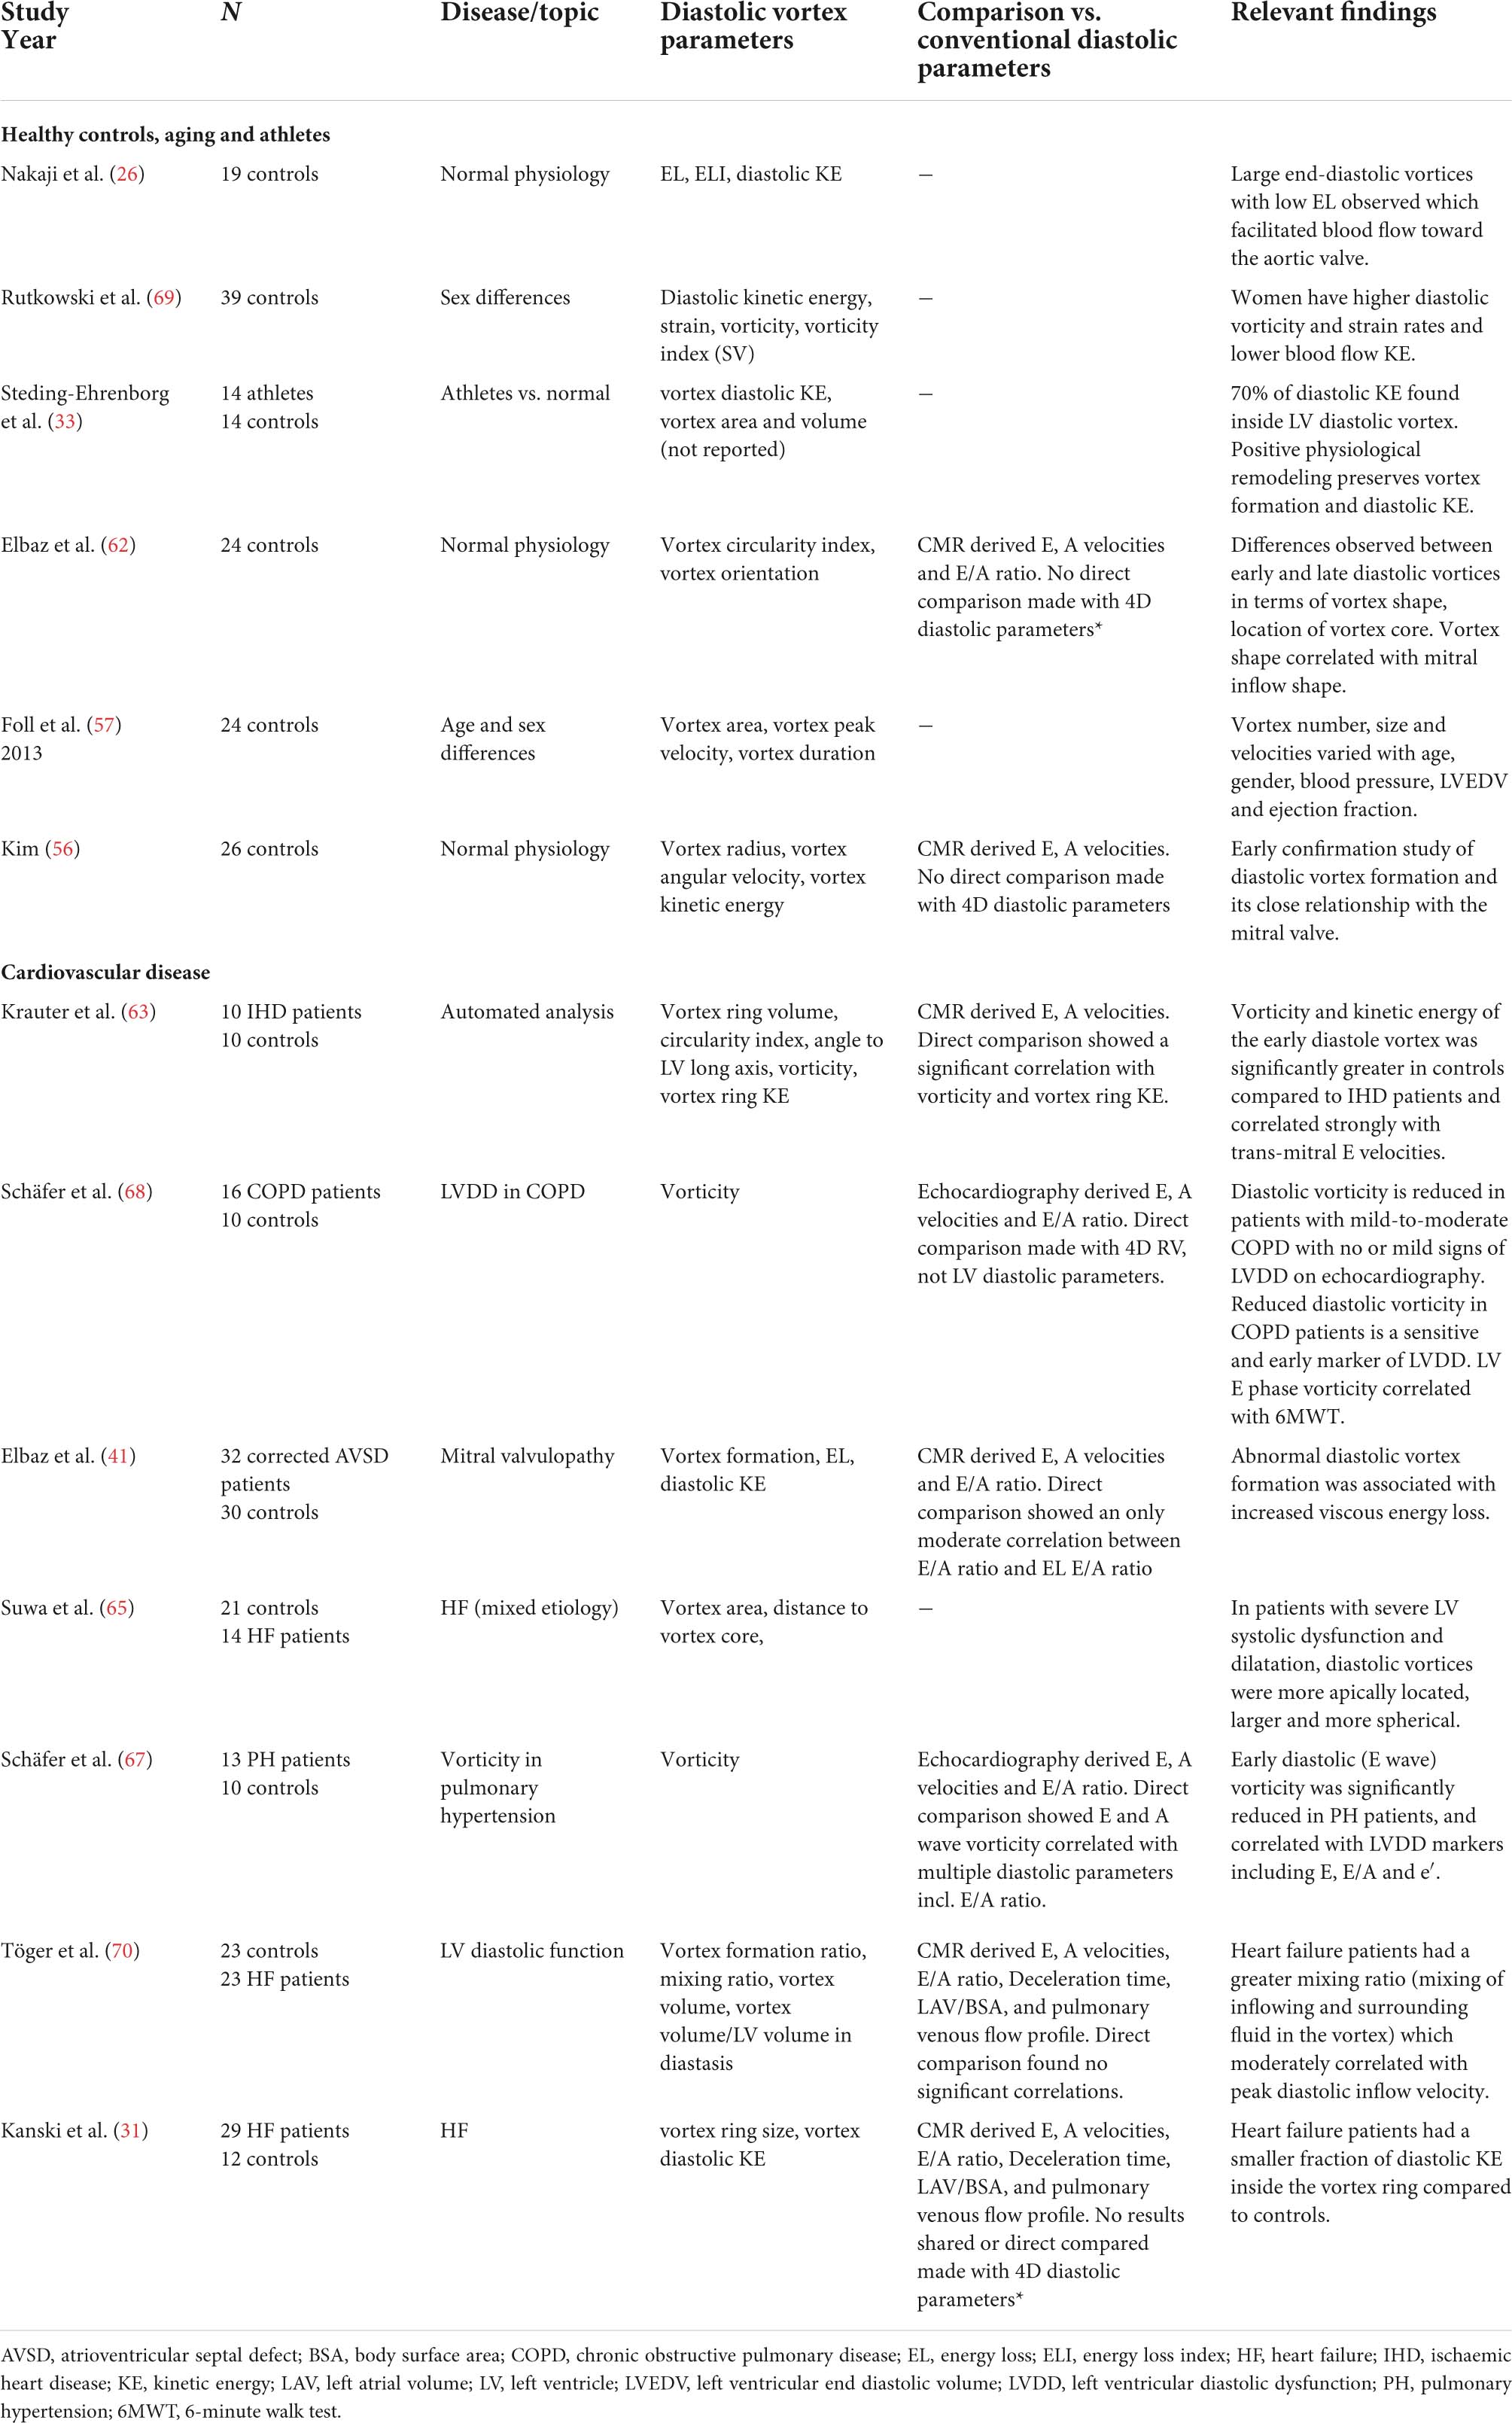
Table 3. Four-dimensional flow CMR studies assessing left ventricular diastolic function using vortex flow analysis.
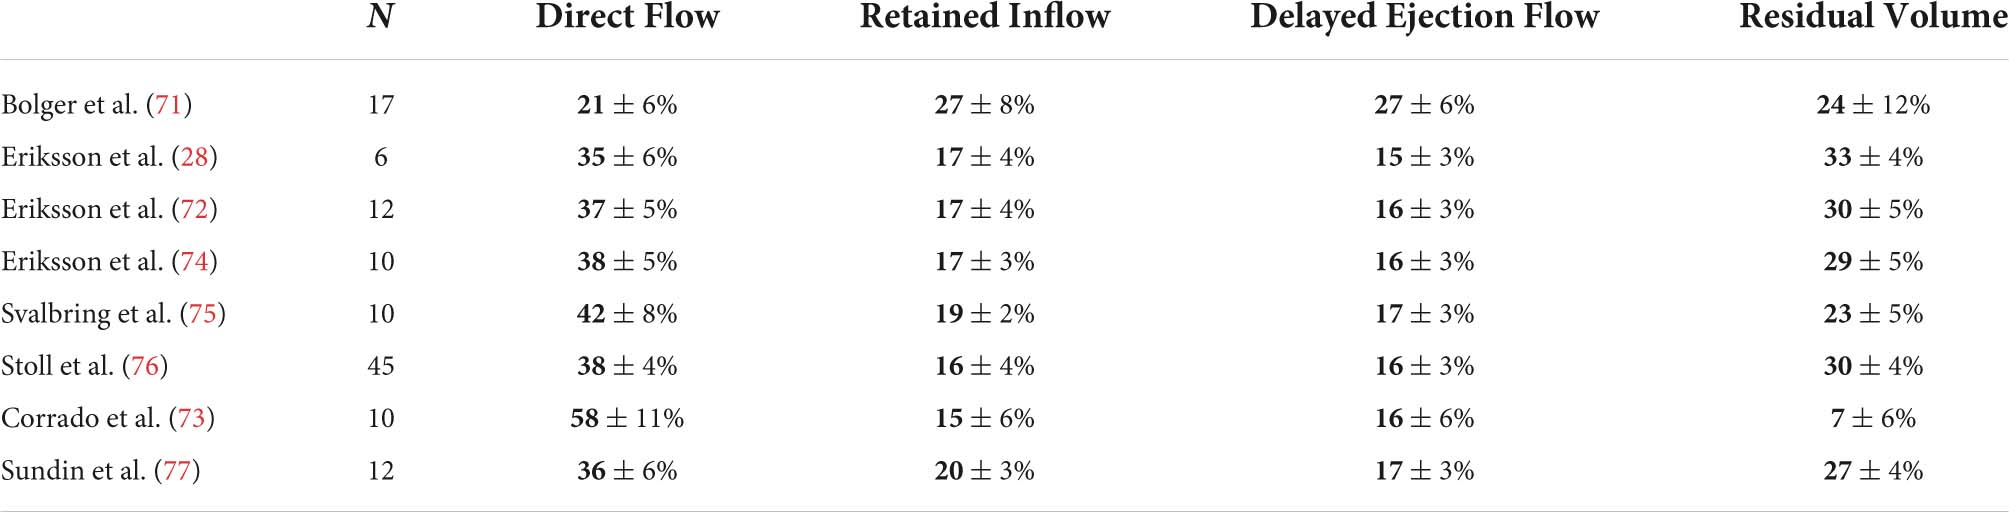
Table 4. Flow components as percentage of LVEDV in healthy controls.
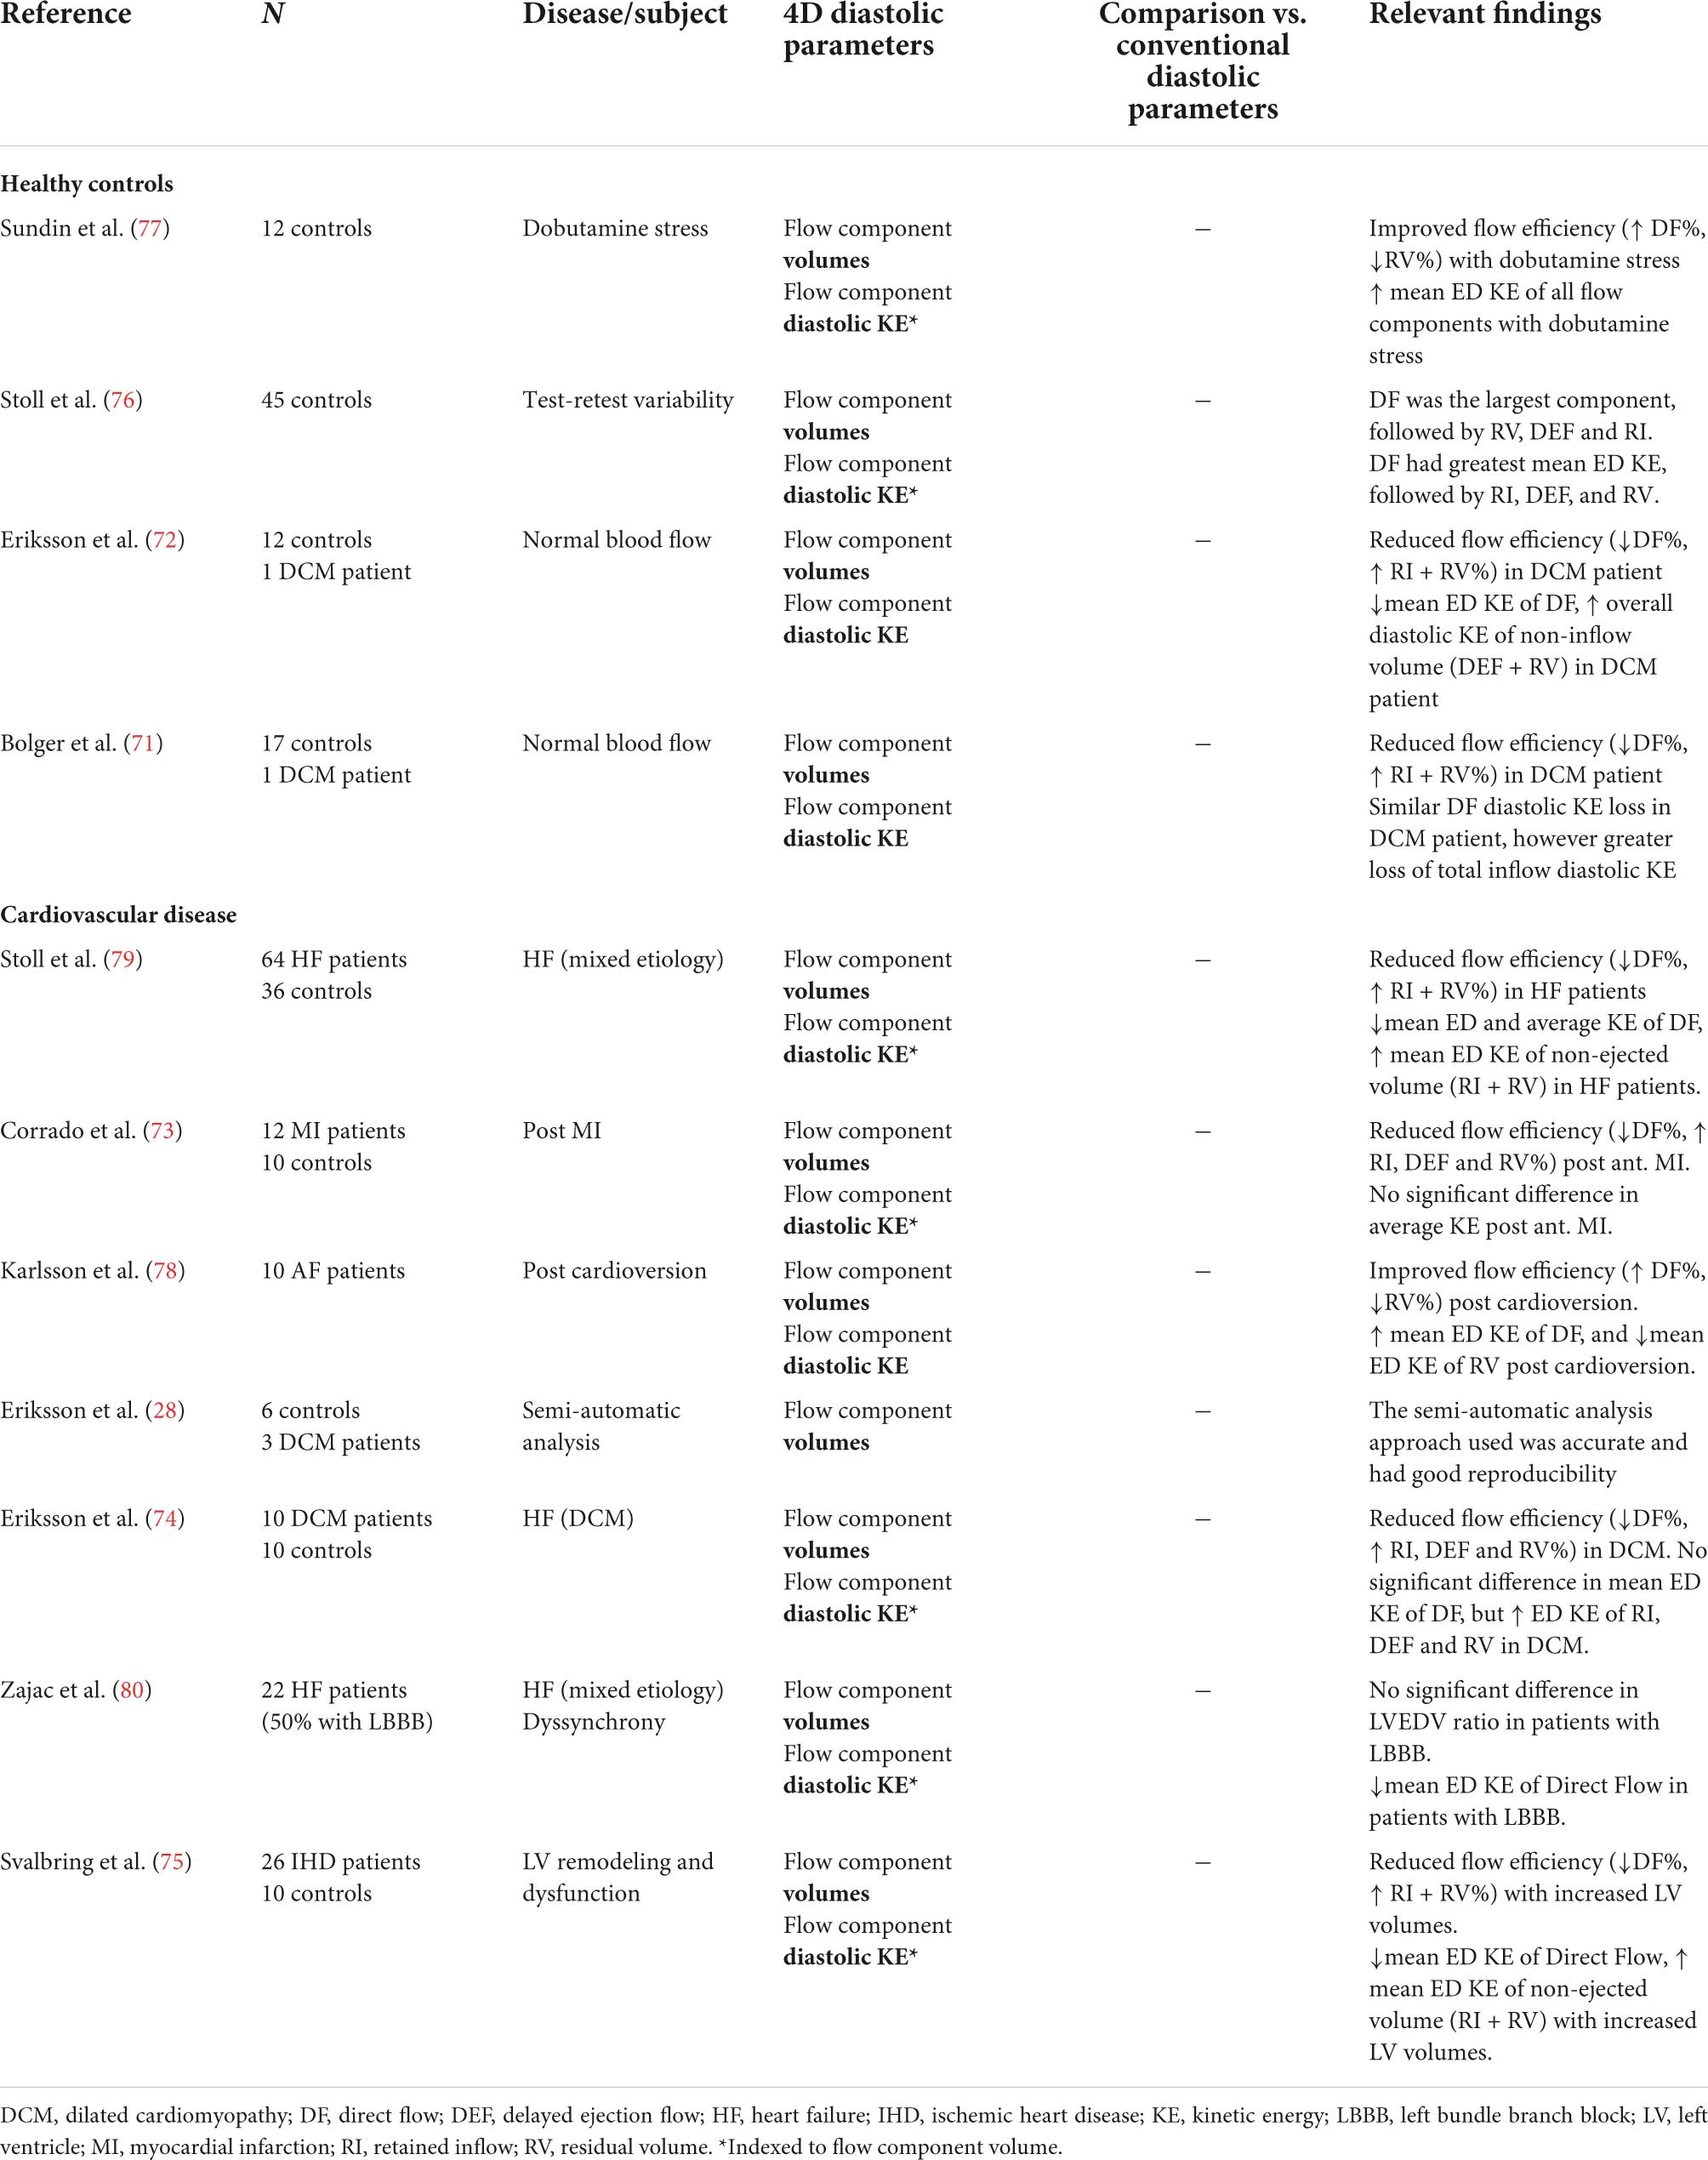
Table 5. Four-dimensional flow CMR studies assessing eft ventricular diastolic function using flow component analysis.
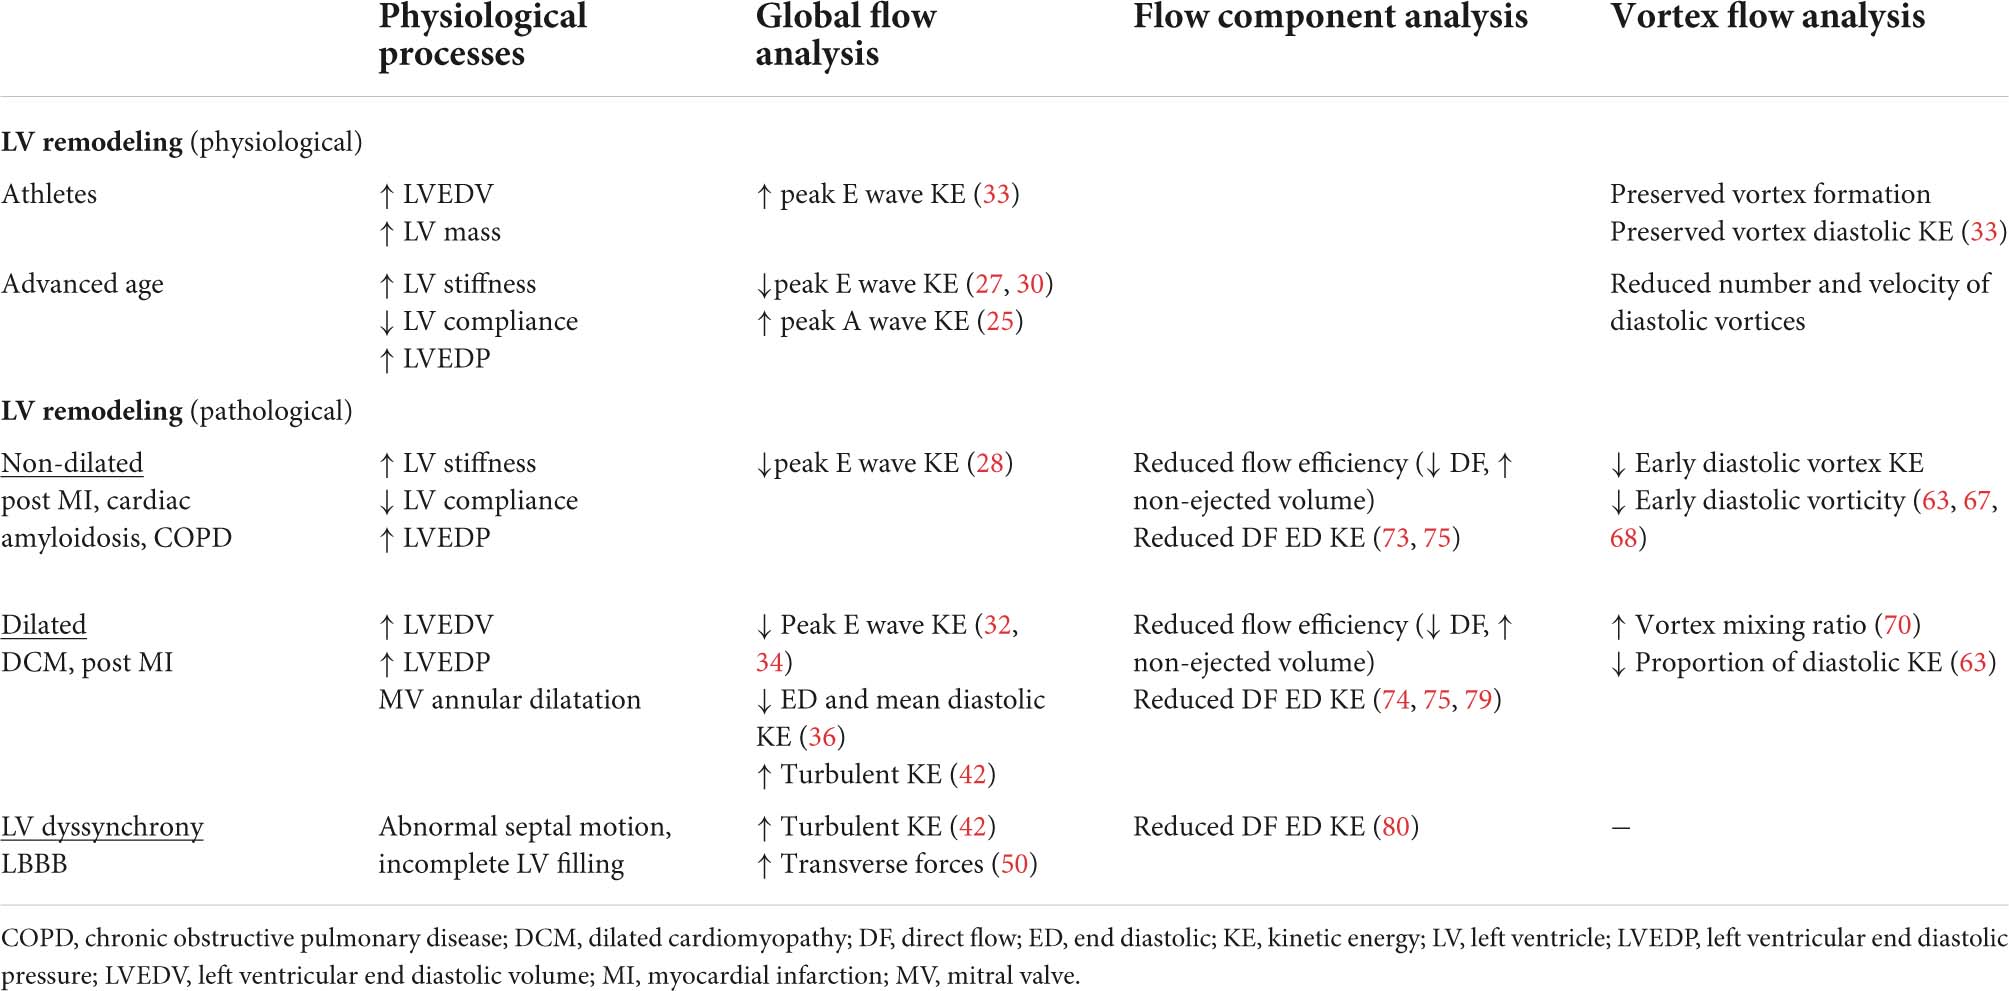
Table 6. Cardiac states and associated left ventricular diastolic flow features on 4D flow CMR.
As the LV actively expands in diastole and ‘sucks’ blood in from the left atrium, it confers kinetic energy and pressure to the blood. Based on Newton’s second Law of Motion, blood flow kinetic energy (KE) can be calculated using the equation:
(Where mass = mean density of blood (1060 g/mm3) × voxel volume).
Kinetic energy can be computed directly for the velocity in every voxel throughout the cardiac cycle and is typically summed over the whole left ventricle and indexed against left ventricular end diastolic volume (LVEDV) or stroke volume (SV) to negate the influence of heart size.
The conservation or loss of kinetic energy during diastole (diastolic KE) is thought to be a more reliable and direct marker of diastolic work than other parameters such as mitral inflow and myocardial velocity (27). Moreover, semi-automatic methods can now obtain KE values with a high degree of reproducibility and accuracy (27–29), and they have been proven to correlate with mitral inflow and annular velocity (27, 30).
In normal hearts there are 3 KE peaks (25, 31, 32), corresponding to the velocity peaks on trans-mitral Doppler echocardiography. These occur in mid-systole, early diastole (also referred to as the ‘E wave,’ representing rapid ventricular filling) and end/late diastole (also referred to as the ‘A wave,’ corresponding to atrial systole). In the LV, early diastole generates the highest KE peak—a reminder that ventricular relaxation is an active process (27, 32). In contrast, the highest peak in the right ventricle (RV) occurs during systole, suggesting that LV filling (diastole) may require greater myocardial work than systole, in contrast to RV filling (25, 33).
Steding-Ehrenborg et al. (33) found that athletes were able to generate higher diastolic KE peaks compared with controls despite no difference in mean diastolic KE. They, as well as others (31), found that the main determinant of the early diastolic KE peak was LV mass. Therefore, the greater the amount of healthy myocardium, the greater the strength of active diastolic relaxation and by extension LV diastolic KE. As of yet, LV diastolic KE has not been studied in patients with pathological hypertrophy such as seen in hypertrophic cardiomyopathy (HCM), which may involve a different relationship to diastolic KE.
Several studies have assessed the effects of age on diastolic KE. Early diastolic peak KE declines with age (27, 30) (Figure 2) with values in the elderly comparable to patient with LV impairment (30). This may be explained by worsening LV compliance and increased stiffness with age. In a study by Crandon et al. (27), there was both a decrease in early diastolic kinetic energy and compensatory increase in late diastolic KE with age, resulting in a reduced KE E/A ratio mirroring changes seen with LVDD in Doppler measurements of the E/A ratio.
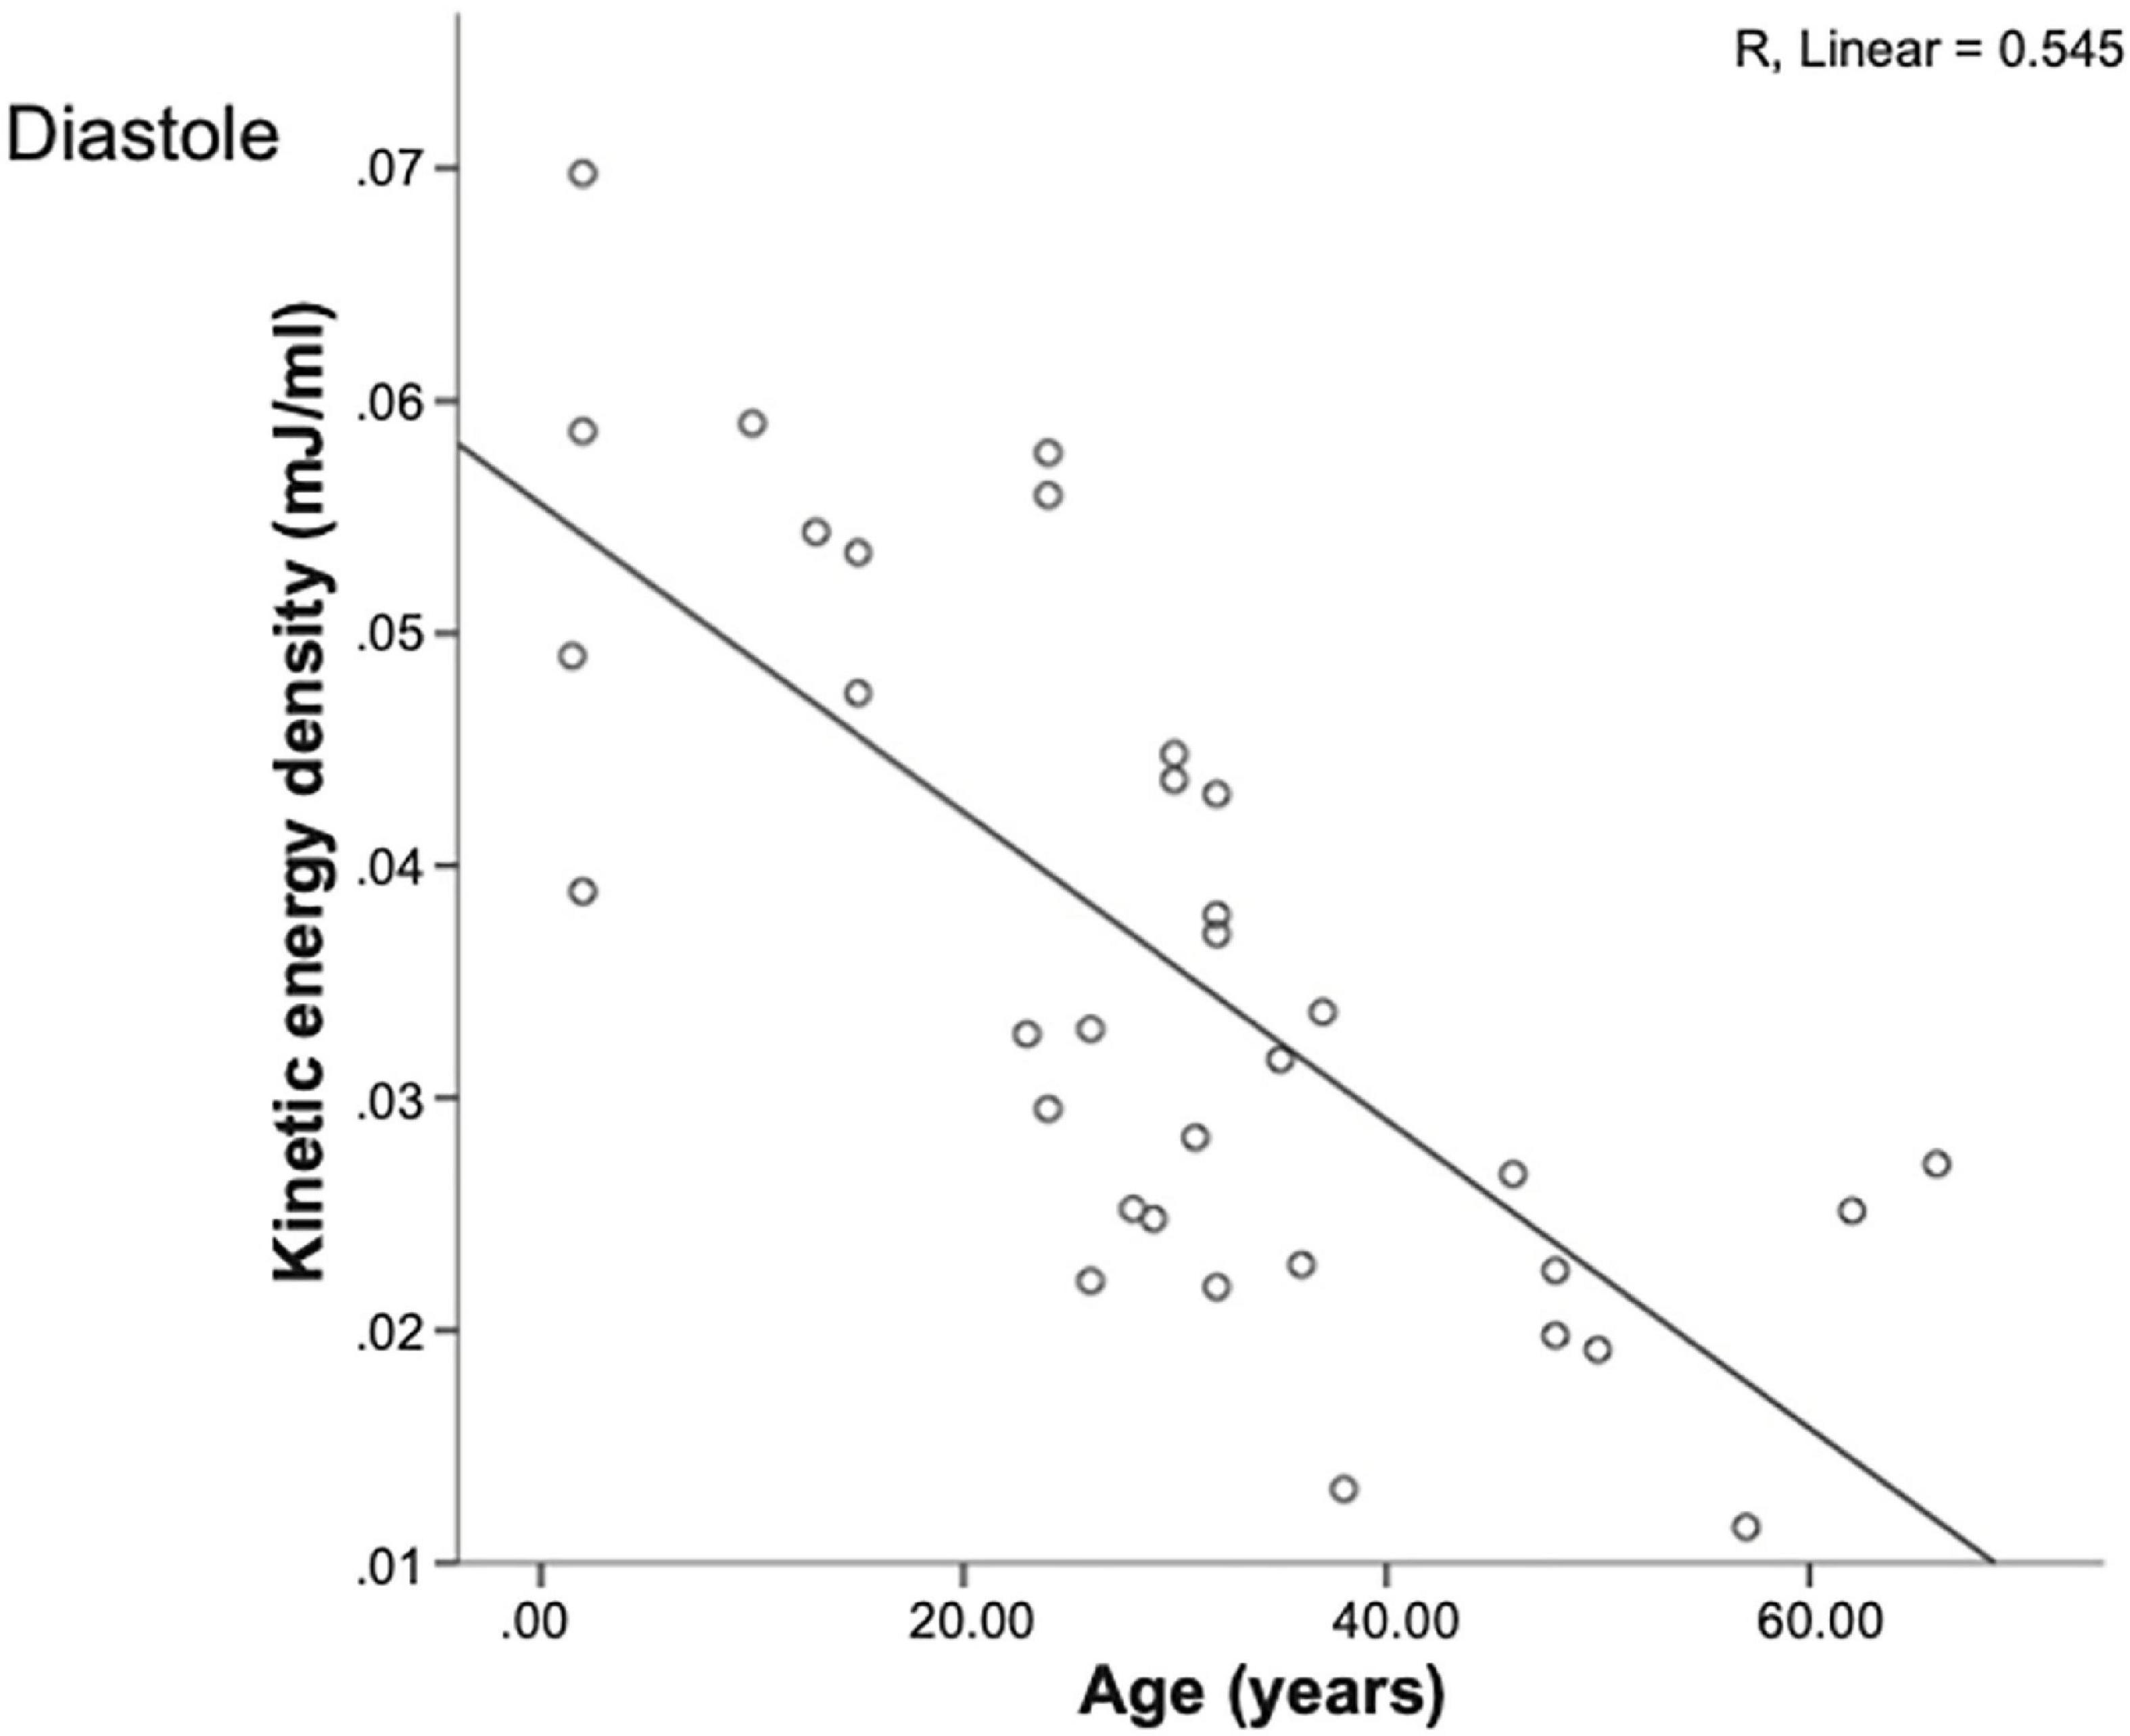
Figure 2. Peak left ventricular KE/ml in early diastole for healthy individuals with age (30). Early diastolic peak left ventricular KE/ml (generated during active relaxation) declines with increasing age.
Several studies have also assessed diastolic KE in heart failure patients (Table 1) (30, 31, 34). Left ventricular systolic dysfunction (LVSD) is associated with a reduction in both systolic and diastolic KE. Garg et al. (34) compared KE parameters (indexed to LVEDV) of patients with significant LVSD post myocardial infarction (MI) against healthy controls. Patients demonstrated a reduction in average KE as well as peak early diastolic KE values (Figure 3). Of note, an earlier study by Garg et al. (32) found that MI patients with preserved systolic function also had reduced peak E wave (early) diastolic KE – early evidence of the diastolic dysfunction that can occur post MI. A significant reduction in peak E wave KE was also observed in patients with cardiac amyloidosis (35), a condition characterized by diastolic dysfunction and heart failure with preserved ejection fraction.
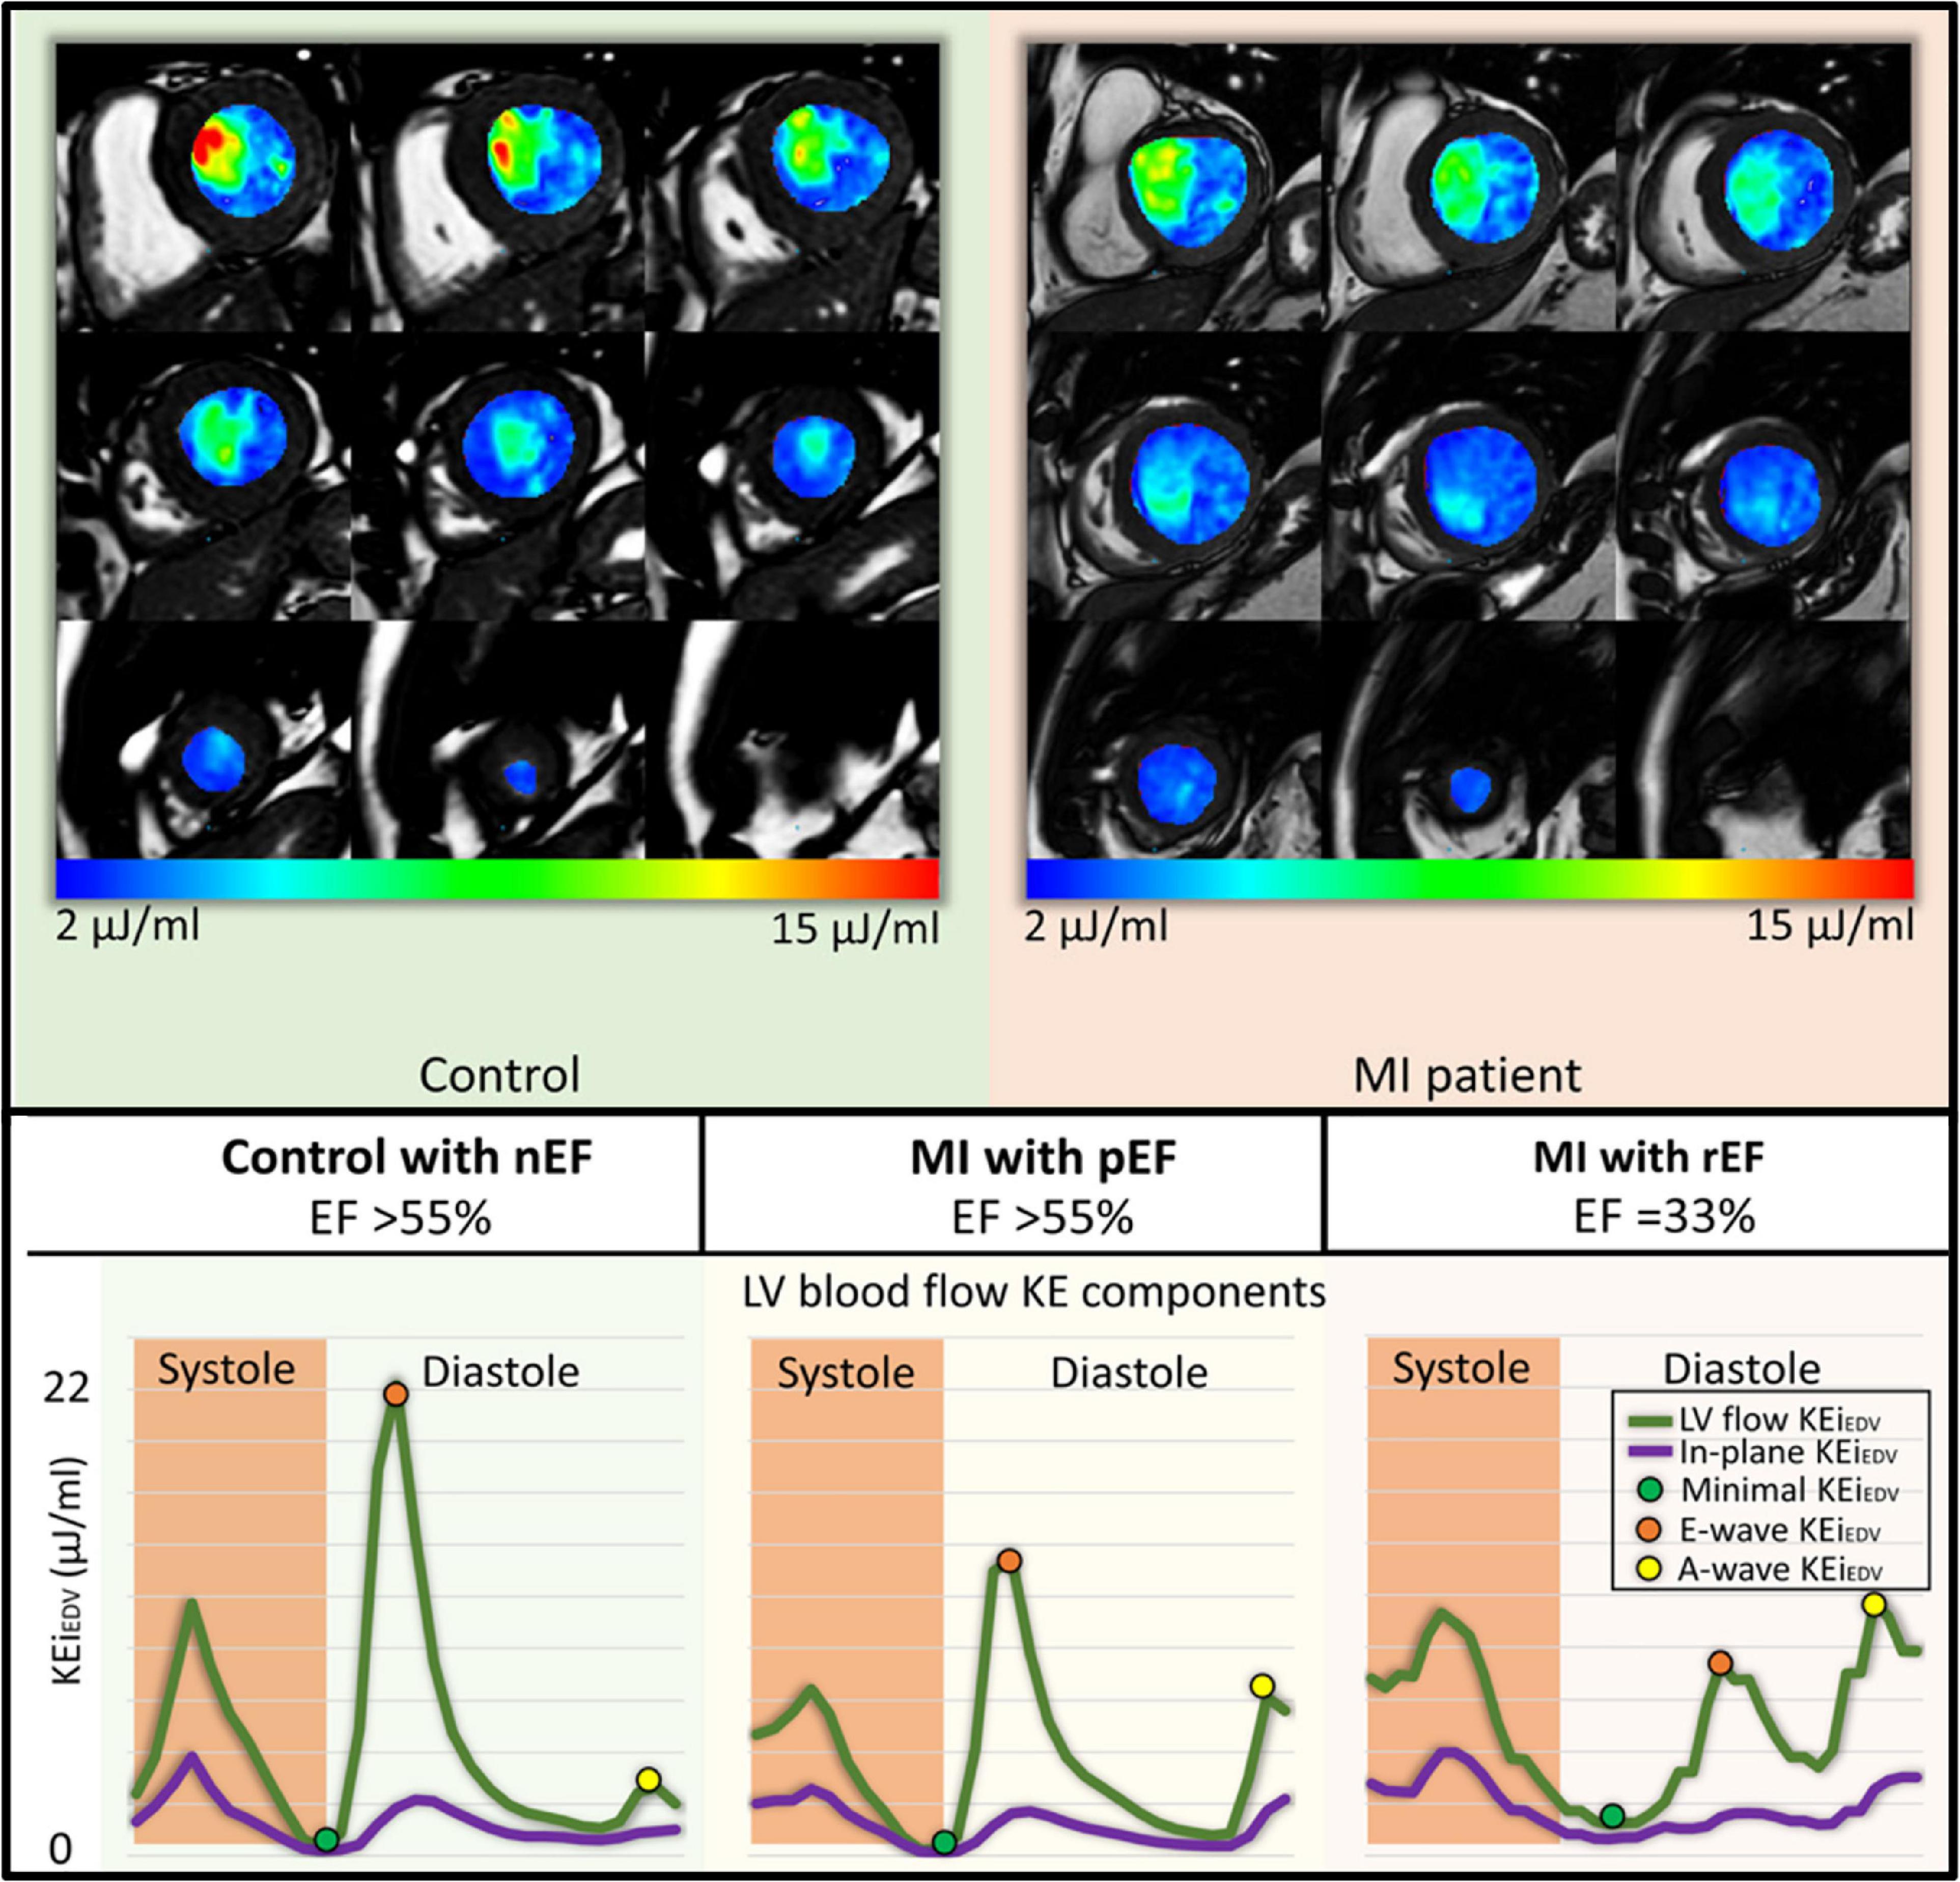
Figure 3. Left ventricular kinetic energy maps in a control and an MI patient (Top). Kinetic energy curves in a control and two MI patients with preserved left ventricular ejection fraction (pEF) and reduced left ventricular ejection fraction (rEF) showing reduced peak E-wave KE (Bottom) (32).
Only one study has examined diastolic KE in the context of valvular heart disease. Al-Wakeel et al. (36) compared patients with severe mitral regurgitation (MR)—pre and post mitral valve (MV) surgery—with health volunteers. Compared with volunteers, preoperative patients demonstrated significantly greater mean LV KE, as well as early and late diastolic peak KE, though not when indexed to LV blood volume. After surgery, the expected reduction in LV volume and stroke volume resulted in a significant reduction in mean LV KE, systolic KE, and early diastolic KE (comparable to controls), confirming previously described interdependence of diastolic KE on LV volume. In contrast late diastolic KE in patients did not decrease post-operatively relative to controls, an observation that may have been due to age differences between patient and control groups.
Not all the energy from myocardial relaxation is transferred into blood flow kinetic energy. Viscous Energy Loss (EL) represents the energy lost to heat (due to friction of blood against the ventricular wall), and Turbulent Kinetic Energy (TKE) refers to energy dissipated into small turbulent eddies. Both parameters are novel markers of flow inefficiency but have so far mostly been used to study energy loss in the context of congenital heart disease (37, 38) and aortic valvulopathy (39, 40).
Energy loss has been examined in a single study focusing on LV diastolic function (41) (Table 2). In this study by Elbaz et al., patients with altered mitral valve morphology secondary to atrioventricular septal defect (AVSD) closure (and consequently abnormal diastolic vortex formation), had significantly greater diastolic energy loss compared with healthy volunteers.
Zajac et al. (42) compared the TKE of healthy volunteers and patients with varying degrees of LVDD secondary to dilated cardiomyopathy (DCM). They found that unlike normal controls, in DCM patients there was a trend toward higher LV TKE values with increasing LV volume (Figure 4). DCM patients also had significantly greater late diastolic TKE values which the authors hypothesized may reflect increased turbulence as inflowing blood encounters high LV end diastolic pressure (LVEDP) typically seen in LVDD.
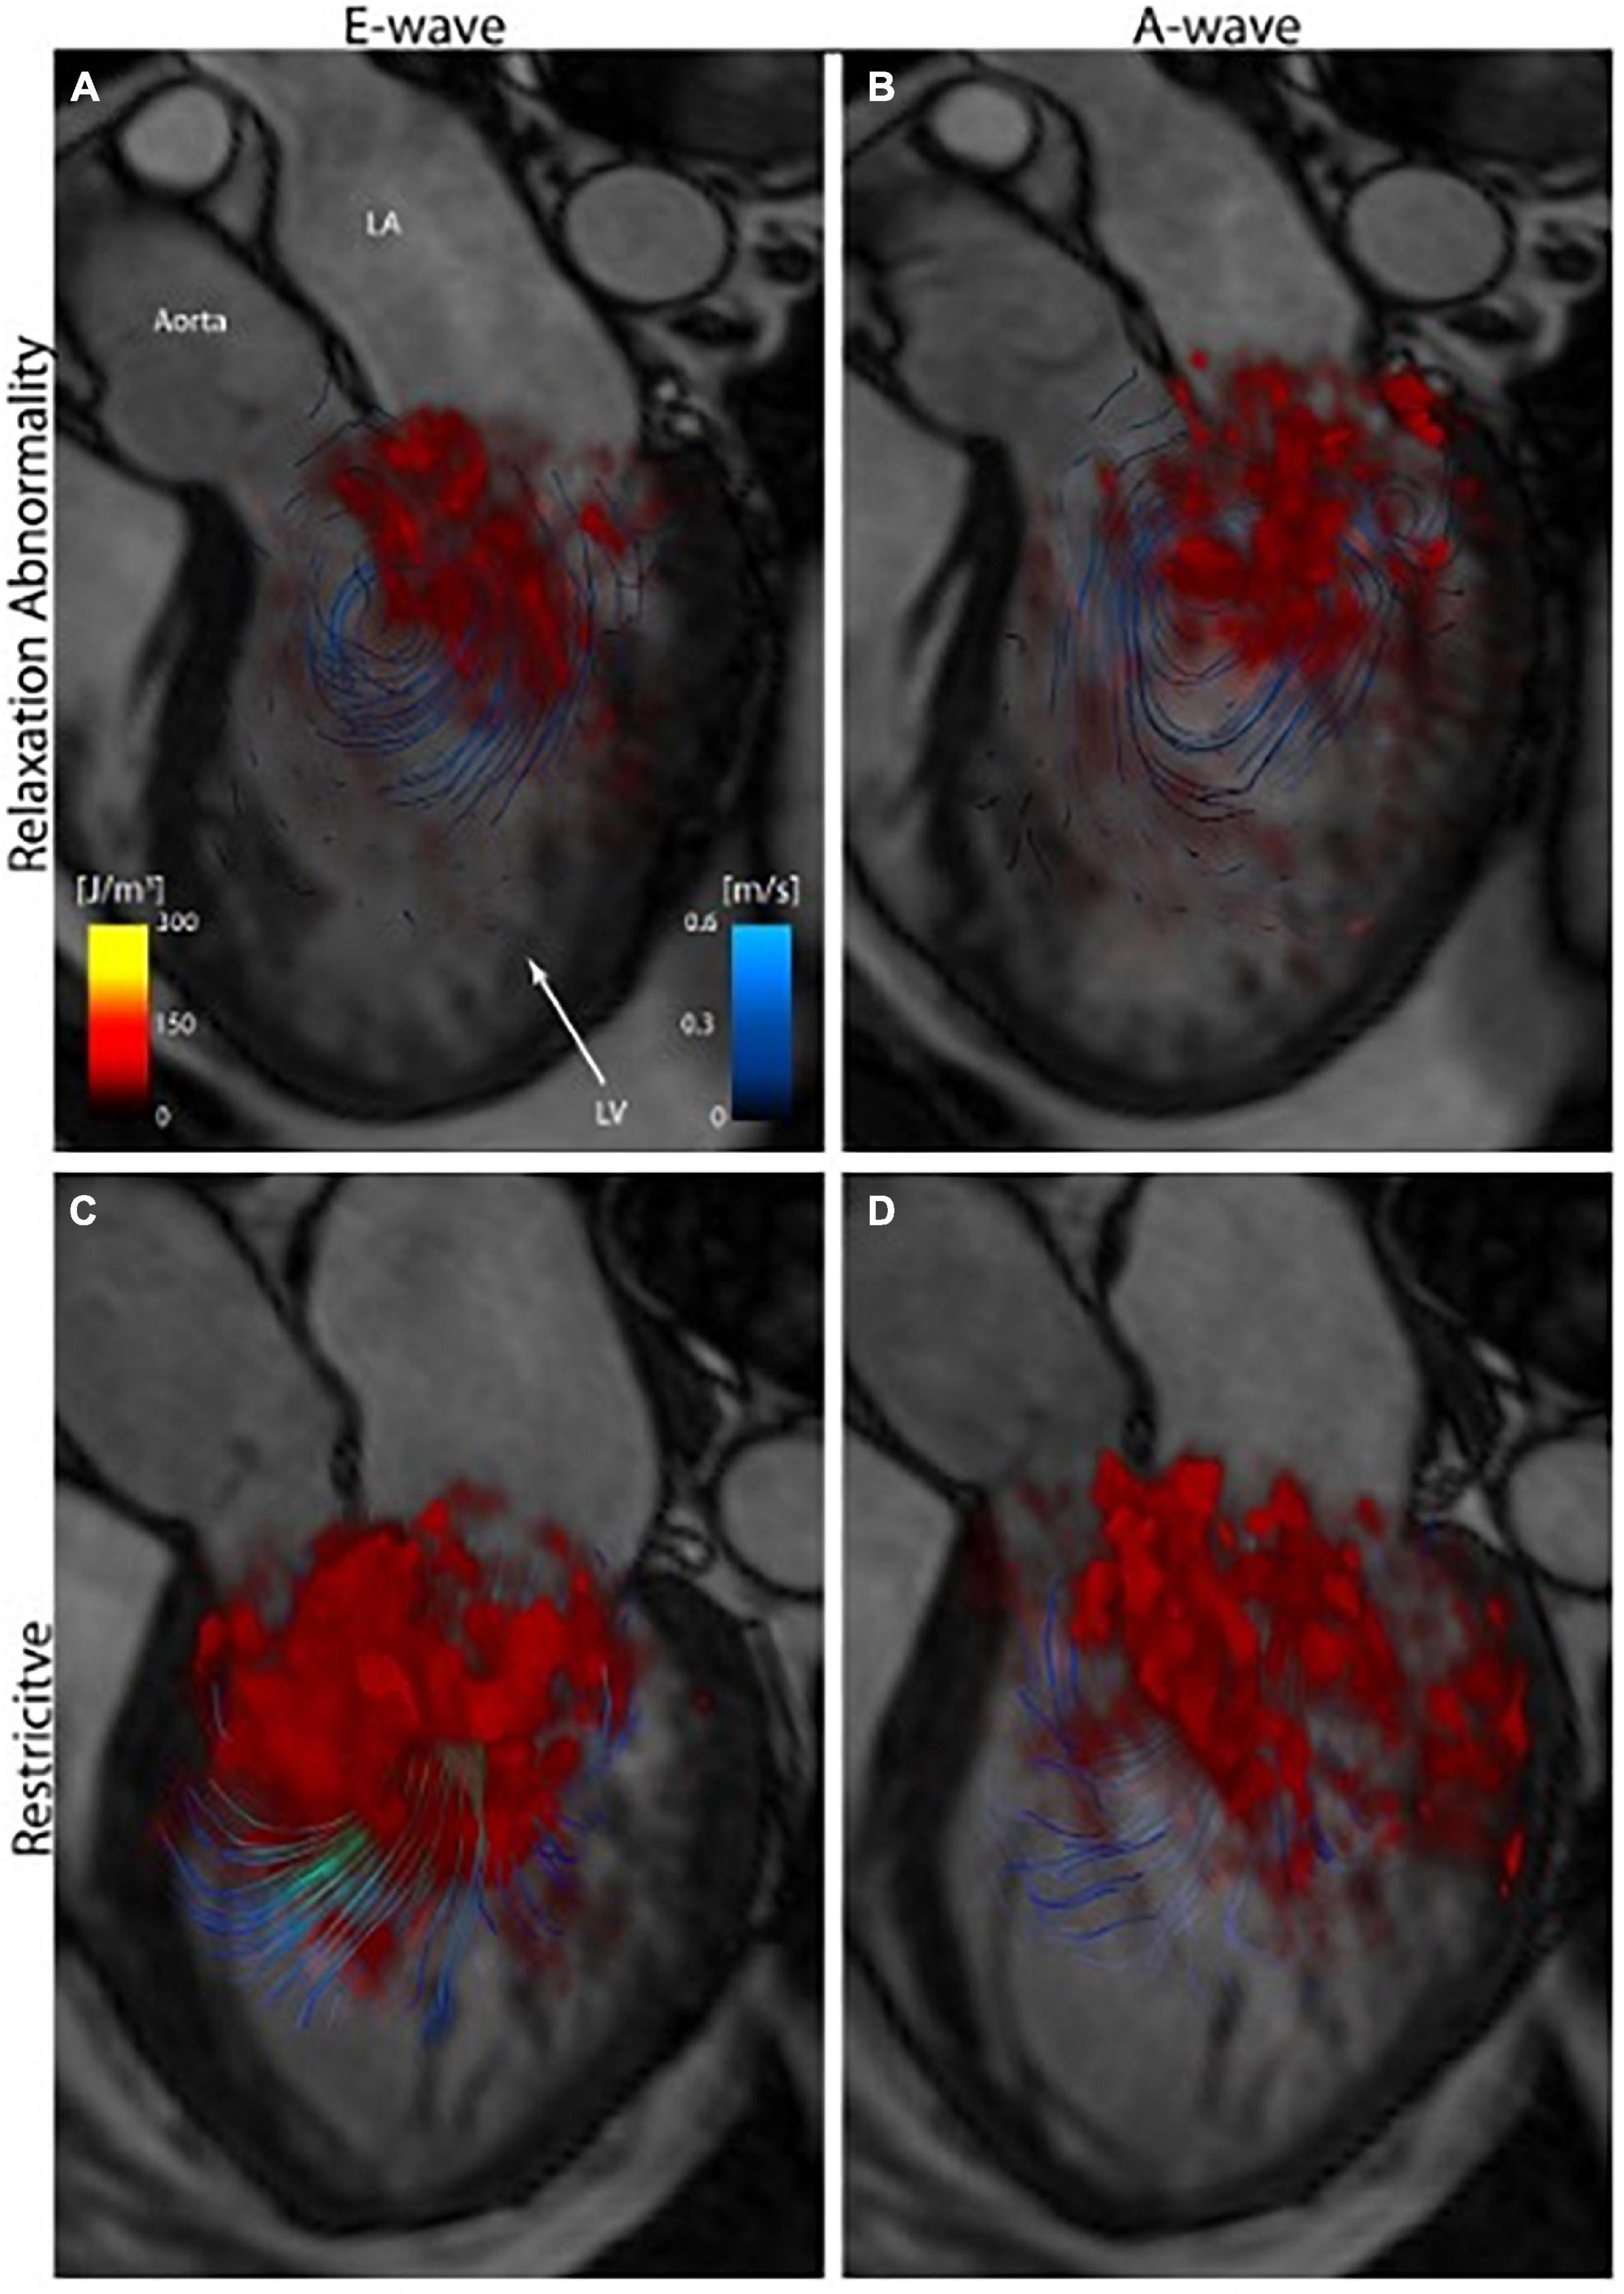
Figure 4. 3D volume rendering of turbulent kinetic energy (TKE) (red) in early (E-wave) and late (A-wave) diastolic filling of patients with grade 1 diastolic dysfunction (relaxation abnormality)-top, and grade 3–4 (restrictive filling)-bottom, showing significantly greater turbulent kinetic energy with greater diastolic dysfunction (42).
Based on work by Ebbers et al. and others (43–45), 4D flow CMR has also enabled the measurement of relative intracardiac pressure differences by calculating pressure gradients from 3D velocity fields. In comparison to 2D PC-CMR, pressure gradients derived via this method are not reliant on correct identification of the direction/plane of maximum flow velocity and provide additional 3D spatial and temporal information. These relative pressure maps also present an attractive non-invasive alternative to catheter-based pressure measurements, which are susceptible to operator variability particularly with regards to catheter positioning. However, despite its promising potential as a non-invasive means of measuring intracardiac pressure derangements seen in diastolic dysfunction, relative pressure has yet to be studied in this condition or indeed compared against catheter measurements. Furthermore, current sequences add significantly to scanning time, and there is still much research in progress to refine the computational approach used to derive relative pressure maps from 3D flow velocity data (44, 46, 47).
Another novel 4D flow CMR marker, hemodynamic force (the force exerted by intraventricular blood flow on the myocardium) can also be derived from intraventricular pressure gradients (48, 49). Changes in the direction and magnitude of hemodynamic forces can reflect derangements in blood flow caused by impaired diastolic filling. Both Eriksson et al. (50) and Arvidsson et al. (51) (Table 2) showed that patients with heart failure with reduced ejection fraction with and without dyssynchrony experienced a significant reduction of normal diastolic hemodynamic forces along the long axis plane (along main direction of blood flow) and an increase in hemodynamic forces along the short axis or transverse plane (orthogonal to main direction of blood flow), indicative of impaired relaxation. Further study and refinement of this promising technique is required however, as to our knowledge only two 4D flow CMR studies have used hemodynamic force analysis in patients with heart failure with preserved ejection fraction, and they have produced some conflicting results [e.g., base to apical hemodynamic forces were not consistently abnormal in previous studies (52, 53)].
As the left atrium empties into the LV and blood passes through the distal tips of the mitral valve, two ring-shaped (or ‘toroidal’) vortices are formed during early and late diastole (Figure 5). Although our understanding of the complex flow dynamics of blood remains incomplete, it is thought that LV vortex formation plays an important role in energy conservation, the redirection of blood flow and closure of the mitral valve leaflets (56, 57). Abnormalities in vortex formation have therefore been studied to provide insight into LV diastolic function.
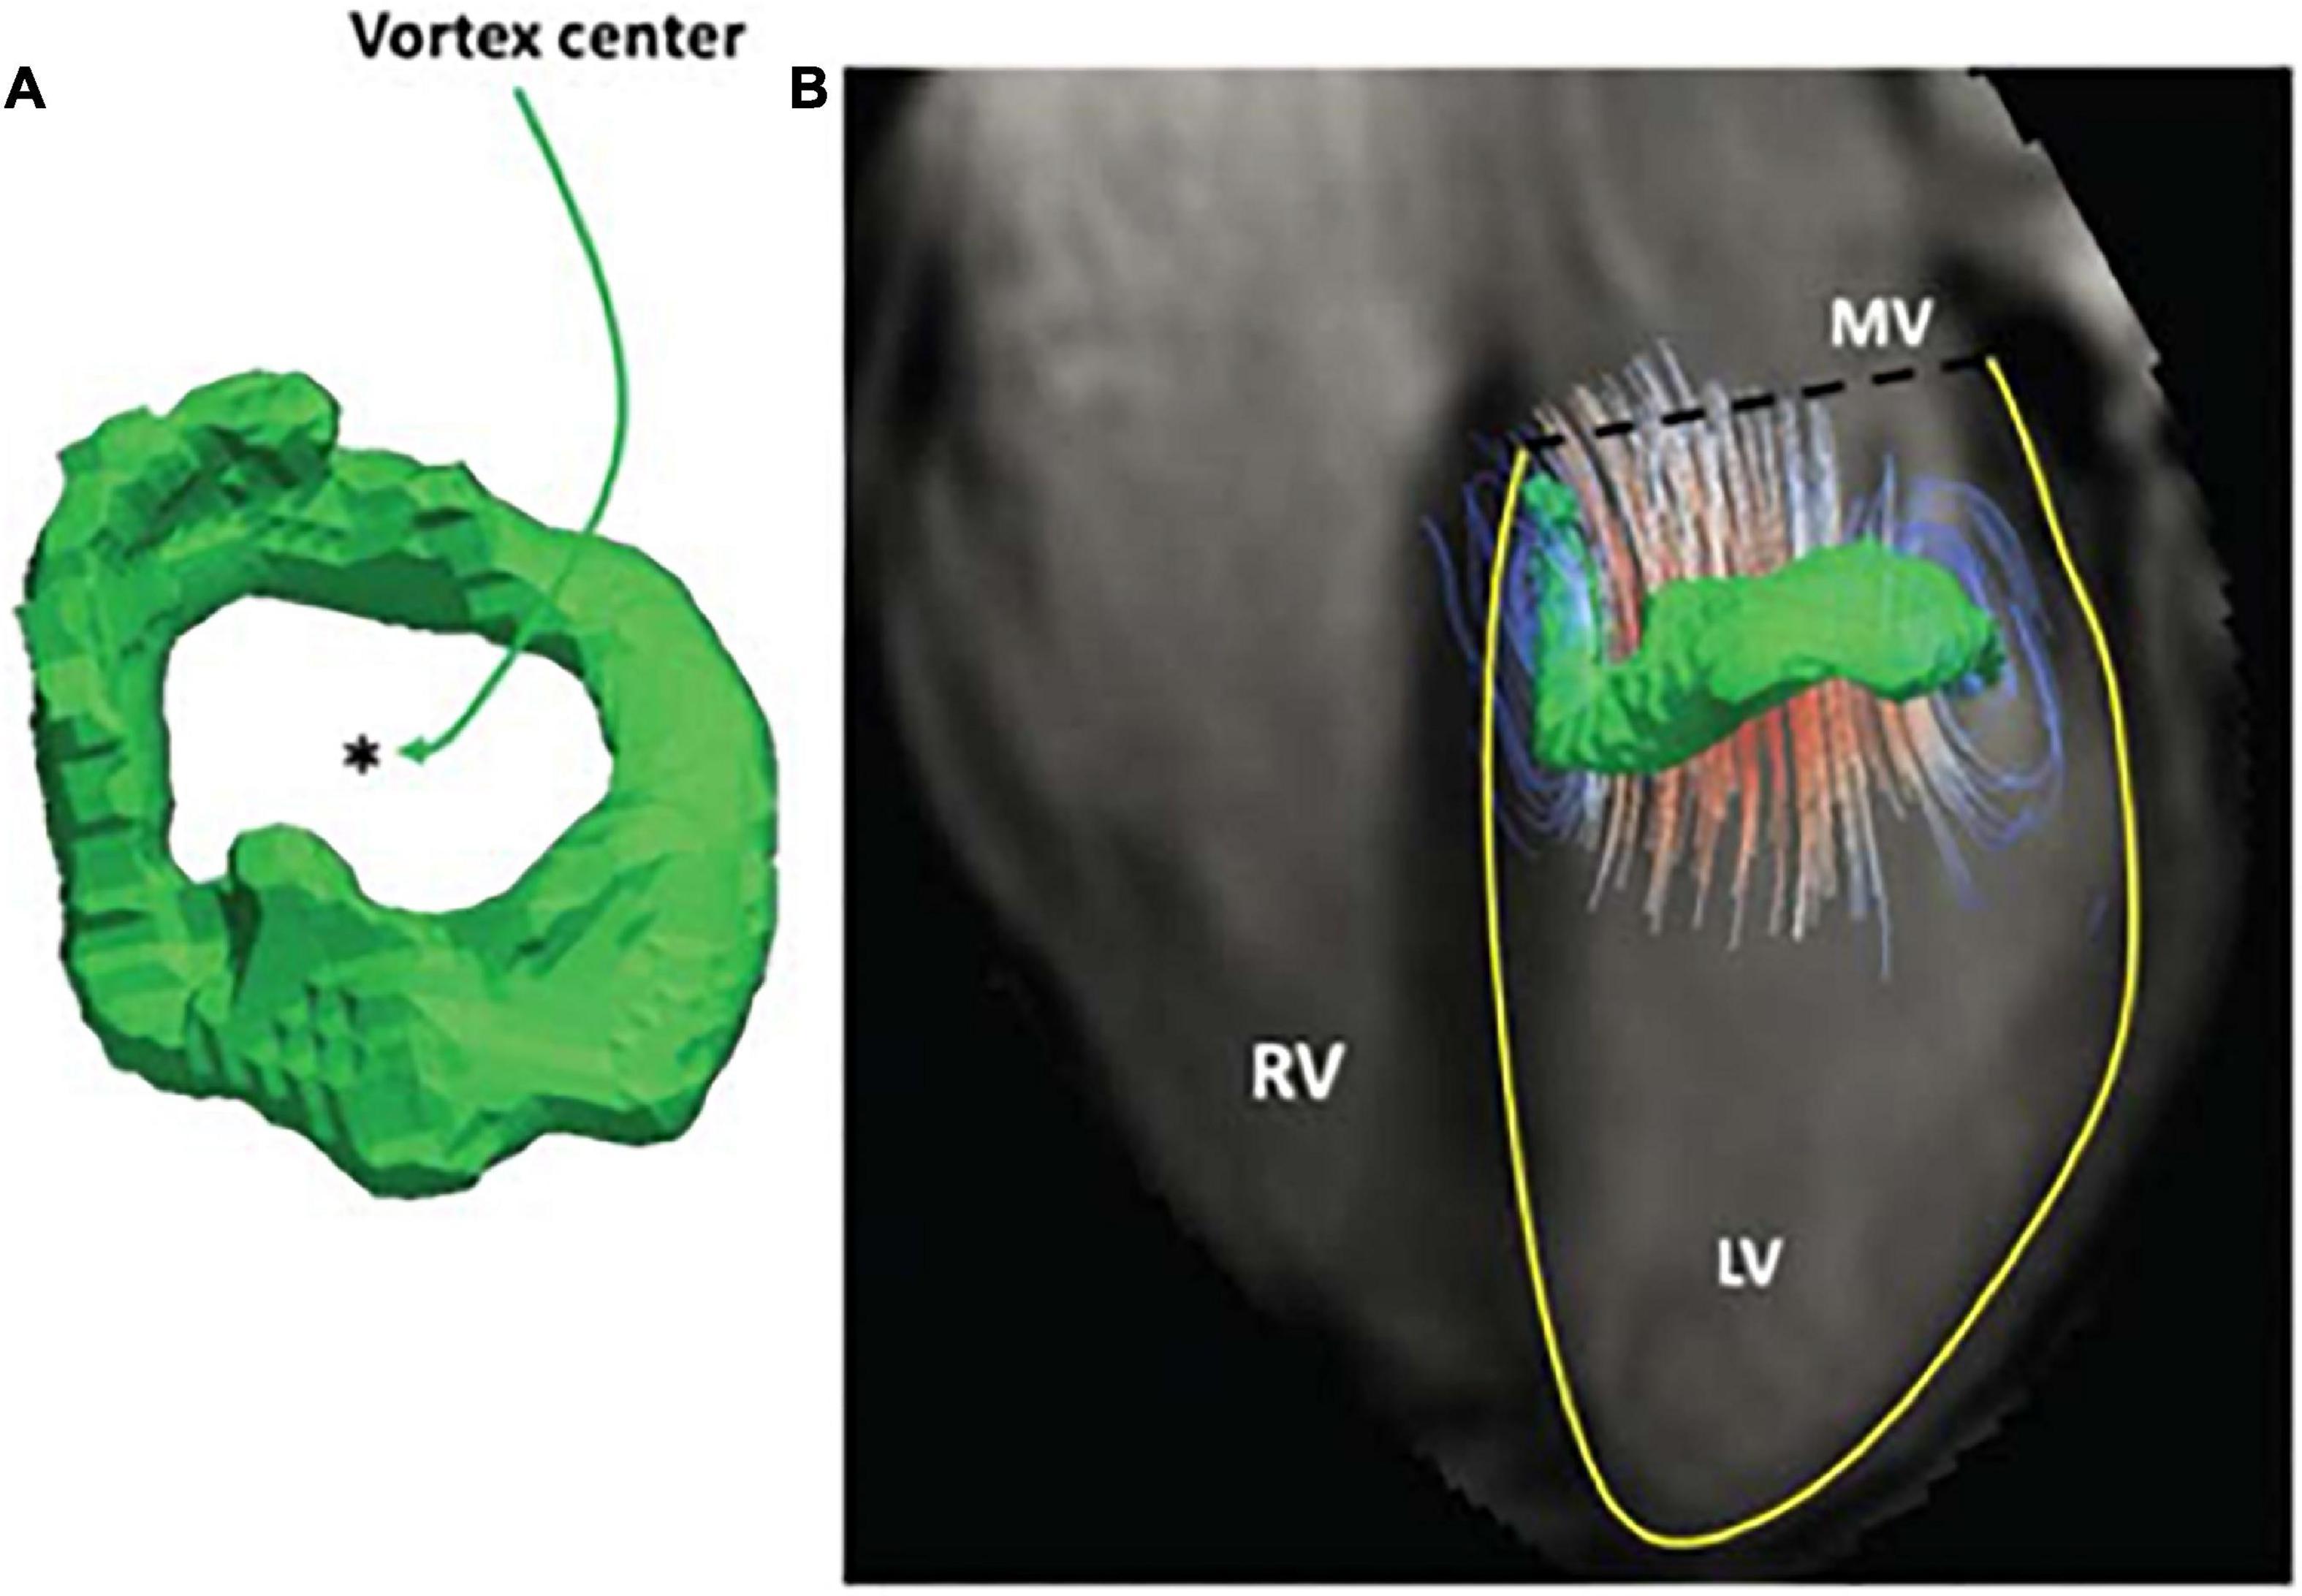
Figure 5. Left ventricular diastolic vortex ring in a healthy volunteer. Example of early diastolic vortex ring (A), Streamlines superimposed on a vortex in a four-chamber view (B) (41).
Vortex assessment using 4D flow CMR is a relatively recent development, echocardiography studies have previously characterized vortex formation and have demonstrated that vortex malformation is associated with energy loss and diastolic dysfunction (58, 59). Early 4D flow CMR studies of LV diastolic vortices employed various complex visualization and analysis techniques (including Lambda2, Q criterion and Langragian coherent structures) to assess vortex dimensions, and to a lesser extent vortex vorticity and kinetic energy (Table 3). Additionally, 4D flow CMR imaging of pulmonary arterial flow has shown that the existence and relative duration of pulmonary vortices can be used as markers of pulmonary hypertension (60, 61), correlating well with invasive mean pulmonary arterial pressure (mPAP) measurements (61).
In normal physiology, the early diastolic vortex ring is smaller, more circular, and pulls blood toward the apex before dissipating at diastasis. A subsequent larger late diastolic vortex ring then forms which helps direct blood toward the LVOT (26, 62, 63). Vortex formation and size is closely linked with LV form and function (64). Vortex shape is to a significant extent determined by shape of mitral inflow (62), and therefore structural MV abnormalities may affect vortex formation and energy efficiency of blood flow. In a study comparing patients post AVSD repair to controls, Elbaz et al. (41) showed that altered diastolic vortex formation was associated with increased viscous energy loss. Ventricular and mitral annular dilatation also affect vortex formation. Suwa et al. (65) found that in patients with severe LV dysfunction and dilatation, diastolic vortices were more apically located, larger and more spherical. Even though vortices are larger in dilated ventricles, Töger et al. show that such vortices may make up a smaller proportion of LV volume compared to healthy controls (66). Even in the absence of significant LV dilatation, subtle changes in vortex dimensions may be seen in diseased hearts. Krauter et al. (63) compared 10 ischemic heart disease (IHD) patients to 10 controls, and showed that despite no significant difference in LVEDV, SV or ejection fraction, in IHD patients early diastolic vortices were more elliptical, and contained significantly lower absolute and relative (to vortex ring volume) kinetic energy.
A substantial proportion of the kinetic energy of diastolic blood flow is carried within the vortex, with Steding-Ehrenborg et al. (33) suggesting that as much as 70% of the total diastolic KE can be found within vortices. Therefore, reductions in vortex diastolic KE may indicate impaired LV diastolic function. Indeed, Kanski et al. (31) found that in patients with heart failure a smaller proportion of diastolic KE was found inside the vortex ring compared with healthy controls. In Krauter et al.’s study (63), patients with chronic IHD had reduced vortex diastolic KE compared with controls, despite no significant difference in LV volumes.
Vorticity is a measure of the local rotation of fluid particles within a fluid as they travel through its main flow. Greater vorticity during ventricular inflow—which is dominated by a large ring vortex—is associated with conservation of kinetic energy leading to more efficient flow (29). This rotational property of the vortex has been shown to be a marker of diastolic function in several studies (41, 67, 68). Schäfer et al. (68) demonstrated that peak early diastolic vorticity was significantly reduced in patients with chronic obstructive pulmonary disease (COPD) with and without confirmed LVDD on echocardiography (Figure 6), suggesting that vorticity may be a more sensitive marker of diastolic dysfunction. Krauter et al. (63) similarly found reduced vorticity in chronic IHD patients compared with controls. In that study, vorticity correlated strongly with transmitral velocities measured with 2D PC-CMR. In another study by Schäfer et al. (67) examining vorticity in pulmonary hypertension patients, early diastolic vorticity correlated significantly with mitral annular velocities (septal and lateral e’) and E/A ratio—further indication that vorticity has potential as a measure of LV diastolic function.
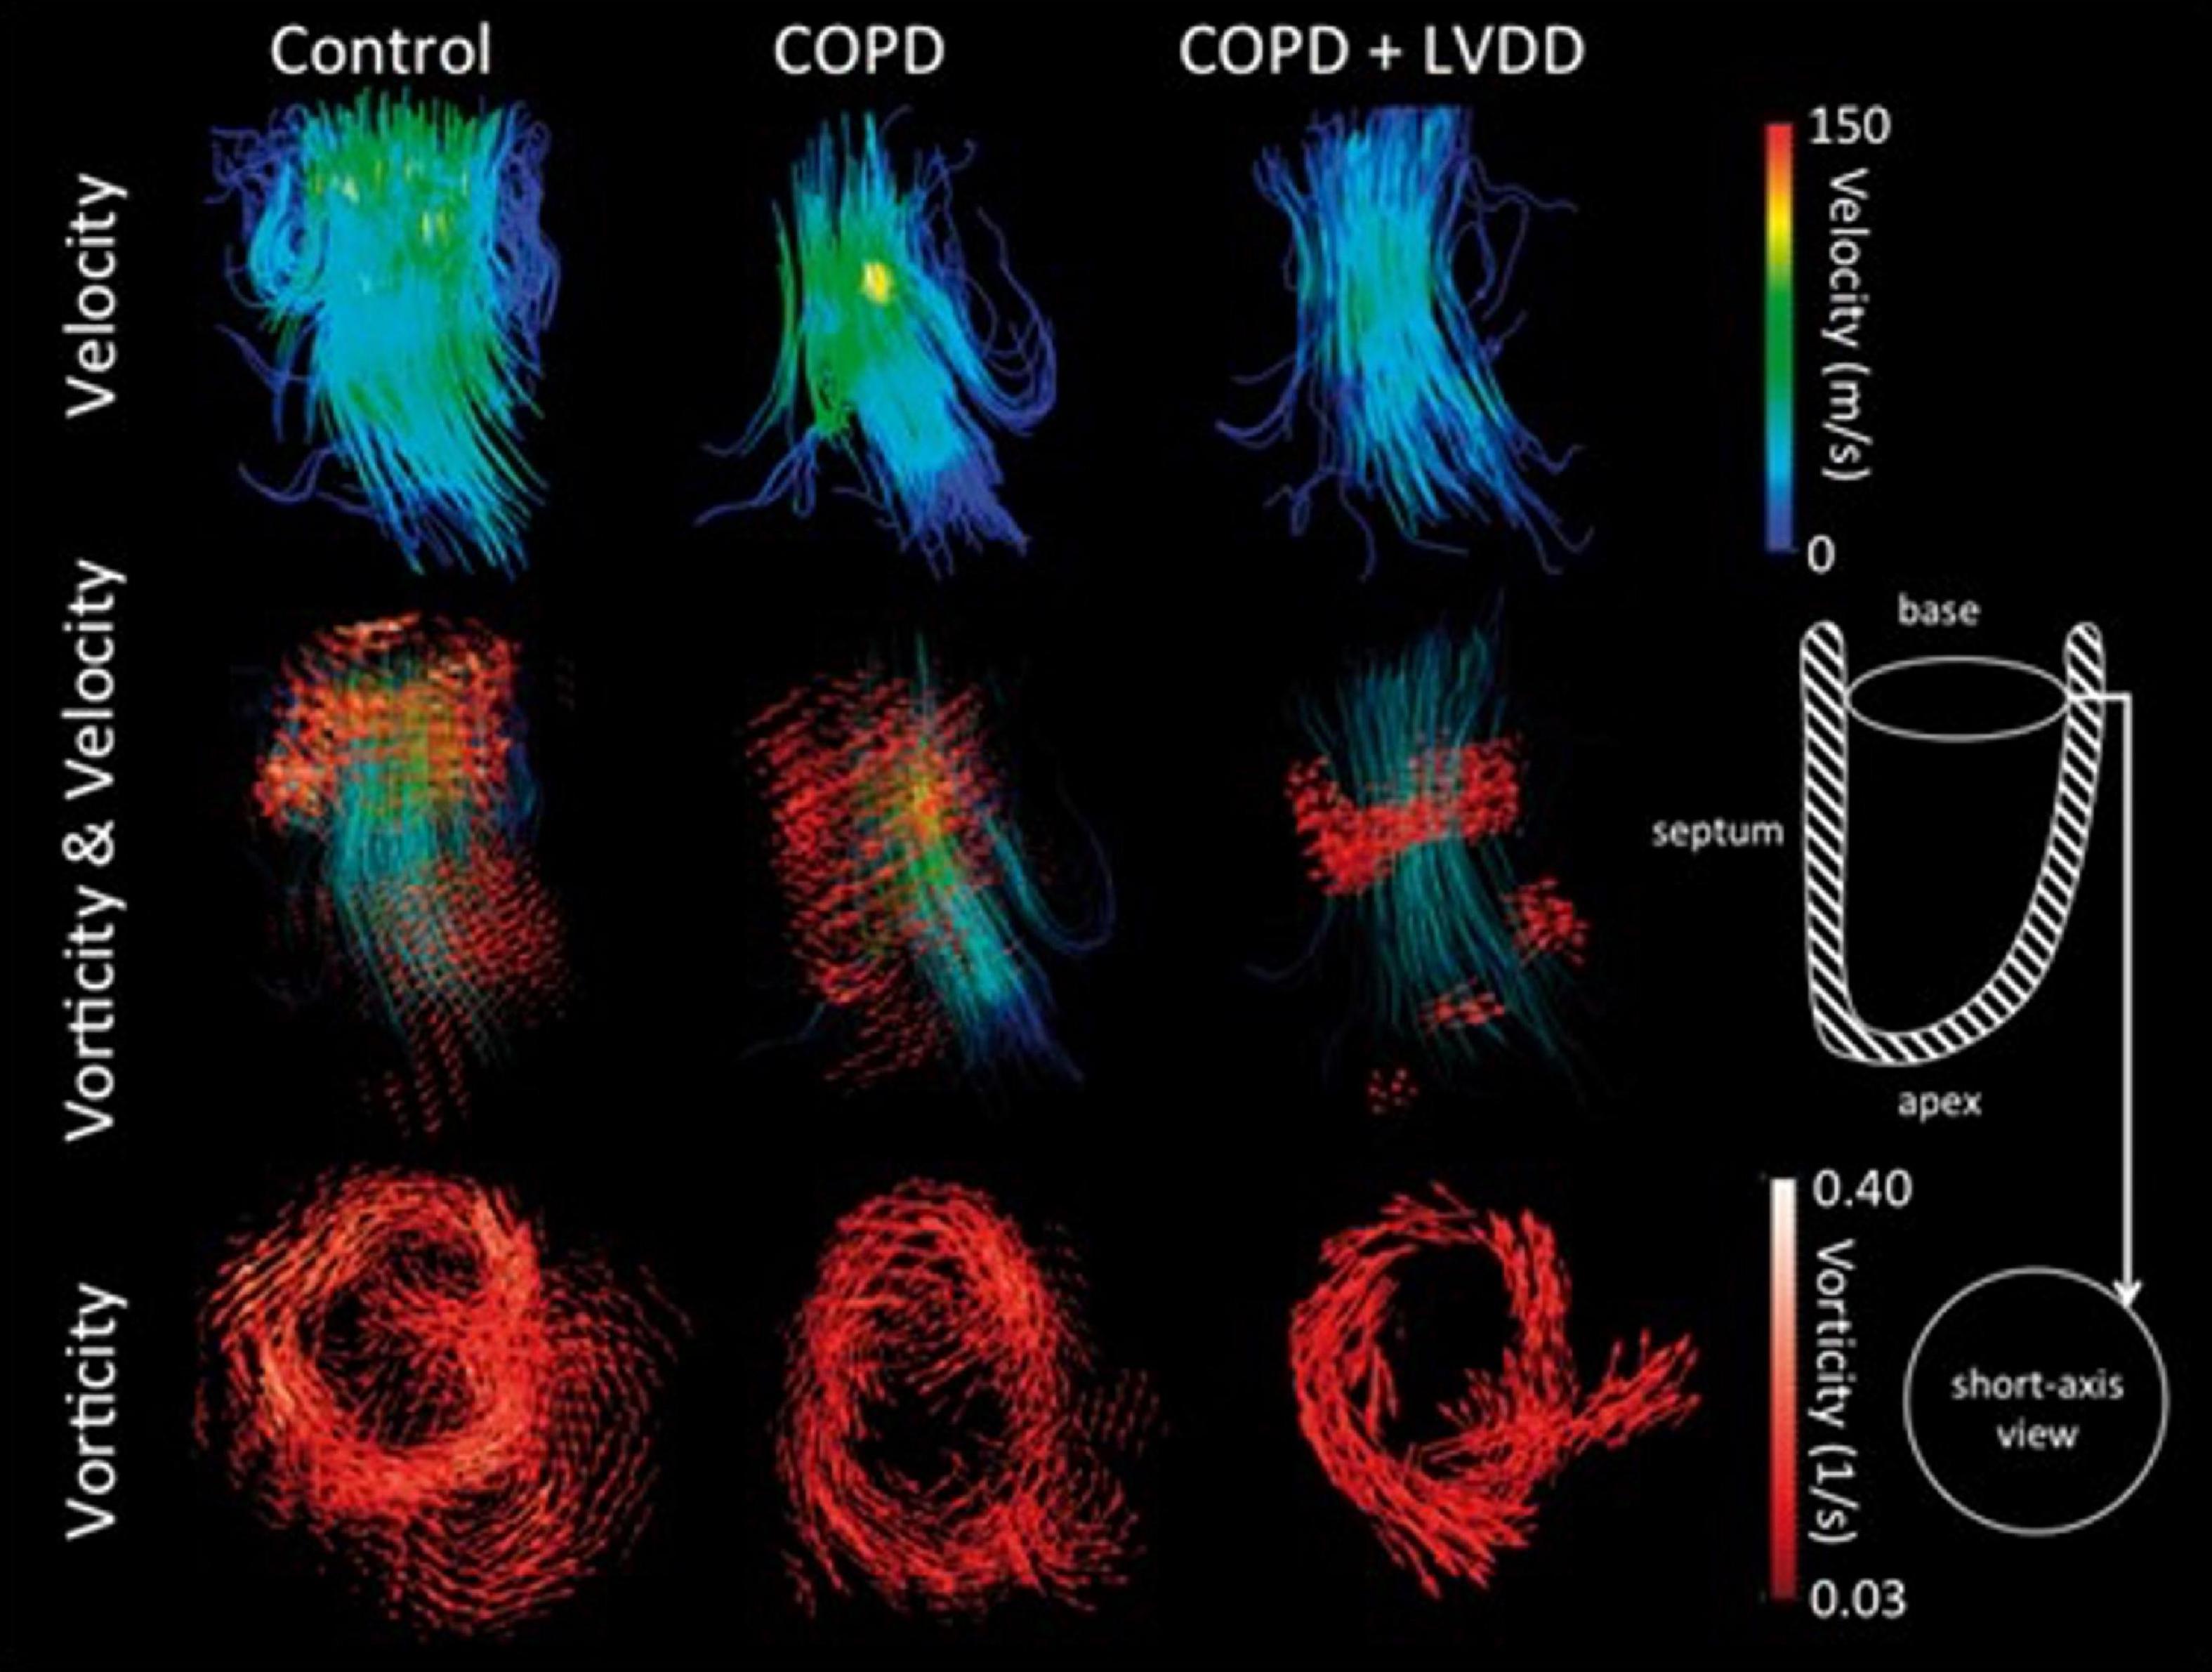
Figure 6. Streamline visualization with velocity color coding of diastolic flow in controls, COPD patients with and without left ventricular diastolic dysfunction (LVDD) (Top row). Streamline visualization of diastolic flow with superimposed vorticity vector fields (Middle row). Vorticity vector fields in all three groups, showing a loss of vorticity in both COPD with and without LVDD (Bottom row) (68).
First described by Bolger et al. (71) using particle trace analysis to visualize 3D blood flow, LVEDV can be separated into four functional flow components. These four components are Direct Flow (DF)—the most efficient component of ventricular blood which transits the heart in one cardiac cycle, Retained Inflow (RIF)—blood that enters the LV during diastole but is retained for at least one cycle, Delayed Ejection Flow (DEF)—blood already in the LV during diastole and which leaves during systole, and Residual Volume (RV)—blood that remains in the LV for at least two cycles (Figure 7). DF and RIF enter the ventricle during diastole and together may be referred to as inflow. Outflow consists of DF and DEF, the two components that leave the ventricle during systole. RIF and RV remain in the ventricle during systole, making up the Non-ejected Volume.
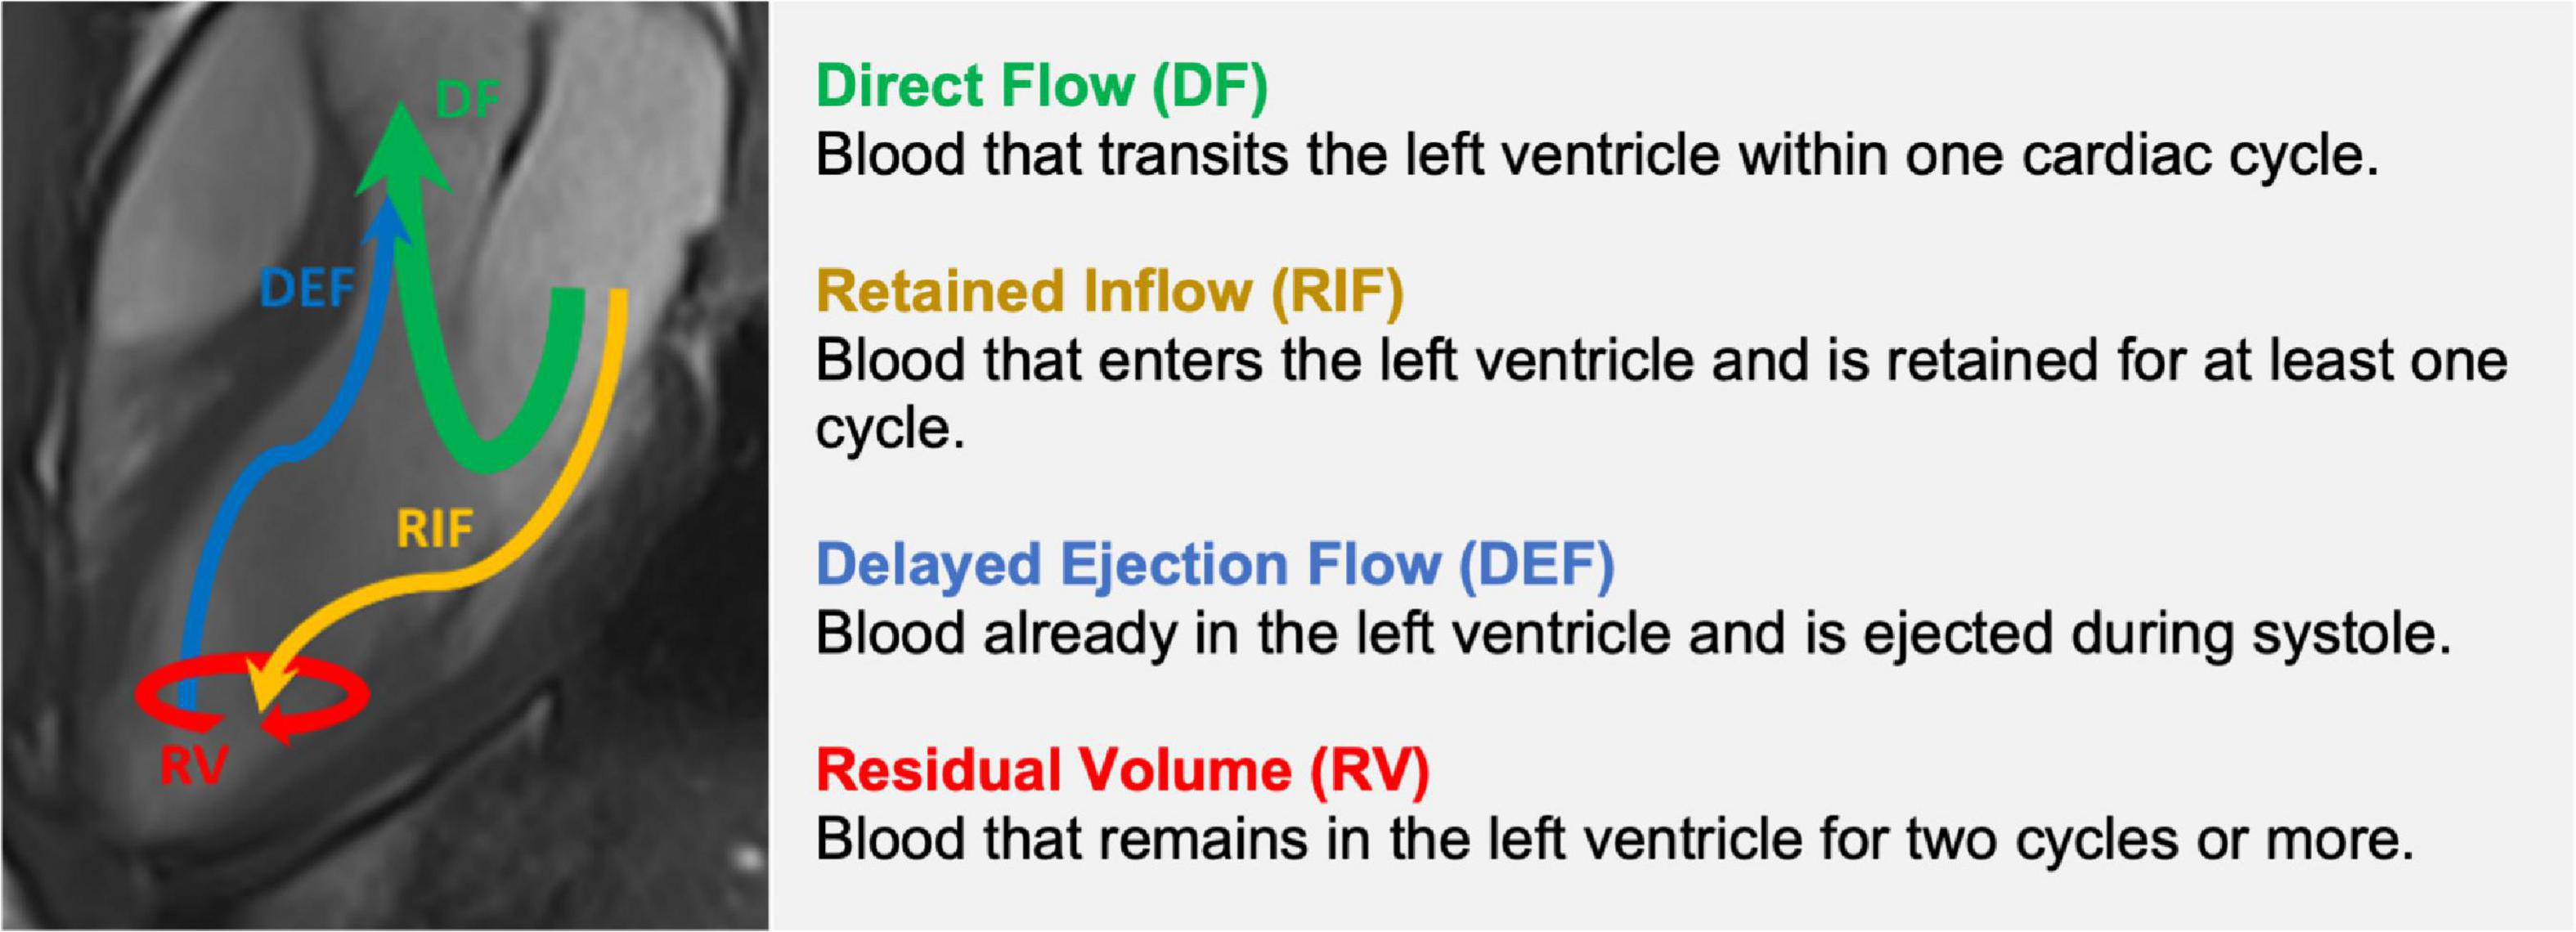
Figure 7. Constituent functional flow components of left ventricular blood volume.
In normal hearts, DF is the largest component by proportion of LVEDV (∼35–40%), followed by RV (∼25–30%), with the remaining volume shared equally between RIF and DEF (Table 4).
The relative volume of the flow components reflects flow distribution within the ventricle and can be used as a measure of blood flow efficiency, with reduced relative proportions of DF and RV corresponding to a reduction in systolic but also diastolic function. This is because diastole is integral to creating favorable conditions for maximum DF and thereby flow efficiency. By the end of diastole, DF retains the greatest amount of kinetic energy of all the flow components (71) and is optimally positioned in terms of its angle and distance to the LVOT (72). Flow components (in particular DF) therefore reflect diastolic-systolic coupling and their relative volumes can be utilized as a useful marker of LVDD.
Table 4 summarizes the studies that describe flow components as a percentage of LVEDV in health controls. Most studies published demonstrate consistency in the proportions of the four functional flow components measured on 4D flow CMR. The two outliers were Bolger et al. (71) and Corrado et al. (73), with differences seen potentially due to disparate methodologies used in processing of 4D flow datasets.
Several studies have shown alterations in flow component relative volumes between patient groups and under certain conditions (Table 5).
In three different studies, Eriksson et al. (28, 72, 74) compared controls to dilated cardiomyopathy patients. They found that in heart failure patients, as the LV dilates, the proportion of non-ejected components increase at the expense of Direct Flow, which is diminished. Svalbring et al. (75) found a similar pattern in patients with mild ischemic cardiomyopathy with preserved systolic function, suggesting that blood flow component analysis may detect even subtle or subclinical abnormalities in LV remodeling (Figure 8).
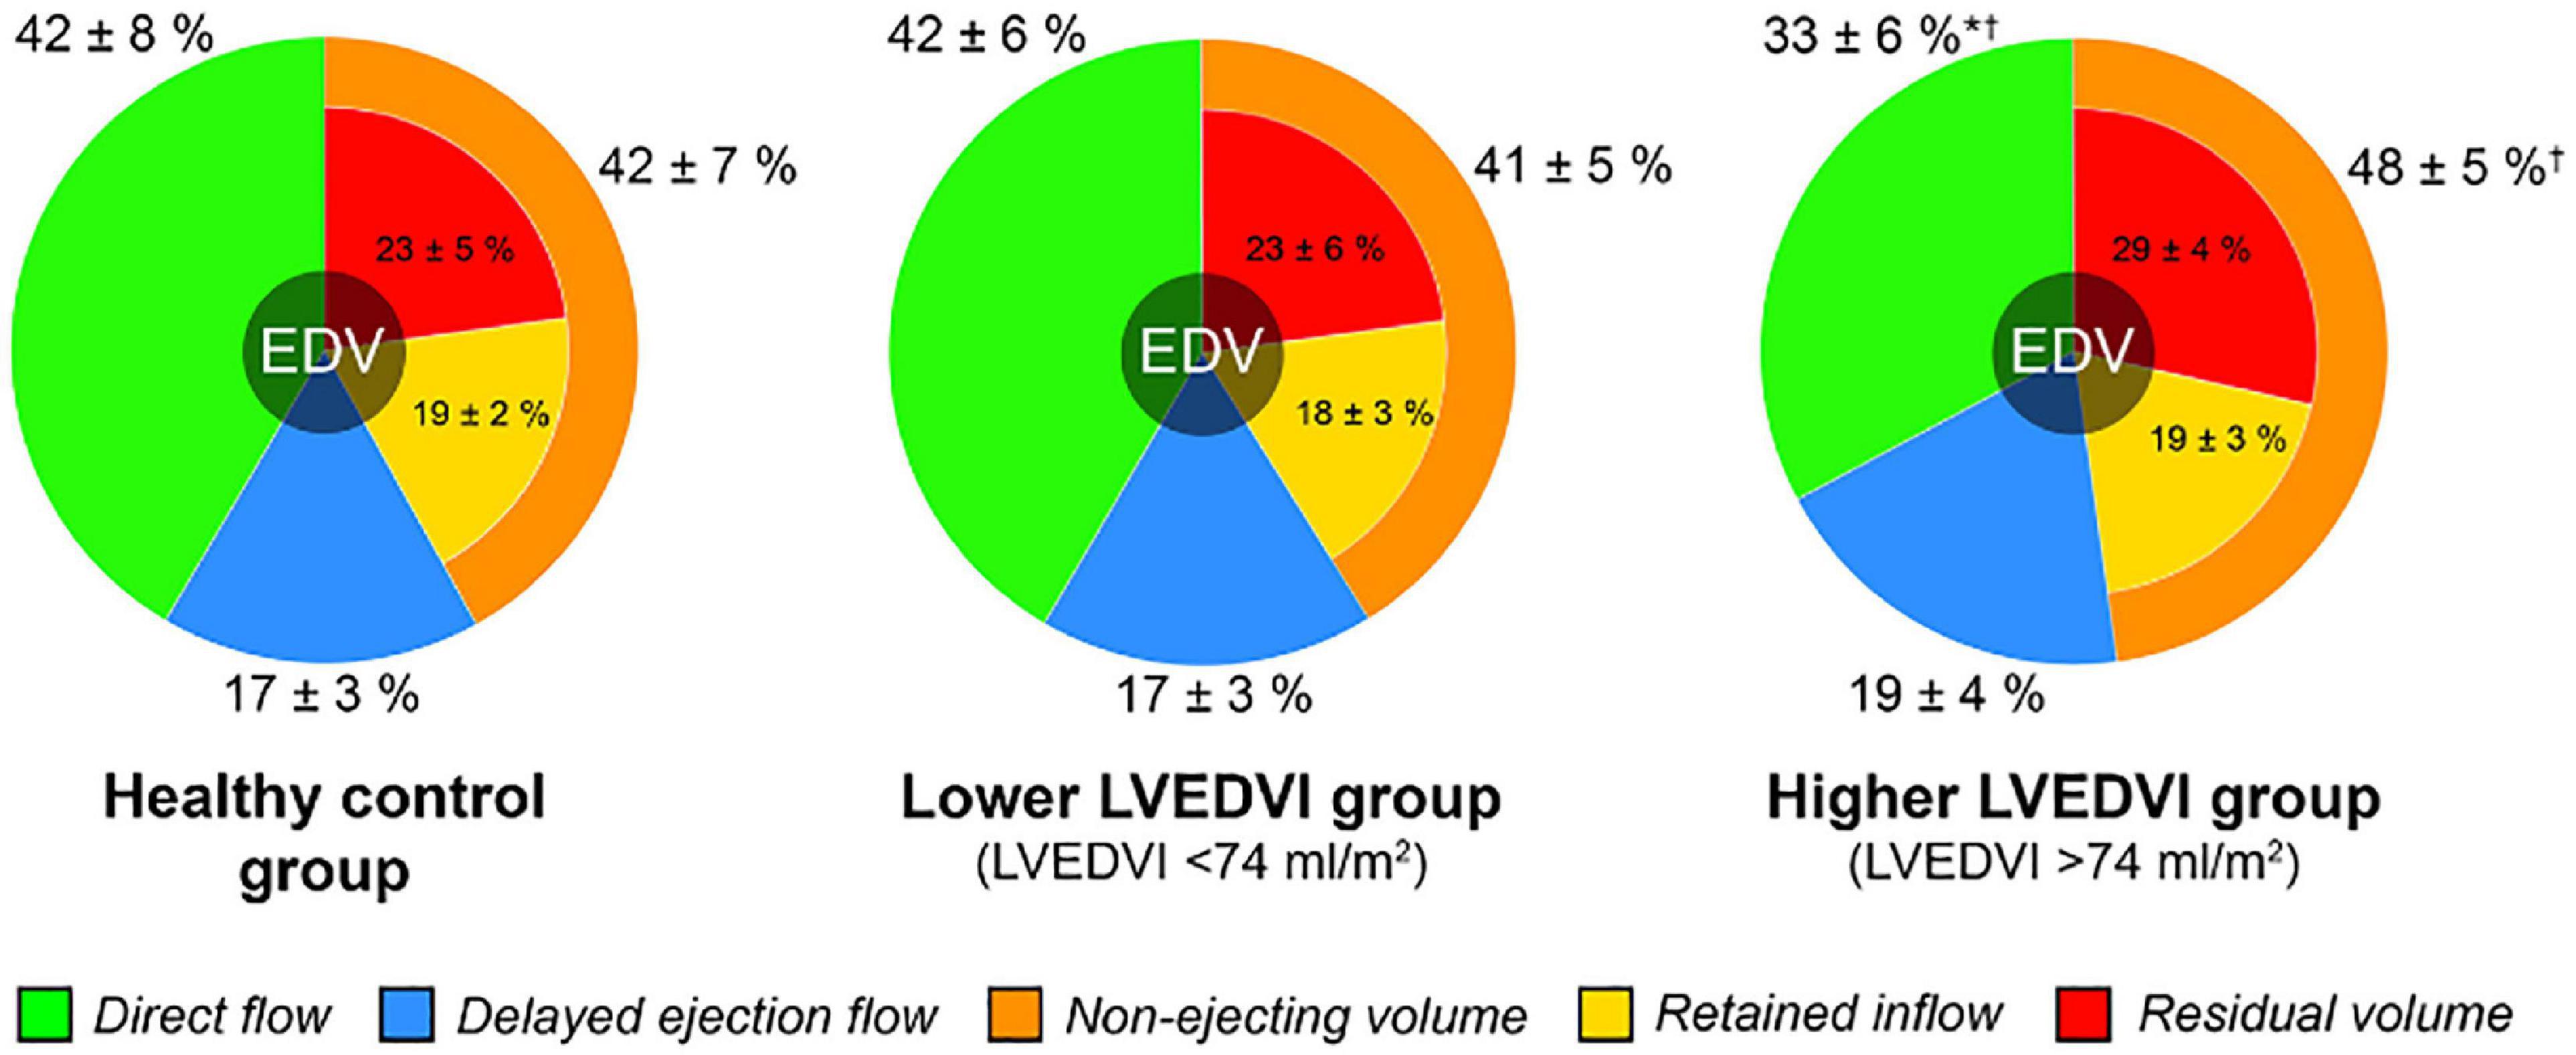
Figure 8. Left ventricular blood flow component distribution in healthy controls and in chronic ischemic heart disease patient subgroups (stratified by LVEDV index) (75).
Another study which points to the sensitivity of blood flow component analysis is Karlsson et al. (78). In this study, the authors were able to show that patients with atrial fibrillation who underwent cardioversion gained significant improvement in blood flow efficiency (increased DF, reduced RV) within 4 weeks of return to sinus rhythm.
Sundin et al. (77) studied changes in blood flow components during dobutamine stress testing in 12 healthy controls and found a similar improvement in blood flow efficiency, with a substantial improvement in DF and reduction in RV compared to rest.
Alongside assessing flow component volumes, 4D flow CMR techniques can also be used to measure the kinetic energy of individual components. The sum of the diastolic KE of the four flow components are equal to LV global flow diastolic KE. Several studies have shown a direct correlation between the flow component volume and flow component diastolic KE. This is unsurprising given that mass (volume) is a central component of KE. Consequently, component KE normalized to volume (i.e., KE/ml) has been reported by many as this provides incremental value (Table 5).
Studies of component diastolic KE have found that an increase in Direct Flow proportion was accompanied by an increase in DF end diastolic KE and a reduction in that of the residual volume end diastolic KE (77, 78), and that the converse relationship held true where there was reduction in DF proportion (72, 75, 79). The most comprehensive study highlighting the potential clinical utility of flow component diastolic KE was carried out by Stoll et al. (79). In this study, 64 heart failure patients (mixed etiology of DCM and ischemic cardiomyopathy) were compared with normal controls. In addition to significantly lower DF proportions, mean end-diastolic and average diastolic KE in heart failure patients, Stoll et al. found that derangements in diastolic KE values correlated with brain natriuretic peptide (BNP) levels, New York Heart Association (NYHA) classification, functional capacity as well as myocardial cellular energetics. Flow component relative volumes and diastolic KE could therefore become sensitive tools in the early detection and prognostication of LVDD in patients.
Lastly, the impact of dyssynchrony on flow component diastolic KE has also been studied. Zajac et al. (80) compared heart failure patients (mixed etiology) with and without left bundle branch block (LBBB) and found that despite no change in flow component volume, the early diastolic KE of the DF component was lower in patients with LBBB than those without. This likely reflects the inherent inefficiency of abnormal and dyssynchronous LV relaxation. This study also introduces the concept of flow component diastolic KE as a novel predictor of cardiac resynchronization therapy (CRT) response.
Few studies have compared novel 4D flow diastolic parameters against conventional echocardiographic indices of LV diastolic function—Doppler transmitral, mitral annular and tricuspid regurgitation velocities. The only study that compared diastolic KE was from Al-Wakeel et al. (36) and showed that diastolic KE E/A ratio correlated with Doppler E/A ratio—a predictable correlation which does not further the use of other 4D flow parameters highlighted here. Furthermore, this correlation was only significant in postoperative patients. In Zajac et al. (42), TKE correlated with echo-derived peak late diastolic (a wave) velocity. Lastly, Schäfer et al. (67), showed that 4D flow E and A wave vorticity correlated with multiple echo-based diastolic parameters including the Doppler E/A ratio. To our knowledge, there are currently no studies that have directly compared 4D diastolic parameters against invasive measurements of left ventricular filling pressures.
As a relatively new technology, 4D flow CMR is not yet widely accessible, and expertise are not widespread (81). FDA approved and CE marked 4D flow CMR sequences are now available on all modern MRI systems, but an acquisition with respiratory motion compensation and adequate temporal and spatial resolution may take up to 15 minutes (82). Moreover, temporal and spatial resolution may be insufficient for certain 4D flow parameters such as wall shear stress and pulse wave velocity (81).
Acquisition time can be reduced by eliminating respiratory motion compensation, but this can significantly impact image quality (81). Self-gating techniques are in development which may help negate the effects of respiratory motion (83). Several approaches to the reduce the acquisition time have been proposed, of which some may reach clinical application soon.
In 4D flow CMR, the normal practice of having a single velocity encoding range (or VENC) can result in an insufficient velocity to noise ratio (VNR) in regions with low velocities. Techniques that enable multi-VENC measurements allow for a better VNR over the whole velocity range, but at the cost of a longer acquisition time (84).
Prior to 4D flow data analysis, pre-processing to correct for phase offset errors such as eddy current effects and velocity aliasing is necessary. For this, several commercial FDA approved and CE marked software solution are available, but adequate technical expertise is still required as optimal strategies may vary according to MR system, 4D flow CMR sequence and application (81). Adequate routines for quality assurance and validation are recommended (81).
Data analysis and 4D flow visualization techniques, like acquisition and processing methods, may differ from center to center, and not all parameters can be measured in all centers. As a result, a variety of different parameters have been used across studies, meaning that results are often not directly comparable, and some studies have had conflicting results (71, 73).
Lastly, 4D flow CMR generates huge data sets and therefore adequate data management, and storage infrastructure are essential to be able to process 4D flow data.
Further, more comprehensive, validation of 4D parameters against existing non-invasive and invasive markers is required, and ideally linked to clinical outcomes to determine the true utility of these techniques. Testing at different field strengths is also required, as is cross-vendor standardization of acquisition, processing, and analysis techniques, before 4D flow can be more widely used clinically for assessment of diastolic function—as outlined in the 2015 Society for Cardiovascular Magnetic Resonance (SCMR) consensus statement (81).
Research into the assessment of LV diastolic function using 4D flow CMR has so far consisted almost entirely of small single center studies. Larger multicenter and multimodality studies are necessary for comprehensive assessment of HFpEF (and other cardiac conditions involving LVDD), and more definitive comparisons of the performance of novel 4D parameters against contemporary diagnostic and prognostic markers of disease.
Early studies of LVDD using time resolved 3-dimensional velocity mapping acquired with 4D flow CMR have contributed to our understanding of complex physiological and pathophysiological processes such as energy loss, vortex formation and functional blood flow components (Table 6). Novel 4D flow parameters such as global flow diastolic KE, vorticity, and flow component relative volumes have shown significant promise as sensitive markers of early and pre-clinical LVDD, and some have shown a correlation with standard 2D parameters of LV diastolic function. These novel markers could play a future role in refining the diagnosis of HFpEF and in the monitoring of LVDD in many cardiac conditions—from valve disease to ischemic heart disease—especially in patients with poor acoustic windows (e.g., obesity, COPD), and could allow CMR to better challenge echocardiography as the non-invasive modality of choice for the assessment of LV diastolic function.
ZA, SM, C-JC, TE, and BR made substantial contributions to the concept and design of the manuscript. All authors including SN made substantial contributions to the drafting and revision of the manuscript. All authors have approved the submitted version.
ZA is a recipient of a Clinical Research Training Fellowship from the British Heart Foundation (FS/CRTF/21/24144). BR and SN report grants from NIHR Oxford Biomedical Research Centre. BR is a recipient of an Intermediate Clinical Transitional Research Fellowship from the British Heart Foundation Oxford Centre of Research Excellence (RE/18/3/34214). C-JC and TE report grants from the Swedish Research Council, the Swedish Heart and Lung Foundation. C-JC also reports support from ALF Grant Region Östergötland.
The authors declare that the research was conducted in the absence of any commercial or financial relationships that could be construed as a potential conflict of interest.
All claims expressed in this article are solely those of the authors and do not necessarily represent those of their affiliated organizations, or those of the publisher, the editors and the reviewers. Any product that may be evaluated in this article, or claim that may be made by its manufacturer, is not guaranteed or endorsed by the publisher.
Permission was obtained for all images used in this review. Figure 1 includes images from https://liu.se/forskning/cardiovascular-magnetic-resonance-group, Elbaz et al. (62) and Stoll et al. (79) with permission. Figure 2 has been reproduced from Wong et al. (30) and is licensed under Creative Commons Attribution CC-BY 3.0. Figure 3 has been reproduced from Garg et al. (32) and is licensed under Creative Commons Attribution CC-BY 4.0. Figure 4 has been reproduced from Zajac et al. (42) with permission. Figure 5 has been reproduced from Elbaz et al. (41) and is licensed under Creative Commons Attribution CC-BY 4.0. Figure 6 has been reproduced from Svalbring et al. (75) and is licensed under Creative Commons Attribution CC-BY 4.0. Figure 8 has been reproduced from Schäfer et al. (68) with permission.
1. Redfield MM, Jacobsen SJ, Burnett JC, Mahoney DW, Bailey KR, Rodeheffer RJ. Burden of systolic and diastolic ventricular dysfunction in the community: appreciating the scope of the heart failure epidemic. J Am Med Assoc. (2003) 289:194–202. doi: 10.1001/jama.289.2.194
2. Tribouilloy C, Rusinaru D, Mahjoub H, Soulière V, Lévy F, Peltier M, et al. Prognosis of heart failure with preserved ejection fraction: a 5 year prospective population-based study. Eur Heart J. (2008) 29:339–47.
4. De Jesus Perez VA, Haddad F, Zamanian RT. Diagnosis and management of pulmonary hypertension associated with left ventricular diastolic dysfunction. Pulm Circ. (2012) 2:163–9.
5. Melenovsky V, Hwang SJ, Lin G, Redfield MM, Borlaug BA. Right heart dysfunction in heart failure with preserved ejection fraction. Eur Heart J. (2014) 35:3452–62.
6. Nagueh SF, Smiseth OA, Appleton CP, Byrd BF, Dokainish H, Edvardsen T, et al. Recommendations for the evaluation of left ventricular diastolic function by echocardiography: an update from the American society of echocardiography and the European association of cardiovascular imaging. Eur Heart J Cardiovasc Imaging. (2016) 17:1321–60.
7. Almeida JG, Fontes-Carvalho R, Sampaio F, Ribeiro J, Bettencourt P, Flachskampf FA, et al. Impact of the 2016 ASE/EACVI recommendations on the prevalence of diastolic dysfunction in the general population. Eur Heart J Cardiovasc Imaging. (2018) 19:380–6. doi: 10.1093/ehjci/jex252
8. Kramer CM, Barkhausen J, Bucciarelli-Ducci C, Flamm SD, Kim RJ, Nagel E. Standardized cardiovascular magnetic resonance imaging (CMR) protocols: 2020 update. J Cardiovasc Magn Reson. (2020) 22:17. doi: 10.1186/s12968-020-00607-1
9. Wu V, Chyou JY, Chung S, Bhagavatula S, Axel L. Evaluation of diastolic function by three-dimensional volume tracking of the mitral annulus with cardiovascular magnetic resonance: comparison with tissue Doppler imaging. J Cardiovasc Magn Reson. (2014) 16:1–14. doi: 10.1186/s12968-014-0071-3
10. Scatteia A, Baritussio A, Bucciarelli-Ducci C. Strain imaging using cardiac magnetic resonance. Heart Fail Rev. (2017) 22:465–76.
11. Dass S, Suttie JJ, Piechnik SK, Ferreira VM, Holloway CJ, Banerjee R, et al. Myocardial tissue characterization using magnetic resonance noncontrast T1 mapping in hypertrophic and dilated cardiomyopathy. Circ Cardiovasc Imaging. (2012) 5:726–33.
12. Fontana M, Chung R, Hawkins PN, Moon JC. Cardiovascular magnetic resonance for amyloidosis. Heart Fail Rev. (2015) 20:133–44.
13. Firmin DN, Gatehouse PD, Konrad JP, Yang GZ, Kilner PJ, Longmore DB. Rapid 7-dimensional imaging of pulsatile flow. In: Proceedings of the Computers in Cardiology Conference. (Vol. 14), London (1993) p. 353–6.
14. Wigström L, Sjöqvist L, Wranne B. Temporally resolved 3D phase-contrast imaging. Magn Reson Med. (1996) 36:800–3.
15. Bogren HG, Mohiaddin RH, Yang GZ, Kilner PJ, Firmin DN. Magnetic resonance velocity vector mapping of blood flow in thoracic aortic aneurysms and grafts. J Thorac Cardiovasc Surg. (1995) 110:704–14. doi: 10.1016/S0022-5223(95)70102-8
16. Crandon S, Elbaz MSM, Westenberg JJM, Van Der Geest RJ, Plein S, Garg P. Clinical applications of intra-cardiac four-dimensional flow cardiovascular magnetic resonance?: a systematic review. Int J Cardiol. (2017) 249:486–93.
17. Demirkiran A, van Ooij P, Westenberg JJM, Hofman MBM, van Assen HC, Schoonmade LJ, et al. Clinical intra-cardiac 4D flow CMR: acquisition, analysis, and clinical applications. Eur Heart J Cardiovasc Imaging. (2022)
18. Gabbour M, Schnell S, Jarvis K, Robinson JD, Markl M, Rigsby CK. 4-D flow magnetic resonance imaging: blood flow quantification compared to 2-D phase-contrast magnetic resonance imaging and Doppler echocardiography. Pediatr Radiol. (2015) 45:804–13. doi: 10.1007/s00247-014-3246-z
19. Urmeneta Ulloa J, Álvarez Vázquez A, Martínez de Vega V, Cabrera JÁ. Evaluation of cardiac shunts with 4D flow cardiac magnetic resonance: intra- and interobserver variability. J Magn Reson Imaging. (2020) 52:1055–63.
20. Chelu RG, van den Bosch AE, van Kranenburg M, Hsiao A, van den Hoven AT, Ouhlous M, et al. Qualitative grading of aortic regurgitation: a pilot study comparing CMR 4D flow and echocardiography. Int J Cardiovasc Imaging. (2016) 32:301–7. doi: 10.1007/s10554-015-0779-7
21. Westenberg JJM, Roes SD, Marsan NA, Binnendijk NMJ, Doornbos J, Bax JJ, et al. Mitral valve and tricuspid valve blood flow: accurate quantification with 3D velocity-encoded MR imaging with retrospective valve tracking. Radiology. (2008) 249:792–800.
22. Marsan NA, Westenberg JJM, Ypenburg C, Delgado V, van Bommel RJ, Roes SD, et al. Quantification of functional mitral regurgitation by real-time 3D echocardiography. comparison with 3D velocity-encoded cardiac magnetic resonance. JACC Cardiovasc Imaging. (2009) 2:1245–52. doi: 10.1016/j.jcmg.2009.07.006
23. Ramos JG, Fyrdahl A, Wieslander B, Thalén S, Reiter G, Reiter U, et al. Comprehensive cardiovascular magnetic resonance diastolic dysfunction grading shows very good agreement compared with echocardiography. JACC Cardiovasc Imaging. (2020) 13:2530–42. doi: 10.1016/j.jcmg.2020.06.027
24. Brandts A, Bertini M, Van Dijk EJ, Delgado V, Marsan NA, Van Der Geest RJ, et al. Left ventricular diastolic function assessment from three-dimensional three-directional velocity-encoded MRI with retrospective valve tracking. J Magn Reson Imaging. (2011) 33:312–9. doi: 10.1002/jmri.22424
25. Carlsson M, Heiberg E, Toger J, Arheden H. Quantification of left and right ventricular kinetic energy using four-dimensional intracardiac magnetic resonance imaging flow measurements. Am J Physiol Heart Circ Physiol. (2012) 302:893–900.
26. Nakaji K, Itatani K, Tamaki N, Morichi H, Nakanishi N, Takigami M, et al. Assessment of biventricular hemodynamics and energy dynamics using lumen-tracking 4D flow MRI without contrast medium. J Cardiol. (2021) 78:79–87. doi: 10.1016/j.jjcc.2021.01.004
27. Crandon S, Westenberg JJM, Swoboda PP, Fent GJ, Foley JRJ, Chew PG, et al. Impact of age and diastolic function on novel, 4D flow CMR biomarkers of left ventricular blood flow kinetic energy. Sci Rep. (2018) 8:1–11. doi: 10.1038/s41598-018-32707-5
28. Eriksson J, Carlhäll C, Dyverfeldt P, Engvall J, Bolger A, Ebbers T. Semi-automatic quantification of 4D left ventricular blood flow. J Cardiovasc Magn Reson. (2010) 12:1–10.
29. Kamphuis VP, Westenberg JJM, van der Palen RLF, van den Boogaard PJ, van der Geest RJ, de Roos A, et al. Scan–rescan reproducibility of diastolic left ventricular kinetic energy, viscous energy loss and vorticity assessment using 4D flow MRI: analysis in healthy subjects. Int J Cardiovasc Imaging. (2018) 34:905–20. doi: 10.1007/s10554-017-1291-z
30. Wong J, Chabiniok R, de Vecchi A, Dedieu N, Sammut E, Schaeffter T, et al. Age-related changes in intraventricular kinetic energy: a physiological or pathological adaptation? Am J Physiol Heart Circ Physiol. (2016) 310:H747–55.
31. Kanski M, Arvidsson PM, Töger J, Borgquist R, Heiberg E, Carlsson M, et al. Left ventricular fluid kinetic energy time curves in heart failure from cardiovascular magnetic resonance 4D flow data. J Cardiovasc Magn Reson. (2015) 17:1–10. doi: 10.1186/s12968-015-0211-4
32. Garg P, Crandon S, Swoboda PP, Fent GJ, Foley JRJ, Chew PG, et al. Left ventricular blood flow kinetic energy after myocardial infarction – insights from 4D flow cardiovascular magnetic resonance. J Cardiovasc Magn Reson. (2018) 20:1–15. doi: 10.1186/s12968-018-0483-6
33. Steding-Ehrenborg K, Arvidsson PM, Töger J, Rydberg M, Heiberg E, Carlsson M, et al. Determinants of kinetic energy of blood flow in the four-chambered heart in athletes and sedentary controls. Am J Physiol Heart Circ Physiol. (2016) 310:H113–22. doi: 10.1152/ajpheart.00544.2015
34. Garg P, Van Der Geest RJ, Swoboda PP, Crandon S, Fent GJ, Foley JRJ, et al. Left ventricular thrombus formation in myocardial infarction is associated with altered left ventricular blood flow energetics. Eur Heart J Cardiovasc Imaging. (2019) 20:108–17.
35. Riva A, Sturla F, Pica S, Camporeale A, Tondi L, Saitta S, et al. Comparison of four-dimensional magnetic resonance imaging analysis of left ventricular fluid dynamics and energetics in ischemic and restrictive cardiomyopathies. J Magn Reson Imaging. (2022). doi: 10.1002/jmri.28076
36. Al-Wakeel N, Fernandes JF, Amiri A, Siniawski H, Goubergrits L, Berger F, et al. Hemodynamic and energetic aspects of the left ventricle in patients with mitral regurgitation before and after mitral valve surgery. J Magn Reson Imaging. (2015) 42:1705–12. doi: 10.1002/jmri.24926
37. Hu L, Ouyang R, Sun A, Wang Q, Guo C, Peng Y, et al. Pulmonary artery hemodynamic assessment of blood flow characteristics in repaired tetralogy of Fallot patients versus healthy child volunteers. Quant Imaging Med Surg. (2020) 10:921–33. doi: 10.21037/qims.2020.03.23
38. Fredriksson A, Trzebiatowska-Krzynska A, Dyverfeldt P, Engvall J, Ebbers T, Carlhäll CJ. Turbulent kinetic energy in the right ventricle: potential MR marker for risk stratification of adults with repaired tetralogy of fallot. J Magn Reson Imaging. (2018) 47:1043–53. doi: 10.1002/jmri.25830
39. Barker AJ, Van Ooij P, Bandi K, Garcia J, Albaghdadi M, McCarthy P, et al. Viscous energy loss in the presence of abnormal aortic flow. Magn Reson Med. (2014) 72:620–8.
40. Binter C, Gotschy A, Sündermann SH, Frank M, Tanner FC, Lüscher TF, et al. Turbulent kinetic energy assessed by multipoint 4-dimensional flow magnetic resonance imaging provides additional information relative to echocardiography for the determination of aortic stenosis severity. Circ Cardiovasc Imaging. (2017) 10:1–8. doi: 10.1161/CIRCIMAGING.116.005486
41. Elbaz MSM, van der Geest RJ, Calkoen EE, de Roos A, Lelieveldt BPF, Roest AAW, et al. Assessment of viscous energy loss and the association with three-dimensional vortex ring formation in left ventricular inflow: in vivo evaluation using four-dimensional flow MRI. Magn Reson Med. (2017) 77:794–805. doi: 10.1002/mrm.26129
42. Zajac J, Eriksson J, Dyverfeldt P, Bolger AF, Ebbers T, Carlhäll CJ. Turbulent kinetic energy in normal and myopathic left ventricles. J Magn Reson Imaging. (2015) 41:1021–9. doi: 10.1002/jmri.24633
43. Urchuk SN, Plewes DB. MR measurement of pulsatile pressure gradients. J Magn Reson Imaging. (1994) 4:829–36.
44. Eriksson J, Bolger AF, Carlhäll CJ, Ebbers T. Spatial heterogeneity of four-dimensional relative pressure fields in the human left ventricle. Magn Reson Med. (2015) 74:1716–25. doi: 10.1002/mrm.25539
45. Tyszka JM, Laidlaw DH, Asa JW, Silverman JM. Three-dimensional, time-resolved (4D) relative pressure mapping using magnetic resonance imaging. J Magn Reson Imaging. (2000) 12:321–9.
46. Van Ooij P, Allen BD, Contaldi C, Garcia J, Collins J, Carr J, et al. 4D flow MRI and T1-mapping: assessment of altered cardiac hemodynamics and extracellular volume fraction in hypertrophic cardiomyopathy. J Magn Reson Imaging. (2016) 43:107–14. doi: 10.1002/jmri.24962
47. Marlevi D, Balmus M, Hessenthaler A, Viola F, Fovargue D, de Vecchi A, et al. Non-invasive estimation of relative pressure for intracardiac flows using virtual work-energy. Med Image Anal. (2021) 68:101948. doi: 10.1016/j.media.2020.101948
48. Pedrizzetti G, Martiniello AR, Bianchi V, D’Onofrio A, Caso P, Tonti G. Cardiac fluid dynamics anticipates heart adaptation. J Biomech. (2015) 48:388–91. doi: 10.1016/j.jbiomech.2014.11.049
49. Vallelonga F, Airale L, Tonti G, Argulian E, Milan A, Narula J, et al. Introduction to hemodynamic forces analysis: moving into the new frontier of cardiac deformation analysis. J Am Heart Assoc. (2021) 10:e023417. doi: 10.1161/JAHA.121.023417
50. Eriksson J, Zajac J, Alehagen U, Bolger AF, Ebbers T, Carlhäll CJ. Left ventricular hemodynamic forces as a marker of mechanical dyssynchrony in heart failure patients with left bundle branch block. Sci Rep. (2017) 7:1–9. doi: 10.1038/s41598-017-03089-x
51. Arvidsson PM, Töger J, Pedrizzetti G, Heiberg E, Borgquist R, Carlsson M, et al. Hemodynamic forces using four-dimensional flow MRI: an independent biomarker of cardiac function in heart failure with left ventricular dyssynchrony? Am J Physiol Heart Circ Physiol. (2018) 315:H1627–39. doi: 10.1152/ajpheart.00112.2018
52. Lapinskas T, Pedrizzetti G, Stoiber L, Düngen HD, Edelmann F, Pieske B, et al. The intraventricular hemodynamic forces estimated using routine CMR cine images: a new marker of the failing heart. JACC Cardiovasc Imaging. (2019) 12:377–9. doi: 10.1016/j.jcmg.2018.08.012
53. Arvidsson PM, Nelsson A, Magnusson M, Smith JG, Carlsson M, Arheden H. Hemodynamic force analysis is not ready for clinical trials on HFpEF. Sci Rep. (2022) 12:1–9.
54. Casas B, Viola F, Cedersund G, Bolger AF, Karlsson M, Carlhäll CJ, et al. Non-invasive assessment of systolic and diastolic cardiac function during rest and stress conditions using an integrated image-modeling approach. Front Physiol. (2018) 9:1515. doi: 10.3389/fphys.2018.01515
55. Eriksson J, Bolger AF, Ebbers T, Carlhäll CJ. Assessment of left ventricular hemodynamic forces in healthy subjects and patients with dilated cardiomyopathy using 4D flow MRI. Physiol Rep. (2016) 4:e12685.
56. Kim WY, Walker PG, Pedersen EM, Poulsen JK, Oyre S, Houlind K, et al. Left ventricular blood flow patterns in normal subjects: a quantitative analysis by three-dimensional magnetic resonance velocity mapping. J Am Coll Cardiol. (1995) 26:224–38. doi: 10.1016/0735-1097(95)00141-l
57. Föll D, Taeger S, Bode C, Jung B, Markl M. Age, gender, blood pressure, and ventricular geometry influence normal 3D blood flow characteristics in the left heart. Eur Heart J Cardiovasc Imaging. (2013) 14:366–73. doi: 10.1093/ehjci/jes196
58. Gharib M, Rambod E, Kheradvar A, Sahn DJ, Dabiri JO. Optimal vortex formation as an index of cardiac health. Proc Natl Acad Sci USA. (2006) 103:6305–8.
59. Ghosh E, Kovács SJ. The vortex formation time to diastolic function relation: assessment of pseudonormalized versus normal filling. Physiol Rep. (2013) 1:e00170. doi: 10.1002/phy2.170
60. Reiter G, Reiter U, Kovacs G, Kainz B, Schmidt K, Maier R, et al. Magnetic resonance-derived 3-dimensional blood flow patterns in the main pulmonary artery as a marker of pulmonary hypertension and a measure of elevated mean pulmonary arterial pressure. Circ Cardiovasc Imaging. (2008) 1:23–30. doi: 10.1161/CIRCIMAGING.108.780247
61. Reiter G, Reiter U, Kovacs G, Olschewski H, Fuchsjäger M. Blood flow vortices along the main pulmonary artery measured with MR imaging for diagnosis of pulmonary hypertension. Radiology. (2015) 275:71–9.
62. Elbaz MSM, Calkoen EE, Westenberg JJM, Lelieveldt BPF, Roest AAW, Van Der Geest RJ. Vortex flow during early and late left ventricular filling in normal subjects: quantitative characterization using retrospectively-gated 4D flow cardiovascular magnetic resonance and three-dimensional vortex core analysis. J Cardiovasc Magn Reson. (2014) 16:1–12. doi: 10.1186/s12968-014-0078-9
63. Kräuter C, Reiter U, Reiter C, Nizhnikava V, Masana M, Schmidt A, et al. Automated mitral valve vortex ring extraction from 4D-flow MRI. Magn Reson Med. (2020) 84:3396–408. doi: 10.1002/mrm.28361
64. Arvidsson PM, Kovács SJ, Töger J, Borgquist R, Heiberg E, Carlsson M, et al. Vortex ring behavior provides the epigenetic blueprint for the human heart. Sci Rep. (2016) 6:22021. doi: 10.1038/srep22021
65. Suwa K, Saitoh T, Takehara Y, Sano M, Saotome M, Urushida T, et al. Intra-left ventricular flow dynamics in patients with preserved and impaired left ventricular function: analysis with 3D cine phase contrast MRI (4D-Flow). J Magn Reson Imaging. (2016) 44:1493–503. doi: 10.1002/jmri.25315
66. Töger J, Kanski M, Carlsson M, Kovács SJ, Söderlind G, Arheden H, et al. Vortex ring formation in the left ventricle of the heart: analysis by 4D flow MRI and Lagrangian coherent structures. Ann Biomed Eng. (2012) 40:2652–62. doi: 10.1007/s10439-012-0615-3
67. Schäfer M, Browning J, Schroeder JD, Shandas R, Kheyfets VO, Buckner JK, et al. Vorticity is a marker of diastolic ventricular interdependency in pulmonary hypertension. Pulm Circ. (2016) 6:46–54. doi: 10.1086/685052
68. Schäfer M, Humphries S, Stenmark KR, Kheyfets VO, Buckner JK, Hunter KS, et al. 4D-flow cardiac magnetic resonance-derived vorticity is sensitive marker of left ventricular diastolic dysfunction in patients with mild-to-moderate chronic obstructive pulmonary disease. Eur Heart J Cardiovasc Imaging. (2018) 19:415–24. doi: 10.1093/ehjci/jex069
69. Rutkowski DR, Barton GP, François CJ, Aggarwal N, Roldán-Alzate A. Sex differences in cardiac flow dynamics of healthy volunteers. Radiol Cardiothorac Imaging. (2020) 2:e190058.
70. Töger J, Kanski M, Arvidsson PM, Carlsson M, Kovács SJ, Borgquist R, et al. Vortex-ring mixing as a measure of diastolic function of the human heart: phantom validation and initial observations in healthy volunteers and patients with heart failure. J Magn Reson Imaging. (2016) 43:1386–97. doi: 10.1002/jmri.25111
71. Bolger AF, Heiberg E, Karlsson M, Wigström L, Engvall J, Sigfridsson A, et al. Transit of blood flow through the human left ventricle mapped by cardiovascular magnetic resonance. J Cardiovasc Magn Reson. (2007) 9:741–7.
72. Eriksson J, Dyverfeldt P, Engvall J, Bolger AF, Ebbers T, Carlhäll CJ. Quantification of presystolic blood flow organization and energetics in the human left ventricle. Am J Physiol Heart Circ Physiol. (2011) 300:2135–41. doi: 10.1152/ajpheart.00993.2010
73. Corrado PA, Macdonald JA, François CJ, Aggarwal NR, Weinsaft JW, Wieben O. Reduced regional flow in the left ventricle after anterior acute myocardial infarction: a case control study using 4D flow MRI. BMC Med Imaging. (2019) 19:101. doi: 10.1186/s12880-019-0404-7
74. Eriksson J, Bolger AF, Ebbers T, Carlhäll CJ. Four-dimensional blood flow-specific markers of LV dysfunction in dilated cardiomyopathy. Eur Heart J Cardiovasc Imaging. (2013) 14:417–24. doi: 10.1093/ehjci/jes159
75. Svalbring E, Fredriksson A, Eriksson J, Dyverfeldt P, Ebbers T, Bolger AF, et al. Altered diastolic flow patterns and kinetic energy in subtle left ventricular remodeling and dysfunction detected by 4D flow MRI. PLoS One. (2016) 11:e0161391. doi: 10.1371/journal.pone.0161391
76. Stoll VM, Loudon M, Eriksson J, Bissell MM, Dyverfeldt P, Ebbers T, et al. Test-retest variability of left ventricular 4D flow cardiovascular magnetic resonance measurements in healthy subjects. J Cardiovasc Magn Reson. (2018) 20:15. doi: 10.1186/s12968-018-0432-4
77. Sundin J, Engvall J, Nylander E, Ebbers T, Bolger AF, Carlhäll CJ. Improved efficiency of intraventricular blood flow transit under cardiac stress: a 4D flow dobutamine CMR study. Front Cardiovasc Med. (2020) 7:581495. doi: 10.3389/fcvm.2020.581495
78. Karlsson LO, Erixon H, Ebbers T, Bolger A, Carlhäll CJ. Post-cardioversion improvement in LV function defined by 4D flow patterns and energetics in patients with atrial fibrillation. Front Physiol. (2019) 10:659. doi: 10.3389/fphys.2019.00659
79. Stoll VM, Hess AT, Rodgers CT, Bissell MM, Dyverfeldt P, Ebbers T, et al. Left ventricular flow analysis novel imaging biomarkers and predictors of exercise capacity in heart failure. Circ Cardiovasc Imaging. (2019) 12:e008130. doi: 10.1161/CIRCIMAGING.118.008130
80. Zajac J, Eriksson J, Alehagen U, Ebbers T, Bolger AF, Carlhäll CJ. Mechanical dyssynchrony alters left ventricular flow energetics in failing hearts with LBBB: a 4D flow CMR pilot study. Int J Cardiovasc Imaging. (2018) 34:587–96. doi: 10.1007/s10554-017-1261-5
81. Dyverfeldt P, Bissell M, Barker AJ, Bolger AF, Carlhäll CJ, Ebbers T, et al. 4D flow cardiovascular magnetic resonance consensus statement. J Cardiovasc Magn Reson. (2015) 17:1–19.
82. Stankovic Z, Allen BD, Garcia J, Jarvis KB, Markl M. Flow imaging with MRI. Cardiovasc Neurovasc Imaging. (2015) 4:333–58.
83. Buehrer M, Curcic J, Boesiger P, Kozerke S. Prospective self-gating for simultaneous compensation of cardiac and respiratory motion. Magn Reson Med. (2008) 60:683–90. doi: 10.1002/mrm.21697
Keywords: diastolic function, heart failure, 4D flow cardiac MR, kinetic energy, flow components, vortex
Citation: Ashkir Z, Myerson S, Neubauer S, Carlhäll C-J, Ebbers T and Raman B (2022) Four-dimensional flow cardiac magnetic resonance assessment of left ventricular diastolic function. Front. Cardiovasc. Med. 9:866131. doi: 10.3389/fcvm.2022.866131
Received: 30 January 2022; Accepted: 30 June 2022;
Published: 22 July 2022.
Edited by:
Giulia Elena Mandoli, University of Siena, ItalyReviewed by:
Francesco Sturla, IRCCS San Donato Polyclinic, ItalyCopyright © 2022 Ashkir, Myerson, Neubauer, Carlhäll, Ebbers and Raman. This is an open-access article distributed under the terms of the Creative Commons Attribution License (CC BY). The use, distribution or reproduction in other forums is permitted, provided the original author(s) and the copyright owner(s) are credited and that the original publication in this journal is cited, in accordance with accepted academic practice. No use, distribution or reproduction is permitted which does not comply with these terms.
*Correspondence: Betty Raman, YmV0dHkucmFtYW5AY2FyZGlvdi5veC5hYy51aw==
Disclaimer: All claims expressed in this article are solely those of the authors and do not necessarily represent those of their affiliated organizations, or those of the publisher, the editors and the reviewers. Any product that may be evaluated in this article or claim that may be made by its manufacturer is not guaranteed or endorsed by the publisher.
Research integrity at Frontiers
Learn more about the work of our research integrity team to safeguard the quality of each article we publish.