 Man Kang
 Xue-Feng Wang
 Jing Xiao3
 He Tian
- 1The School of Integrated Circuits, Tsinghua University, Beijing, China
- 2The Beijing National Research Center for Information Science and Technology, Tsinghua University, Beijing, China
- 3Ping An AI Research Center, Ping an Technology (Shenzhen) Co. Ltd., Shenzhen, China
Electrocardiogram (ECG), as a product that can most directly reflect the electrical activity of the heart, has become the most common clinical technique used for the analysis of cardiac abnormalities. However, it is a heavy and tedious burden for doctors to analyze a large amount of ECG data from the long-term monitoring system. The realization of automatic ECG analysis is of great significance. This work proposes a beat-level interpretation method based on the automatic annotation algorithm and object detector, which abandons the previous mode of separate R peak detection and heartbeat classification. The ground truth of the QRS complex is automatically annotated and also regarded as the object the model can learn like category information. The object detector unifies the localization and classification tasks, achieving an end-to-end optimization as well as decoupling the high dependence on the R peak. Compared with most advanced methods, this work shows superior performance. For the interpretation of 12 heartbeat types in the MIT-BIH dataset, the average accuracy is 99.60%, the average sensitivity is 97.56%, and the average specificity is 99.78%. This method can be used as a clinical auxiliary tool to help doctors diagnose arrhythmia after receiving large-scale database training.
Introduction
The WHO report regards cardiovascular disease as one of the leading causes of death worldwide, and it will continue to exist in the near future. The burden of cardiovascular disease is so heavy that research on heart health has to be taken seriously. Electrocardiogram (ECG), as a product that can most directly reflect the electrical activity of the heart, has become the most common clinical technique used for the analysis of cardiac abnormalities. However, it is a heavy and tedious burden for doctors to analyze a large amount of ECG data from the long-term monitoring system. It is necessary to realize automatic ECG analysis.
In the past few decades, the open source ECG databases have promoted the development of automatic ECG analysis. Most methods are based on one-dimensional ECG signals, as shown in Figure 1A, which mainly involve four steps: signal preprocessing, R-peak detection, feature extraction, and classifier construction.
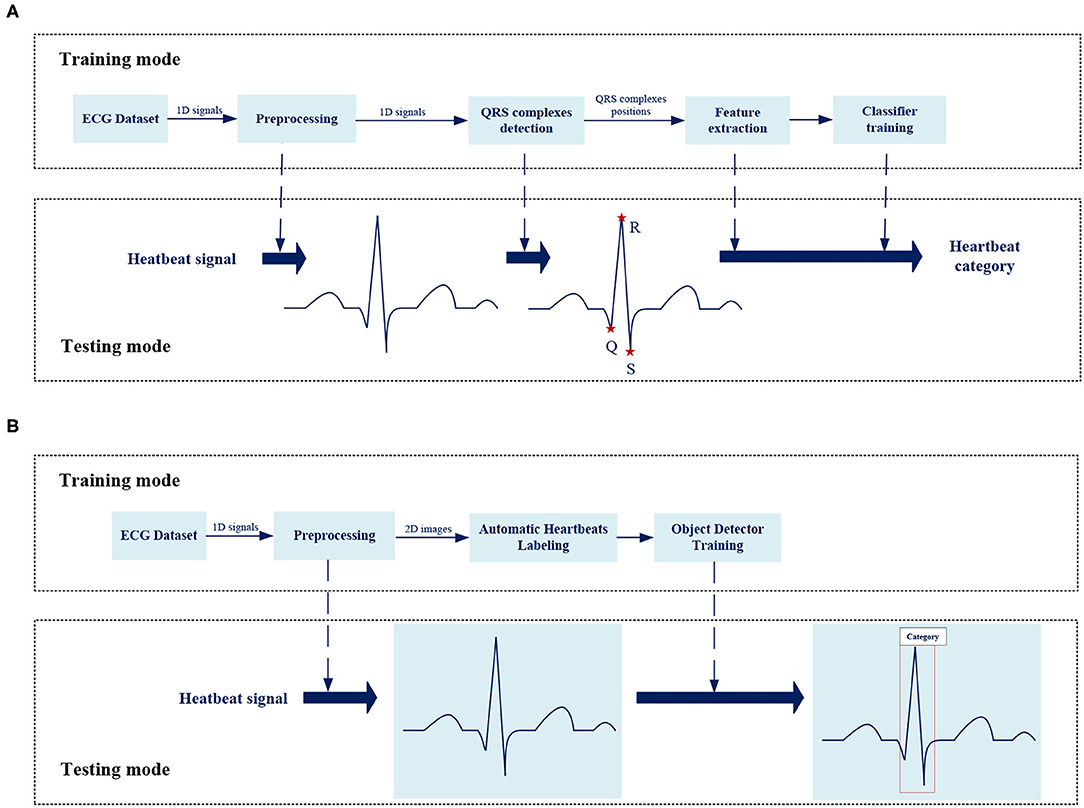
Figure 1. The overview of the framework for analysis of ECG abnormality. (A) The framework of traditional method for ECG analysis. (B) The framework of proposed method for ECG analysis.
R-Peak Detection
Over the years, a large number of studies have made efforts in QRS complex detection. Pan and Tompkins (1) realized the automatic detection of the R-peak through the first derivative, non-linear transformation and amplitude/noise threshold. Using time-domain features, Yeh and Wang (2) proposed a differential operation method (DOM) algorithm. Li et al. (3) introduced wavelet transform to the automatic detection of R-peak for the first time. Martinez et al. (4) remove the singularity analysis, and consider any possible QRS complex wave shape, search for positive and negative zero crossing points. Manikandan and Soman (5) introduced a new method using Shannon energy estimation and Hilbert transform. These methods are time-consuming, which require complex mathematical calculations, as well as the accuracy is not always ideal.
Heartbeat Classification
According to different feature extraction methods, heartbeat classification can be divided into artificial methods and automatic methods. Common artificial features include morphological features (6–8) such as RR interval, and ECG transform coefficients (9–13) such as wavelet transform. These features are sent to a traditional classifier for interpretation. For example, Hu (14) extracted features based on multiple discriminant and principal component analysis, and used support vector machine (SVM) for classification. Song et al. used linear discriminant analysis combined with SVM to analyze six types of arrhythmias (15). Melgani and Bazi proposed an SVM classifier based on particle swarm optimization (16). Martis et al. used a four-layer feedforward neural network and a least squares support vector machine (LS-SVM) to divide heart beats into five categories (17). Ganeshkumar and Kumaraswamy introduced a random forest tree (RFT) as a classifier (18). Park et al. proposed a K-nearest neighbor (K-NN) classifier (19). Jun et al. proposed a parallel K-NN classifier for high-speed arrhythmia detection (20). The accuracy of the above methods highly depends on the effectiveness of feature extraction, which requires strong scientific theories and doctors' personal experience as support, as well as the computational complexity is high. With the development and application of deep learning technology, it has also become a research hotspot in the field of ECG classification. In some previous studies, the simple 1D-CNN was used to classify a time series of ECG signals (21–23) or one-dimensional heartbeats (24). Acharya et al. proposed a nine-layer deep CNN (25), which can identify five different heartbeats. Chauhan and Vig used the deep long short-term memory (LSTMs) network to classify abnormal and normal signals (26). Eltrass et al. (27) proposed the CQ-NSGT algorithm, a new method for converting one-dimensional signals into time-frequency maps, and used AlexNet for time-frequency maps classification. Warrick and Homosi proposed a new method to automatically classify arrhythmias in ECG, using a combination of CNN and LSTM (28). Shu et al. also proposed a system with combination of CNN and LSTM (29) to identify five heart beats. Wong et al. (30) proposed a FPGA implementation of ECG classifier based on bCNN, the core of which is to reduce the computational complexity of CNN. Yao et al. (31) proposed an integrated CNN and GRU classifier to classify a time series of ECG signals. Sarin et al. (32) compared the classification accuracy of MLP, CNN, and LSTM on a subset of the MIT-BIH dataset.
Most previous works just classify a signal over a long period of time to get simple information about the existence of abnormality. There are many types of heartbeats in a section of ECG signal such as bigeminy and trigeminy, so this work focuses on the interpretation of beat-level to get detailed information about each beat for further analysis. Beat-level classification in the past required the R-peak detection before classification especially the inference stage also cost the same as the training mode. More importantly, the classification accuracy was highly dependent on R-peak detection quality and the independence of R-peak detection made end-to-end optimization impossible. In this work, the position of QRS complex is also taken as the object to be learned by the model-like category information, which unifies the positioning and classification tasks based on the object detector, achieving an end-to-end overall optimization without independent time-consuming R-peak detection process. Besides, we expect the model to classify by learning features from the morphology of heartbeats, much like doctor's eyes, as shown in Figure 1B, this work analyzes the original two-dimensional images of heartbeats, not performing a series of complex mathematical calculations for one-dimensional signals or time-frequency diagram.
Proposed Method
Figure 1B shows the overall framework of the ECG analysis method in this work. There are two key designs: Automatic heartbeats annotation and Object detector.
Signal Preprocessing
The ECG signal has some interference such as baseline drift and high-frequency noise. In order to obtain a better detection effect in the follow-up, it is necessary to preprocess the signal in the early stage.
Power Frequency Interference
According to the standards published by the American College of Cardiology (ACC), for the normal ECG signal, the amplitude range is between 0.05 and 5 mV, the frequency range is within the range of 0.05–100 Hz, and the spectral energy is generally concentrated between 0.25 and 35 Hz. This work uses a Butterworth filter with a cutoff frequency of 45 Hz and order of 10 to remove power frequency interference. In order to evaluate the effect of noise reduction, we add a 50 Hz noise signal to simulate power frequency interference. Figure 2 shows the comparison of the effect before and after the noise signal processing.
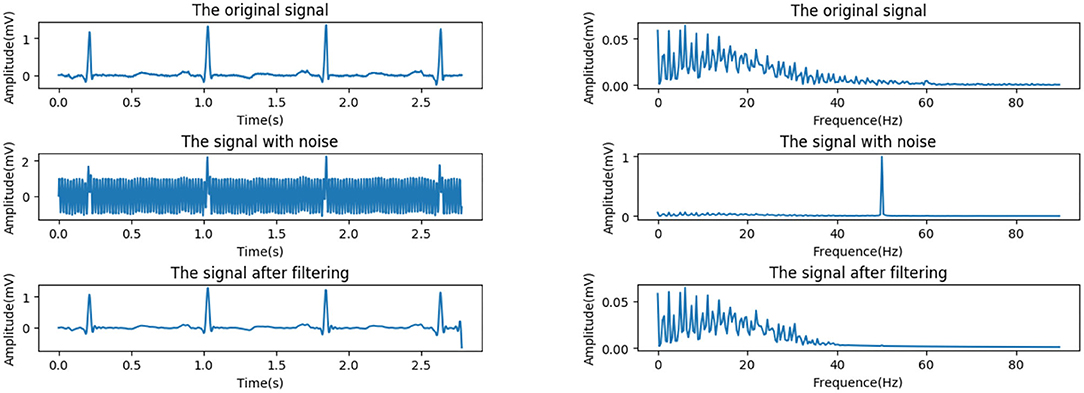
Figure 2. Power frequency interference reduction. (Left) Time domain. (Right) Frequency domain.
Baseline Drift
Baseline drift is generally caused by human breathing and electrode movement, which belongs to low-frequency interference, usually below 0.5 Hz. The ST-segment frequency band is in the range of 0.7–2.0 Hz, which partially overlaps with the baseline drift frequency band, 0.05–1.5 Hz. It is necessary to avoid obvious deformation of low frequency parts such as ST segment, or which will lead to detection and analysis distortion. Therefore, the median filter, which has a good effect on suppressing larger drift as well as protecting smaller P-wave and T-wave, is adopted.
The effect of drift removal mainly depends on the filter window width. If the width is too small, the fitted baseline has more high-frequency components, while too large width causes too much computation and affects speed of the algorithm. Considering both speed and effect, as well as for convenience of value, the width is set to half of the sampling rate.
Besides, in order to avoid edge effects, the signal is expanded before filtering. Specifically, the endpoint value instead of 0 is added to both ends of the signal to avoid larger errors.
Figure 3 shows the effects before and after the processing of a signal with severe baseline drift in the MIT-BIH database (see section MIT-BIH Database). It can be seen that the drift is well-suppressed, and only the very low-frequency part is attenuated while the high-frequency part is barely affected.

Figure 3. Baseline drift removing. (Left) Time domain. (Right) Frequency domain.
Automatic Heartbeats Annotation
After the signal preprocessing described in section Signal Preprocessing, the heartbeat images are saved in.jpg format. In order to take the position information as the object that can be learned by the subsequent model, it is necessary to annotate the location of the heartbeats.
The transient degree of signal is often described by singularity. Wavelet transform is an effective method to analyze signal singularity, which has promising features for characterizing the local regularity of signals by decomposing the signal into elementary building blocks that are well-localized both in time and frequency (33). Each pair of positive and negative modulus maximum of the wavelet coefficient corresponds to a signal singularity, and the zero-crossing point between the pair is the singularity position. The relationship between wavelet decomposition and singularity varies in different scales. The small scale reflects the high-frequency component of the signal, while the large scale corresponds to the opposite.
Different bands could be located by wavelet decomposition at different scales due to an ECG signal varies in frequency. Q-wave and S-wave are typical high-frequency waves with low amplitude, whose energy is concentrated in small scale.
We select the wavelet coefficients at j = 1 scale (34), and the officially marked R peaks are used as the reference to locate Q-wave and S-wave. The R peak corresponds to the zero-crossing point of the modulus maximum–minimum pair, Q-wave and S-wave are located at the modulus minimum and maximum within a certain range before and after the R peak, respectively. We need to give certain delay compensation during the actual operation because each waveform is not completely symmetric. Figure 4 shows the detailed process.
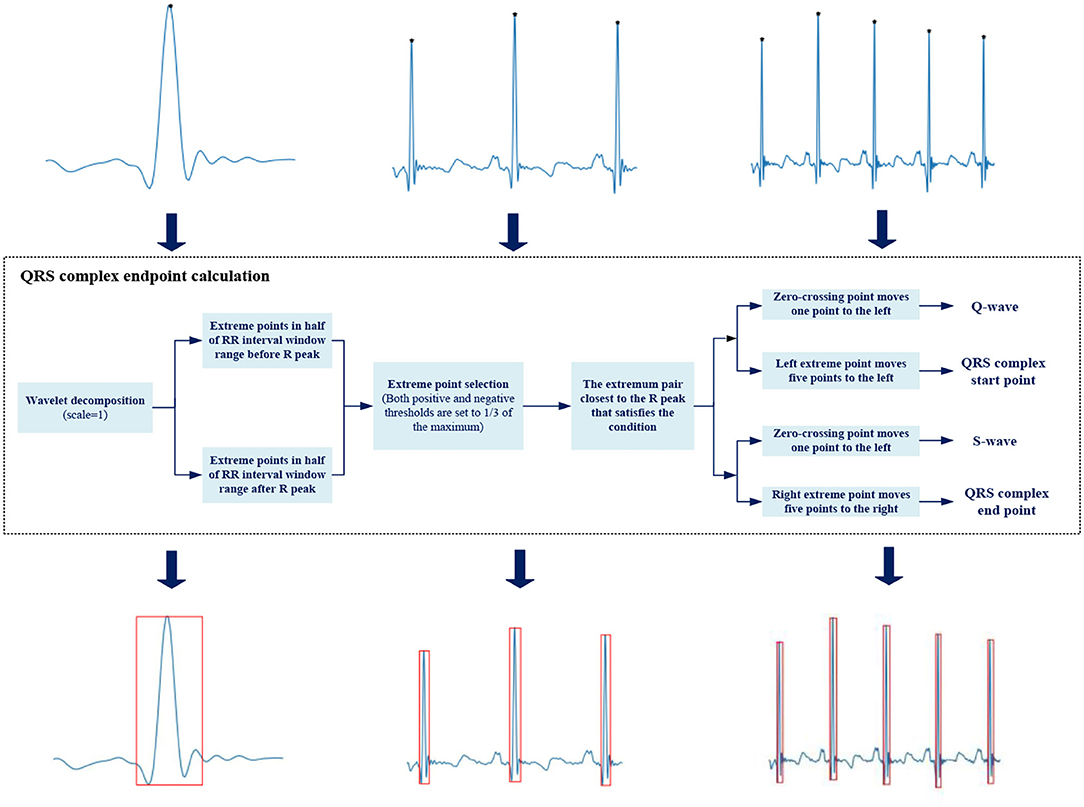
Figure 4. Automatic heartbeats annotation.
We use a rectangular box to annotate the position of QRS complex, with Q-wave position as the left boundary, S-wave position as the right boundary, R-peak position as the upper boundary, and the smaller ordinate in Q-wave and S-wave as the lower boundary. The upper left corner (xmin, ymin) and lower right corner (xmax, ymax) are saved as location information in .xml file format.
Object Detector
We use Cascade RCNN (35). as a basic model, and Figure 5 shows the overall framework of the model.
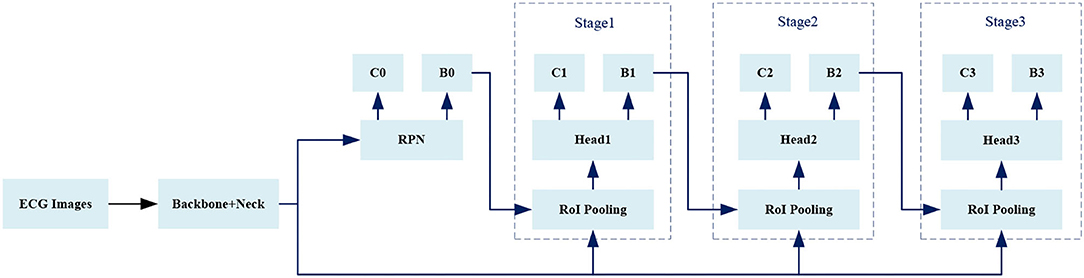
Figure 5. The framework of object detector.
Region Proposal Network
Region proposal network takes an image as input and outputs in a set of rectangular boxes called proposals. Each proposal has a score, which measures the confidence belongs to foreground. As shown in Figure 6, in order to generate a region proposal, we slide a small window of n*n (n = 3 in this work) on the convolutional feature map. Each sliding window is mapped to a lower-dimensional feature that is fed into two fully connected layer branches: a regression branch (reg) and a classification branch (cls). Since it operates in a sliding window mode, the fully connected layers are shared in all spatial locations.
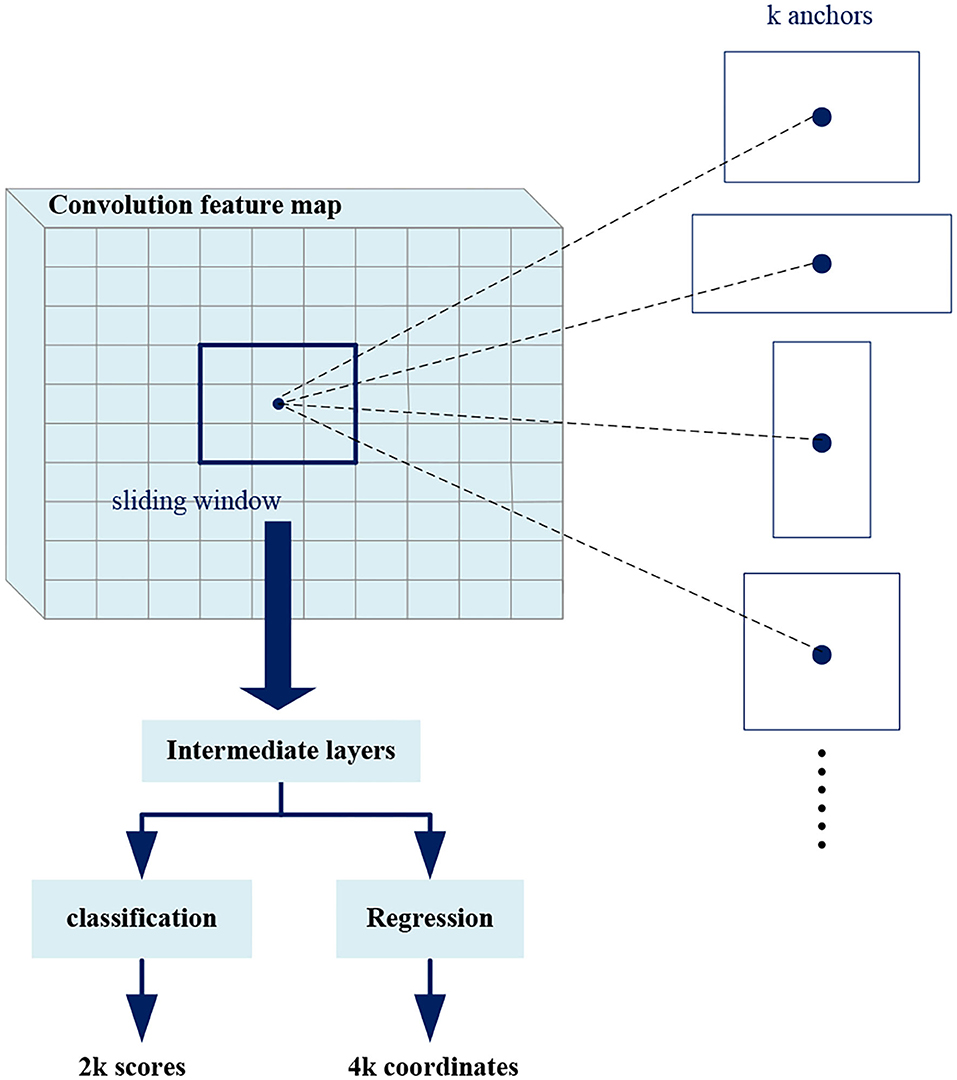
Figure 6. Region proposal network (RPN).
At each sliding window position, we predict multiple region proposals at the same time, where the maximum number of proposals at each position is denoted as k (k = 3). Therefore, the reg branch has 4k outputs to encode the coordinates of the k rectangular boxes, and the cls branch outputs 2k scores to estimate the foreground or background probability of each proposal. The k proposals are parameterized with respect to k reference boxes called anchors. The anchors center on the sliding window and are associated with scale and aspect ratio. In order to reduce redundancy, Non-maximum suppression (NMS) is used for proposals according to their scores. Then the proposals with top scores are selected for follow-up detection. The NMS is explained in detail later.
Region of Interest Pooling
Region of interest pooling uses maximum pooling to transform the features in RoI into a small feature map of fixed size H*W (7*7), where H and W are hyperparameters independent of any specific RoI. The inputs of RoI pooling are coordinate information of the proposals from RPN or that of the predicted boxes from previous stage, and the convolution feature map of a certain layer or several layers.
As shown in Figure 7, the RoI pooling layer maps the coordinates to the corresponding position in the feature map. Each RoI is a rectangular area in the convolutional feature map, which is defined by a quadruple (x, y, h, w), respectively, corresponding to its center point coordinates (x, y), height h, and width w. RoI pooling divides the RoI of h*w into H*W grids consisted of sub-windows of approximate size h/H*w/W, and performs maximum pooling operation on each sub-window. Pooling is applied to each feature map channel independently, just like standard maximum pooling, thus we get fixed size feature maps from RoIs of varying sizes.
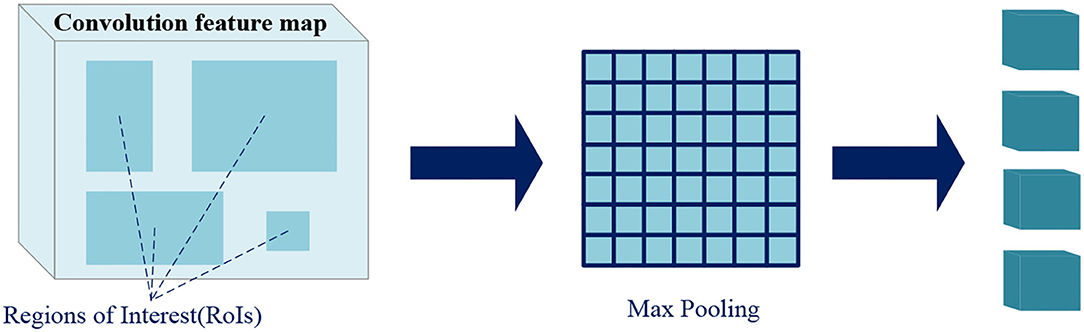
Figure 7. Region of interest (RoI) pooling.
Head
The Head layer is responsible for further processing the fixed size feature maps from RoI pooling to output the final detection results. Each feature map will go through a series of fully connected layers, and finally branch into two output layers, classification and regression. For each RoI, the classification layer outputs the softmax probabilities of C foreground classes and one background class, while the regression layer outputs four real numbers encoding predicted boxes position.
Loss Function
In order to calculate the loss of each predicted box, we need to classify them as foreground or background according to their Intersection over Union (IoU) with ground truths. IoU will be described in detail later.
Given an IoU threshold IoU_thres, the predicted boxes which have maximum IoU with ground truths and the predicted boxes whose IoU with any ground truth greater than IoU_thres are regarded as foregrounds, while the predicted boxes whose IoU with all ground truths less than IoU_thres are backgrounds. For Stage1, Stage2, and Stage3 in Figure 5, the value of IoU_thres is increasing.
A bounding box is encoded as (45),
where x, y, w, h are the center point's coordinates, width, and height of a rectangular box, x, xa, x*, respectively, correspond to the predicted box, anchor and ground truth, y, w, h are similar.
The location information we annotate are upper left corner (xmin, ymin) and lower right corner (xmax, ymax) of a rectangular box. So before calculating the regression loss, we convert the coordinates to a quadruple (x, y, h w), where
x=(xmin + xmax)/2, y=(ymin + ymax)/2, w=xmax-xmin, h=ymax-ymin,
Then the four values are encoded by Equation (1), which are used as ground truth labels.
The regression loss of a predicted box is defined as
where
The classification loss is calculated by cross entropy, which is defined as
where p is the softmax probability vector from the classification branch, c is the true category label, taking 0, 1, 2...C. C is the number of foreground classes, and 0 corresponds to the background class.
The loss function of each stage is defined as (35).
where balances the weight of classification loss and regression loss, only the boxes belong to foreground class need to be calculated for regression losses.
The total loss function is the sum of the three stages
Non-Maximum Suppression
Non-maximum suppression, which is usually used in the RPN and inference stage, aims to extract predicted boxes with high confidence and suppresses the predicted boxes with low confidence, thus could remove redundant boxes detecting the same object.
Before describing NMS, it is necessary to explain the IoU, which measures the overlap between two boxes. As shown in Figure 8, the IoU of box A and box B is
Obviously, the higher the IoU value, the higher the degree of overlap between two boxes.

Figure 8. Intersection over union (IoU).
For an image, the final classification branch and regression branch will output confidence scores and coordinate information of a series of boxes. The specific process of the NMS is as follows. B represents the box set. First, selecting the predicted box M with the maximum confidence score and adding it to the set D representing final results. Second, removing the box M and other category boxes whose IoU with M exceed preset threshold from B. Next, repeating the two steps until B is empty. In this work, only the boxes with the highest confidence score can be regarded as the final predicted results in NMS because there is no overlap between different heartbeat objects.
Experiments and Results
MIT-BIH Database
MIT-BIH arrhythmia database, one of the four internationally recognized standard ECG databases, is used for experimental evaluation in this work. The database contains a total of 48 records from 47 different patients, and the ECG signals are sampled at 360 Hz with 11-bit resolution.
Each record corresponds to about 30 min of ECG data, including signals from two leads. For all records, the first lead is the modified lead II (MLII) and the second lead is V1, V2, V4, or V5. Twenty-three records are randomly selected from 4,000 continuous 24-h dynamic ECG signals of patients at Beth Israel Hospital (BIH), while the remaining data are selected from a few rare ECG data samples and have important clinical significance. The notes are authoritatively certified by multiple cardiologists.
The Association for the Advancement of Medical Instrumentation (AAMI) (46) divides the heartbeats in the MIT-BIH database into five categories. Table 1 shows the specific categories and numbers.
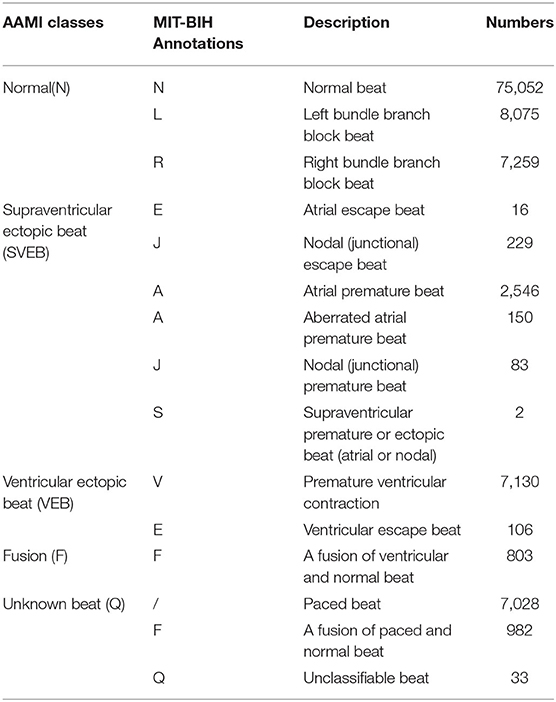
Table 1. Categories and numbers of beats in the MIT-BIH database.
Given MLII is the only lead representing all records in this database, as well as the most commonly used lead for experts to analyze, this work only extracts the ECG signals of MLII lead for experiments. According to AAMI's recommendation, the rhythm heartbeat records, i.e., 102, 104, 107, and 217, are not used, and the Q category which does not actually exist is also ignored.
In order to balance the number of different heartbeat categories, we only sample a part of Normal heartbeats as samples, and perform data augmentation by translating and resizing for various heartbeat images. A total of 60,000 heartbeat images are used in the final experiment, which are divided into training sets and testing sets in a ratio of 8:2. Table 2 shows the numbers for each category in detail.
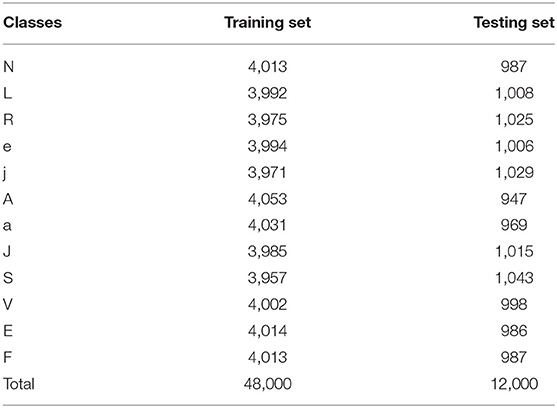
Table 2. Categories and numbers of beats.
Evaluation Metrics
Consistent with previous research, classification accuracy(Acc), sensitivity(Sen), and specificity(Spe) are used as evaluation metrics in this work.
The above metrics are applicable to each heartbeat category, where TP is the number of heartbeats correctly classified as positive samples, TN is the number of heartbeats correctly classified as negative samples, FP is the number of heartbeats incorrectly classified as positive samples, and FN is the number of heartbeats incorrectly classified as negative samples.
Implementation Details
We use the Cascade RCNN equipped with Feature Pyramid Network (FPN) (47) as our default framework, the ImageNet pre-trained ResNet-50 (48) is adopted as the backbone, and the RoI Align (49) is used to replace the RoI pooling. Our implementation and hyperparameters are based on MMDetection (50). Anchors with 1 scale and 3 aspect ratios are used. NMS with a threshold of 0.7 is used to generate 2,000 and 1,000 proposals for training and inference. In each training step, 512 proposals are sampled from 2,000 proposals for training, and the ratio of foreground to background proposals is 1:3.
The model is trained for 24 epochs on 4 GPUs with 4 images per GPU. With SGD optimizer, the learning rate is initialized to 0.02 and divided by 10 at the 16th and 22nd epoch. The weight decay and momentum are set to 0.0001 and 0.9, respectively.
The optimal model with the highest mAP@0.5 is obtained by using 5-fold cross-validation during training. Table 3 shows its prediction accuracy of each category on the testing set.
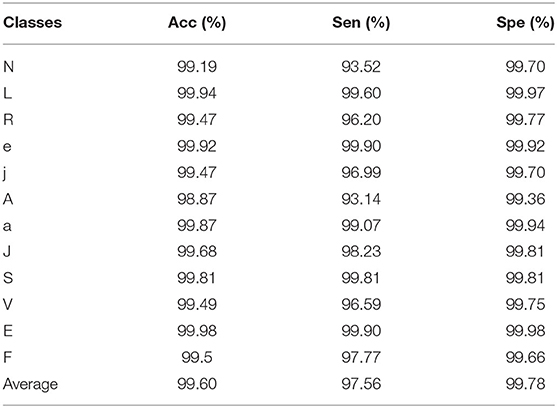
Table 3. The results of each category on testing set.
It is worth noting that the method in this work is not limited to the Cascade RCNN object detector, but applicable to other two-stage detectors or one-stage detectors. We could choose the appropriate detector as the basic model according to your needs.
Discussion
Traditional ECG analysis methods require independent QRS complex detection that causes that the effectiveness of feature extraction and classification are highly dependent on the earlier detection accuracy. Error detection and missing detection can have a negative impact on feature extraction and eventually cause wrong classification results.
On the one hand, the morphology of ECG varies from person to person, even the same individual at different times, and the signals are easily disturbed by noises, which resulting in the difficulty of QRS complex detection. On the other hand, the QRS complex detection process is separate, so it is hard to achieve an end-to-end overall optimization through model training. It takes much time and effort, which is not beneficial for real-time testing.
This work avoids independent QRS complexes detection, which decouples the high dependence of feature extraction and heartbeats classification on detection accuracy.
Overall Classification Performance
In order to take the position information as an object learned by the model, this work converts one-dimensional signals into two-dimensional images whose QRS complex position is annotated by automatic annotation algorithm. The positioning and classification tasks are unified in this work.
This work focuses on the interpretation of beat-level. Especially for an ECG signal containing multiple types of heartbeats such as bigeminy and trigeminy, we can get a detailed category of each beat for further analysis, rather than only the existence of abnormality by just classifying a signal over a long period of time.
In general, this work shows good performance in the beat-level classification of intra-patient paradigm. Table 4 shows a comparison with previous work. It can be seen that our method achieves the best results in both average classification accuracy and specificity. The sensitivity is slightly lower than some work which has fewer categories of interpretation. Obviously, our method is more advantageous in the number of categories.
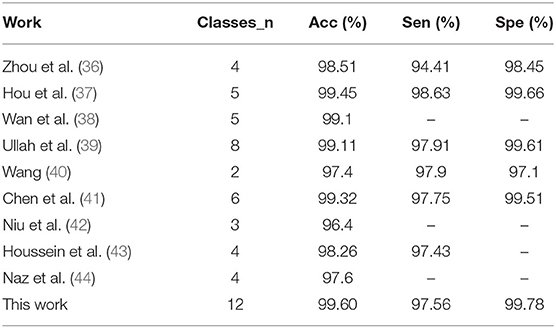
Table 4. The performance of our proposed method compared with previous work.
The Importance of Object Detector
The human visual system is fast and accurate. At a glance, you can immediately know what the objects in the image are, where they are, and how they interact. We apply computer vision knowledge to ECG abnormality analysis, and use the object detection framework to directly predict the bounding boxes and class probabilities from the heartbeat images. During training and testing, the model can see the entire heartbeat image, so it implicitly encodes contextual information about the class and appearance to detect foreground objects more accurately, as well as directly optimizes the detection performance end-to-end.
This work constructs an object detection framework for heartbeat images based on Cascade RCNN, which consists of a series of cascading detection networks. Each detection network is trained on positive and negative samples based on different IoU thresholds. The output of the former network serves as the input to the latter, which is a stage-by-stage training method. The detector of each stage focuses on detecting the proposals whose IoU are in a certain range. The detection effect gets better and better since the output IoU is generally larger than the input IoU. We take a part of the heartbeat images as samples; Table 5 shows the detection accuracy of Faster RCNN (51) and Cascade RCNN on the four categories recommended by AAMI. Obviously, Cascade RCNN is more effective, whose mAP@0.5 value is about 2 percent higher than Faster RCNN.
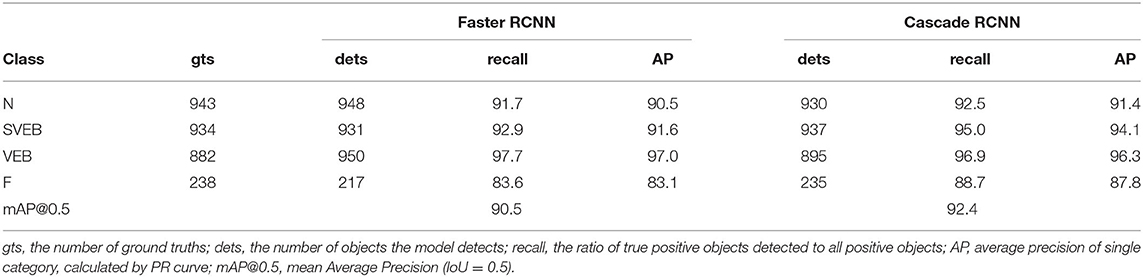
Table 5. Comparison of detection performance between Faster RCNN and Cascade RCNN.
The Effectiveness of Automatic Location Annotation
As we all known that the annotations play an important role in an object detection task, but only about 200–300 images can be processed per hour if we manually annotate images one by one like the similar work (51, 52). Obviously, the high human cost will discourage users and hardly expand to larger datasets, which deeply reduce the value of this kind of method.
A core strategy in this work is to automatically annotate the QRS complex position of the heartbeat images, which avoids the extremely time-consuming manual labeling process. Thousands of images can be annotated in just a few minutes, so instead of fixed lengths like one beat length (51) or 10 s (52), we can easily get the signal sequences of different lengths, as shown in Figure 4, which is beneficial for testing samples of unknown length.
Except for the improved classification accuracy as described in section Overall Classification Performance, the annotation is also essential for reducing the complexity during the inference stage. In the testing mode of traditional methods, as shown in Figure 1A, the preprocessed signals still need to perform the same process including QRS detection and feature extraction as in the training mode. The training stage does not facilitate the inference stage. The proposed method spends some labeling costs during the training stage, while in the testing mode, as shown in Figure 1B, the preprocessed signals need only be fed into the pretrained model as images. Figure 9 visualizes the prediction results for different categories of heartbeats; the model could output both the position of the QRS complex in the form of a rectangular box and the heartbeat category with a confidence score.
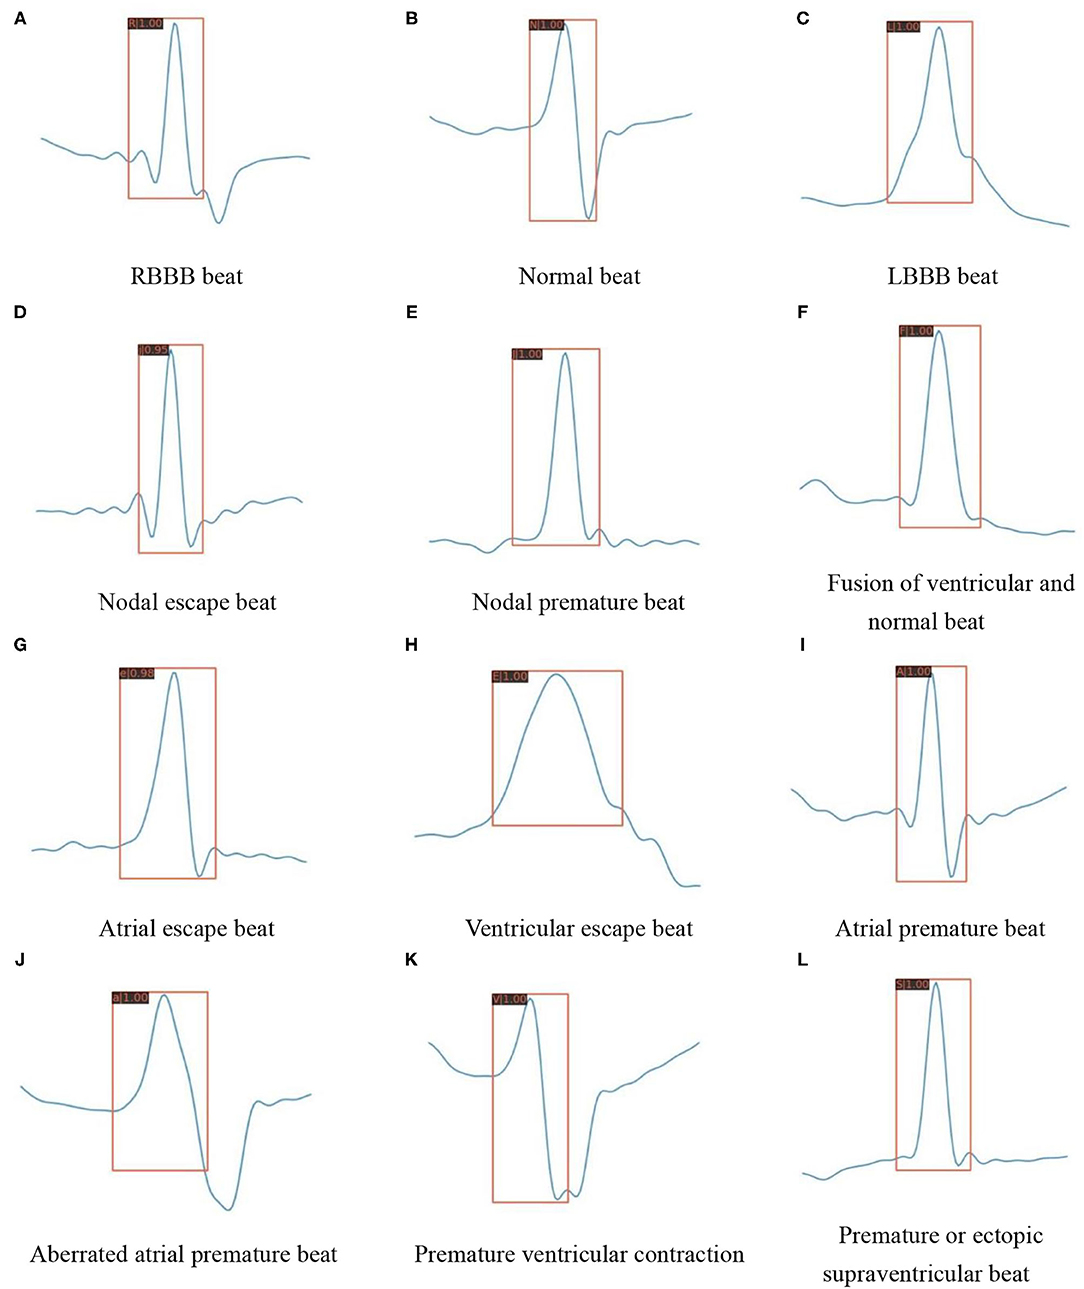
Figure 9. Detection results of the proposed model on various heartbeat images. (A) RBBB beat. (B) Normal beat. (C) LBBB beat. (D) Nodal escape beat. (E) Nodal premature beat. (F) Fusion of ventricular and normal beat. (G) Atrial escape beat. (H) Ventricular escape beat. (I) Atrial premature beat. (J) Aberrated atrial premature beat. (K) Premature ventricular contraction. (L) Premature or ectopic supraventricular beat.
Conclusion and Future Perspective
In this work, we propose a beat-level interpretation method based on object detection. We use a convolutional neural network as a feature extractor for two-dimensional heartbeat images, without complex manual design to extract features. Most importantly, this work abandons the previous mode of separate QRS complex detection and heartbeats classification, the ground truth of QRS complex is marked by automatic annotation algorithm, which is also regarded as the object, the model can learn like category information. The classification and regression branches of the object detector unify the localization and classification tasks, achieving an end-to-end optimization as well as decoupling the high dependence on the R-peak detection. We evaluate the performance on the MIT-BIH database, our method is superior to most advanced research even if the number of categories is as many as 12. The average accuracy is 99.60%, the average sensitivity is 97.56%, and the average specificity is 99.78%. In addition, since the independent and time-consuming QRS complex detection process is abandoned during the inference stage, our method is expected to be adopted in real-time monitoring systems to bring convenience to patients with cardiac abnormalities in the future. Of course, the MIT-BIH database contains too few patients to support the classification of inter-patient paradigm (53); the method in this work can be extended to the inter-patient paradigm when the beat-level annotations of more patients are obtained in the future.
Data Availability Statement
Publicly available datasets were analyzed in this study. This data can be found here: physionet.org/content/mitdb/1.0.0/.
Author Contributions
MK and X-FW contributed to conception and design of the study. MK wrote the codes and ran experiments on the relevant dataset and wrote the first draft of the manuscript. X-FW performed the statistical analysis. JX help to optimize the detection network. HT and T-LR supervised the whole work. X-FW, JX, HT, and T-LR refined the manuscript. All authors contributed to manuscript revision, read, and approved the submitted version.
Funding
This work was supported by the National Natural Science Foundation of China (Grant 62022047, Grant 61874065, Grant U20A20168, and Grant 51861145202), Beijing Natural Science Foundation under Grant M22020, the National Key R&D Program under Grant 2016YFA0200400, in part by Fok Ying-Tong Education Foundation under Grant 171051, in part by Beijing National Research Center for Information Science and Technology Youth Innovation Fund (BNR2021RC01007), in part by State Key Laboratory of New Ceramic and Fine Processing Tsinghua University (No. KF202109), in part by the Research Fund from Beijing Innovation Center for Future Chip and the Independent Research Program of Tsinghua University under Grant 20193080047, and Tsinghua-Foshan Innovation Special Fund (2021THFS0217).
Conflict of Interest
JX was employed by Ping An Technology (Shenzhen) Co. Ltd.
The remaining authors declare that the research was conducted in the absence of any commercial or financial relationships that could be construed as a potential conflict of interest.
Publisher's Note
All claims expressed in this article are solely those of the authors and do not necessarily represent those of their affiliated organizations, or those of the publisher, the editors and the reviewers. Any product that may be evaluated in this article, or claim that may be made by its manufacturer, is not guaranteed or endorsed by the publisher.
References
1. Pan J, Tompkins WJ. A real-time QRS detection algorithm. IEEE Trans Biomed Eng. (2007) 32:230–6. doi: 10.1109/TBME.1985.325532
2. Yeh YC, Wang WJ. QRS complexes detection for ECG signal: the difference operation method. Comp Methods Progr Biomed. (2008) 91:245–54. doi: 10.1016/j.cmpb.2008.04.006
3. Li CW, Zheng CX, Tai CF. Detection of ECG characteristic points using wavelet transforms. IEEE Trans Biomed Eng. (1995) 42:21–28. doi: 10.1109/10.362922
4. Martínez JP, Almeida R, Olmos S, Rocha AP, Laguna P. A wavelet-based ECG delineator: evaluation on standard databases. IEEE Trans Biomed Eng. (2004) 51:570. doi: 10.1109/TBME.2003.821031
5. Manikandan MS, Soman KP. A novel method for detecting R-peaks in electrocardiogram (ECG) signal. Biomed Signal Process Control. (2012) 7:118–28. doi: 10.1016/j.bspc.2011.03.004
6. Sukanta S, Santanu S, Bhupen K, Suresh B. Multiresolution wavelet transform based feature extraction and ECG classification to detect cardiac abnormalities. IEEE Meas. (2017) 108:55–66. doi: 10.1016/j.measurement.2017.05.022
7. Patro KK, Kumar PR. Effective feature extraction of ECG for biometric application. IEEE Procedia Comput Sci. (2017) 115:296–306. doi: 10.1016/j.procs.2017.09.138
8. Elhaj FA, Salim N, Harris AR, Swee TT, Ahmed T. Arrhythmia recognition and classification using combined linear and nonlinear features of ECG signals. IEEE Comput Methods Progr Biomed. (2016) 127:52–63. doi: 10.1016/j.cmpb.2015.12.024
9. Liu CY, Zhang XY, Zhao LN, Liu FF, Chen XW, Yao YJ, et al. Signal quality assessment and lightweight QRS detection for wearable ECG SmartVest system. IEEE Internet of Things J. (2019) 6:1363–74. doi: 10.1109/JIOT.2018.2844090
10. Karpagachelvi S, Arthanari M, Sivakumar M. Classification of electrocardiogram signals with support vector machines and extreme learning machine. Neural Comput Appl. (2012) 21:1331–9. doi: 10.1007/s00521-011-0572-z
11. Manu T, Manab KD, Samit A. Automatic ECG arrhythmia classification using dual tree complex wavelet based features. IEEE Int J Electron Commun. (2015) 69:715–21. doi: 10.1016/j.aeue.2014.12.013
12. Raj S, Ray KC. ECG signal analysis using DCT-based DOST and PSO optimized SVM. IEEE Trans Inst Meas. (2017) 66:470–8. doi: 10.1109/TIM.2016.2642758
13. Li HQ, Liang H, Miao CJ, Cao L, Feng XL, Tang CX, et al. Novel ECG signal classification based on KICA nonlinear feature extraction. IEEE Circuits Syst Signal Process. (2016) 35:1187–97. doi: 10.1007/s00034-015-0108-3
14. Hu JI. Research on Key Technologies for Automatic Analysis of ECG Signals. Changsha: National University of Defense Technology (2006).
15. Song MH, Lee J, Cho SP, Lee KJ, Yoo SK. Support vector machine based arrhythmia classification using reduced features. In: International Journal of Control Automation and Systems. (2005) p. 571-9. doi: 10.1007/s00170-004-2187-3
16. Melgani F, Bazi Y. Classification of electrocardiogram signals with support vector machines and particle swarm optimization. In: IEEE Transactions on Information Technology in Biomedicine, Vol. 12. IEEE (2008) p. 667–77. doi: 10.1109/TITB.2008.923147
17. Martis RJ, Acharya UR, Mandana KM, Ray AK, Chakraborty C. Cardiac decision making using higher order spectra. Biomed Signal Process Control. (2013) 8:193–203. doi: 10.1016/j.bspc.2012.08.004
18. Ganeshkumar R, Dr. Kumaraswamy YS. Investigating cardiac arrhythmia in ECG using random forest classification. Int J Comp Appl. (2012) 37:31–4. doi: 10.5120/4599-6557
19. Park J, Lee K, Kang K. Arrhythmia detection from heartbeat using k-nearest neighbor classifier. In: IEEE International Conference on Bioinformatics and Biomedicine. Shanghai: IEEE Computer Society (2013).
20. Jun TJ, Park HJ, Yoo H, Kim YH, Kim D. GPU based cloud system for high-performance arrhythmia detection with parallel k-NN algorithm[C]. In: Engineering in Medicine and Biology Society. Miami, FL: IEEE (2016).
21. Kiranyaz S, Ince T, Gabbouj M. Real-time patient-specific ECG classification by 1-D convolutional neural networks. IEEE Trans Biomed Eng. (2016) 63:664–75. doi: 10.1109/TBME.2015.2468589
22. Cheikhrouhou O, Mahmud R, Zouari R, Ibrahim M, Zaguia A, Gia TN. One-dimensional CNN approach for ECG arrhythmia analysis in fog-cloud environments. IEEE Access. (2021) 9:103513–23. doi: 10.1109/ACCESS.2021.3097751
23. Maweu B, Dakshit S, Shamsuddin R, Prabhakaran B. CEFEs: a CNN explainable framework for ECG signals. Artif Intell Med. (2021) 115:102059. doi: 10.1016/j.artmed.2021.102059
24. Li XL, Panicker RC, Cardiff B, John D. Multistage pruning of CNN based ECG classifiers for edge devices. arXiv [Preprint]. (2021) arXiv: 2109.00516. doi: 10.48550/arXiv.2109.00516
25. Acharya UR, Oh SL, Hagiwara Y, Tan HJ, Adam M, Gertych A, et al. A deep convolutional neural network model to classify heartbeats. Comput Biol Med. (2017) 89:389–96. doi: 10.1016/j.compbiomed.2017.08.022
26. Chauhan S, Vig L. Anomaly detection in ECG time signals via deep long short-term memory networks. In: IEEE International Conference on Data Science & Advanced Analytics. Paris: IEEE (2015).
27. Eltrass AS, Tayel MB, Ammar AI. A new automated CNN deep learning approach for identification of ECG congestive heart failure and arrhythmia using constant-Q non-stationary Gabor transform. Biomed Signal Process Control. (2021) 65:102326. doi: 10.1016/j.bspc.2020.102326
28. Warrick P, Homsi MN. Cardiac arrhythmia detection from ECG combining convolutional and long short-term memory networks. In: 2017 Computing in Cardiology (CinC). Rennes: IEEE (2017) p. 1–4. doi: 10.22489/CinC.2017.161-460
29. Shu LO, Eddie YK, Tan RS, Acharya UR. Automated diagnosis of arrhythmia using combination of CNN and LSTM techniques with variable length heart beats. Comput. Biol. Med. (2018) 102:278–87. doi: 10.1016/j.compbiomed.2018.06.002
30. Wong D, Li YF, John D, Ho WK, Heng CH. Resource and energy efficient implementation of ECG classifier using binarized CNN for edge AI devices. In: 2021 IEEE International Symposium on Circuits and Systems (ISCAS). Daegu: IEEE (2021).
31. Yao GL, Mao XB, Li N, Xu HX, Xu XY, Jiao Y, et al. Interpretation of electrocardiogram heartbeat by CNN and GRU. Comput Math Methods Med. (2021) 2021:6534942. doi: 10.1155/2021/6534942
32. Sarin E, Taneja S, Vividha, Nagrath P. Analyzing and Comparing MLP, CNN, and LSTM for Classification of Heart Arrhythmia Using ECG Scans. In: Robotic Technologies in Biomedical and Healthcare Engineering. CRC Press (2021) p. 87–115. doi: 10.1201/9781003112273-5
33. Saxena SC, Kumar V, Hamde ST. QRS detection using new wavelets. J Med Eng Technol. (2002) 26:7. doi: 10.1080/03091900110096038
34. Mallat S, Hwang WL. Singularity detection and processing with wavelets. IEEE Trans Inf Theory. (1992) 38:P.617–43. doi: 10.1109/18.119727
35. Cai Z, Vasconcelos N. Cascade r-cnn: delving into high quality object detection[C]. In: Proceedings of the IEEE Conference on Computer Vision and Pattern Recognition. Salt Lake City, UT: IEEE (2018) p. 6154–62.
36. Zhou S, Tan B. Electrocardiogram soft computing using hybrid deep learning CNN-ELM. Appl Soft Comput. (2019) 86:105778. doi: 10.1016/j.asoc.2019.105778
37. Hou B, Yang JY, Wang P, Yan RQ. LSTM-based auto-encoder model for ECG arrhythmias classification. IEEE Trans Instrum Meas. (2019) 69:1232–40. doi: 10.1109/TIM.2019.2910342
38. Wan XK, Jin ZY, Wu HB, Liu JJ, Zhu BR, Xie HG. Heartbeat classification algorithm based on one-dimensional convolution neural network. J Mech Med Biol. (2020) 20:2050046. doi: 10.1142/S0219519420500463
39. Ullah A, Anwar S, Bilal M, Mehmood RM. Classification of arrhythmia by using deep learning with 2-D ECG spectral image representation. Remote Sens. (2020) 12:1685. doi: 10.3390/rs12101685
40. Wang JB. A deep learning approach for atrial fibrillation signals classification based on convolutional and modified Elman neural network. Future Gen Comp Syst. (2020) 102:670–9. doi: 10.1016/j.future.2019.09.012
41. Chen C, Hua ZC, Zhang RQ, Liu GY, Wen WH. Automated arrhythmia classification based on a combination network of CNN and LSTM. Biomed Signal Process Control. (2020) 57:101819. doi: 10.1016/j.bspc.2019.101819
42. Niu JH, Tang YQ, Sun ZY, Zhang WS. Inter-patient ECG classification with symbolic representations and multi-perspective convolutional neural networks. IEEE J Biomed Health Informat. (2019) 24:1321–32. doi: 10.1109/JBHI.2019.2942938
43. Houssein EH, Ibrahim E, Neggaz N, Hassaballah M, Wazery Y. An efficient ECG arrhythmia classification method based on Manta ray foraging optimization. Expert Syst Appl. (2021) 181:115131. doi: 10.1016/j.eswa.2021.115131
44. Naz M, Shah JH, Khan MA, Sharif M, Raza M, Damasevicius R. From ECG signals to images: a transformation based approach for deep learning. PeerJ Comp Sci. (2021) 7:e386. doi: 10.7717/peerj-cs.386
45. Ren SQ, He KM, Girshick R, Sun J. Faster R-CNN: towards real-time object detection with region proposal networks. IEEE Trans Pattern Anal Mach Intell. (2017) 39:1137–49. doi: 10.1109/TPAMI.2016.2577031
46. American National Standard for Testing and Reporting Performance Results of Cardiac Rhythm and ST Segment Measurement Algorithms. (1998) AAMI/ANSI Standard EC57:1998.
47. Lin TY, Dollár P, Girshick R, He KM, Hariharan B, Belongie S. Feature pyramid networks for object detection. In: Proceedings of the IEEE Conference on Computer Vision and Pattern Recognition. IEEE (2017) p. 2117–25. doi: 10.1109/CVPR.2017.106
48. He KM, Zhang XY, Ren SQ, Sun J. Deep residual learning for image recognition. Comp Vis Pattern Recogn. (2016) 2:6. doi: 10.1109/CVPR.2016.90
49. He K, Gkioxari G, Dollár P, Girshick R. Mask R-CNN. In: Proceedings of the IEEE international conference on computer vision. Venice, Italy, (2017) 2961–2969. doi: 10.1109/ICCV.2017.322
50. Chen K, Wang JQ, Pang JM, Cao YH, Xiong Y, Li XX, et al. Mmdetection: Open mmlab detection toolbox and benchmark. arXiv [Preprint]. (2019) arXiv: 1906.07155. doi: 10.48550/arXiv.1906.07155
51. Ji YS, Zhang S, Xiao WD. Electrocardiogram classification based on faster regions with convolutional neural network. Sensors. (2019) 19:2558. doi: 10.3390/s19112558
52. Hwang WH, Jeong CH, Hwang DH, Jo YC. Automatic detection of arrhythmias using a YOLO-based network with long-duration ECG signals. Eng Proc. (2020) 2:84. doi: 10.3390/ecsa-7-08229
Keywords: object detection, ECG, beat-level classification, deep learning, automatic annotation
Citation: Kang M, Wang X-F, Xiao J, Tian H and Ren T-L (2022) Beat-Level Interpretation of Intra-Patient Paradigm Based on Object Detection. Front. Cardiovasc. Med. 9:857019. doi: 10.3389/fcvm.2022.857019
Received: 18 January 2022; Accepted: 04 February 2022;
Published: 18 March 2022.
Edited by:
Chunsheng Jiang, China Academy of Engineering Physics, ChinaCopyright © 2022 Kang, Wang, Xiao, Tian and Ren. This is an open-access article distributed under the terms of the Creative Commons Attribution License (CC BY). The use, distribution or reproduction in other forums is permitted, provided the original author(s) and the copyright owner(s) are credited and that the original publication in this journal is cited, in accordance with accepted academic practice. No use, distribution or reproduction is permitted which does not comply with these terms.
*Correspondence: Tian-Ling Ren, dGlhbmhlODhAdHNpbmdodWEuZWR1LmNu; He Tian, cmVudGxAdHNpbmdodWEuZWR1LmNu