 Linguo Gu
 Zhenkun Xia
- Department of Thoracic Surgery, The Second Xiangya Hospital of Central South University, Changsha, China
Objective: To further supplement the previous research on the relationship between neutrophil–lymphocyte ratio (NLR) and all-cause and cardiovascular mortality, and construct clinical models to predict mortality.
Methods: A total number of 2,827 observers were included from the National Health and Nutrition Examination Survey (NHANES) database in our research. NLR was calculated from complete blood count. According to the quartile of baseline NLR, those observers were divided into four groups. A multivariate weighted Cox regression model was used to analyze the association of NLR with mortality. We constructed simple clinical prognosis models by nomograms. Kaplan–Meier survival curves were used to depict cause-specific mortality. Restricted cubic spline regression was used to make explicit relationships between NLR and mortality.
Results: This study recruited 2,827 subjects aged ≥ 18 years from 2005 to 2014. The average age of these observers was 51.55 ± 17.62, and 57.69% were male. NLR is still an independent predictor, adjusted for age, gender, race, drinking, smoking, dyslipidemia, and other laboratory covariates. The area under the receiver operating characteristic curves (AUCs) of NLR for predicting all-cause mortality and cardiovascular mortality were 0.632(95% CI [0599, 0.664]) and 0.653(95% CI [0.581, 0.725]), respectively, which were superior to C-reactive protein (AUCs: 0.609 and 0.533) and WBC (AUCs: 0.522 and 0.513). The calibration and discrimination of the nomograms were validated by calibration plots and concordance index (C-index), and the C-indexes (95% CIs) of nomograms for all-cause and cardiovascular mortality were 0.839[0.819,0.859] and 0.877[0.844,0.910], respectively. The restricted cubic spline showed a non-linear relationship between NLR and mortality. NLR > 2.053 might be a risk factor for mortality.
Conclusion: There is a non-linear relationship between NLR and mortality. NLR is an independent factor related to mortality, and NLR > 2.053 will be a risk factor for prognosis. NLR and nomogram should be promoted to medical use for practicality and convenience.
Introduction
Cardiovascular diseases or events (CVDs), such as acute myocardial infarction and coronary atherosclerotic heart disease, were once thought to be closely related to vascular endothelial damage, platelet aggregation, atherosclerotic plaque formation, and unstable plaque rupture (1, 2). Unstable shedding of plaque will block blood vessels and cause ischemic changes in organs. However, some new research believes that inflammation and oxidative stress also play a vital role in CVDs (3, 4). Inflammation is important pathogenesis of plaque formation, erosion of blood vessel walls, and plaque rupture (5, 6). Among all inflammatory cells, neutrophils and lymphocytes are the more active cells, participating in multiple processes of inflammatory response. Macrophages transform into foam cells by phagocytosing oxidized low-density lipoprotein (LDL) cholesterol and release inflammatory factors to recruit neutrophils to aggregate. Neutrophils participate in the inflammatory response in a variety of ways, such as releasing neutrophil elastase and proteinase-3, which corrode vessel walls and aggravate inflammatory response (7).
Neutrophil–lymphocyte ratio (NLR) is defined as the ratio of neutrophil count to lymphocyte count in peripheral blood. It is convenient to obtain the neutrophil count and lymphocyte count from complete blood count (CBC) data, and after a simple division calculation, the value of NLR can be obtained. More importantly, NLR has been confirmed to be closely related to CVDs, infectious and inflammatory diseases, tumors, and other diseases (8–11). In so many studies, we have noticed that the study of NLR both with cardiovascular and all-cause mortality is more valuable in clinical practice. Previous studies (12–14) also verified that NLR can reflect the degree of inflammation. However, how to put these studies into clinical medicine practice needs to be further explored.
The first aim of this research is to make it clearer whether there is a specific relationship between NLR and mortality. Second, we did this research in order to construct a practical prognosis prediction model and inform future research on this topic.
Materials and Methods
Study Population and Design
The National Health and Nutrition Examination Survey (NHANES1) database is public and free of charge. Beginning in the early 1960s, NHANES focused on a series of different population groups or health topics surveys. A complex, multistage, and nationwide probability sampling survey design was used each year when NHANES conducted the survey. NHANES does a cross-sectional study at each time point. Combined with interviews and physical examinations, NHANES provided great convenience for our study. NHANES approved research-related agreements and protocol, what is more, written informed consent was obtained from all participants. In our study, 50,965 respondents of all ages participated in the NHANES from 2005 to 2014. Focused on adult observers, we banned 20,670 participants from our study. Subsequently, 57 observers were excluded due to missing or incomplete follow-up data. After that, 2,659 records were deleted because CBC data showed no results. To reduce analytical errors, 24,752 participants were excluded because of incomplete variables data. Ultimately, 2,827 subjects with complete data were included (Figure 1).
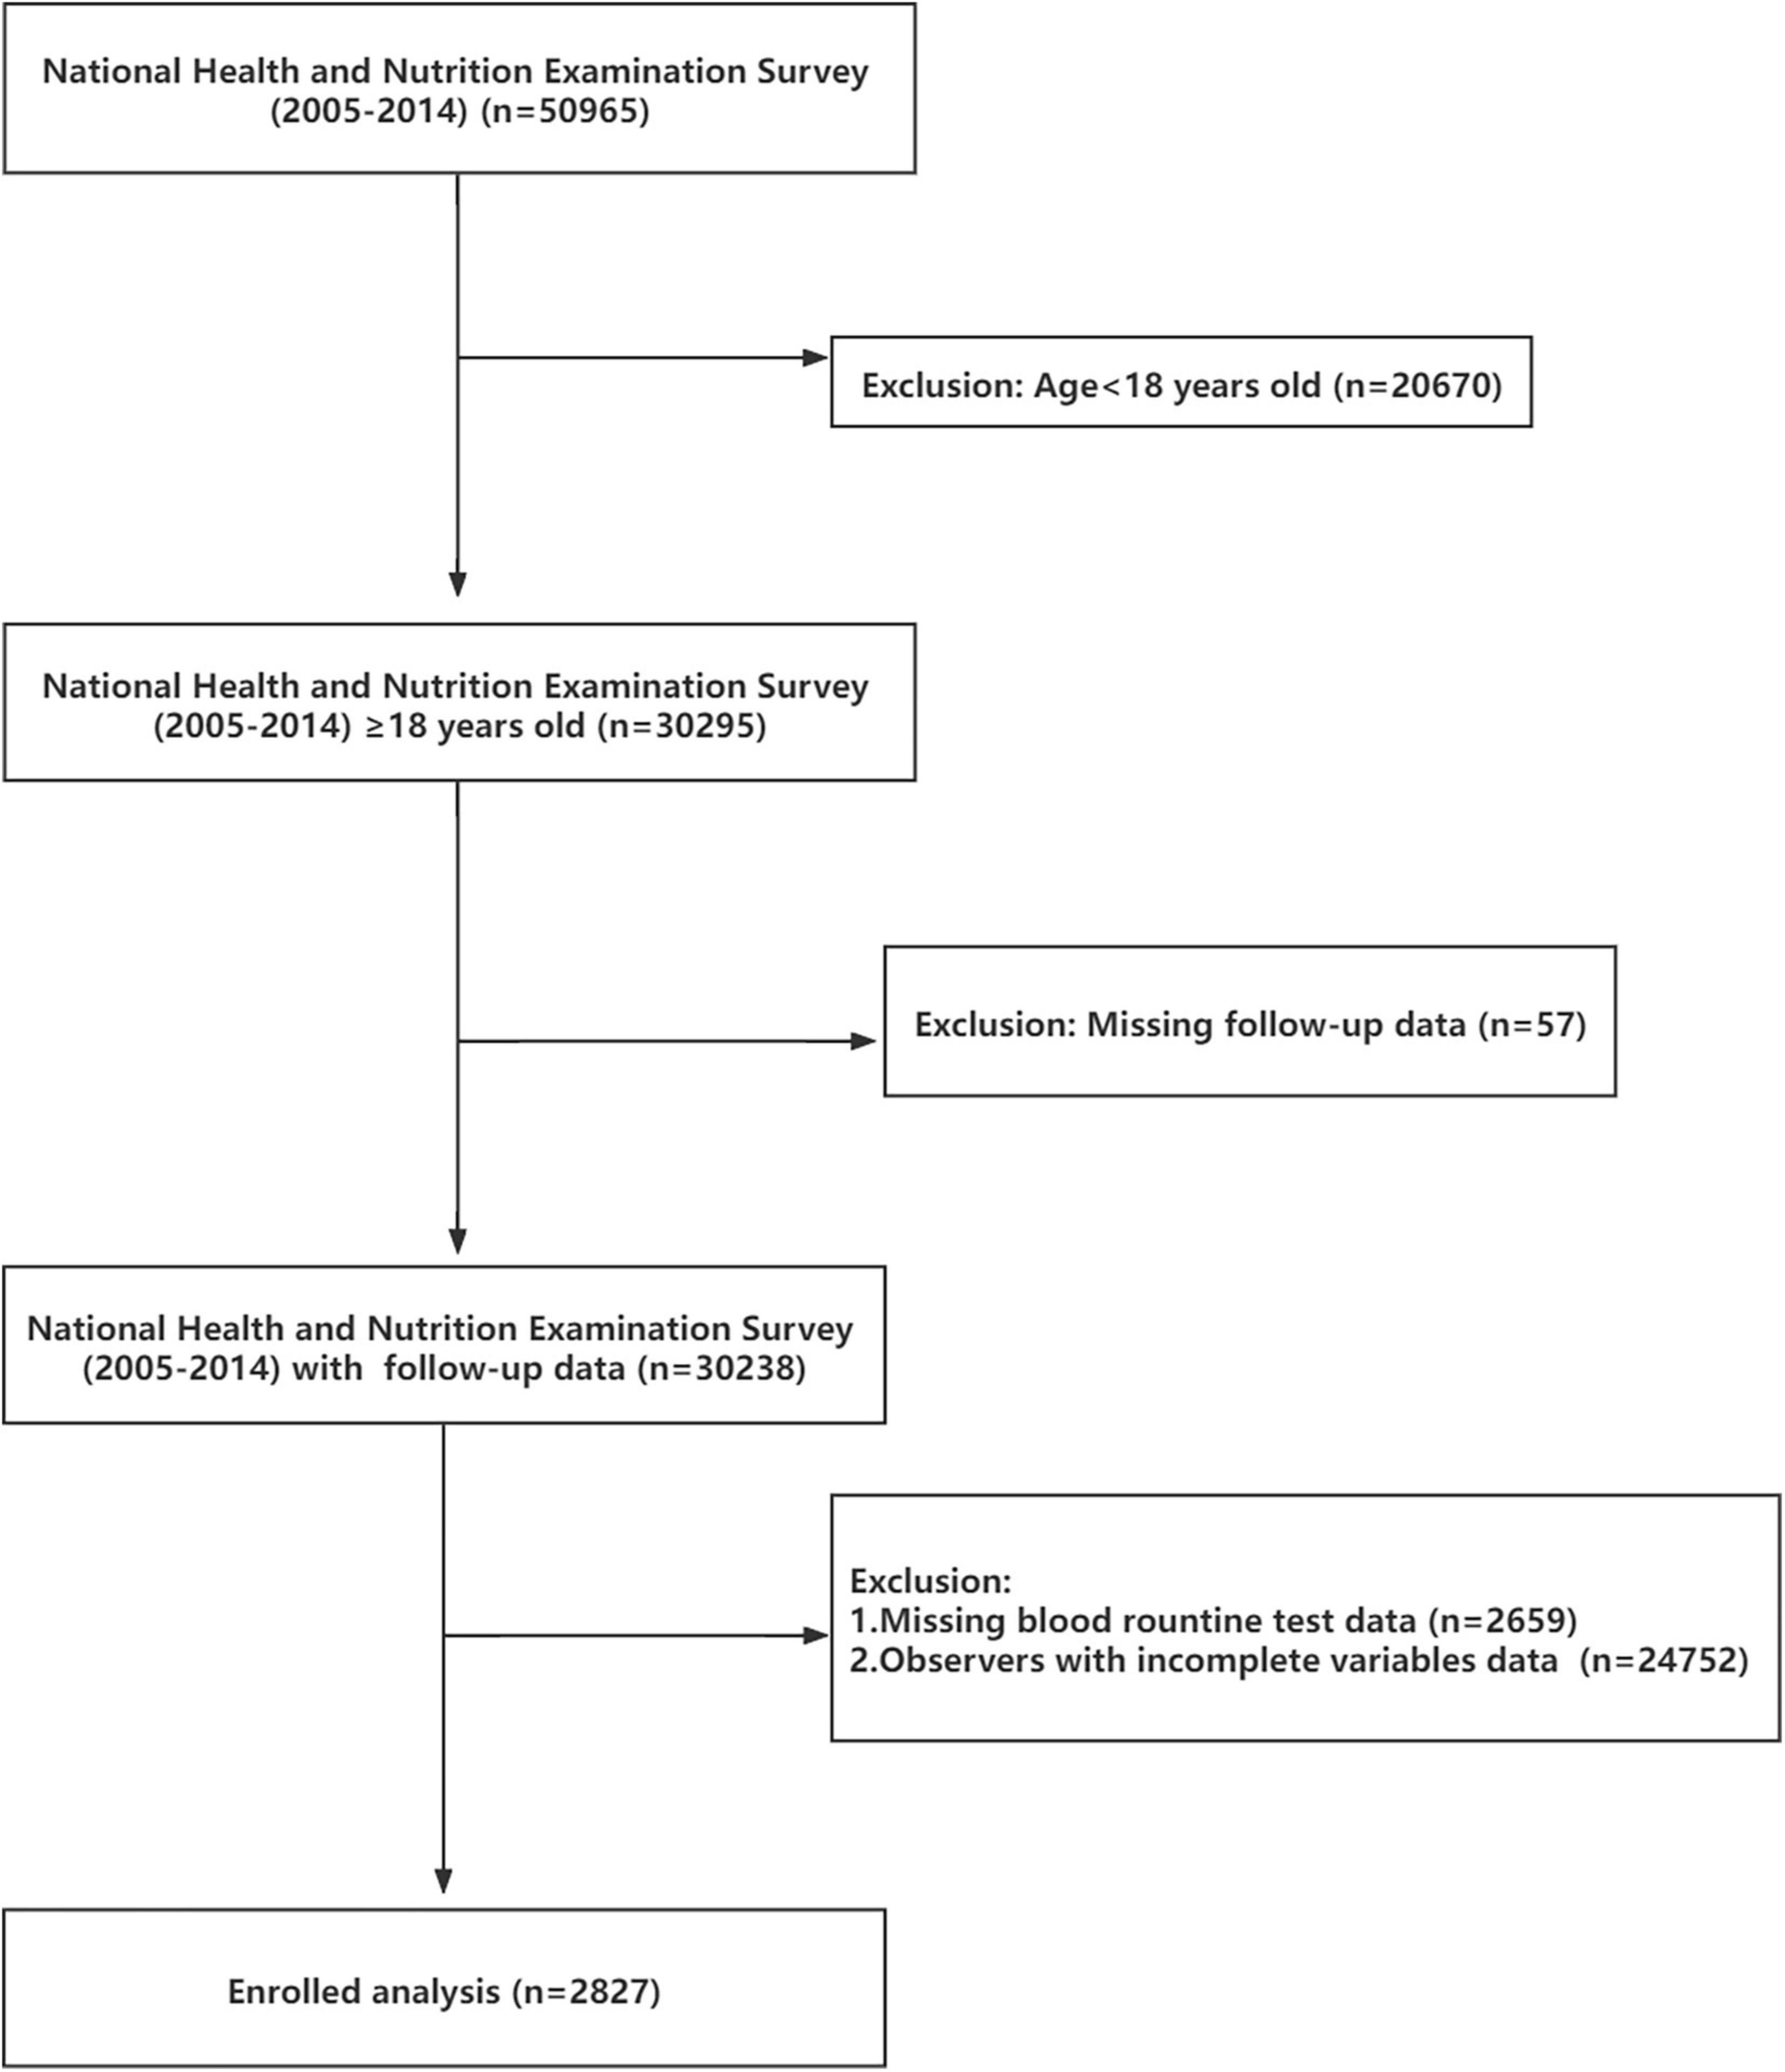
Figure 1. The research flowchart.
Assessment of Outcomes
We observe all-cause mortality and cardiovascular mortality as the end points. The mortality status of participants was authenticated by matching with the National Death Index.2 Referring to the International Classification of Disease, 10th Edition (ICD-10), Clinical Modification System codes, cardiovascular mortality was identified as I00–I09, I11, I13, I20–I51, or I60–I69 that was recorded in National Death Index (15). The above definition of cardiovascular mortality includes CVD and cerebrovascular disease both. We can also call cardiovascular mortality CVD mortality for short. All-cause mortality is defined as death from any cause.
Covariate Data Obtained
We obtain our covariate data in the topic column of Questionnaire, Datasets, and Related Documentation from the NHANES database. We collected demographic data, laboratory data, examination data, and questionnaire data annually from 2005 to 2014. Baseline demographic data included age [we categorized into < 45, 45–60, > 60 years old, referred to literature (16)], gender (male or female), and race (Mexican American, Non-Hispanic White, Non-Hispanic Black, and other race). Body mass index [BMI; we categorized into < 25, 25–30, ≥ 30, referred to literature (17)] was obtained from examination data. Data on drinking (Yes or No), smoking (Yes or No), medical history of cancer (Yes or No), and recent physical condition (good, general, or poor, the situation at the time of the survey) were collected from a personal questionnaire. Hypertension was defined as meeting one of the following conditions: (a) the observers had ever been told by a doctor or other health professional that they had hypertension from questionnaire data; (b) the observers had been taking prescribed medicine for hypertension; and (c) three consecutive measurements of systolic blood pressure (SBP) > 140 mmHg or/and diastolic blood pressure (DBP) > 90 mmHg on different days. Diabetes was defined as meeting one of the following conditions (18): (a) a doctor or other health professional had informed the participants had diabetes or they had been taking pills for diabetes; (b) plasma fasting blood glucose (FBG) ≥ 7.0 mmol/L; and (c) glycated hemoglobin (GHB) (HbA1C) ≥ 6.5%. Participants will be considered for dyslipidemia if they meet one of the following criteria (19, 20): (a) doctors diagnosed them with dyslipidemia and/or they have been taking prescription medication; (b) serum triglycerides (TG) > 1.7mmol/L; (c) serum total cholesterol (TC) > 5.2mmol/L; and (d) serum LDL cholesterol > 3.4mmol/L and/or serum high-density lipoprotein (HDL) cholesterol < 1.0mmol/L. Other laboratory data, such as CBC data, standard biochemistry, serum lipids, and FBG, were performed under a unified standard. All blood specimen collection was conducted after overnight fasting.
Statistical Analysis
SAS software (version 9.4)3 and R project (version 4.1.1)4 were used to perform data analysis; besides, the R project was also used for figure drawing. Observers were divided into four groups based on the quartile of baseline NLR levels [Q1: NLR < 1.54 (reference group), Q2: 1.55 ≤ NLR ≤ 2.04, Q3: 2.05 ≤ NLR ≤ 2.74, and Q4: NLR ≥ 2.75]. Continuous variables were checked for normal distribution before analysis, and these variables do not follow a normal distribution (Supplementary Table 1). Therefore, we used Kruskal–Wallis test, and data were presented as median (quantile 1st, quantile 3rd). For categorical variables, data were presented as numbers with proportions, and we used chi-squared tests for categorical variables. Cox regression analyses were used to investigate the hazard ratios (HRs) and 95% confidence intervals (CIs). NHANES database provided the weights of different samples; moreover, the database adopted a very complex survey design. Taking into account the above factors, we hereby used weighted Cox proportional hazards regression instead of traditional Cox regression to get a more reliable result with a less statistical error. The proportional hazards assumption of the Cox models was performed by R project, and our Cox model satisfied the assumption (Supplementary Figures 7A,B). Statistical indicators were presented as HR and 95% CIs. We also constructed three types of Cox regression models to explore the relationship between NLR and mortality. Kaplan–Meier survival analysis was used to explore the prognostic differences in different NLR groups. The log-rank test showed a statistical significance in subgroup differences. Nomograms were constructed to give a simple scoring system for the initial assessment of survival probability. Here we used stepwise regression and R project for graphing. We also used calibration plots and Harrell’s C-index to evaluate the nomograms, and four points were made in our calibration plots. Receiver operating characteristic (ROC) curves were used to compare the sensitivity and specificity of NLR, C-reactive protein (CRP), and white blood cell (WBC) count as clinical diagnostic indicators for predicting mortality. Last but not least, restricted cubic spline models were established to discover whether a linear relationship or not between NLR and HR. Once non-linear relationships were confirmed, we would make further explorations by using a three-piecewise linear regression model to illustrate the relationship between NLR and HR, and estimate the threshold point. In all those analyses, p for trend < 0.05 was considered statistically significant. To verify if the sample size for each group was reasonable, we visited the website5 and used sample size and power calculator. Accepting an alpha risk of 0.05 and a beta risk of 0.2 in a two-sided test, 664 subjects were required in the Q4 group and 1,918 in the Q1–Q3 groups to find a statistically significant difference between mortality rates. And our sample size was appropriate.
Results
Population Characteristics
A total of 2,827 adult observers were included in our study from the NHANES database (2005–2014). Among all these observers, the average age was 51.55 ± 17.62, and 57.69% were male. Basic characteristics were presented by quartile of baseline NLR level (Table 1).
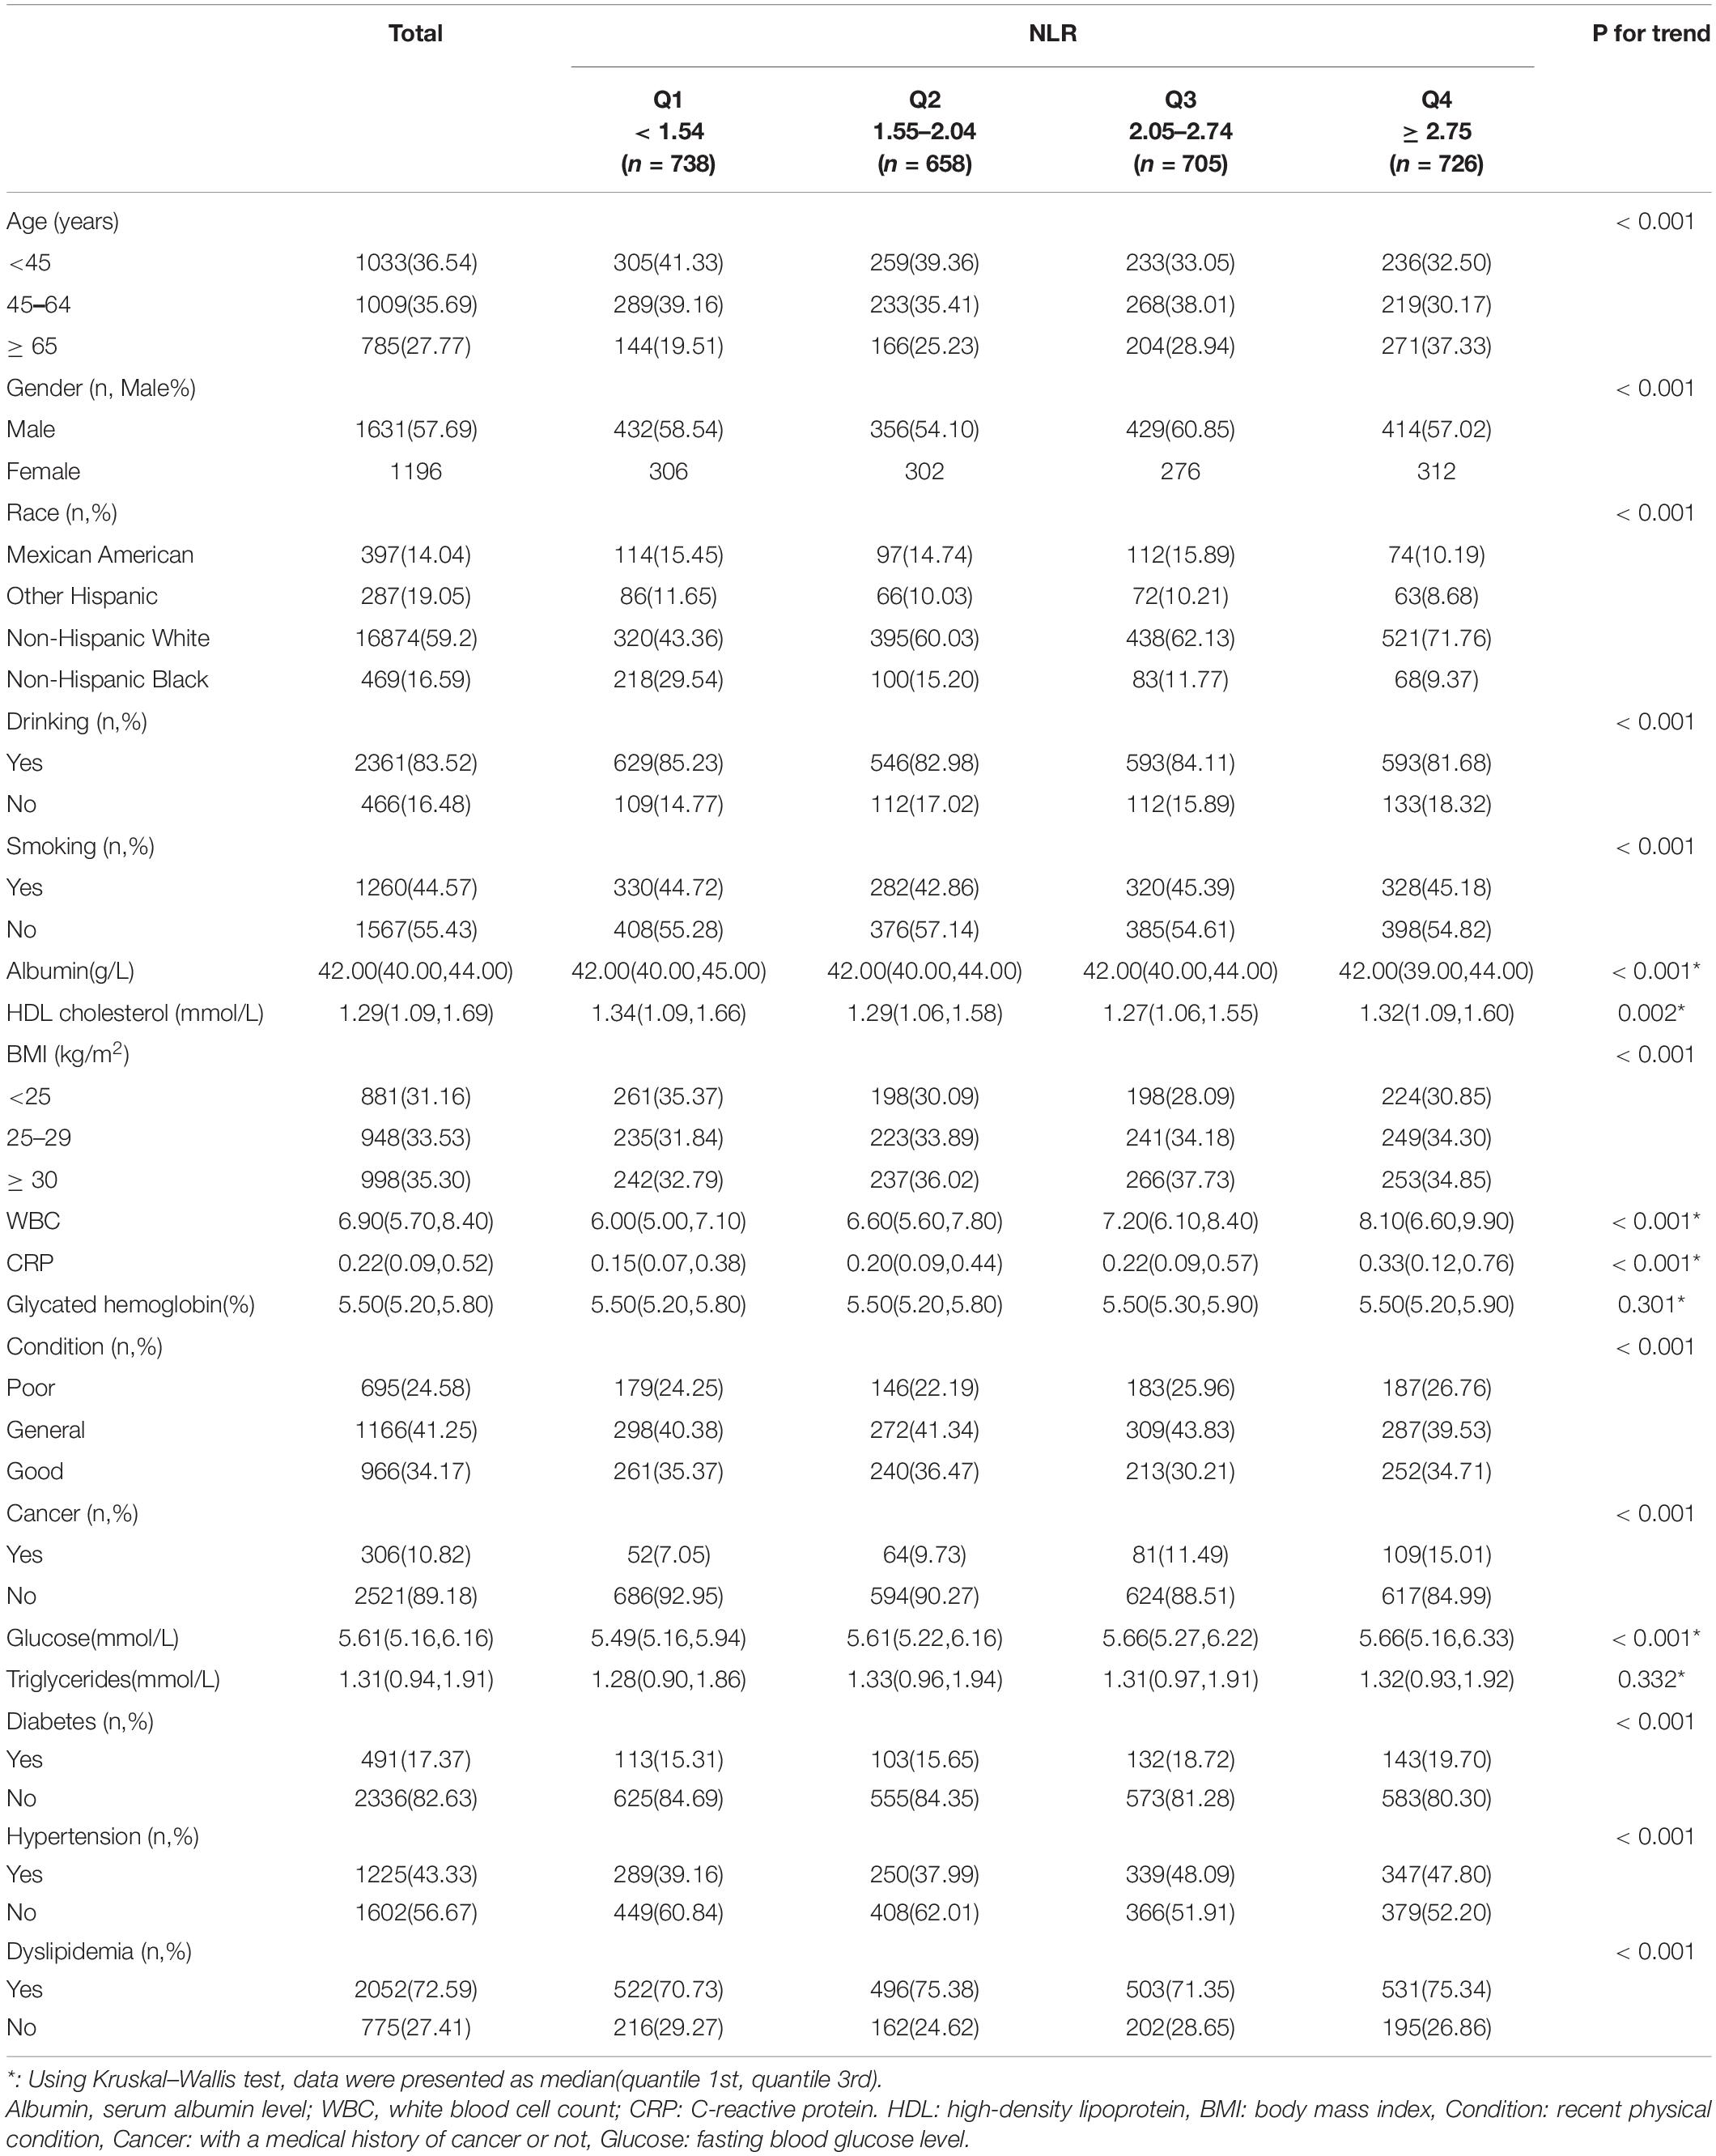
Table 1. Demographic and clinic characteristics according to NLR levels.
Obtaining higher NLR scores, subjects were most likely to be the aged (> 65 years old), male, drinkers, obese (BMI > 30 kg/m2), or individuals with dyslipidemia, higher WBC count, and higher CRP level (within the normal range). And they were less likely to be Non-Hispanic Black, poor recent physical condition persons, patients with cancer, and diabetics.
The Relationship Between Neutrophil–Lymphocyte Ratio and Mortality
Three models were constructed to estimate NLR independent function and the association with mortality. Multivariate weighted Cox regression was used to evaluate the relationship between NLR and mortality after adjusting for potential confounders. HRs and 95% CIs are demonstrated in Table 2. Variables adjusted in Model 2 were consistent across all-cause and cardiovascular mortality subgroups, so were in Model 3.
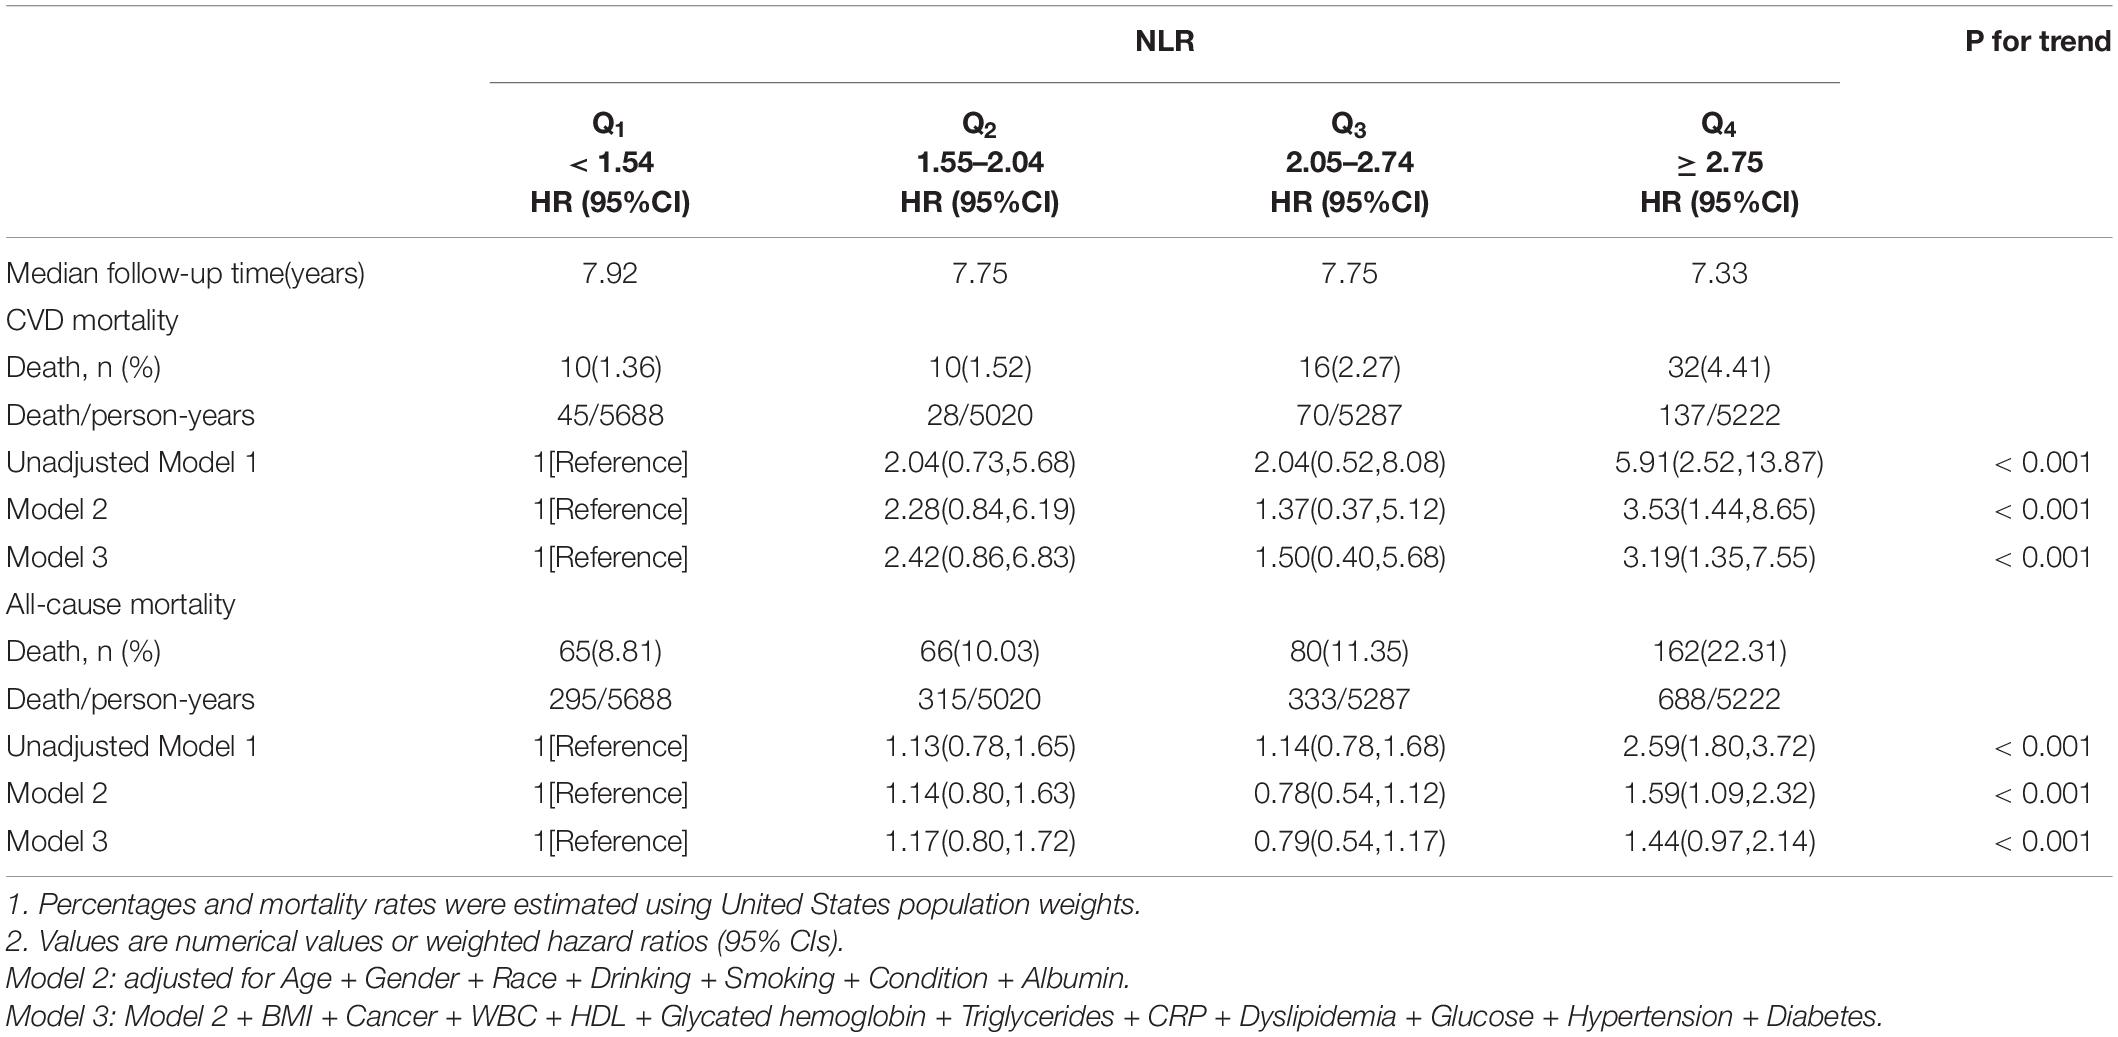
Table 2. Multivariate Cox regression analysis of NLR with CVD and cause-specific mortality.
All-Cause Mortality
In Mode 1, variables were unadjusted. The higher the NLR level was, the more evidently risk of all-cause mortality increased (Q4 vs. Q1: HR 2.59, 95% CI [1.80, 3.72]). Per one increment of NLR was equal to increasing HR of Q2, Q3, and Q4 group by 13%, 14%, and 159%, respectively, compared with Q1 group. In Model 2, we made an adjustment for age, gender, race, drinking, smoking, recent physical condition, and albumin level. The variables of MBI, HDL, WBC, cancer, hypertension, diabetes, GHB level, triglycerides, CRP, dyslipidemia, and FBG level were also adjusted in Model 3, in addition to the variables in Model 2. It was still statistically significant between NLR levels and all-cause mortality after multivariable adjustment.
Kaplan–Meier curve (Figure 2A) confirms the above conclusion. Compared with lower NLR levels, observers with higher NLR scores get a steeper decline in survival over a 10-year follow-up (log-rank p for trend < 0.0001).
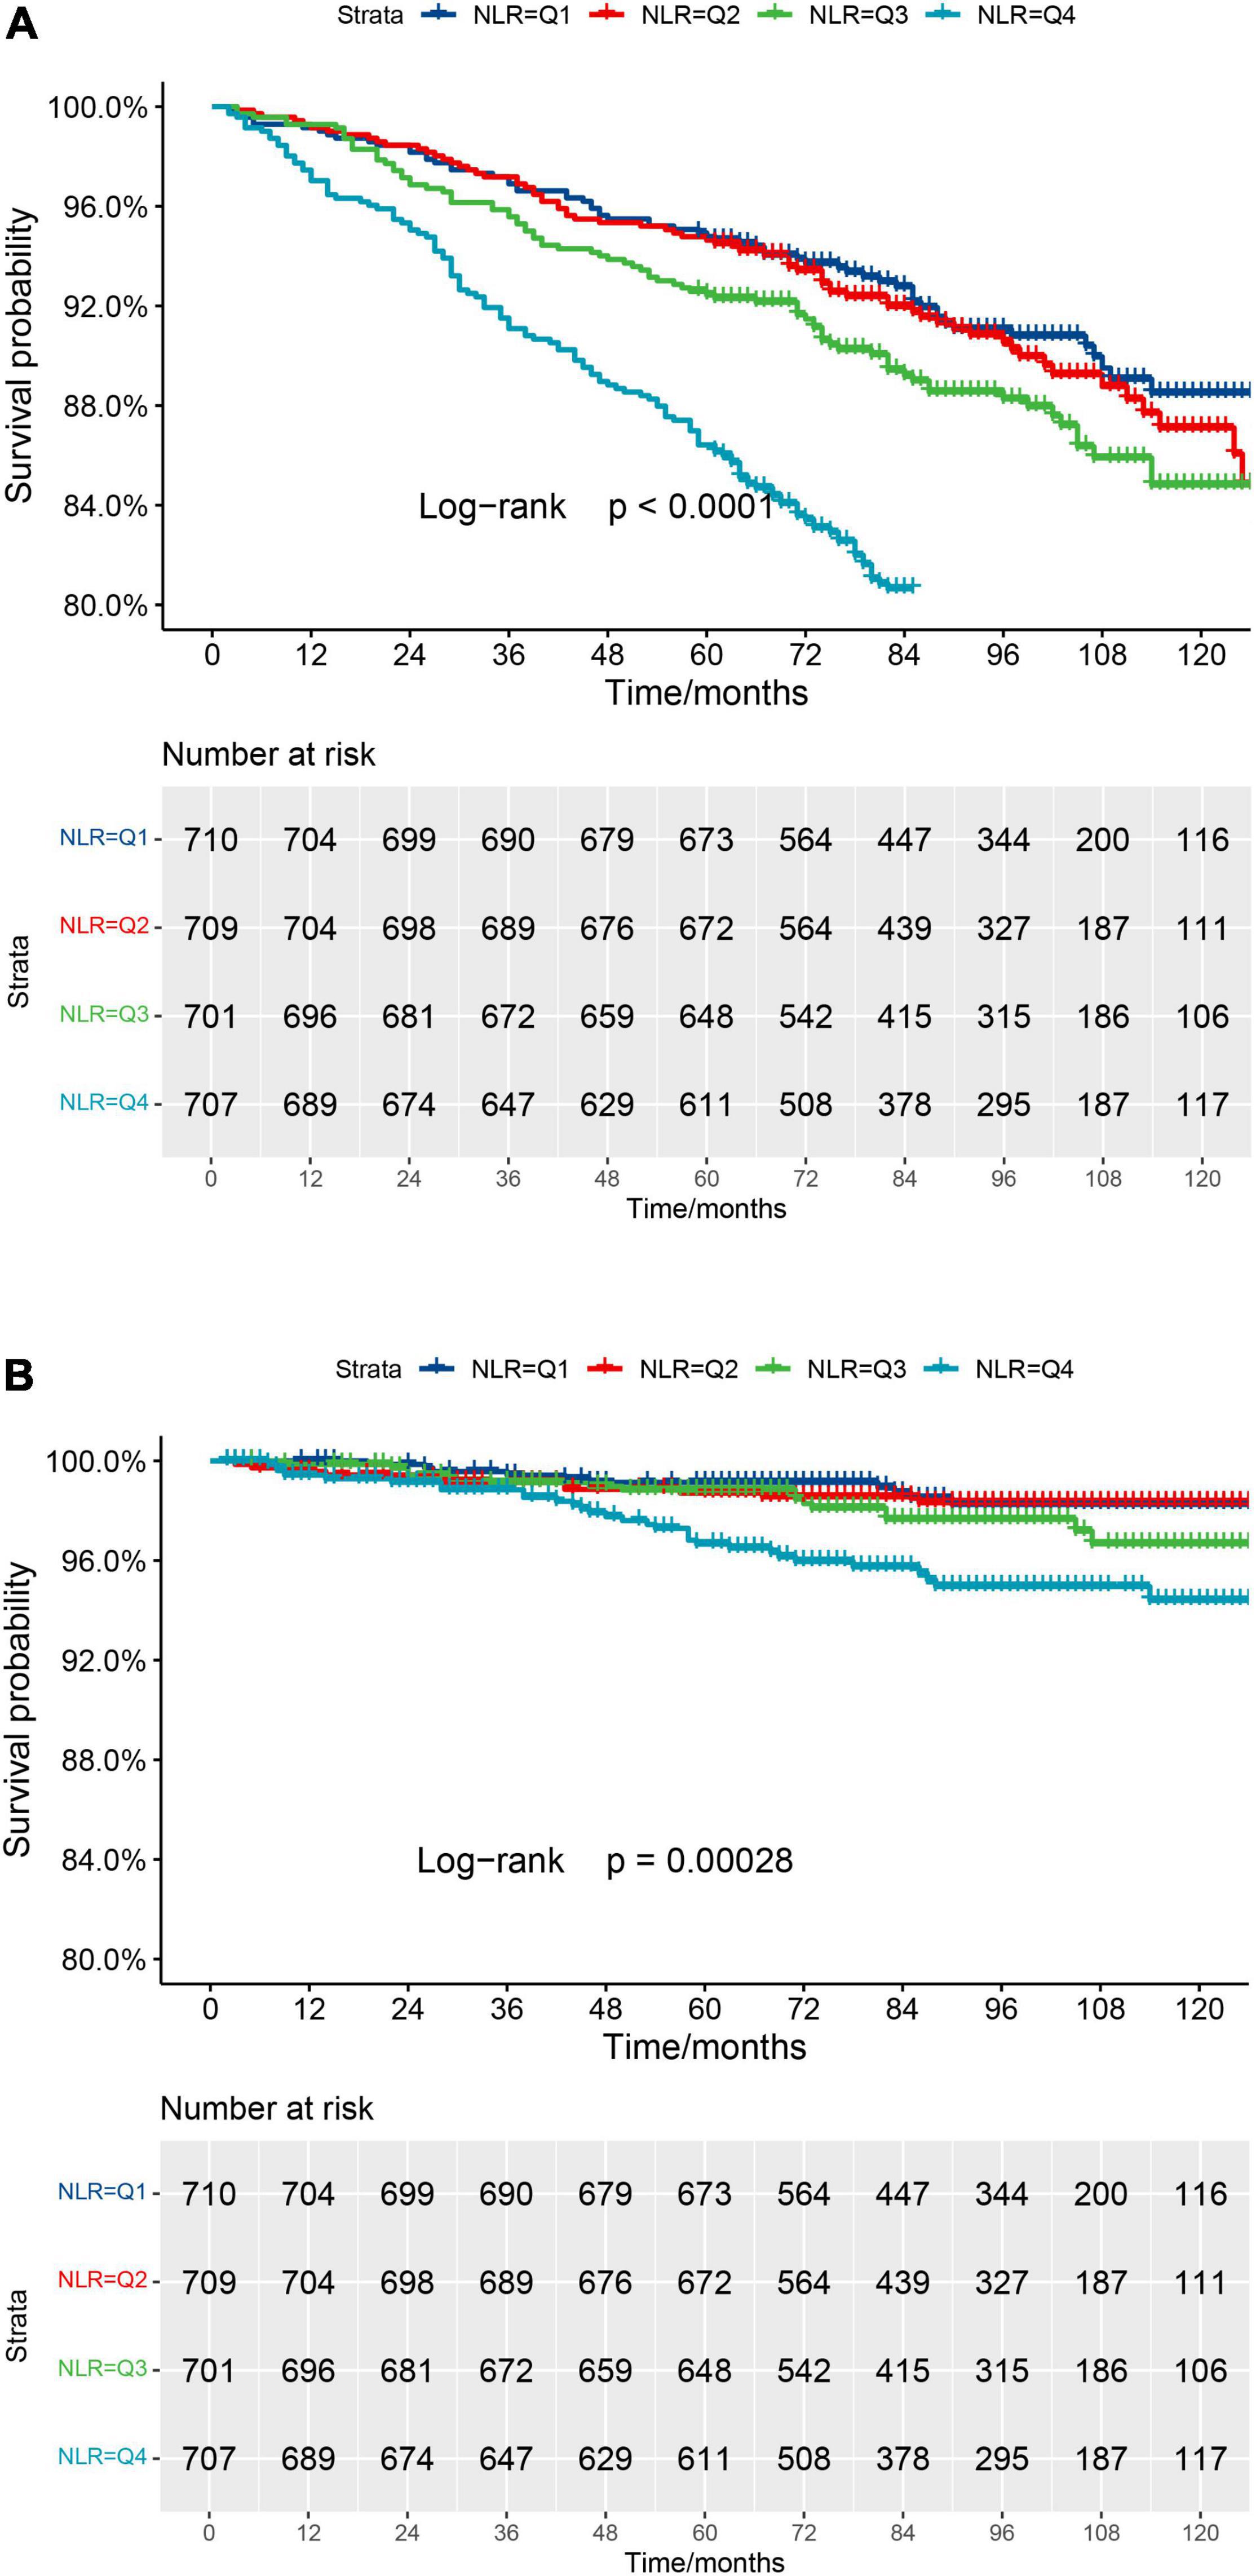
Figure 2. (A) Kaplan–Meier survival curve for all-cause mortality. (B) Kaplan–Meier survival curve for cardiovascular mortality.
Cardiovascular Mortality
In Model 1, no variables were adjusted. Higher NLR levels are associated with a higher risk of cardiovascular mortality (Q4 vs. Q1: HR 5.91, 95% CI [2.52, 13.87]). A similar conclusion was found in adjusted Models 2 and 3. The above results indicate that NLR is an independent risk factor, and NLR increment within a certain range will increase the risk of cardiovascular mortality (p < 0.001).
In order to make the above results more clear, the Kaplan–Meier curve (Figure 2B) was constructed. The highest risk is observed in the group with the highest NLR level (Group Q4, log-rank p for trend = 0.00028). However, it seems not statistically significant in Group Q1, compared to Group Q2.
Survival Prediction and Evaluation
To construct a simple clinical scoring system for predicting mortality, nomograms were considered. Related parameters of each variable in the nomograms are shown in Table 3.
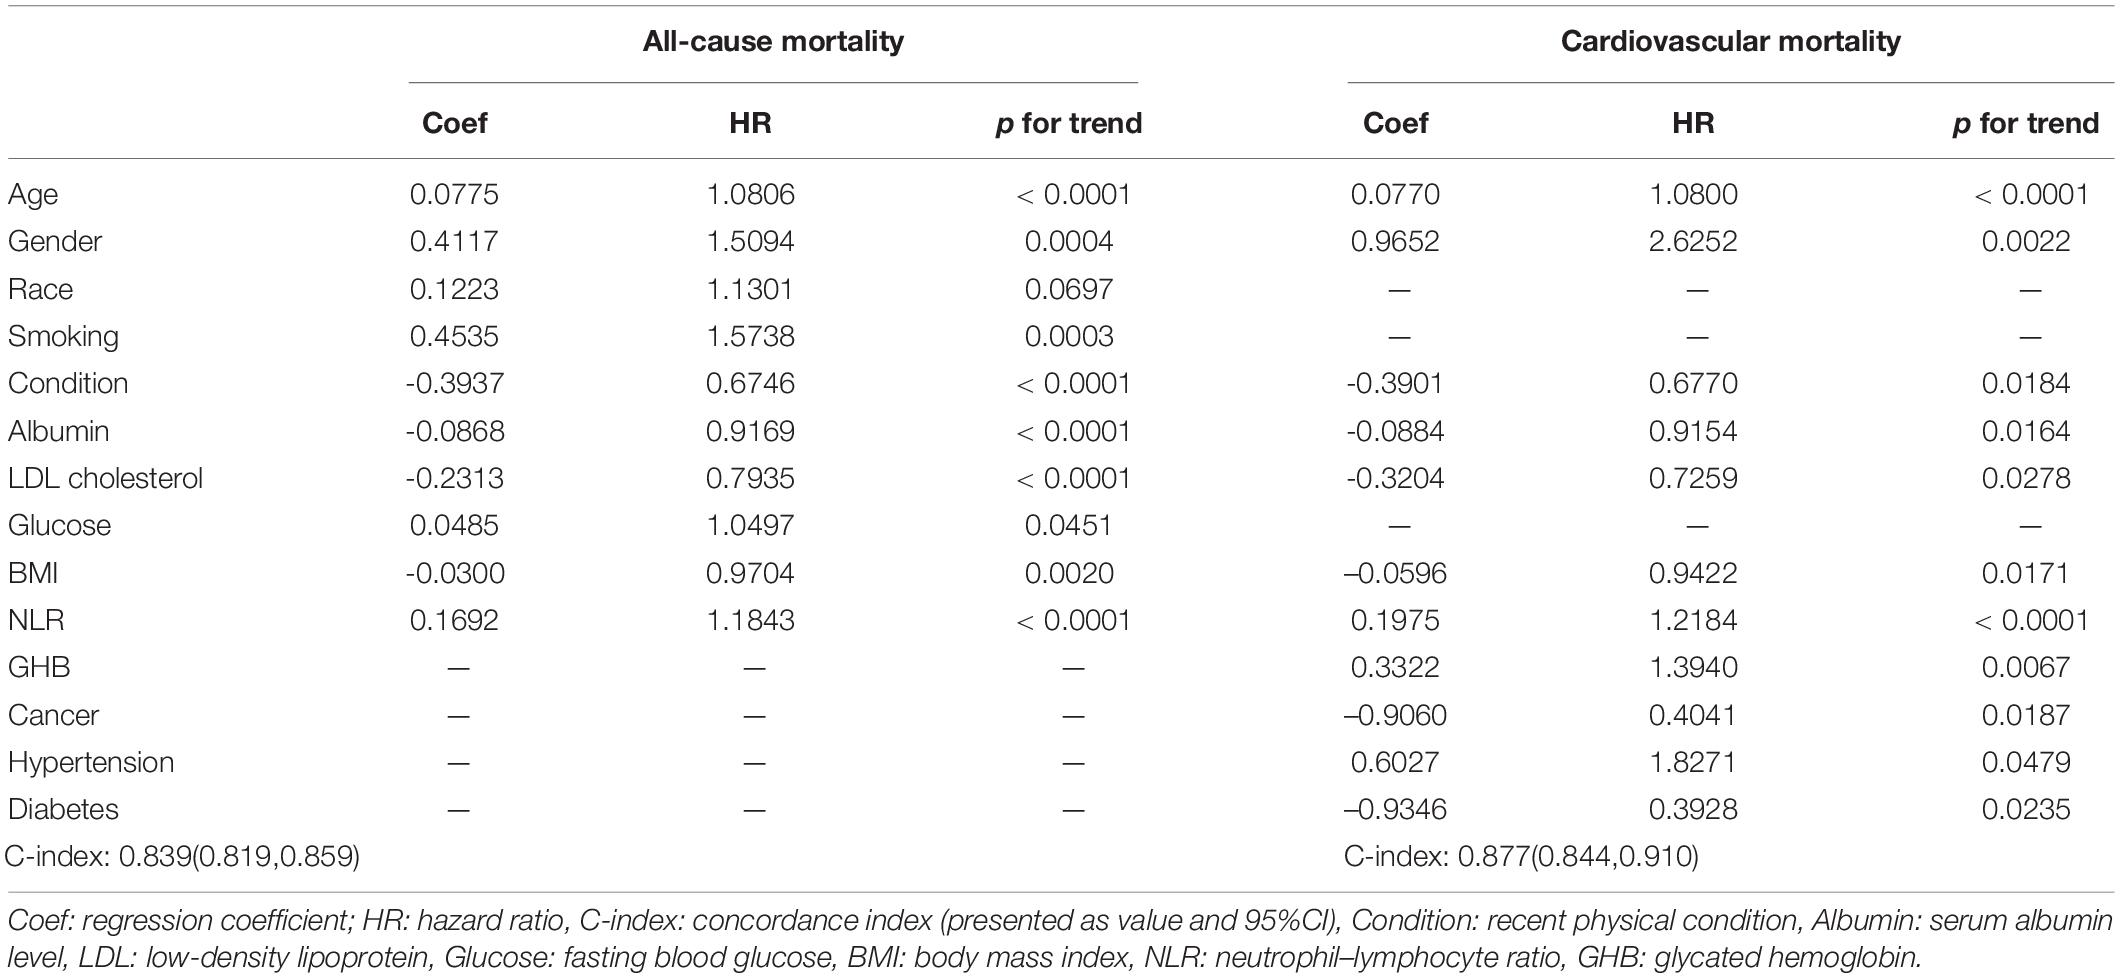
Table 3. Parameters of Cox regression model in nomogram for all-cause and cardiovascular mortality.
For all-cause mortality (Figure 3A), age, gender, race, smoking, recent physical conditions, plasma FBG level, BMI, LDL, serum albumin level, and NLR were used to construct a nomogram. For cardiovascular mortality (Figure 3B), variables of race, smoking, and plasma FBG level were replaced by hypertension, diabetes, and GHB level. Besides, we added the variable “cancer” to the nomogram. A 65-year old non-Hispanic Black man, with a history of tobacco use, complains of recent poor health. His laboratory test results are as followed: FBG: 8.0 mmol/L, LDL: 2.0 mmol/L, albumin: 30 g/L, BMI: 25 kg/m2, and NLR: 6.0. Nomogram calculations for all-cause mortality are as follows:
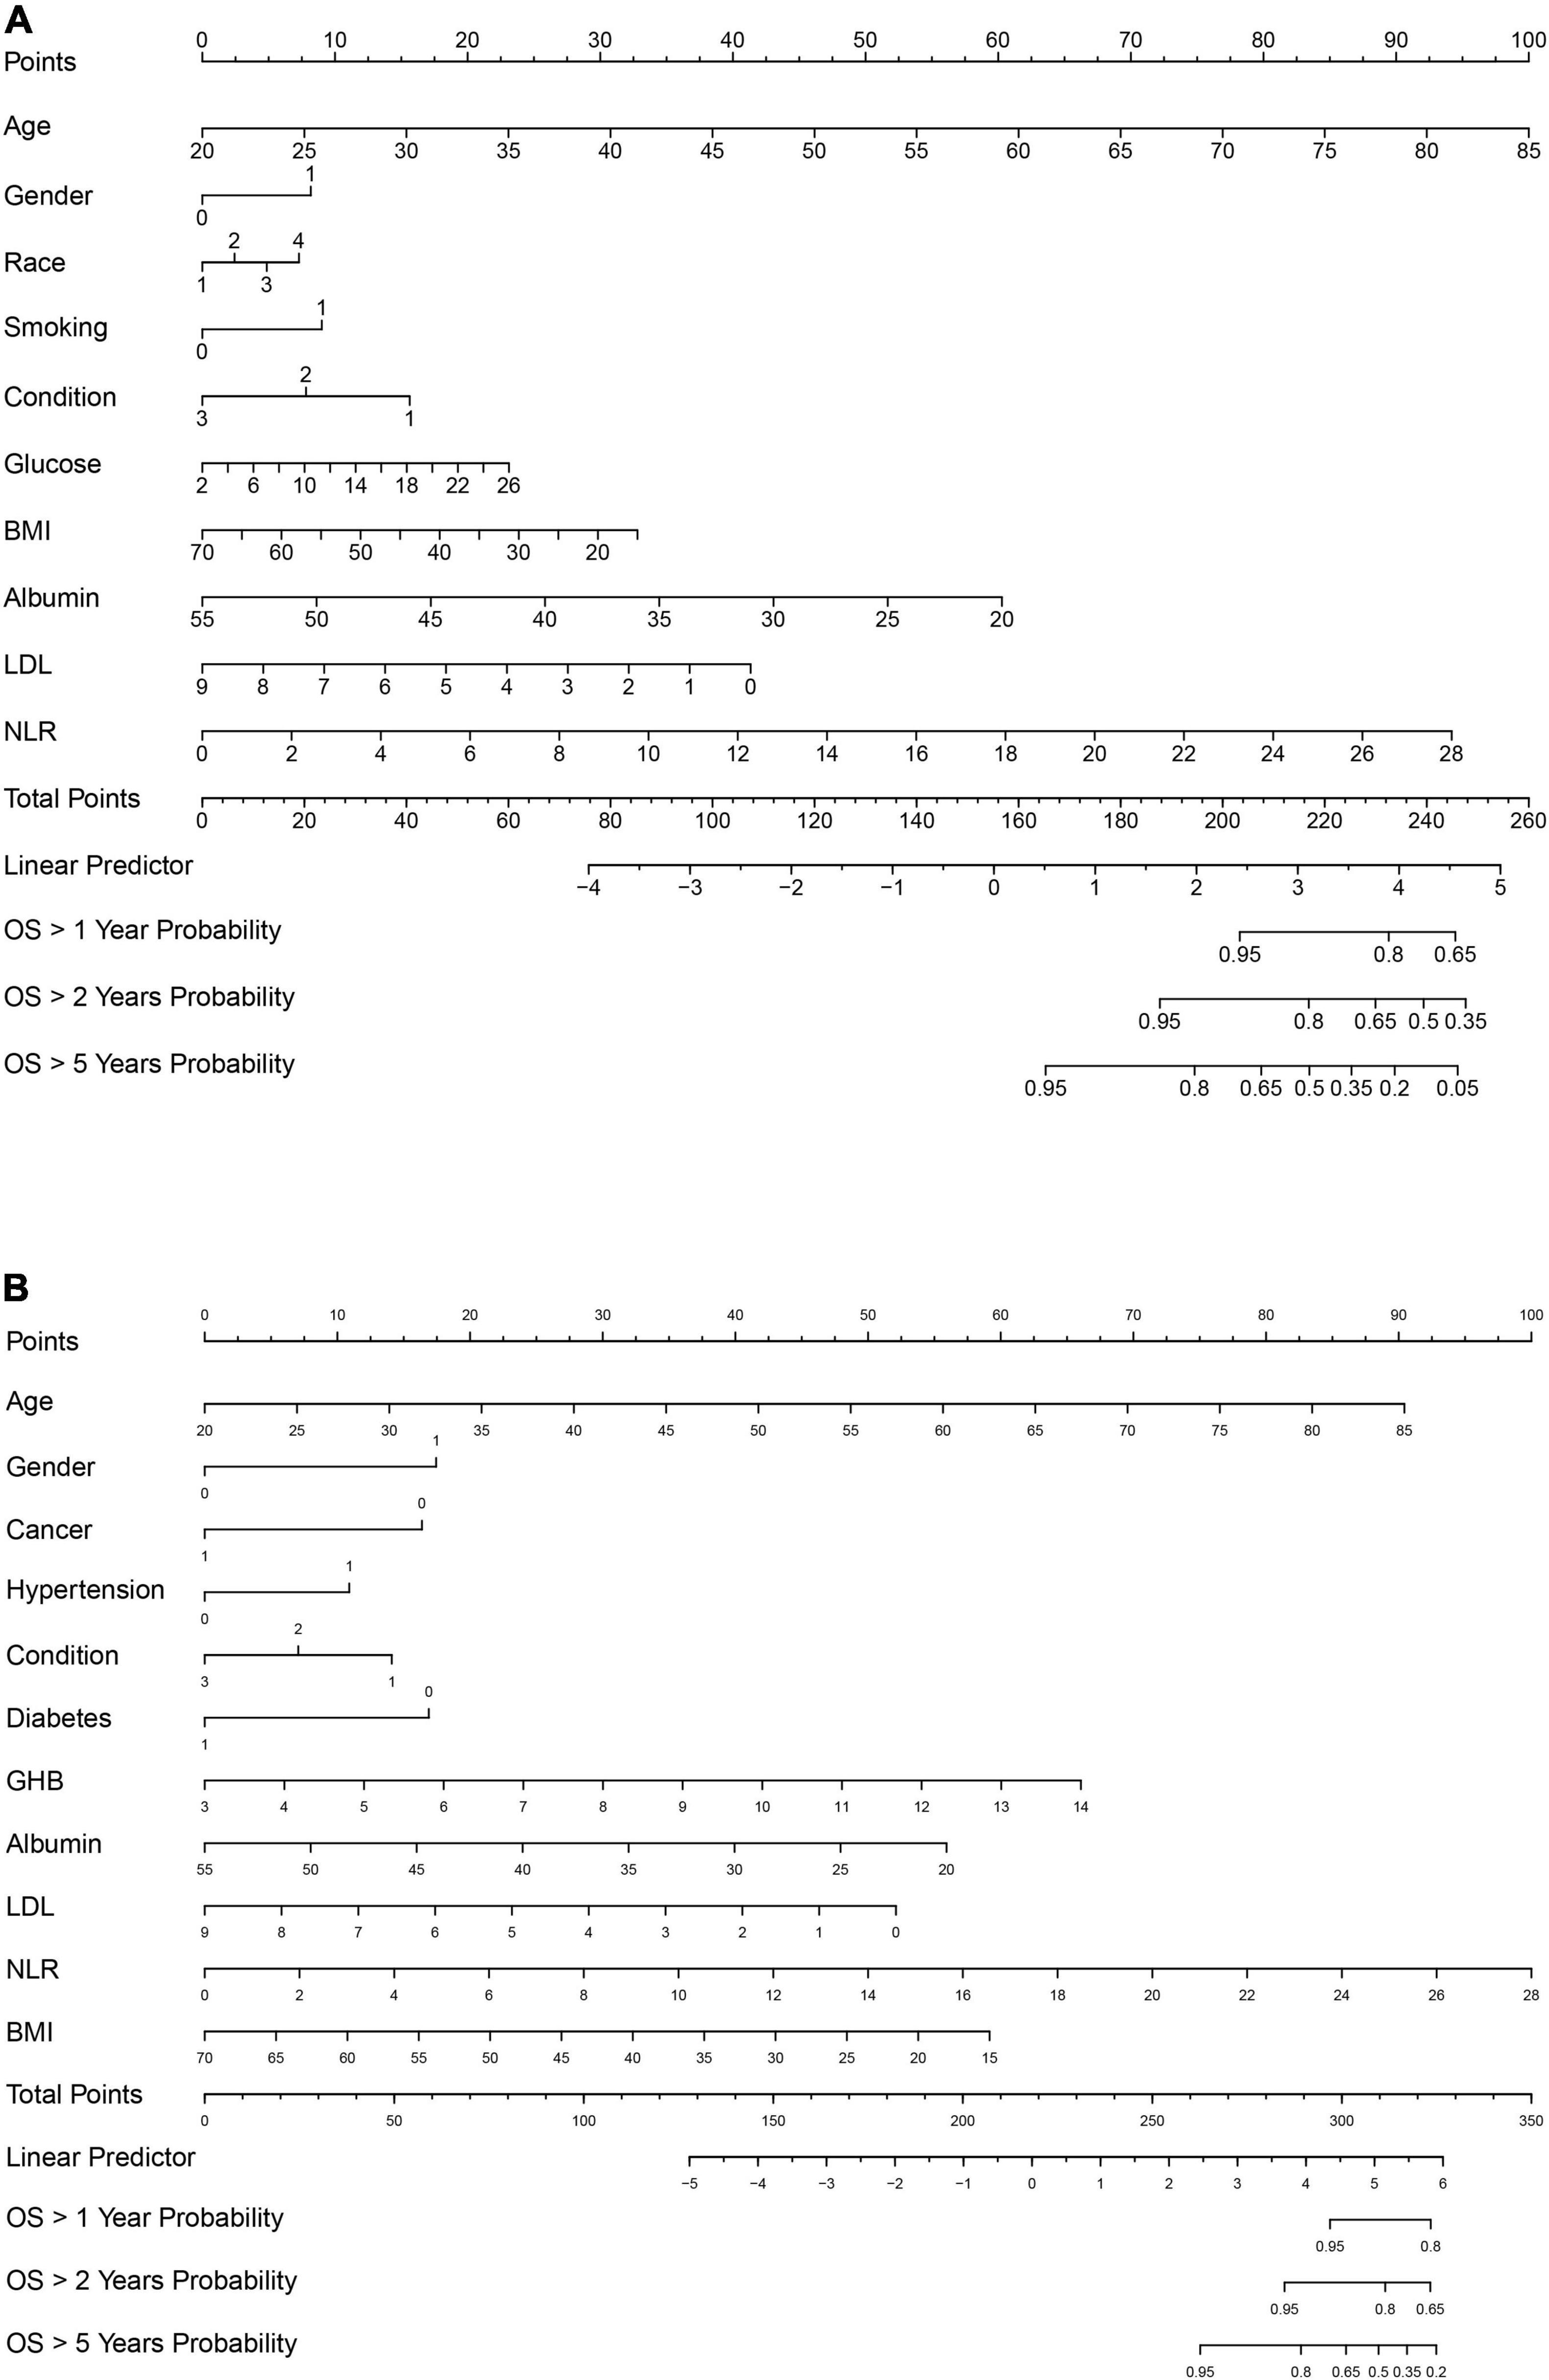
Figure 3. (A) Nomogram model for all-cause mortality. (B) Nomogram model for cardiovascular mortality. Race: 1, Mexican American; 2, other race; 3, non-Hispanic White; 4, non-Hispanic Black. Gender: 1, male; 0, female. For hypertension, diabetes, smoking, and cancer: 1, Yes; 0, No. Condition: recent physical condition, and for Condition: 1, poor; 2, general; 3, good. Glucose, fasting blood glucose. BMI, body mass index. Albumin, serum albumin level; LDL; low-density lipoprotein cholesterol level; GHB, glycated hemoglobin; OS, overall survival.
Age = 65 years old, which corresponds to 68 points;
Gender = male, which corresponds to 8 points;
Race = non-Hispanic Black, which corresponds to 7 points;
…
NLR = 6.0, which corresponds to 20 points.
The total points ≈68 + 8 + 7 + … + 20 ≈ 235, which corresponds to 1-year survival [OS (overall survival) > 1 year probability] of 78%, 2-year survival (OS > 2 years probability) of 60%, and 5-year survival (OS > 5 years probability) of 20%. This calculation method is also applicable to the nomogram calculations of cardiovascular mortality. C-index and calibration plots (Supplementary Figures 4A–F) were performed to evaluate the discrimination and calibration of the nomograms. Our C-indexes (95% CIs) of nomograms for all-cause and cardiovascular mortality were 0.839[0.819, 0.859] and 0.877[0.844, 0.910], respectively. The above results suggest that our nomograms were discriminative and calibrated.
Neutrophil–Lymphocyte Ratio Performed a Superior Role in Mortality Prediction
To verify whether NLR improved predictive mortality ability than classical inflammatory markers (WBC count and CRP), ROC curves (Figures 4A,B) were established. The area under the ROC curves (AUCs) of NLR for all-cause and cardiovascular mortality were 0.632(95% CI [0599, 0.664]) and 0.653(95% CI [0.581, 0.725]), respectively. The AUC of NLR is the largest, which means the predictive ability of NLR is superior to CRP (AUCs: 0.609 and 0.553) and WBC (AUCs: 0.522 and 0.513).

Figure 4. (A) ROC curve analysis of NLR, compared to CRP and WBC to predict all-cause mortality. (B) ROC curve analysis of NLR, compared to CRP and WBC to predict cardiovascular mortality. CRP, C-reactive protein (mg/dl); WBC, white blood cell count in CBC (× 109/L).
Non-linear Relationships Between Neutrophil–Lymphocyte Ratio and Mortality
Restricted cubic spline regression was used to make explicit relationships between NLR and HR. Considering a non-linear relationship between NLR and HR, three-piecewise linear regression was determined to be the most suitable model (non-linear p < 0.001 and non-linear p = 0.003, respectively). For all-cause mortality (Figure 5A), we adjusted for age, gender, race, smoking, recent physical condition, FBG, BMI and albumin. As the NLR increased, the HR value showed a decreasing trend when NLR < 1.75. HR increased significantly when 1.75 < NLR < 3.70 (the second stage). When NLR > 3.70, the HR value continued to show an increasing trend but was not as obvious as the second stage. For cardiovascular mortality (Figure 5B), age, gender, cancer, hypertension, recent physical condition, diabetes, BMI, GHB, and albumin were adjusted. HR decreased up to a valley at the NLR level of 1.65 and then increased with a higher NLR level. HR got a steeper ascension during the second stage both in all-cause and cardiovascular mortality. A clinically meaningful threshold point of NLR level is 2.053, where HR equals to 1.0.

Figure 5. (A) Non-linear relationship between NLR and all-cause mortality. Adjusted for age, gender, race, smoking, condition, glucose, BMI, and albumin. (B) Non-linear relationship between NLR and cardiovascular mortality. Adjusted for age, gender, cancer, hypertension, condition, diabetes, BMI, glycated hemoglobin, and albumin.
Discussion
This was a large-scale and multiethnic cross-sectional analysis, which exposed the correlation between NLR scores and all-cause and cardiovascular mortality in American adults. NLR was independently associated with all-cause mortality and cardiovascular mortality based on the above results. After the adjustment of the variable, the above conclusion still holds. Unlike the previous study on this topic (21–24), our research further clarified the exact relationship between NLR and two types of mortality, and we also identified the valuable threshold points. Besides, we constructed a prognostic-related nomogram model for the first time.
Produced by the bone marrow, neutrophils and lymphocytes are the principal members involved in inflammation of the leukocyte family. Unlike lymphocytes, neutrophils are more active in inflammation because of their chemotaxis. Once neutrophil surface receptors bind to chemokines, neutrophils deform and migrate to where inflammation occurs (25). After that, neutrophils will release cytokines, which also affect the activation of lymphocytes, and participate in inflammation. Inflammatory cytokines released by neutrophils accelerate the progression of CVDs (24). Therefore, many CVDs, such as coronary atherosclerotic heart disease and acute myocardial infarction, are considered to be the result of inflammation (26). Some anti-inflammatory and anti-cytokine therapies have been studied to treat coronary heart disease (27–29). In healthy individuals, the NLR value is approximately 1.65–1.70 (9). Our result was 2.303 ± 1.278 in all 2,827 observers, higher than the literature reported. In vitro experiments in mice confirmed that the proportion of neutrophils increased significantly after myocardial infarction (30). Stephen et al. have told us that decreased lymphocyte count resulted in a poor prognosis of CVDs (31). Besides, we speculate that during inflammation, our body needs more neutrophils rather than lymphocytes, and the bone marrow tends to produce neutrophils. Thence, the increased neutrophils and the reduction in lymphocytes will lead to a poor prognosis of CVDs. When neutrophils increase and lymphocytes decrease, the proportion of the two will increase. That is one of the reasons why an increase in the NLR level will lead to a poor prognosis.
There are many commonly used inflammation indexes, such as CRP, erythrocyte sedimentation rate, procalcitonin, and WBC count. In all these indexes, CRP and high-sensitivity CRP are the most studied (32). Regardless of the sensitivity and specificity of these indicators, the cost of measuring these indicators is not cheap in clinical practice. However, the NLR is relatively easy to obtain, and the cost of blood routine tests is very economical. Our ROC curves also confirmed that the sensitivity and specificity of NLR are higher than those of CRP and WBC. There are many studies on the impact of NLR on CVDs or cardiovascular mortality (14, 33–35). However, there is no simple and convenient model to predict survival, yet. In order to get a convenient prediction model, we constructed nomograms using stepwise regression analysis with the help of the R project. Nomogram used to be a simple graphical representation of a statistical predictive model and was widely used for cancer prognosis (36, 37). A good nomogram will allow the doctor to get some useful information more quickly. Two primary ways of nomograms are used in clinical medicine, one is what we show in this paper, and the other is a computer-based calculator, where specific variables are entered and the likelihood of an event is computed (37, 38). To answer a focused clinical question, a nomogram must be constructed carefully. C-index and calibration plots are used to appraise nomograms, and our nomograms are excellent.
Many factors can affect NLR levels, such as dietary nutritional factors, pharmacological treatments, and comorbidities (39–41). Comorbidities, such as chronic obstructive pulmonary disease (COPD), have an influence on the NLR level. Relative lymphopenia and further increment of NLR value have been demonstrated to be a risk factor in elderly patients with severe COPD (40, 42, 43). Regrettably, data on comorbidities of observers are missing from the database. More research is required to supplement this topic.
There were three strengths in our research. First, we have an adequate sample size of 2,827 observers with complete data. Second, we are the first to construct nomogram models. Finally, we used the R project and weighted Cox regression analysis instead of classical Cox regression to get a credible result. In addition, our research was limited in certain respects. First, the retrospective nature of this paper is a further limitation; we cannot get dynamic variable data. Up to now, the follow-up outcome data published by The National Center for Health Statistics are only up to 2014, and we cannot obtain follow-up data after 2014. Second, to the year 2014, fewer observers died, which will lead to statistical errors. We suspect lower AUCs and wider 95% CIs in cardiovascular mortality for this reason. Last, nomogram performance lacks accepted reporting standards and varies widely. More prospective studies are required to optimize the nomograms and our research.
Conclusion
In conclusion, our research suggests that NLR is independently associated with all-cause and cardiovascular mortality, and NLR > 2.053 may be a risk factor of mortality. The NLR value is a valuable index and should be recommended for use.
Data Availability Statement
The datasets presented in this study can be found in online repositories. The names of the repository/repositories and accession number(s) can be found in the article/Supplementary Material.
Ethics Statement
Ethical review and approval was not required for the study on human participants in accordance with the local legislation and institutional requirements. The patients/participants provided their written informed consent to participate in this study.
Author Contributions
YY conceived and designed this study. LG analyzed all data and drafted this manuscript. ZX, BQ, and HC collected all data. WW and YC consulted related reference literature. All authors read and approved the final manuscript.
Conflict of Interest
The authors declare that the research was conducted in the absence of any commercial or financial relationships that could be construed as a potential conflict of interest.
Publisher’s Note
All claims expressed in this article are solely those of the authors and do not necessarily represent those of their affiliated organizations, or those of the publisher, the editors and the reviewers. Any product that may be evaluated in this article, or claim that may be made by its manufacturer, is not guaranteed or endorsed by the publisher.
Acknowledgments
We gratefully acknowledge Xiaobing Zhai from the School of Medicine, Wuhan University of Science and Technology, for his help in the statistical analysis.
Supplementary Material
The Supplementary Material for this article can be found online at: https://www.frontiersin.org/articles/10.3389/fcvm.2022.847998/full#supplementary-material
Abbreviations
NLR, Neutrophil–lymphocyte ratio; NHANES, National Health and Nutrition Examination Survey; CBC, Complete blood count; ROC, Receiver operating characteristic; LDL, Low-density lipoprotein; HDL, High-density lipoprotein; ICD, International Classification of Disease; CVD, Cardiovascular disease or event; BMI, Body mass index; GHB, Glycated hemoglobin; CI, Confidence interval; HR, Hazard ratio; C-index, Concordance index; CRP, C-Reactive protein; Coef, Regression coefficient; COPD, Chronic obstructive pulmonary disease.
Footnotes
- ^ https://www.cdc.gov/nchs/nhanes/
- ^ https://ftp.cdc.gov/pub/Health_Statistics/NCHS/datalinkage/linked_mortality
- ^ https://www.sas.com/en_us/home.html
- ^ https://www.rproject.org/
- ^ https://www.imim.es/ofertadeserveis/software-public/granmo/
References
1. Arbab-Zadeh A, Fuster V. The myth of the “vulnerable plaque”: transitioning from a focus on individual lesions to atherosclerotic disease burden for coronary artery disease risk assessment. J Am Coll Cardiol. (2015) 65:846–55. doi: 10.1016/j.jacc.2014.11.041
2. Jin HY, Weir-McCall JR, Leipsic JA, Son JW, Sellers SL, Shao M, et al. The relationship between coronary calcification and the natural history of coronary artery disease. JACC Cardiovasc Imaging. (2021) 14:233–42. doi: 10.1016/j.jcmg.2020.08.036
3. Sasaki K, Shoji T, Kabata D, Shintani A, Okute Y, Tsuchikura S, et al. Oxidative stress and inflammation as predictors of mortality and cardiovascular events in hemodialysis patients: the DREAM cohort. J Atheroscler Thromb. (2021) 28:249–60. doi: 10.5551/jat.56069
4. Libby P. Inflammation in atherosclerosis-no longer a theory. Clin Chem. (2021) 67:131–42. doi: 10.1093/clinchem/hvaa275
5. Libby P, Pasterkamp G, Crea F, Jang IK. Reassessing the mechanisms of acute coronary syndromes. Circ Res. (2019) 124:150–60. doi: 10.1161/CIRCRESAHA.118.311098
6. Daiber A, Steven S, Weber A, Shuvaev VV, Muzykantov VR, Laher I, et al. Targeting vascular (endothelial) dysfunction. Br J Pharmacol. (2017) 174:1591–619. doi: 10.1111/bph.13517
7. Schloss MJ, Swirski FK, Nahrendorf M. Modifiable cardiovascular risk, hematopoiesis, and innate immunity. Circ Res. (2020) 126:1242–59. doi: 10.1161/CIRCRESAHA.120.315936
8. Adamstein NH, MacFadyen JG, Rose LM, Glynn RJ, Dey AK, Libby P, et al. The neutrophil-lymphocyte ratio and incident atherosclerotic events: analyses from five contemporary randomized trials. Eur Heart J. (2021) 42:896–903. doi: 10.1093/eurheartj/ehaa1034
9. Langley BO, Guedry SE, Goldenberg JZ, Hanes DA, Beardsley JA, Ryan JJ. Inflammatory bowel disease and neutrophil-lymphocyte ratio: a systematic scoping review. J Clin Med. (2021) 10:4219. doi: 10.3390/jcm10184219
10. Cai J, Li H, Zhang C, Chen Z, Liu H, Lei F, et al. The neutrophil-to-lymphocyte ratio determines clinical efficacy of corticosteroid therapy in patients with COVID-19. Cell Metab. (2021) 33:258–69.e3. doi: 10.1016/j.cmet.2021.01.002
11. McSorley ST, Lau HYN, McIntosh D, Forshaw MJ, McMillan DC, Crumley AB. Staging the tumor and staging the host: pretreatment combined neutrophil lymphocyte ratio and modified glasgow prognostic score is associated with overall survival in patients with esophagogastric cancers undergoing treatment with curative intent. Ann Surg Oncol. (2021) 28:722–31. doi: 10.1245/s10434-020-09074-5
12. Larmann J, Handke J, Scholz AS, Dehne S, Arens C, Gillmann HJ, et al. Preoperative neutrophil to lymphocyte ratio and platelet to lymphocyte ratio are associated with major adverse cardiovascular and cerebrovascular events in coronary heart disease patients undergoing non-cardiac surgery. BMC Cardiovasc Disord. (2020) 20:230. doi: 10.1186/s12872-020-01500-6
13. Wada H, Dohi T, Miyauchi K, Nishio R, Takeuchi M, Takahashi N, et al. Neutrophil to lymphocyte ratio and long-term cardiovascular outcomes in coronary artery disease patients with low high-sensitivity C-reactive protein level. Int Heart J. (2020) 61:447–53. doi: 10.1536/ihj.19-543
14. Zhang S, Diao J, Qi C, Jin J, Li L, Gao X, et al. Predictive value of neutrophil to lymphocyte ratio in patients with acute ST segment elevation myocardial infarction after percutaneous coronary intervention: a meta-analysis. BMC Cardiovasc Disord. (2018) 18:75. doi: 10.1186/s12872-018-0812-6
15. Tan QH, Huang YQ, Liu XC, Liu L, Lo K, Chen JY, et al. A U-shaped relationship between selenium concentrations and all-cause or cardiovascular mortality in patients with hypertension. Front Cardiovasc Med. (2021) 8:671618. doi: 10.3389/fcvm.2021.671618
16. Lloyd-Jones DM, Lewis CE, Schreiner PJ, Shikany JM, Sidney S, Reis JP. The coronary artery risk development in young adults (CARDIA) study: JACC focus seminar 8/8. J Am Coll Cardiol. (2021) 78:260–77. doi: 10.1016/j.jacc.2021.05.022
17. Caballero B. Humans against obesity: who will win? Adv Nutr. (2019) 10(Suppl. 1):S4–9. doi: 10.1093/advances/nmy055
18. American Diabetes Association. 2. Classification and diagnosis of diabetes: standards of medical care in diabetes-2020. Diabetes Care. (2020) 43(Suppl. 1):S14–31. doi: 10.2337/dc20-S002
19. O’Malley PG, Arnold MJ, Kelley C, Spacek L, Buelt A, Natarajan S, et al. Management of dyslipidemia for cardiovascular disease risk reduction: synopsis of the 2020 updated U.S. department of veterans affairs and U.S. Department of defense clinical practice guideline. Ann Intern Med. (2020) 173:822–9. doi: 10.7326/M20-4648
20. Grundy SM, Stone NJ, Bailey AL, Beam C, Birtcher KK, Blumenthal RS, et al. 2018 AHA/ACC/AACVPR/AAPA/ABC/ACPM/ADA/AGS/APhA/ASPC/NLA/PCNA guideline on the management of blood cholesterol: a report of the American college of cardiology/American heart association task force on clinical practice guidelines. Circulation. (2019) 139:e1082–143. doi: 10.1161/CIR.0000000000000625
21. Ao G, Wang Y, Qi X, Wang F, Wen H. Association of neutrophil-to-lymphocyte ratio and risk of cardiovascular or all-cause mortality in chronic kidney disease: a meta-analysis. Clin Exp Nephrol. (2021) 25:157–65. doi: 10.1007/s10157-020-01975-9
22. He S, He S, Yang Y, Li B, Gao L, Xie Q, et al. Correlation between neutrophil to lymphocyte ratio and myocardial injury in population exposed to high altitude. Front Cardiovasc Med. (2021) 8:738817. doi: 10.3389/fcvm.2021.738817
23. Lattanzi S, Brigo F, Trinka E, Cagnetti C, Di Napoli M, Silvestrini M. Neutrophil-to-lymphocyte ratio in acute cerebral hemorrhage: a system review. Transl Stroke Res. (2019) 10:137–45. doi: 10.1007/s12975-018-0649-4
24. Ji Z, Liu G, Guo J, Zhang R, Su Y, Carvalho A, et al. The neutrophil-to-lymphocyte ratio is an important indicator predicting in-hospital death in AMI patients. Front Cardiovasc Med. (2021) 8:706852. doi: 10.3389/fcvm.2021.706852
25. Gistera A, Hansson GK. The immunology of atherosclerosis. Nat Rev Nephrol. (2017) 13:368–80. doi: 10.1038/nrneph.2017.51
26. Hoogeveen RC, Ballantyne CM. Residual cardiovascular risk at low LDL: remnants, lipoprotein(a), and inflammation. Clin Chem. (2021) 67:143–53. doi: 10.1093/clinchem/hvaa252
27. Khambhati J, Engels M, Allard-Ratick M, Sandesara PB, Quyyumi AA, Sperling L. Immunotherapy for the prevention of atherosclerotic cardiovascular disease: promise and possibilities. Atherosclerosis. (2018) 276:1–9. doi: 10.1016/j.atherosclerosis.2018.07.007
28. Shah B, Newman JD, Woolf K, Ganguzza L, Guo Y, Allen N, et al. Anti-inflammatory effects of a vegan diet versus the American heart association-recommended diet in coronary artery disease trial. J Am Heart Assoc. (2018) 7:e011367. doi: 10.1161/JAHA.118.011367
29. Ridker PM. Anticytokine agents: targeting interleukin signaling pathways for the treatment of atherothrombosis. Circ Res. (2019) 124:437–50. doi: 10.1161/CIRCRESAHA.118.313129
30. Ma Y, Yabluchanskiy A, Iyer RP, Cannon PL, Flynn ER, Jung M, et al. Temporal neutrophil polarization following myocardial infarction. Cardiovasc Res. (2016) 110:51–61. doi: 10.1093/cvr/cvw024
31. Boag SE, Das R, Shmeleva EV, Bagnall A, Egred M, Howard N, et al. T lymphocytes and fractalkine contribute to myocardial ischemia/reperfusion injury in patients. J Clin Invest. (2015) 125:3063–76. doi: 10.1172/JCI80055
32. Ridker PM, MacFadyen JG, Everett BM, Libby P, Thuren T, Glynn RJ, et al. Relationship of C-reactive protein reduction to cardiovascular event reduction following treatment with canakinumab: a secondary analysis from the CANTOS randomised controlled trial. Lancet. (2018) 391:319–28. doi: 10.1016/s0140-6736(17)32814-3
33. Bai B, Cheng M, Jiang L, Xu J, Chen H, Xu Y. High neutrophil to lymphocyte ratio and its gene signatures correlate with diastolic dysfunction in heart failure with preserved ejection fraction. Front Cardiovasc Med. (2021) 8:614757. doi: 10.3389/fcvm.2021.614757
34. Angkananard T, Inthanoo T, Sricholwattana S, Rattanajaruskul N, Wongsoasu A, Roongsangmanoon W. The predictive role of neutrophil-to-lymphocyte ratio (NLR) and mean platelet volume-to-lymphocyte ratio (MPVLR) for cardiovascular events in adult patients with acute heart failure. Mediators Inflamm. (2021) 2021:6889733. doi: 10.1155/2021/6889733
35. Machado GP, Araujo GN, Carpes CK, Lech M, Mariani S, Valle FH, et al. Comparison of neutrophil-to-lymphocyte ratio and mean platelet volume in the prediction of adverse events after primary percutaneous coronary intervention in patients with ST-elevation myocardial infarction. Atherosclerosis. (2018) 274:212–7. doi: 10.1016/j.atherosclerosis.2018.05.022
36. Iasonos A, Schrag D, Raj GV, Panageas KS. How to build and interpret a nomogram for cancer prognosis. J Clin Oncol. (2008) 26:1364–70. doi: 10.1200/JCO.2007.12.9791
37. Balachandran VP, Gonen M, Smith JJ, DeMatteo RP. Nomograms in oncology: more than meets the eye. Lancet Oncol. (2015) 16:e173–80. doi: 10.1016/s1470-2045(14)71116-7
38. Wu J, Zhang H, Li L, Hu M, Chen L, Xu B, et al. A nomogram for predicting overall survival in patients with low-grade endometrial stromal sarcoma: a population-based analysis. Cancer Commun (Lond). (2020) 40:301–12. doi: 10.1002/cac2.12067
39. Orkaby AR, Driver JA, Ho YL, Lu B, Costa L, Honerlaw J, et al. Association of statin use with all-cause and cardiovascular mortality in US veterans 75 years and older. JAMA. (2020) 324:68–78. doi: 10.1001/jama.2020.7848
40. Acanfora D, Scicchitano P, Carone M, Acanfora C, Piscosquito G, Maestri R, et al. Relative lymphocyte count as an indicator of 3-year mortality in elderly people with severe COPD. BMC Pulm Med. (2018) 18:116. doi: 10.1186/s12890-018-0685-6
41. Aune D, Keum N, Giovannucci E, Fadnes LT, Boffetta P, Greenwood DC, et al. Whole grain consumption and risk of cardiovascular disease, cancer, and all cause and cause specific mortality: systematic review and dose-response meta-analysis of prospective studies. BMJ. (2016) 353:i2716. doi: 10.1136/bmj.i2716
42. Paliogiannis P, Fois AG, Sotgia S, Mangoni AA, Zinellu E, Pirina P, et al. Neutrophil to lymphocyte ratio and clinical outcomes in COPD: recent evidence and future perspectives. Eur Respir Rev. (2018) 27:170113. doi: 10.1183/16000617.0113-2017
Keywords: NHANES, neutrophil-lymphocyte ratio, cardiovascular, mortality, all-cause
Citation: Gu L, Xia Z, Qing B, Chen H, Wang W, Chen Y and Yuan Y (2022) The Core Role of Neutrophil–Lymphocyte Ratio to Predict All-Cause and Cardiovascular Mortality: A Research of the 2005–2014 National Health and Nutrition Examination Survey. Front. Cardiovasc. Med. 9:847998. doi: 10.3389/fcvm.2022.847998
Received: 03 January 2022; Accepted: 28 March 2022;
Published: 12 May 2022.
Edited by:
Alvin H. Schmaier, Case Western Reserve University, United StatesReviewed by:
Irene R. Degano, Centro de Investigación Biomédica en Red en Enfermedades Cardiovasculares (CIBERCV), SpainMarco Matteo Ciccone, University of Bari Aldo Moro, Italy
Copyright © 2022 Gu, Xia, Qing, Chen, Wang, Chen and Yuan. This is an open-access article distributed under the terms of the Creative Commons Attribution License (CC BY). The use, distribution or reproduction in other forums is permitted, provided the original author(s) and the copyright owner(s) are credited and that the original publication in this journal is cited, in accordance with accepted academic practice. No use, distribution or reproduction is permitted which does not comply with these terms.
*Correspondence: Yunchang Yuan, eXVhbnljQGNzdS5lZHUuY24=