
95% of researchers rate our articles as excellent or good
Learn more about the work of our research integrity team to safeguard the quality of each article we publish.
Find out more
ORIGINAL RESEARCH article
Front. Cardiovasc. Med. , 17 November 2022
Sec. Cardiovascular Imaging
Volume 9 - 2022 | https://doi.org/10.3389/fcvm.2022.1053122
This article is part of the Research Topic Advanced Quantitative Indexes in Cardiovascular Magnetic Resonance Imaging View all 19 articles
 Xi Jia1,2†Xiaoyu Han1,2†Yuqin Wang3†
 Fangfang He3
 Xiaoyue Zhou4Yuting Zheng1,2
 Yingkun Guo5
 Rong Xu5Jia Liu1,2Yumin Li1,2Jin Gu1,2
 Yukun Cao1,2*
 Chun Zhang3*
 Heshui Shi1,2*
Background: Chronic kidney disease patients have increased risk of cardiovascular abnormalities. This study investigated the relationship between cardiovascular abnormalities and the severity of chronic kidney disease using cardiac magnetic resonance imaging.
Methods: We enrolled 84 participants with various stages of chronic kidney disease (group I: stages 1–3, n = 23; group II: stages 4–5, n = 20; group III: hemodialysis patients, n = 41) and 32 healthy subjects. The demographics and biochemical parameters of the study subjects were evaluated. All subjects underwent non-contrast cardiac magnetic resonance scans. Myocardial strain, native T1, and T2 values were calculated from the scanning results. Analysis of covariance was used to compare the imaging parameters between group I-III and the controls.
Results: The left ventricular ejection fraction (49 vs. 56%, p = 0.021), global radial strain (29 vs. 37, p = 0.019) and global circumferential strain (-17.4 vs. −20.6, p < 0.001) were significantly worse in group III patients compared with the controls. Furthermore, the global longitudinal strain had a significant decline in group II and III patients compared with the controls (-13.7 and −12.9 vs. −16.2, p < 0.05). Compared with the controls, the native T1 values were significantly higher in group II and III patients (1,041 ± 7 and 1,053 ± 6 vs. 1,009 ± 6, p < 0.05), and T2 values were obviously higher in group I-III patients (49.9 ± 0.6 and 53.2 ± 0.7 and 50.1 ± 0.5 vs. 46.6 ± 0.5, p < 0.001). The advanced chronic kidney disease stage showed significant positive correlation with global radial strain (r = 0.436, p < 0.001), global circumferential strain (r = 0.386, p < 0.001), native T1 (r = 0.5, p < 0.001) and T2 (r = 0.467, p < 0.001) values. In comparison with the group II patients, hemodialysis patients showed significantly lower T2 values (53.2 ± 0.7 vs. 50.1 ± 0.5, p = 0.002), but no significant difference in T1 values (1,041 ± 7 vs. 1,053 ± 6).
Conclusions: Our study showed that myocardial strain, native T1, and T2 values progressively got worse with advancing chronic kidney disease stage. The increased T1 values and decreased T2 values of hemodialysis patients might be due to increasing myocardial fibrosis but with reduction in oedema following effective fluid management.
Trial registration number: ChiCTR2100053561 (http://www.chictr.org.cn/edit.aspx?pid=139737&htm=4).
Chronic kidney disease (CKD) is a major health problem worldwide with the rates of morbidity and mortality increasing by 29.3 and 41.5%, respectively, between 1990 and 2017 (1). The risk of cardiovascular disease (CVD) has been shown to be higher in CKD patients compared with the general population (2). CVD is also the leading cause of mortality in the CKD patients (3, 4). Izamura et al. (5) reported that lower estimated glomerular filtration rates (eGFRs) in CKD patients were associated with increased cardiac cell enlargement, cardiac hypertrophy, and fibrosis of the left ventricle. Therefore, CKD patients should be regarded as a high-risk group for CVD and need close medical attention at an individual level (6).
Non-contrast cardiac magnetic resonance (CMR) imaging can be used to monitor changes in myocardial mass and biventricular volumes in CKD patients undergoing long-term hemodialysis (HD) (7). CMR is also used to directly and non-invasively estimate the pathologic changes in the cardiac structure and function based on myocardial T1 and T2 mapping (8). Left ventricular (LV) strain parameters are more sensitive than left ventricular ejection fraction (LVEF) in detecting early cardiac dysfunction because they directly estimate the movement of myocardial fibers (9).
Previous CMR studies (10, 11) reported myocardial abnormalities in patients with early and advanced CKD or end-stage renal disease (ESRD) patients. These results showed that cardiac abnormalities could occur in both early-stage and advanced-stage CKD patients. Furthermore, study by Hayer et al. (12) showed that myocardial fibrosis evaluated by native T1 time was inversely associated with kidney function. However, the stage of CKD at which obvious myocardial abnormalities appear is not well-defined. Furthermore, the majority of the ESRD patients undergo HD (13, 14). However, it is not clear about the relative contributions of myocardial fibrosis to the change of native T1 times in HD patients. Therefore, in this study, we investigated the association between obvious myocardial abnormalities and CKD stages by comparing the non-contrast CMR parameters. Furthermore, we analyzed the alterations of CMR parameters in patients following HD.
In this prospective longitudinal observational study, 84 participants with different stages of CKD were enrolled from the Department of Nephrology, Wuhan Union Hospital, between March 2021 to October 2021. We also enrolled 32 healthy subjects of similar age, gender, and body mass index (BMI) from the Wuhan community between March 2021 to October 2021. This study was approved by the Ethics committee of the Tongji Medical College of Huazhong University of Science and Technology. It was first registered on 24/11/2021 with the registration number ChiCTR2100053561, and was conducted in accordance with the Helsinki Declaration. The written informed consent was obtained from all the study subjects.
The inclusion criteria for participants with CKD were as follows: (1) clinically confirmed CKD at different stages; (2) age between 30 and 80 years; (3) absence of chest pain, dyspnea, and palpitations; (4) absence of history for cardiovascular diseases such as congenital heart disease, coronary artery disease, valvular heart disease, or cardiomyopathy; and (5) normal electrocardiographic manifestations. All dialysis patients had maintained hemodialysis for 4 hours, 3 times a week for at least 3 months. The inclusion criteria for the healthy controls were as follows: (1) age between 30 and 80 years; (2) absence of history for cardiovascular diseases, hypertension, hyperlipidemia, and diabetes; (3) normal physical examination; and (4) normal electrocardiographic manifestations. The exclusion criteria for the participants with CKD were as follows: (1) history of known specific cardiomyopathies, valvular heart disease or myocarditis; and (2) standard contraindications to CMR (e.g., metal implants, severe claustrophobia, and inability to hold breath).
Participants with CKD were divided into the following three groups: group I (CKD stage 1–3 patients, eGFR 30 to 120 ml/min/1.73 m2; n = 23), group II (CKD stage 4–5 patients without undergoing HD, eGFR <30 ml/min/1.73 m2; n = 20), and group III (CKD stage 4–5 patients with stable HD; n = 41). The estimated GFR was calculated using the four-variable Modification of Diet in Renal Disease (MDRD) formula (15) (GFR = 175 × standardized S × age−0.203 × 1.212 [if black] × 0.742 [if female]). Additionally, group II (CKD 4–5 non-HD patients) had very advanced CKD as evident by creatinine >500, hemoglobin 79 and calcium 1.9.
We collected data regarding sex, age, BMI, and heart rate (HR) of all the study subjects. We also extracted the values of systolic blood pressure (SBP), diastolic blood pressure (DBP), and serum biochemical parameters such as creatinine, hemoglobin, albumin, alkaline phosphatase (AKP), parathyroid hormone (PTH), urea nitrogen, uric acid, erythrocyte sedimentation rate (ESR), thyroid-stimulating hormone (TSH), free triiodothyronine (FT3), free tetraiodothyronine (FT4), triglycerides (TG), total cholesterol (TC), lactate dehydrogenase (LDH), calcium, and phosphorus for all patients from the electronic records before CMR scanning (Table 1). Study subjects were diagnosed with hypertension when the average SBP value was >140 mmHg. BMI was calculated by dividing dry weight (kg) by body height (m)2.
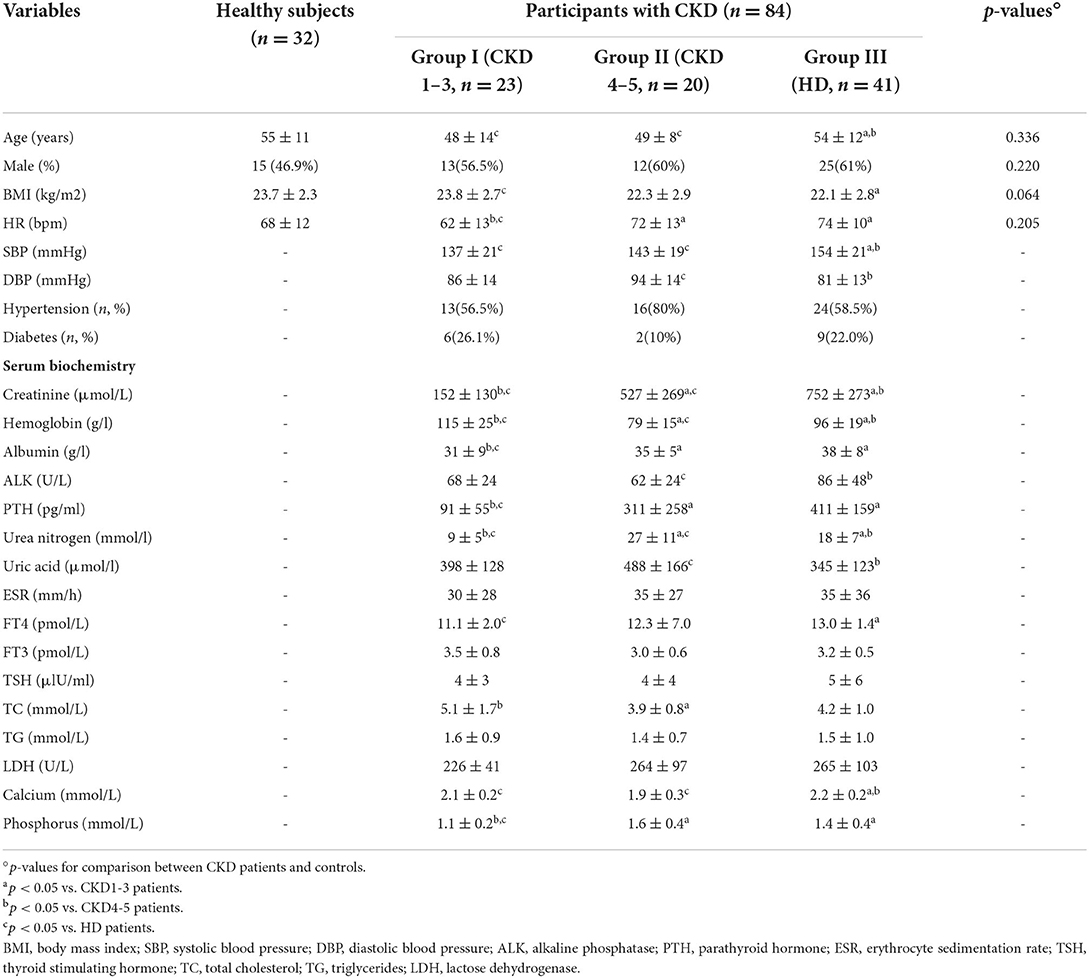
Table 1. Clinicopathologic characteristics of the study subjects.
The CMR scans were performed in a 1.5 T MAGNETOM Aera MRI scanner (Siemens Healthcare, Erlangen, Germany) equipped with 18-channel phased-array surface coils using the vector electrocardiogram gating. Participants with CKD were all scanned on the next day after confirmation of CKD by nephrologists. Dialysis patients were all scanned on non-dialysis days but not after a long break; thus, all scans were performed within 18 to 24 h after the most recent dialysis session (16). Cine imaging of the LV long axis and sequential short-axis planes was performed using the balanced steady-state free precession (SSFP) sequence. Cine imaging parameters were as follows: repetition time, 2.93 ms; echo time, 1.16 ms; slice thickness, 6 mm; flip angle, 80°; field of view, 340 × 255 mm; matrix, 256 × 205; and 25 calculated cardiac phases.
Native T1 mapping at the base, mid, and apical levels of the LV short axis were performed using the modified look-locker inversion recovery (MOLLI) sequence. The T1 mapping parameters were as follows: repetition time, 3.89 ms; echo time, 1.12 ms; slice thickness, 8 mm; flip angle, 35°; field of view, 360 × 270 mm; and matrix, 256 × 192. T2 values of the LV myocardium were estimated from the T2 map that was generated using the T2-prepared single-shot SSFP sequence. T2 mapping parameters were as follows: repetition time, 3.244 ms; echo time, 1.35 ms; slice thickness, 8 mm; flip angle, 70°; field of view, 360 × 75 mm; and matrix, 192 × 83.
CMR image analysis was performed using the commercially available CVI42 software (Circle Cardiovascular, Calgary, Canada), and the analyst were blinded to the CKD group of study populations. The volumetric and functional parameters of the left ventricle were measured using the continuous short-axis slice cine images by manually tracing the endocardial and epicardial borders. The papillary muscles and trabeculations were excluded as part of the ventricular mass. CMR parameters such as LV end-diastolic volumes index (EDVI), end-systolic volume index (ESVI), stroke volume index (SVI), ejection fraction (EF), LV mass index (LVMI) and cardiac index (CI) were measured by the commercial CVI42 software (Circle Cardiovascular, Calgary, Canada) automatically. The left atrial volume index (LAVI) was calculated manually by tracing the endocardial left atrial (LA) borders in the two long-axis cine images (2 and 4-chamber views). The values were adjusted for the body surface area using the Mosteller formula (2) (BSA (m2) = √ ((weight (kg) × height (cm)/3600)).
The regions of interest (ROIs) were manually delineated in the mid-layer of the myocardium among the basal, middle, and apical LV segments to measure native T1 and T2 values. Sixteen ROIs were drawn for each participant based on the American Heart Association 16-segment model (Figures 1A–F). The image artifacts and coronary artery were eliminated from the ROIs. The average native T1 and T2 values were calculated from the three short-axis slices.
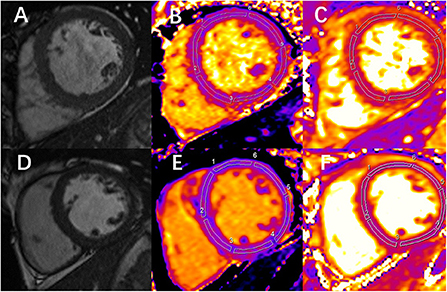
Figure 1. Examples of end-diastolic cine images and corresponding measurement of native T1 and T2 in 1 chronic kidney disease (CKD) patient and 1 healthy control. (A) Image shows the left ventricular middle short-axis segment. (B,C) Images are the measurement of native T1 and T2 mapping, respectively, at the same slice position in the same patient. (A-C) Images correspond to a 49-year-old CKD male patient. The mean global T1 value is 1,061 ms, and the mean global T2 value is 52 ms. (D) Image shows the left ventricular middle short-axis segment. (E,F) Images are the measurement of native T1 and T2 mapping, respectively, at the same slice position in the same person. (D-F) Images correspond to a 32-year-old healthy volunteer. The mean global T1 value is 1,003 ms, and the mean global T2 value is 45 ms.
The peak systolic LV strain parameters were calculated using the CVI42 software (Circle Cardiovascular, Calgary, Canada). Multiple long-axis cine images (2, 3, and 4-chamber views) and short-axis cine images were imported into the software. Then, the endocardial and epicardial borders of the LV were delineated in the end-diastolic frame (including papillary muscles and trabeculations) and automatically propagated throughout the cardiac cycle. The global longitudinal strain (GLS), global circumferential strain (GCS), and global radial strain (GRS) of the LV were obtained manually from the cine images (Figures 2A–I).
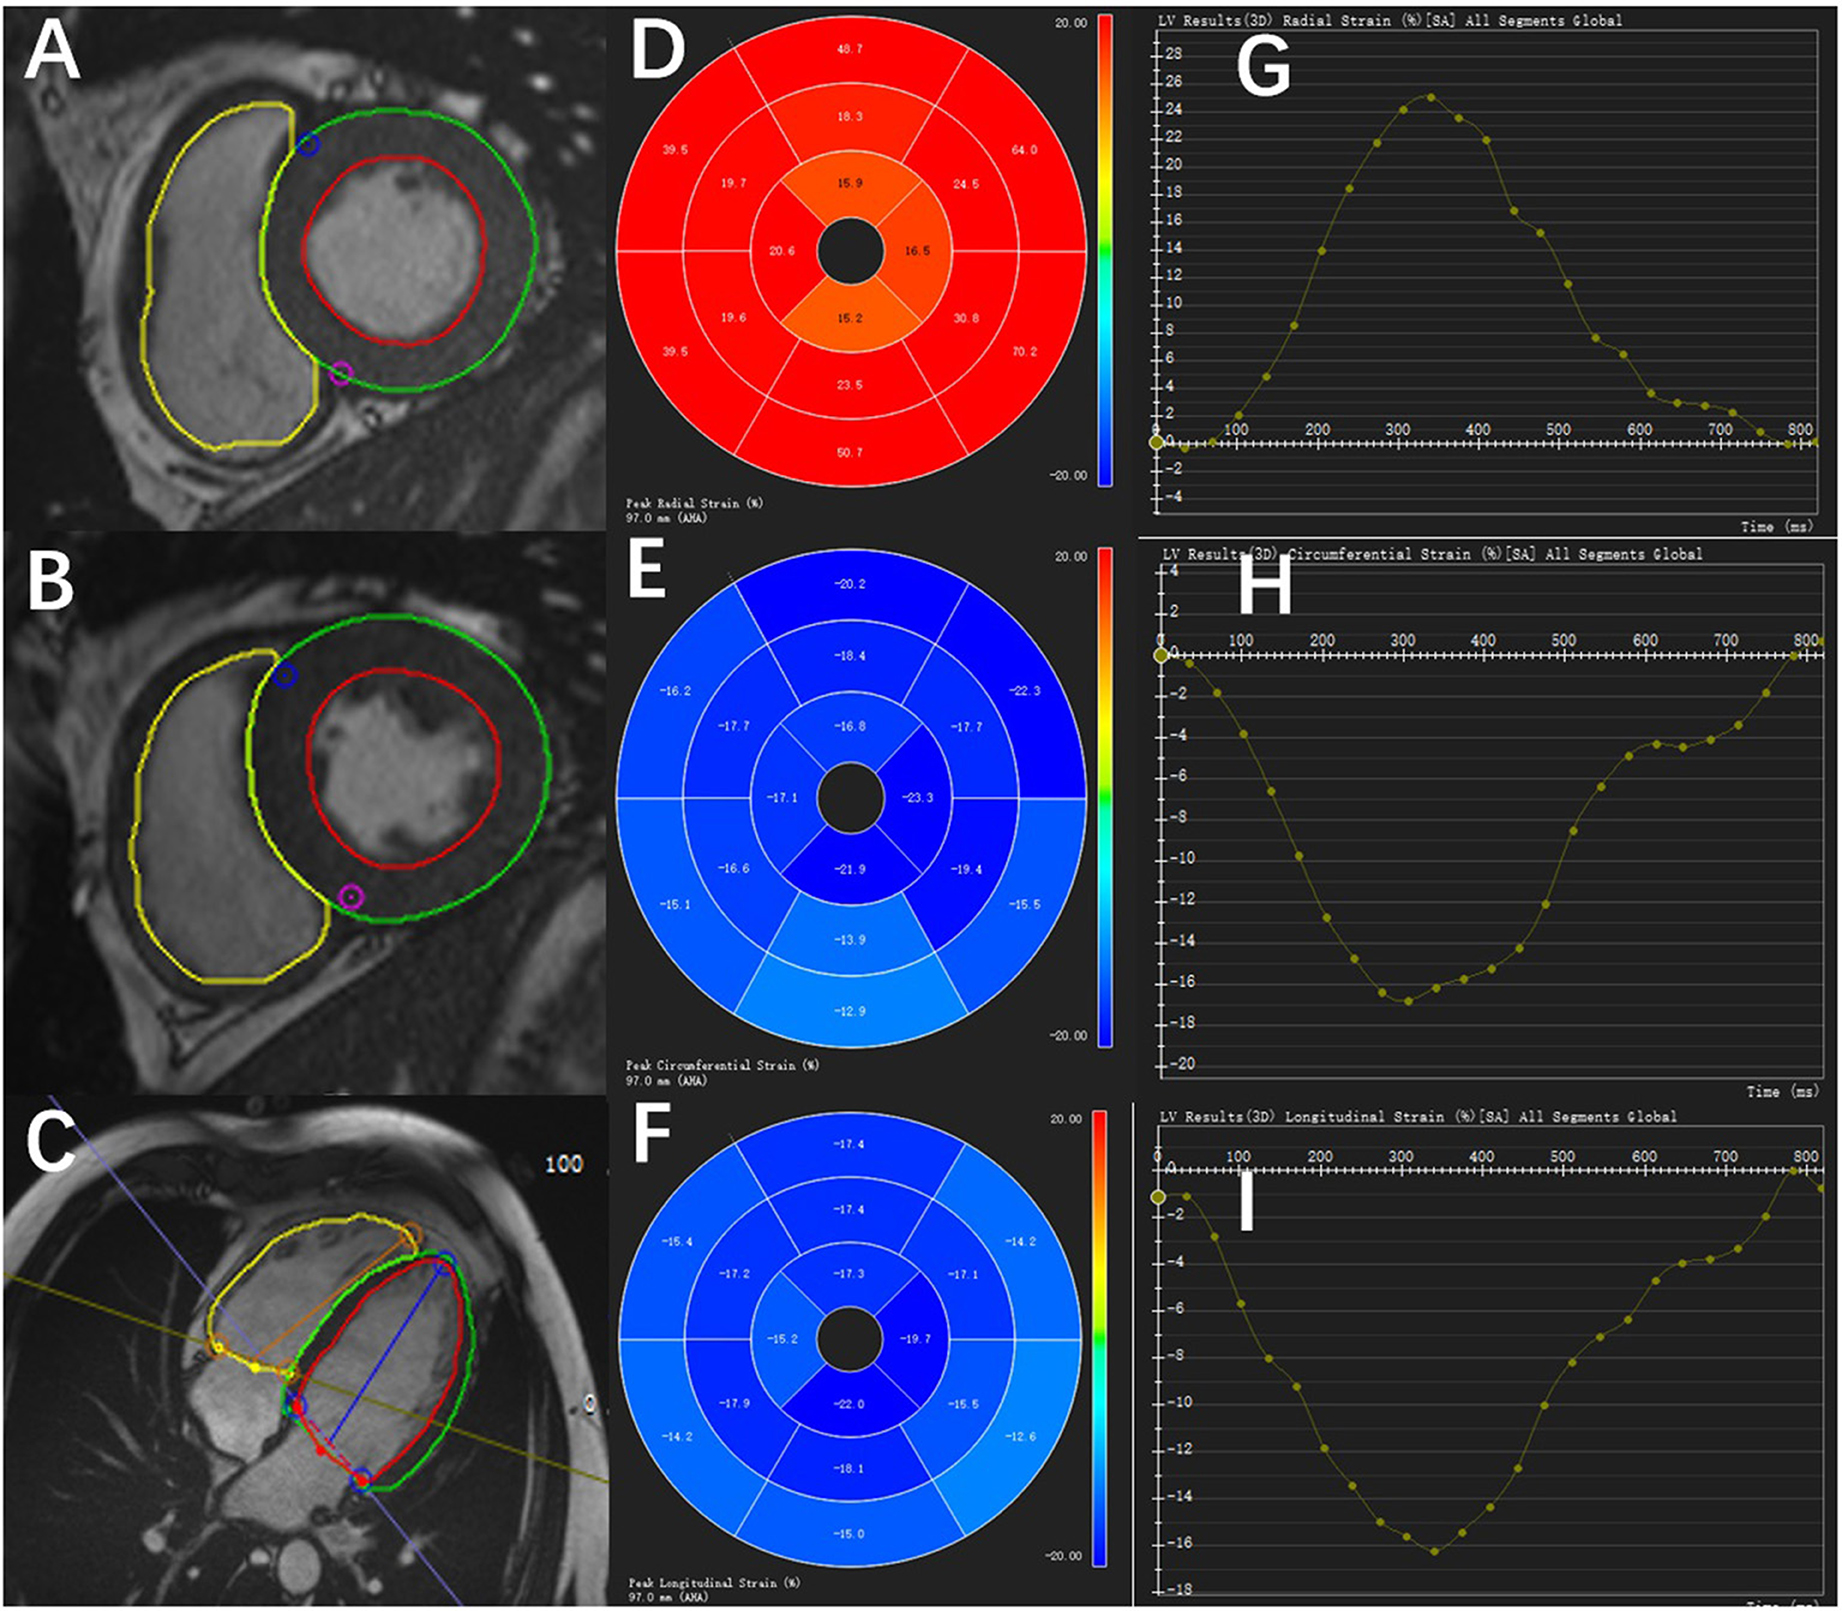
Figure 2. Diagram of the peak systolic strain analysis of the left ventricular myocardium in a healthy control by CVI42 software. The left shows the endocardial and epicardial borders of different short-axis slice cine images (A,B) and long-axis cine image (C). In the middle is the 16-segment model of the radial (D), circumferential (E), and longitudinal (F) values in a cardiac cycle. On the right are the strain–time curves of the radial (G), circumferential (H), and longitudinal (I) values in a cardiac cycle.
Statistical analysis was performed using the SPSS version 26.0 software (SPSS Inc., Chicago, Illinois, USA). Kolmogorov–Smirnov test was used to analyze the normal distribution of continuous data. The normally and non-normally distributed data were summarized as means ± standard deviation and median (interquartile range, IQR), respectively. Differences between the normally distributed variables were analyzed using the independent-sample Student's t-test. Differences between the categorical variables were analyzed using the chi-square test. Differences in the clinical and CMR parameters between the three CKD patient groups and healthy subjects were compared by analysis of variance (ANOVA). Differences in the CMR variables after adjusting for age, BMI, and HR were assessed by analysis of covariance (ANCOVA). The relationships between CMR parameters and CKD stages of CKD patients without hemodialysis were examined using Spearman's correlation tests. P-value < 0.05 (two-tailed) was considered statistically significant.
In this study, 84 participants with CKD and 32 healthy controls were enrolled. Table 1 shows the demographics of all the study subjects and the biochemical indices of the CKD patients. The basic characteristics including age (p = 0.336), sex (p = 0.220), BMI (p = 0.064) and HR (p = 0.205) were similar between the group of participants with CKD and healthy subjects. However, significant differences in age (p < 0.001), BMI (p = 0.023), and HR (p = 0.001) were observed among the healthy subjects and the three groups of participants with CKD, namely, CKD 1–3, CKD 4–5, and HD (Table 1). The healthy subjects did not show any history of cardiovascular diseases, hypertension, hyperlipidemia, and diabetes.
Table 2 shows the LV mass, volume, and functional characteristics for the three CKD groups (I-III) and the healthy subjects. Table 3 shows the LV mass, volume, and functional parameters for the CKD patients without HD (groups I and II) and the healthy subjects after adjusting for age, BMI, and HR. The CMR-derived parameters LVEDVI, LVSVI, LVMI, and CI values were significantly increased starting from later stages (LVEDVI: 80 vs. 57 ml/m2; LVSVI: 42 vs. 32 ml/m2; LVMI: 57 vs. 36 g/m2; CI: 2.9 vs. 2.2 l/min/m2, p < 0.05 between group II and healthy subjects for all). Furthermore, the CMR-derived parameters LVESVI, LVEF and maximum LAVI values never had significant change in patients without HD.
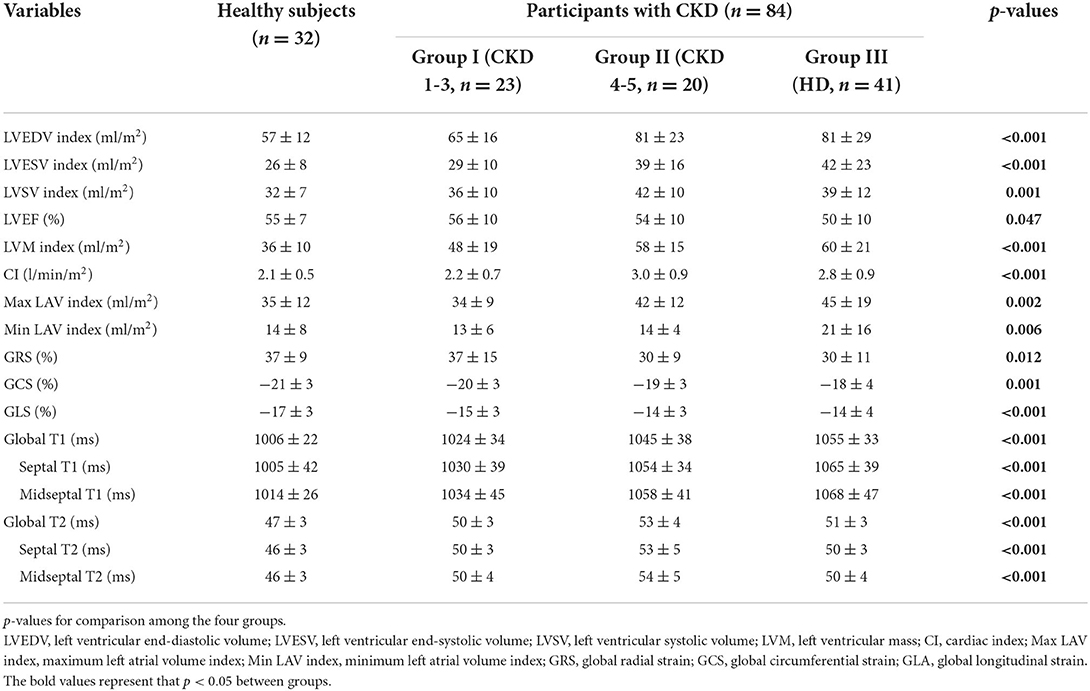
Table 2. MRI characteristics of the study subjects.
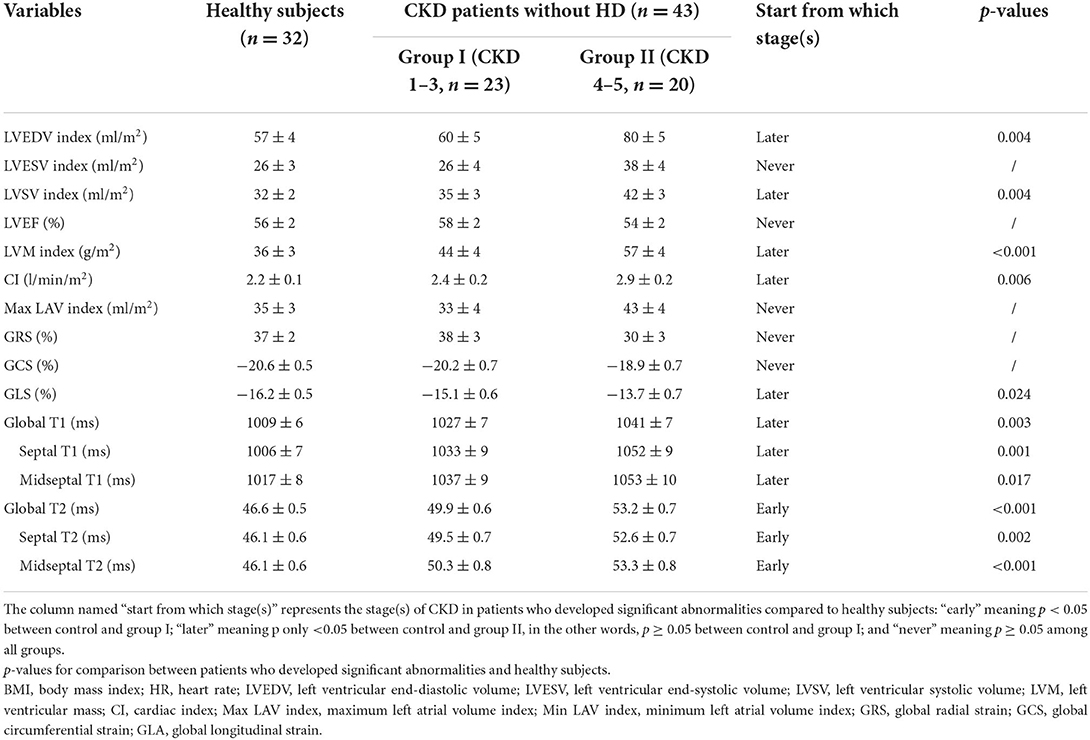
Table 3. MRI characteristics of the study subjects after adjustments for age, BMI, and HR.
Table 3 summarizes the values for the LV strain parameters in the three groups after adjusting for age, BMI, and HR. The CMR-derived parameters GRS and GCS never had significant change in patients without HD (Figures 3A,B). However, the CMR-derived parameter GLS values were significantly reduced starting from later stages (group II vs. healthy subjects: −13.7 ± 0.7 vs. −16.2 ± 0.5, p = 0.024) (Figure 3C).
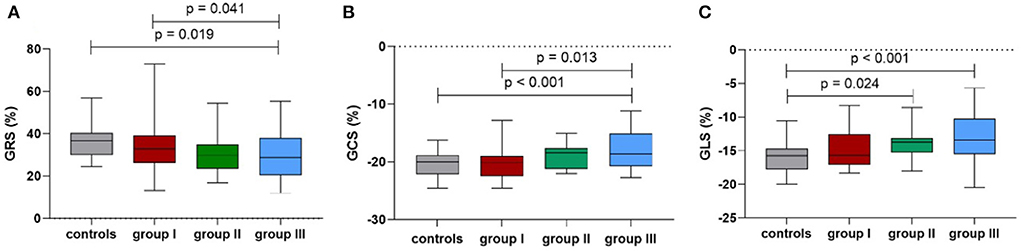
Figure 3. Comparison of the mean peak global radial strain (A), peak global circumferential strain (B) and peak global longitudinal strain (C) among the controls and groups I-III.
Table 3 shows the differences in the native T1 and T2 values between the three groups after adjusting for age, BMI, and HR. The global cardiac native T1 values were higher in the CKD groups compared with the healthy subjects; the values showed an incremental increase with CKD severity (healthy subjects: 1,009 ± 6; CKD group I: 1,027 ± 7; CKD group II: 1,041 ± 7). The CMR-derived parameter global native T1 values were significantly increased starting from later stages (group II vs. control: p = 0.003) (Figure 4A). Furthermore, the global T2 values were significantly increased starting from early stages (group I vs. healthy subjects: 49.9 ± 0.6 vs. 46.6 ± 0.5, p < 0.001) (Figure 4B). The septal and midseptal T1 and T2 values and the inter-group differences showed similar trends as observed with the global T1 and T2 values, respectively (Table 3).
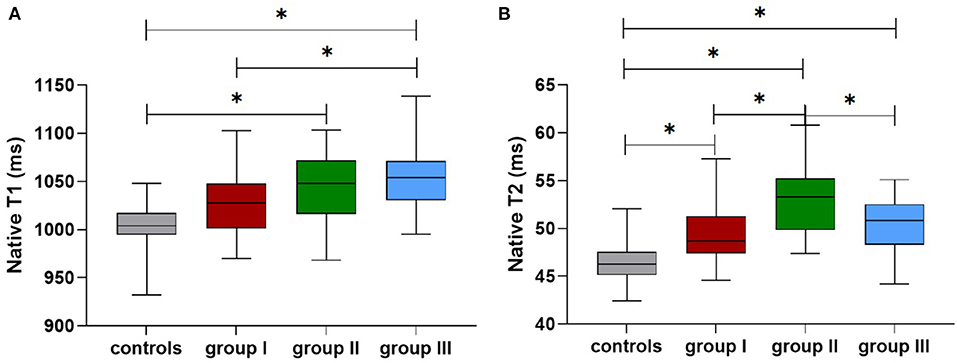
Figure 4. Comparison of the native T1 (A) and T2 values (B) among the controls and groups I-III (*means that p < 0.05 between the two groups).
As shown in Table 4, CKD stages showed inverse correlation with BMI (r = −0.246, p = 0.008) and positive correlation with HR (r = 0.29, p = 0.002). After adjusting for BMI and HR, CKD stages of patients without HD showed positive correlation with the LVEDVI (r = 0.425, p < 0.001), LVESVI (r = 0.405, p < 0.001), LVMI (r = 0.535, p < 0.001), CI (r = 0.293, p = 0.002), GLS (r = 0.436, p < 0.001), and GCS (r = 0.386, p < 0.001) (Figures 5A,B). Furthermore, CKD stages of patients without HD showed weak negative correlation with LVEF (r = −0.255, p = 0.006) and GRS (r = −0.32, p = 0.001) (Figure 5C). Furthermore, CKD stages of patients without HD showed significant positive correlation with the global native T1 (r = 0.5, p < 0.001) and T2 values (r = 0.467, p < 0.001) (Figures 5D,E).
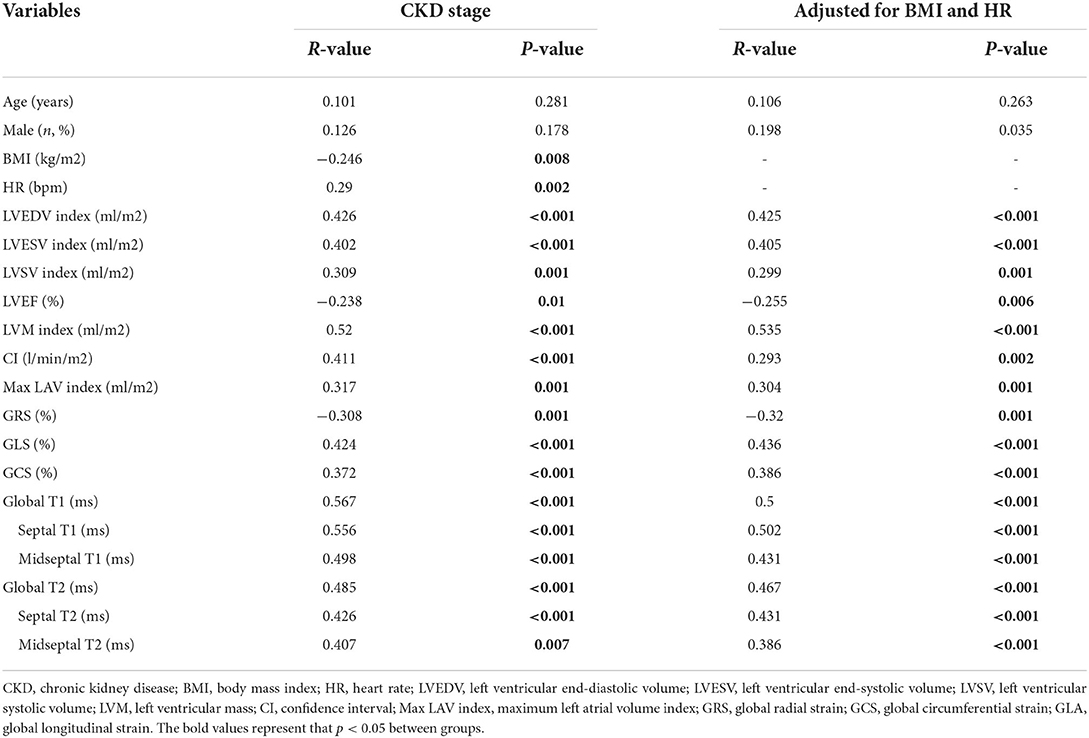
Table 4. Univariate correlation coefficients for worsening CKD stage.
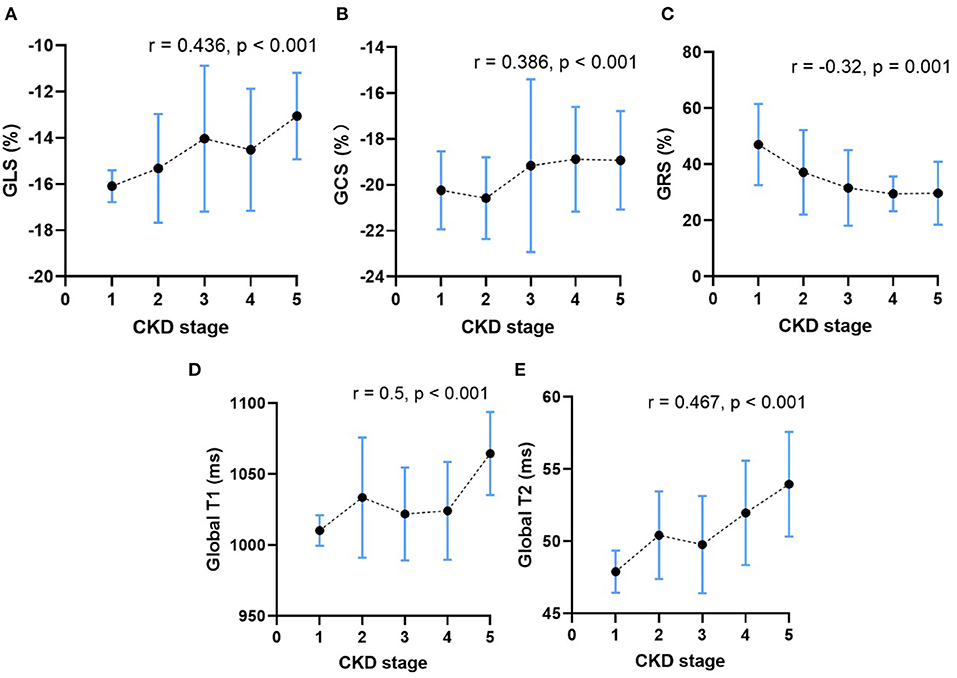
Figure 5. The relationship between CKD stage and the mean peak global radial strain (A), peak global circumferential strain (B), peak global longitudinal strain (C), the global native T1 values (D) and the global T2 values (E) in CKD patients without HD. The dots represent the mean CMR parameters of patients in each CKD stage, and the vertical bars represent the standard deviation range of CMR parameters of patients in each CKD stage. The dashed line represents the trends of change in CMR parameters.
Table 5 shows comparison of CMR parameters between HD patients and each other groups (healthy subjects, group I and group II). All CMR parameters in HD patients were significantly worse than those in healthy subjects. In addition, LVEF and LV strain parameters of HD patients were worse than those of CKD patients in group II (stages 4–5 without HD) (LVEF: 49 vs. 54%; GRS: 29 ± 2 vs. 30 ± 3; GCS: −17.4 ± 0.5 vs. −18.9 ± 0.7; GLS: −12.9 ± 0.5 vs. −13.7 ± 0.7), however, the above parameters comparison were not significant. Furthermore, the global native T1 values were higher in the HD patients compared with group II patients (1,053 ± 6 vs. 1,041 ± 7, p > 0.05). In contrast, T2 values in the HD patients were significantly lower compared with those non-HD patients with CKD stages 4-5 (50.1 ± 0.5 vs. 53.2 ± 0.7, p = 0.002) (Figures 4A,B). The septal and midseptal T1 and T2 values and the inter-group differences for these values were similar to the trends observed for the global T1 and T2 values, respectively.
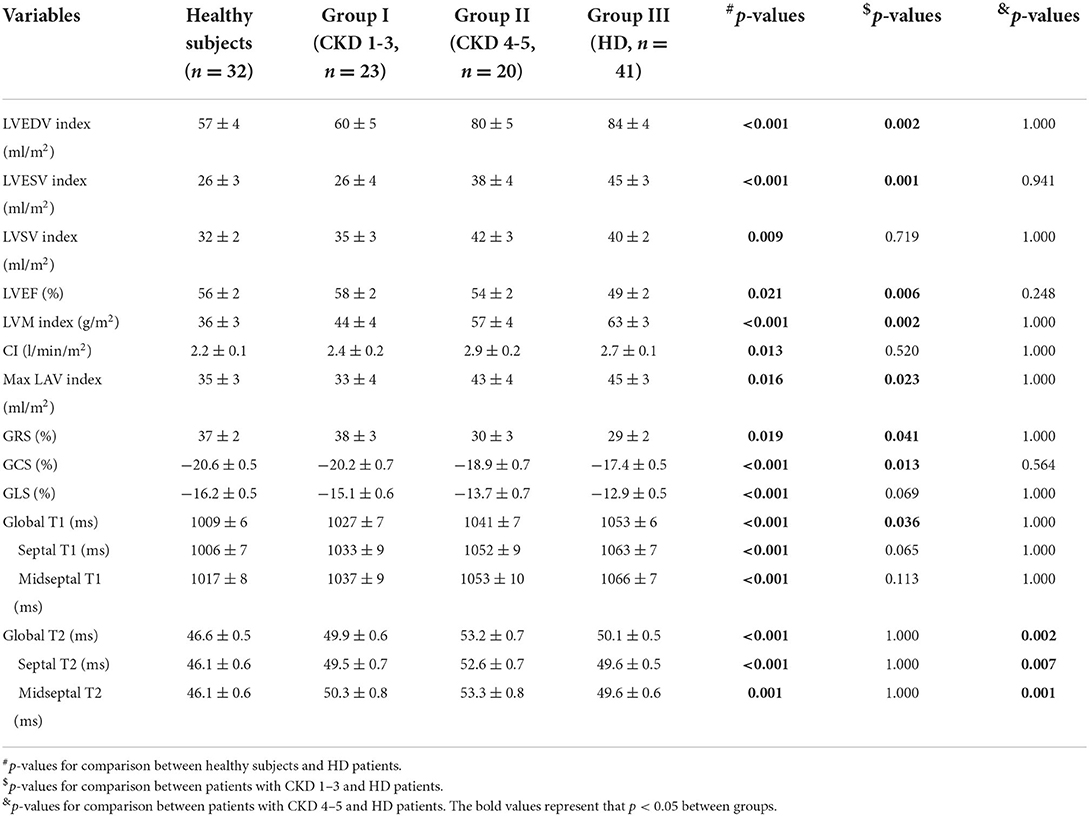
Table 5. Comparison of CMR characteristics between HD patients and each other groups after adjustments for age, BMI, and HR.
This study shows that CMR parameters reflecting LV myocardial structure and function get worsen with advancing CKD stages. Participants with CKD stages 4–5 were more likely to occur significantly increased T1 values, which may reflect myocardial fibrosis. The increased native T1 values and decreased T2 values of HD patients might be due to increasing myocardial fibrosis in the HD group but with reduction in oedema following effective fluid management on dialysis.
In this prospective study, changes in the myocardial strain parameters like GLS, GCS, and GRS were associated with advanced CKD stage. This suggested significant alterations in the myocardial wall remodeling among patients with advanced or severe CKD. Furthermore, this study showed that GLS of participants with CKD decreased significantly from stages 4–5 onwards when compared with the healthy subjects, whereas LVEF values were reduced in the CKD patients undergoing hemodialysis. These results were in agreement with previous reports demonstrating GLS as a more sensitive parameter than LVEF in detecting subclinical LV dysfunction because GLS directly measures the movement of myocardial fibers (9, 17). The prognostic value of GLS was also higher than the values for LVEF in predicting mortality and adverse cardiovascular outcomes (18, 19). Therefore, CKD patients with reduced GLS require close monitoring for early detection of cardiac abnormalities.
A previous report (9) suggested that aberrant GLS was secondary to myocyte hypertrophy caused by myocardial fibrosis. Our study shows higher native T1 and T2 values in CKD patients compared with healthy subjects, and increasing native T1 and T2 values with the advancing CKD stages, which are consistent with previous studies (8, 18). In addition, a negative correlation between T2 values and GFR was also found in patients with heart failure (20), supporting the finding of our trial. Other previous studies demonstrated that native T1 mapping improved the diagnostic accuracy of CMR in estimating myocardial fibrosis (16, 21). In addition, myocardial native T1 values were also associated with myocardial edema, infiltration of immune cells (22), acute myocardial infarction or amyloidosis (23). Participants enrolled in our study had no history of heart disease or amyloidosis, suggesting that the elevated T1 values in participants with advanced CKD were irrelevant to based heart disease or amyloidosis. However, we cannot rule out the effect of myocardial edema on the changes of T1 values. Native T2 mapping measures the free water content in tissues including the cardiac tissue (7). In current study, myocardial native T1 values and T2 values of CKD groups are higher than healthy subjects showing that myocardium of CKD patients may develop both fibrosis and oedema. Furthermore, our results demonstrate that CKD patients may develop worsening myocardial fibrosis and oedema with advancing CKD severity.
CKD progression facilitates the onset of myocardial fibrosis (24). However, the exact CKD stage at which myocardial fibrosis is clinically manifest is not well-characterized. In the current study, participants with CKD stages 4–5 showed significantly higher native T1 and T2 values compared with healthy subjects. These results supported previous biopsy findings from ESRD patients that showed extensive interstitial fibrosis (25, 26). Edwards et al. (11) reported irreversible fibrosis in 14% of stage 2 to 4 CKD patients using late gadolinium enhancement (LGE). These slightly different results may be explainable by differences in sample size and their use of gadolinium. LGE is not sensitive enough to detect diffuse myocardial fibrosis (24) and has risk of nephrogenic systemic fibrosis (27). Our results suggested that participants with CKD stages 4–5 were more likely to develop significant myocardial fibrosis. However, further investigations and more sensitive magnetic resonance imaging (MRI) techniques are needed to determine if myocardial fibrosis occurs in patients with early CKD.
In our study, participants with CKD undergoing HD showed significantly reduced T2 values compared with non-HD patients with CKD stages 4–5. Previous studies reported that T2 values were related to myocardial fluid content (28–30). Our results showed that myocardial oedema may be improved in ESRD patients undergoing HD compared with non-HD patients with advanced CKD, thereby supporting previous findings (7, 31). Kotecha et al. (7) showed that native T1 and T2 values were significantly reduced in ESRD patients after dialysis, suggesting that these values reflected an acute reduction of myocardial water content. Rankin et al. (31) also showed significant decrease in native T1 and T2 values following hemodialysis with fluid removal in CKD patients undergoing HD based on 3T CMR. However, the changes of T1 values in our current study may seem contradictory to these two studies. The reason for this difference may be that Kotecha and Rankin et al. referred to within-subject differences pre/post HD. T1 values of participants with CKD undergoing HD in this study increased slightly than non-HD patients with CKD stages 4–5. This suggested that for CKD patients undergoing HD, myocardial fibrosis, rather than myocardial oedema, accounts for the elevated T1 values. Similarly, Graham-Brown et. compared 124 HD patients to 137 healthy subjects and found that the obviously elevated T1 values occurred independently with T2 values, which had no significant changes. It is reasonable to speculate that the observed increase in native T1 values and decrease in T2 values between CKD 4–5 and HD patients might be due to increasing fibrosis in the dialysis group but with reduction in oedema following effective fluid management on dialysis. However, our study did not compare native T1 values of CKD patients before and after dialysis. Hence, this aspect requires further investigation.
Our study has a few limitations. Firstly, the sample size of our single-center study was small. It was difficult to stratify patients into CKD 1-5 stage and directly state which stage of 1-5 shows the significant reduction in myocardial function. Therefore, large cohort, multi-center studies are necessary to confirm our findings and explore potential relationships between myocardial abnormalities and CKD stages. Secondly, the cross-sectional nature of this study may have affected the results because of individual differences among the study subjects. We did not compare parameters of participants with CKD before and after dialysis. Therefore, in the future, a longitudinal study needs to be performed to confirm our results. Thirdly, although the CKD groups were matched with the healthy subjects based on age, BMI, and HR, significant inter-group differences existed among the four groups. Therefore, we used ANCOVA to exclude the influence of these confounding factors. Forthly, there was a lack of assessment of myocardial fibrosis and fluid status, either clinically or bioimpedance. Finally, because of the small sample size, we did not investigate the effects of important factors such as hypertension and diabetes that can influence cardiac functions.
In conclusion, myocardial strain, native T1, and T2 values progressively got worse as the severity of CKD increased. Myocardial fibrosis and edema were observed more frequently in participants with advanced CKD or severe CKD requiring HD. The increased native T1 values and decreased T2 values of CKD patients undergoing HD might be due to increasing myocardial fibrosis in the HD group but with reduction in oedema following effective fluid management on dialysis. Further large cohort multi-center studies are needed to confirm our findings.
The raw data supporting the conclusions of this article will be made available by the authors, without undue reservation.
The studies involving human participants were reviewed and approved by the Ethics Committee of the Tongji Medical College of Huazhong University of Science and Technology. The patients/participants provided their written informed consent to participate in this study.
XJ, XH, and YC conceived and designed the study. YC and HS provided the administrative support. YW, FH, and CZ provided study materials and patients. XJ, XH, and YZ collected and assembled data of the study. XJ and XH analyzed and interpreted the study data. All authors read and approved the final version of the manuscript.
We thank all supporting staff for the dedicated hard work. We are also very grateful to all the selfless volunteers who participated in our study.
Author XZ was employed by MR Collaborations, Siemens Healthineers Digital Technology (Shanghai) Co., Ltd., Shanghai, China.
The remaining authors declare that the research was conducted in the absence of any commercial or financial relationships that could be construed as a potential conflict of interest.
All claims expressed in this article are solely those of the authors and do not necessarily represent those of their affiliated organizations, or those of the publisher, the editors and the reviewers. Any product that may be evaluated in this article, or claim that may be made by its manufacturer, is not guaranteed or endorsed by the publisher.
CKD, chronic kidney disease; CMR, cardiac magnetic resonance; ANCOVA, analysis of covariance; LVEF, left ventricular ejection fraction; GRS, global radial strain; GCS, global circumferential strain; GLS, global longitudinal strain; CVD, cardiovascular disease; eGFRs, estimated glomerular filtration rates; HD, hemodialysis; LV, left ventricular; ESRD, end-stage renal disease; BMI, body mass index; MDRD, Modification of Diet in Renal Disease; HR, heart rate; SBP, systolic blood pressure; DBP, diastolic blood pressure; AKP, alkaline phosphatase; PTH, parathyroid hormone; ESR, erythrocyte sedimentation rate; TSH, thyroid-stimulating hormone; FT3, free triiodothyronine; FT4, free tetraiodothyronine; TG, triglycerides; TC, total cholesterol; LDH, lactate dehydrogenase; SSFP, steady-state free precession; MOLLI, modified look-locker inversion recovery; EDVI, end-diastolic volumes index; ESVI, end-systolic volume index; SVI, stroke volume index; EF, ejection fraction; LVMI, LV mass index; CI, cardiac index; LAVI, The left atrial volume index; LA, left atrial; BSA, body surface area; ROIs, the regions of interest; IQR, interquartile range; ANOVA, analysis of variance; LGE, late gadolinium enhancement; MRI, magnetic resonance imaging.
1. Collaboration GBDCKD. Global, regional, and national burden of chronic kidney disease, 1990-2017: a systematic analysis for the global burden of disease study 2017. Lancet. (2020) 395:709–33. doi: 10.1016/S0140-6736(20)30045-3
2. McQuarrie EP, Patel RK, Mark PB, Delles C, Connell J, Dargie HJ, et al. Association between proteinuria and left ventricular mass index: a cardiac MRI study in patients with chronic kidney disease. Nephrol Dial Transplant. (2011) 26:933–8. doi: 10.1093/ndt/gfq418
3. Reiss AB, Miyawaki N, Moon J, Kasselman LJ, Voloshyna I, D'Avino R Jr, et al. CKD, arterial calcification, atherosclerosis and bone health: Inter-relationships and controversies. Atherosclerosis. (2018) 278:49–59. doi: 10.1016/j.atherosclerosis.2018.08.046
4. Vallianou NG, Mitesh S, Gkogkou A, Geladari E. Chronic kidney disease and cardiovascular disease: is there any relationship? Curr Cardiol Rev. (2019) 15:55–63. doi: 10.2174/1573403X14666180711124825
5. Izumaru K, Hata J, Nakano T, Nakashima Y, Nagata M, Fukuhara M, et al. Reduced estimated GFR and cardiac remodeling: a population-based autopsy study. Am J Kidney Dis. (2019) 74:373–81. doi: 10.1053/j.ajkd.2019.02.013
6. Gansevoort RT, Correa-Rotter R, Hemmelgarn BR, Jafar TH, Heerspink HJ, Mann JF, et al. Chronic kidney disease and cardiovascular risk: epidemiology, mechanisms, and prevention. Lancet. (2013) 382:339–52. doi: 10.1016/S0140-6736(13)60595-4
7. Kotecha T, Martinez-Naharro A, Yoowannakul S, Lambe T, Rezk T, Knight DS, et al. Acute changes in cardiac structural and tissue characterisation parameters following haemodialysis measured using cardiovascular magnetic resonance. Sci Rep. (2019) 9:1388. doi: 10.1038/s41598-018-37845-4
8. Arcari L, Engel J, Freiwald T, Zhou H, Zainal H, Gawor M, et al. Cardiac biomarkers in chronic kidney disease are independently associated with myocardial edema and diffuse fibrosis by cardiovascular magnetic resonance. J Cardiovasc Magn Reson. (2021) 23:71. doi: 10.1186/s12968-021-00762-z
9. Gong IY, Al-Amro B, Prasad GVR, Connelly PW, Wald RM, Wald R, et al. Cardiovascular magnetic resonance left ventricular strain in end-stage renal disease patients after kidney transplantation. J Cardiovasc Magn Reson. (2018) 20:83. doi: 10.1186/s12968-018-0504-5
10. Chen M, Arcari L, Engel J, Freiwald T, Platschek S, Zhou H, et al. Aortic stiffness is independently associated with interstitial myocardial fibrosis by native T1 and accelerated in the presence of chronic kidney disease. Int J Cardiol Heart Vascul. (2019) 24:100389. doi: 10.1016/j.ijcha.2019.100389
11. Edwards NC, Moody WE, Yuan M, Hayer MK, Ferro CJ, Townend JN, et al. Diffuse interstitial fibrosis and myocardial dysfunction in early chronic kidney disease. Am J Cardiol. (2015) 115:1311–7. doi: 10.1016/j.amjcard.2015.02.015
12. Hayer MK, Radhakrishnan A, Price AM, Liu B, Baig S, Weston CJ, et al. Defining Myocardial Abnormalities Across the Stages of Chronic Kidney Disease: A Cardiac Magnetic Resonance Imaging Study. JACC Cardiovasc Imaging. (2020) 13:2357–67. doi: 10.1016/j.jcmg.2020.04.021
13. Arcari L, Ciavarella GM, Altieri S, Limite LR, Russo D, Luciani M, et al. Longitudinal changes of left and right cardiac structure and function in patients with end-stage renal disease on replacement therapy. Eur J Intern Med. (2020) 78:95–100. doi: 10.1016/j.ejim.2020.04.051
14. Rutherford E, Mangion K, McComb C, Bell E, Cockburn S, Talle M, et al. Myocardial changes in incident haemodialysis patients over 6-months: an observational cardiac magnetic resonance imaging study. Sci Rep. (2017) 7:13976. doi: 10.1038/s41598-017-14481-y
15. Levey AS, Coresh J, Greene T, Stevens LA, Zhang YL, Hendriksen S, et al. Using standardized serum creatinine values in the modification of diet in renal disease study equation for estimating glomerular filtration rate. Ann Intern Med. (2006) 145:247–54. doi: 10.7326/0003-4819-145-4-200608150-00004
16. Graham-Brown MP, March DS, Churchward DR, Stensel DJ, Singh A, Arnold R, et al. Novel cardiac nuclear magnetic resonance method for noninvasive assessment of myocardial fibrosis in hemodialysis patients. Kidney Int. (2016) 90:835–44. doi: 10.1016/j.kint.2016.07.014
17. Kalam K, Otahal P, Marwick TH. Prognostic implications of global LV dysfunction: a systematic review and meta-analysis of global longitudinal strain and ejection fraction. Heart. (2014) 100:1673–80. doi: 10.1136/heartjnl-2014-305538
18. Hayer MK, Price AM, Liu B, Baig S, Ferro CJ, Townend JN, et al. Diffuse myocardial interstitial fibrosis and dysfunction in early chronic kidney disease. Am J Cardiol. (2018) 121:656–60. doi: 10.1016/j.amjcard.2017.11.041
19. Stanton T, Ingul CB, Hare JL, Leano R, Marwick TH. Association of myocardial deformation with mortality independent of myocardial ischemia and left ventricular hypertrophy. JACC Cardiovasc Imaging. (2009) 2:793–801. doi: 10.1016/j.jcmg.2009.02.014
20. Doeblin P, Hashemi D, Tanacli R, Lapinskas T, Gebker R, Stehning C, et al. CMR Tissue characterization in patients with HFmrEF. J Clin Med. (2019) 8:1877. doi: 10.3390/jcm8111877
21. Mewton N, Liu CY, Croisille P, Bluemke D, Lima JA. Assessment of myocardial fibrosis with cardiovascular magnetic resonance. J Am Coll Cardiol. (2011) 57:891–903. doi: 10.1016/j.jacc.2010.11.013
22. Puntmann VO, Valbuena S, Hinojar R, Petersen SE, Greenwood JP, Kramer CM, et al. Society for cardiovascular magnetic resonance (SCMR) expert consensus for CMR imaging endpoints in clinical research: part I - analytical validation and clinical qualification. J Cardiovasc Magn Reson. (2018) 20:67. doi: 10.1186/s12968-018-0484-5
23. Karamitsos TD, Piechnik SK, Banypersad SM, Fontana M, Ntusi NB, Ferreira VM, et al. Noncontrast T1 mapping for the diagnosis of cardiac amyloidosis. JACC Cardiovasc Imaging. (2013) 6:488–97. doi: 10.1016/j.jcmg.2012.11.013
24. Kis E, Ablonczy L, Reusz GS. Cardiac magnetic resonance imaging of the myocardium in chronic kidney disease. Kidney Blood Press Res. (2018) 43:134–42. doi: 10.1159/000487367
25. Aoki J, Ikari Y, Nakajima H, Mori M, Sugimoto T, Hatori M, et al. Clinical and pathologic characteristics of dilated cardiomyopathy in hemodialysis patients. Kidney Int. (2005) 67:333–40. doi: 10.1111/j.1523-1755.2005.00086.x
26. Mall G, Huther W, Schneider J, Lundin P, Ritz E. Diffuse intermyocardiocytic fibrosis in uraemic patients. Nephrology, dialysis, transplantation: official publication of the European dialysis and transplant association. Eu Renal Assoc. (1990) 5:39–44. doi: 10.1093/ndt/5.1.39
27. Kribben A, Witzke O, Hillen U, Barkhausen J, Daul AE, Erbel R. Nephrogenic systemic fibrosis: pathogenesis, diagnosis, and therapy. J Am Coll Cardiol. (2009) 53:1621–8. doi: 10.1016/j.jacc.2008.12.061
28. Arcari L, Hinojar R, Engel J, Freiwald T, Platschek S, Zainal H, et al. Native T1 and T2 provide distinctive signatures in hypertrophic cardiac conditions - Comparison of uremic, hypertensive and hypertrophic cardiomyopathy. Int J Cardiol. (2020) 306:102–8. doi: 10.1016/j.ijcard.2020.03.002
29. Puntmann VO, Peker E, Chandrashekhar Y, Nagel E. T1 Mapping in characterizing myocardial disease: a comprehensive review. Circ Res. (2016) 119:277–99. doi: 10.1161/CIRCRESAHA.116.307974
30. Child N, Suna G, Dabir D, Yap ML, Rogers T, Kathirgamanathan M, et al. Comparison of MOLLI, shMOLLLI, and SASHA in discrimination between health and disease and relationship with histologically derived collagen volume fraction. Eur Heart J Cardiovasc Imaging. (2018) 19:768–76. doi: 10.1093/ehjci/jex309
Keywords: chronic kidney disease, cardiac magnetic resonance, hemodialysis, myocardial abnormalities, fibrosis, oedema
Citation: Jia X, Han X, Wang Y, He F, Zhou X, Zheng Y, Guo Y, Xu R, Liu J, Li Y, Gu J, Cao Y, Zhang C and Shi H (2022) Cardiac magnetic resonance imaging parameters show association between myocardial abnormalities and severity of chronic kidney disease. Front. Cardiovasc. Med. 9:1053122. doi: 10.3389/fcvm.2022.1053122
Received: 25 September 2022; Accepted: 02 November 2022;
Published: 17 November 2022.
Edited by:
Xiang Li, Massachusetts General Hospital and Harvard Medical School, United StatesReviewed by:
Zhennong Chen, Massachusetts General Hospital and Harvard Medical School, United StatesCopyright © 2022 Jia, Han, Wang, He, Zhou, Zheng, Guo, Xu, Liu, Li, Gu, Cao, Zhang and Shi. This is an open-access article distributed under the terms of the Creative Commons Attribution License (CC BY). The use, distribution or reproduction in other forums is permitted, provided the original author(s) and the copyright owner(s) are credited and that the original publication in this journal is cited, in accordance with accepted academic practice. No use, distribution or reproduction is permitted which does not comply with these terms.
*Correspondence: Yukun Cao, ODA0NDIzMzcyQHFxLmNvbQ==; Chun Zhang, ZHJ6aGFuZ2NodW5AMTI2LmNvbQ==; Heshui Shi, aGVzaHVpc2hpQGh1c3QuZWR1LmNu
†These authors have contributed equally to this work and share first authorship
Disclaimer: All claims expressed in this article are solely those of the authors and do not necessarily represent those of their affiliated organizations, or those of the publisher, the editors and the reviewers. Any product that may be evaluated in this article or claim that may be made by its manufacturer is not guaranteed or endorsed by the publisher.
Research integrity at Frontiers
Learn more about the work of our research integrity team to safeguard the quality of each article we publish.