
94% of researchers rate our articles as excellent or good
Learn more about the work of our research integrity team to safeguard the quality of each article we publish.
Find out more
ORIGINAL RESEARCH article
Front. Cardiovasc. Med. , 11 November 2022
Sec. Coronary Artery Disease
Volume 9 - 2022 | https://doi.org/10.3389/fcvm.2022.1016081
 Zheng Liu1,2†
 Lei Wang3†Qichang Xing1,2†Xiang Liu1,2Yixiang Hu1,2Wencan Li1,2Qingzi Yan1,2
 Renzhu Liu1,2Nan Huang1*
Acute myocardial infarction (AMI) has the characteristics of sudden onset, rapid progression, poor prognosis, and so on. Therefore, it is urgent to identify diagnostic and prognostic biomarkers for it. Cuproptosis is a new form of mitochondrial respiratory-dependent cell death. However, studies are limited on the clinical significance of cuproptosis-related genes (CRGs) in AMI. In this study, we systematically assessed the genetic alterations of CRGs in AMI by bioinformatics approach. The results showed that six CRGs (LIAS, LIPT1, DLAT, PDHB, MTF1, and GLS) were markedly differentially expressed between stable coronary heart disease (stable_CAD) and AMI. Correlation analysis indicated that CRGs were closely correlated with N6-methyladenosine (m6A)-related genes through R language “corrplot” package, especially GLS was positively correlated with FMR1 and MTF1 was negatively correlated with HNRNPA2B1. Immune landscape analysis results revealed that CRGs were closely related to various immune cells, especially GLS was positively correlated with T cells CD4 memory resting and negatively correlated with monocytes. Kaplan–Meier analysis demonstrated that the group with high DLAT expression had a better prognosis. The area under curve (AUC) certified that GLS had good diagnostic value, in the training set (AUC = 0.87) and verification set (ACU = 0.99). Gene set enrichment analysis (GSEA) suggested that GLS was associated with immune- and hypoxia-related pathways. In addition, Gene Ontology (GO) analysis, Kyoto Encyclopedia of Genes and Genomes (KEGG) analysis, competing endogenous RNA (ceRNA) analysis, transcription factor (TF), and compound prediction were performed to reveal the regulatory mechanism of CRGs in AMI. Overall, our study can provide additional information for understanding the role of CRGs in AMI, which may provide new insights into the identification of therapeutic targets for AMI.
Acute myocardial infarction (AMI) is a cardiovascular disease which not only endangers human health but also endangers human life (1). In recent decades, with the increase in evidence-based therapy and lifestyle interventions, the incidence of coronary heart disease has declined significantly (2). Nevertheless, AMI still seriously threatens to global health, affecting more than seven million people worldwide each year. Notably, while the incidence of AMI declined in older patients, there was no similar reduction in younger patients (3). Patients with AMI may typically have persistent chest pain, or persistent shortness of breath, sweating, nausea, unexplained weakness, or a combination of these symptoms (4). The current therapy strategy for AMI is to restore coronary blood flow (reperfusion) through implantation of endovascular stents (4), although clinical reperfusion therapy can protect the heart from further damage and enhance the risk of short-term and long-term heart failure caused by AMI, which presents treatment challenges (5). The identification of AMI biomarkers will play an important role in early diagnosis.
Acute myocardial infarction is one of the progressive outcomes of atherosclerosis (6). The destruction of the intima of the vessel results in lipid accumulation, accompanied by a large number of immune cell infiltration (7). Inflammatory factors produced by immune cells stimulate the proliferation and migration of smooth muscle cells into the intima (8–10). Progressively, fibrous caps, principally composed of calcified smooth muscle, form in distinct microenvironments (11, 12). In addition, necrotizing cells appear in the plaque area as immune cells continue to infiltrate (13). A large number of necrotic cells lead to a thinning of the fibrous cap, which in turn lead to plaque instability. Plaque ruptures can cause coronary artery thrombosis, which triggers AMI (14). At the same time, cardiomyocyte necrosis occurs in the area of obstruction due to hypoxia, leading to life-threatening cardiovascular events.
Copper can coordinate a variety of cellular biological processes, such as lipolysis, cell proliferation, autophagy, and neural activity (15). Interference of copper dynamic equilibrium leads to Menkes and Wilson disease (16). Noteworthy, Tsvetkov and colleagues demonstrated that a novel copper-dependent mode of cell death is independent of apoptosis, pyroptosis, and ferroptosis (17). Mitochondrial stress, characterized by excessive accumulation of lipoylated mitochondrial enzymes and depletion of Fe-S cluster proteins, has been reported to be the main mechanism leading to cuproptosis. Cupric ions can be reduced to cuprous ions by FDX1 within the mitochondrial matrix, which in turn promotes the lipoacylation of mitochondrial proteins and the overproduction of key enzymes associated with the mitochondrial tricarboxylic acid (TCA) cycle. In addition, key genes related to cupric ions transport may play an important role in regulating the occurrence of copper poisoning (17, 18). Furthermore, copper death participates in the regulation of aseptic inflammation, thereby affecting the immune microenvironment of the lesion (19). More and more evidence indicates that mitochondrial dysfunction and immune regulation are involved in the development of AMI. Therefore, we hypothesized that cuproptosis may be involved in the regulation of AMI (20, 21), but the role of CRGs in AMI is unclear. In this research, the diagnostic and prognostic values of CRGs in AMI were analyzed by bioinformatics methods, and the correlation of these genes with m6A and immune infiltration was discussed.
The data sets were from the Gene Expression Omnibus database1 (GEO). GSE59867 (22) was used to analyze the differences of CRGs and construct diagnostic model as a training set, including 111 patients with AMI and 46 control patients with stable_CAD and without history of AMI (Table 1). GSE62646 (23) was the validation set of the diagnostic model (Table 1). GSE21545 (24) was employed to explore the prognostic value of CRGs after AMI, including 76 patients without an ischemic event and 21 patients with an ischemic event (Table 1). The CRGs were extracted from previously published articles (17), while “LDL” was deleted because there were no related data in the above data sets. GSE184073 (25), a single-cell RNA sequence of human coronary plaque, was obtained from the GEO database to analyze the expression of GLS in single cells.
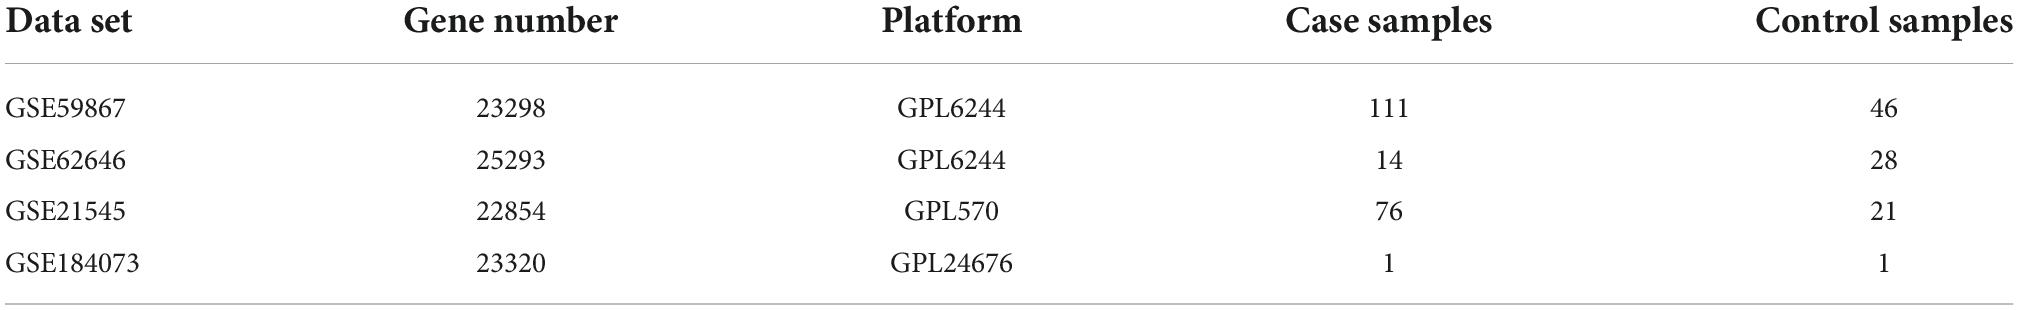
Table 1. Data sets implemented for analysis.
The PPI network was constructed through the STRING database2 (26). The correlation of CRGs was analyzed by the “corrplot” package (R v4.1.2).
Cuproptosis-related genes were executed GO analysis and KEGG pathway analysis through the “clusterProfiler 4.0” package (27), and the top 10 results were visualized by R 4.1.2 software.
The differential expression of m6A-related genes was investigated between the stable_CAD and AMI groups by the Wilcoxon test. P < 0.05 was considered as a statistically significant difference. The correlation was analyzed by the “corrplot” package between CRGs and m6A-related genes.
The cell-type identification by estimating relative subsets of RNA transcripts (CIBERSORT) was used to calculate the abundance of particular infiltrating immunocytes, which is an R/web version tool for deconvolution of expression matrices of human immune cell subtypes, based on linear support vector regression (28). The differential abundance of immune cell infiltration was investigated between the stable_CAD and AMI groups by the Wilcoxon test. P < 0.05 was considered as a statistically significant difference. The correlation between CRGs and immune cell infiltration was calculated by the Pearson correlation coefficient.
NetworkAnalyst3 has been developed as a comprehensive gene-centric platform supporting gene expression profiling analysis, biological network analysis, and visual exploration (29). In our study, it was utilized for ceRNA network construction, TF analysis, and tiny molecule identification of CRGs.
GSE21545 was employed to analyze the prognostic value of CRGs after AMI by Kaplan–Meier curves, and log-rank P < 0.05 indicated a significant difference between the two groups. Univariate and multivariate logistic regression combined with Lasso regression analyses were used to evaluate the diagnostic value of CRGs by R language “survival” and “glmnet” packages based on the GSE59867 data set. The diagnostic value of GLS expression in AMI patients was evaluated by the receiver operating characteristic (ROC) curve using “plotROC” package by R language. Finally, the expression of GLS was verified in the GSE62646 data set.
The GSEA was analyzed based on GLS expression by the “clusterProfiler 4.0” package (R v4.1.2) between the high and low expression groups. P < 0.05 indicated a significant difference. The main differential signaling pathways associated with AMI were visualized.
The GSE184073 data set was evaluated using R language. The main steps are as follows: (1) construct a Seurat object through “Seurat” (30) R Package; (2) quality control (QC) of the raw data was performed by calculating the proportion of mitochondrial genes and ribosomal genes, and excluding low-quality cells; (3) the top 2,500 highly variable feature RNAs were filtered by the “FindVariableFeatures” function; (4) principal component analysis (PCA) and t-distributed stochastic neighbor embedding (tSNE) were performed for dimension reduction, clustering, and visualization based on the top 2,500 highly variable genes; (5) the R package “SingleR” (31) was used to annotate the single-cell RNA seq data automatically; (6) the expression data of GLS in different cells were extracted, and the differences were analyzed and visualized by the “ggplot2” R language package.
Differences between the two groups were analyzed by Wilcoxon tests (mean ± SD), and P < 0.05 indicated statistical significance (ns: no significance, *P < 0.05, **P < 0.01, ***P < 0.001, ****P < 0.0001). Kaplan–Meier analysis was implemented through the “tinyarray” package in R, and log-rank P < 0.05 was considered statistically significant.
Cuproptosis-related genes were garnered from previous literature (17). According to the report, FDX1, LIAS, LIPT1, DLAT, PDHA1, and PDHB were positively correlated with cuproptosis, but MTF1, GLS, and CDKN2A were the opposite (Figure 1A). PPI network of CRGs was constructed by STRING database, and the protein interaction was enriched (P = 1.36e-10), with an average node degree of 2.44 and an average local clustering coefficient of 0.622. We discovered that the positively correlated proteins were closely correlated, while the negatively correlated proteins were unrelated to others (Figure 1B). Next, we investigated the correlation of CRGs in the GSE59867 data set. The results indicated that there was a close correlation between them (Figure 1C; Supplementary Table 1). We also found that GLS had the largest positive correlation with LIAS (P = 4.27e-19, r = 0.63) and the largest negative correlation with MTF1 (P = 2.59e-17, r = −0.61), suggesting that it plays an important role in the above relationship (Figure 1D). The results of differential analysis showed that six (LIAS, LIPT1, DLAT, PDHB, MTF1, and GLS) of the nine CRGs were significantly different between the stable_CAD and AMI groups (Figure 1E). Compared with stable_CAD group, LIAS, LIPT1, DLAT, PDHB, and GLS were lower and MTF1 was higher in AMI. Notably, FDX1 was vital for cuproptosis, that is, no significant difference between the two groups. Based on gene expression values, CRGs were clustered into four groups by heatmap analysis, with higher GLS and MTF1 expression and lower CDKN2A, LIAS, and LIPT1 expression in all samples (Figure 1F).
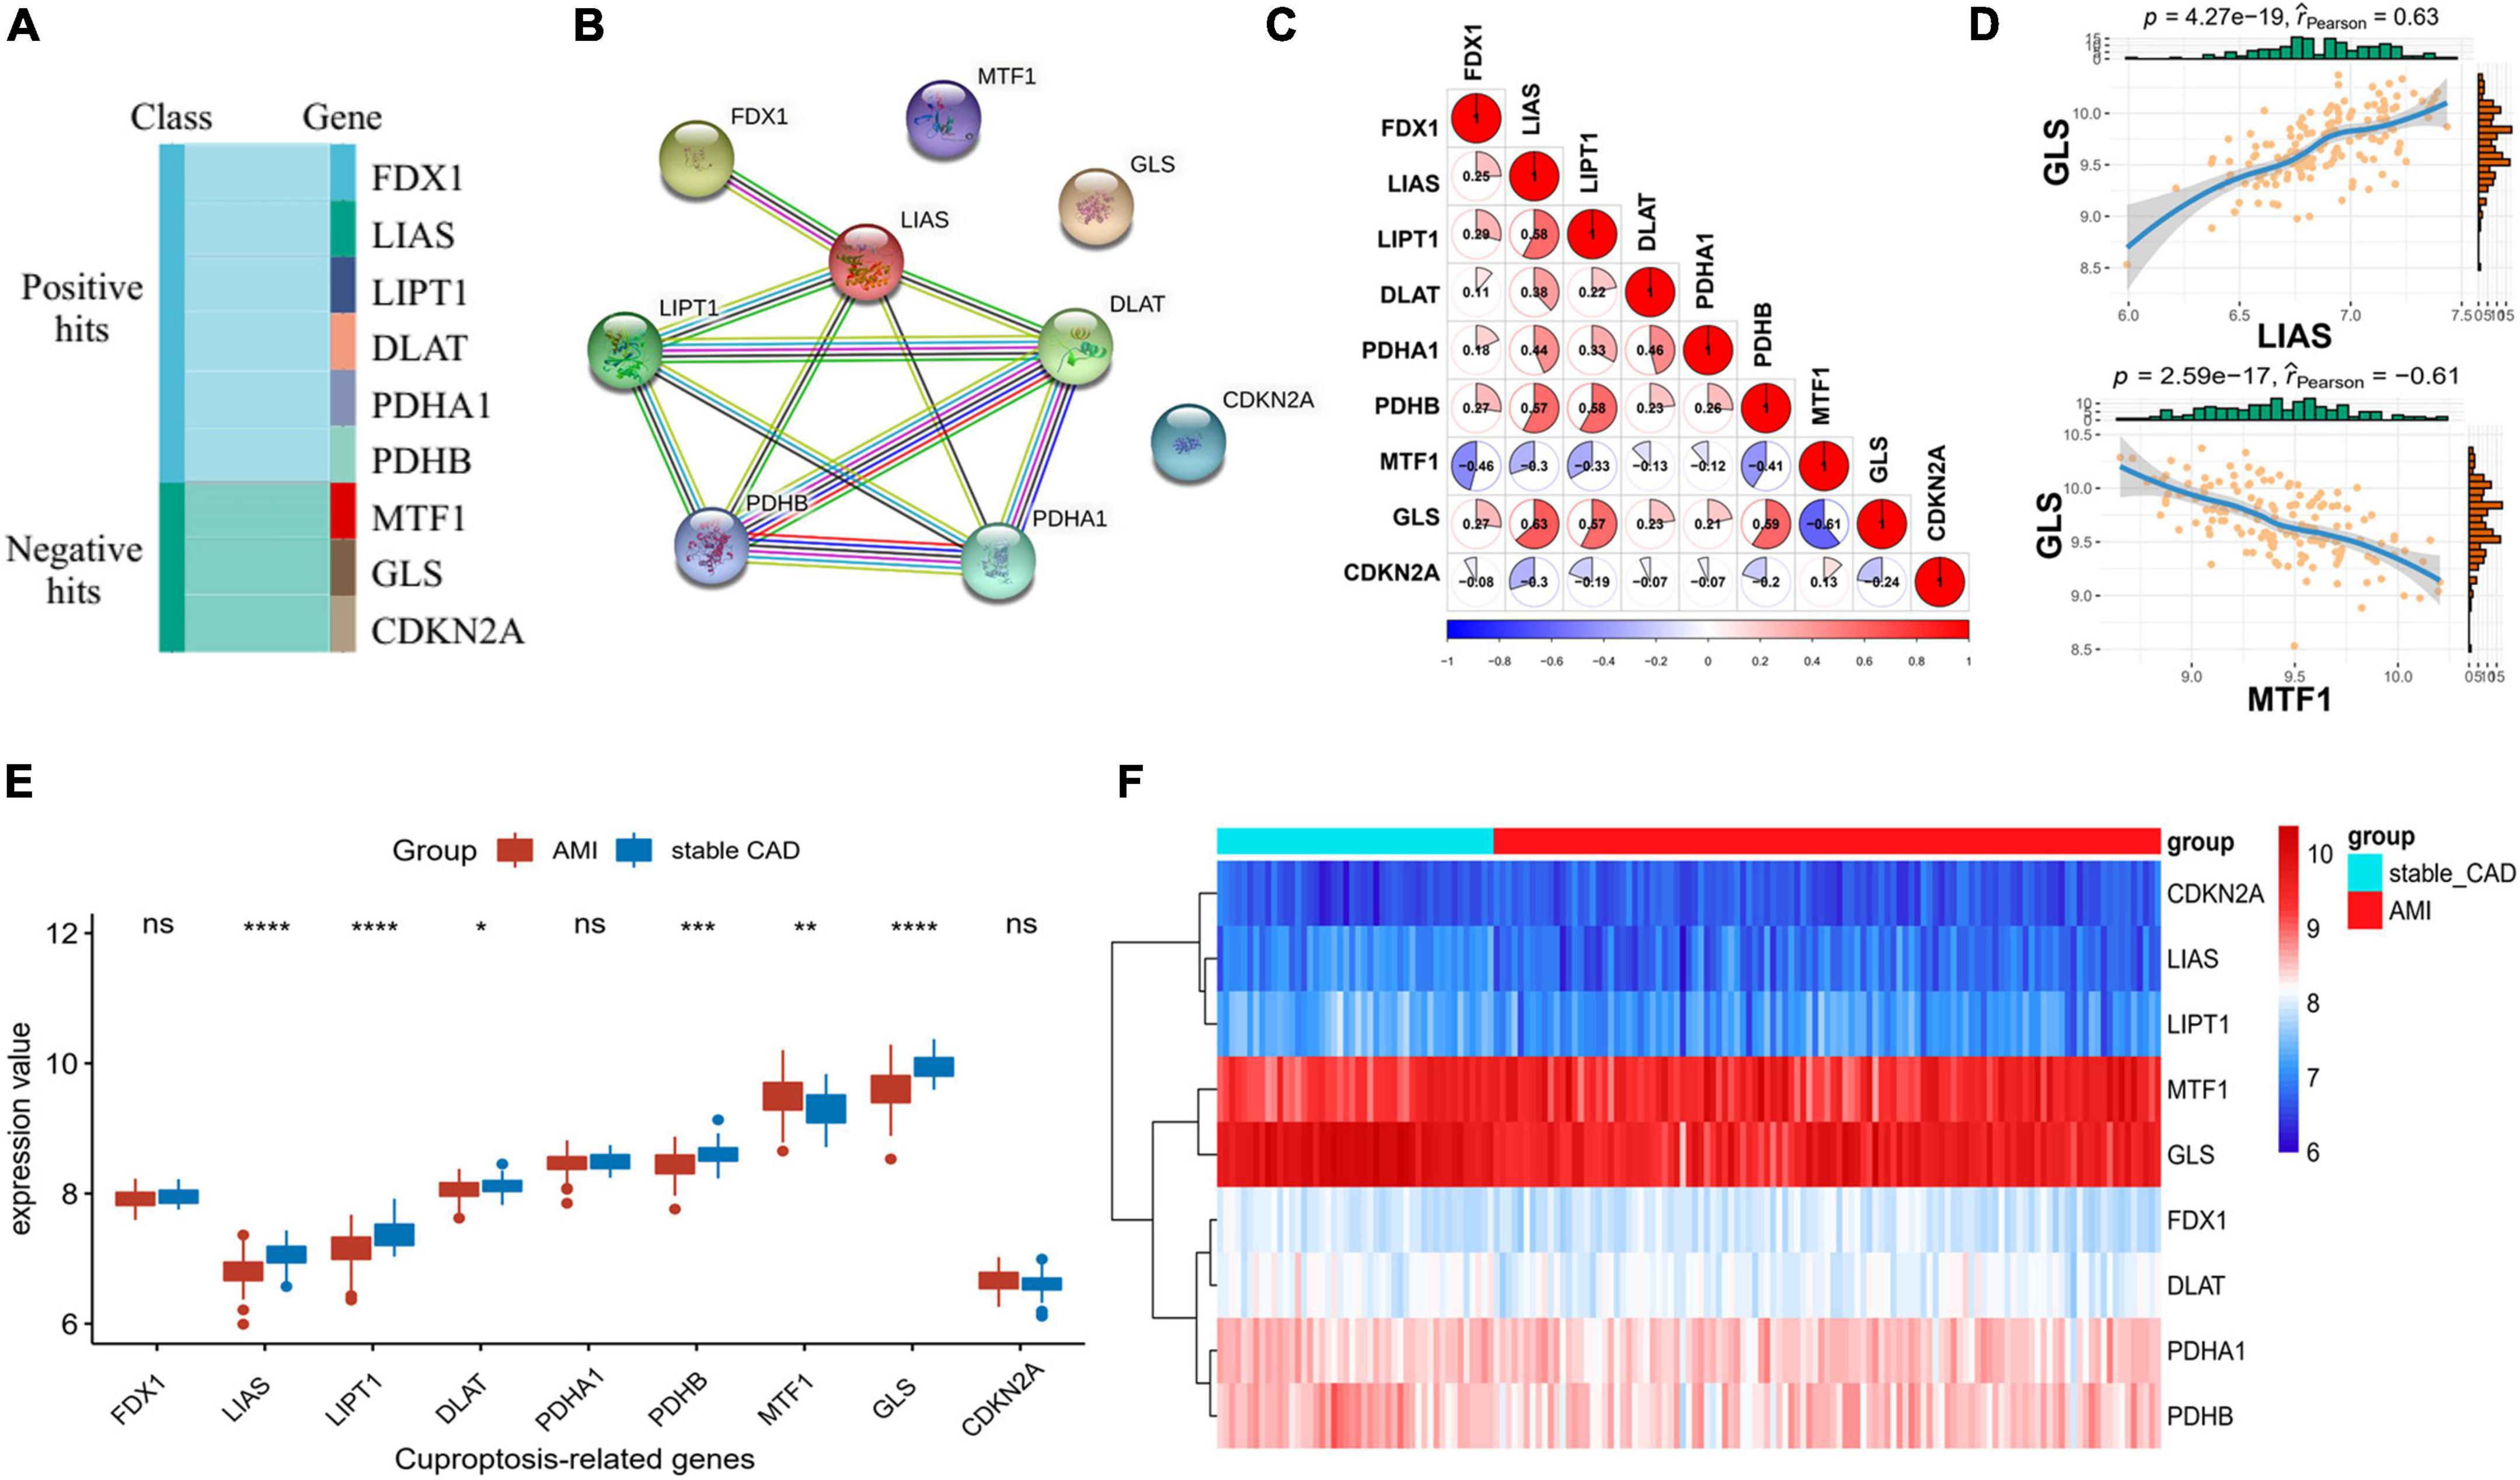
Figure 1. Differential expression landscape of cuproptosis-related genes (CRGs). (A) Classification of genes associated with CRGs. (B) Protein–protein interaction (PPI) network of CRGs. (C,D) Correlation analysis of CRGs in AMI. (E) The boxplot of CRGs differential expression. (F) The heatmap of CRGs (stable_CAD, stable coronary heart disease; AMI, acute myocardial infarction). *P < 0.05, **P < 0.01, ***P < 0.001, ****P < 0.0001.
To explore the regulatory mechanism of CRGs, we executed GO and KEGG enrichment analyses using R software. In biological process (BP) analysis (Figure 2A), these genes were mostly enriched in acetyl-CoA biosynthetic process from pyruvate, acetyl-CoA biosynthetic process, tricarboxylic acid (TCA) cycle, acetyl-CoA metabolic process, and sulfur compound biosynthetic process. In cellular component (CC) analysis (Figure 2A), these genes were mostly enriched in mitochondrial matrix, oxidoreductase complex, mitochondrial protein-containing complex, and heterochromatin. In molecular function (MF) analysis (Figure 2A), these genes were mostly enriched in oxidoreductase activity, acting on the aldehyde or oxo group of donors, NAD or NADP as acceptor, oxidoreductase activity, acting on the aldehyde or oxo group of donors, transferase activity, transferring acyl groups other than amino-acyl groups, sulfurtransferase activity, transferase activity, and transferring acyl groups. KEGG enrichment analyses showed that TCA cycle, pyruvate metabolism, glycolysis/gluconeogenesis, central carbon metabolism in cancer, carbon metabolism, glucagon signaling pathway, HIF-1 signaling pathway, biosynthesis of cofactors, and diabetic cardiomyopathy were mostly enriched (Figure 2B).
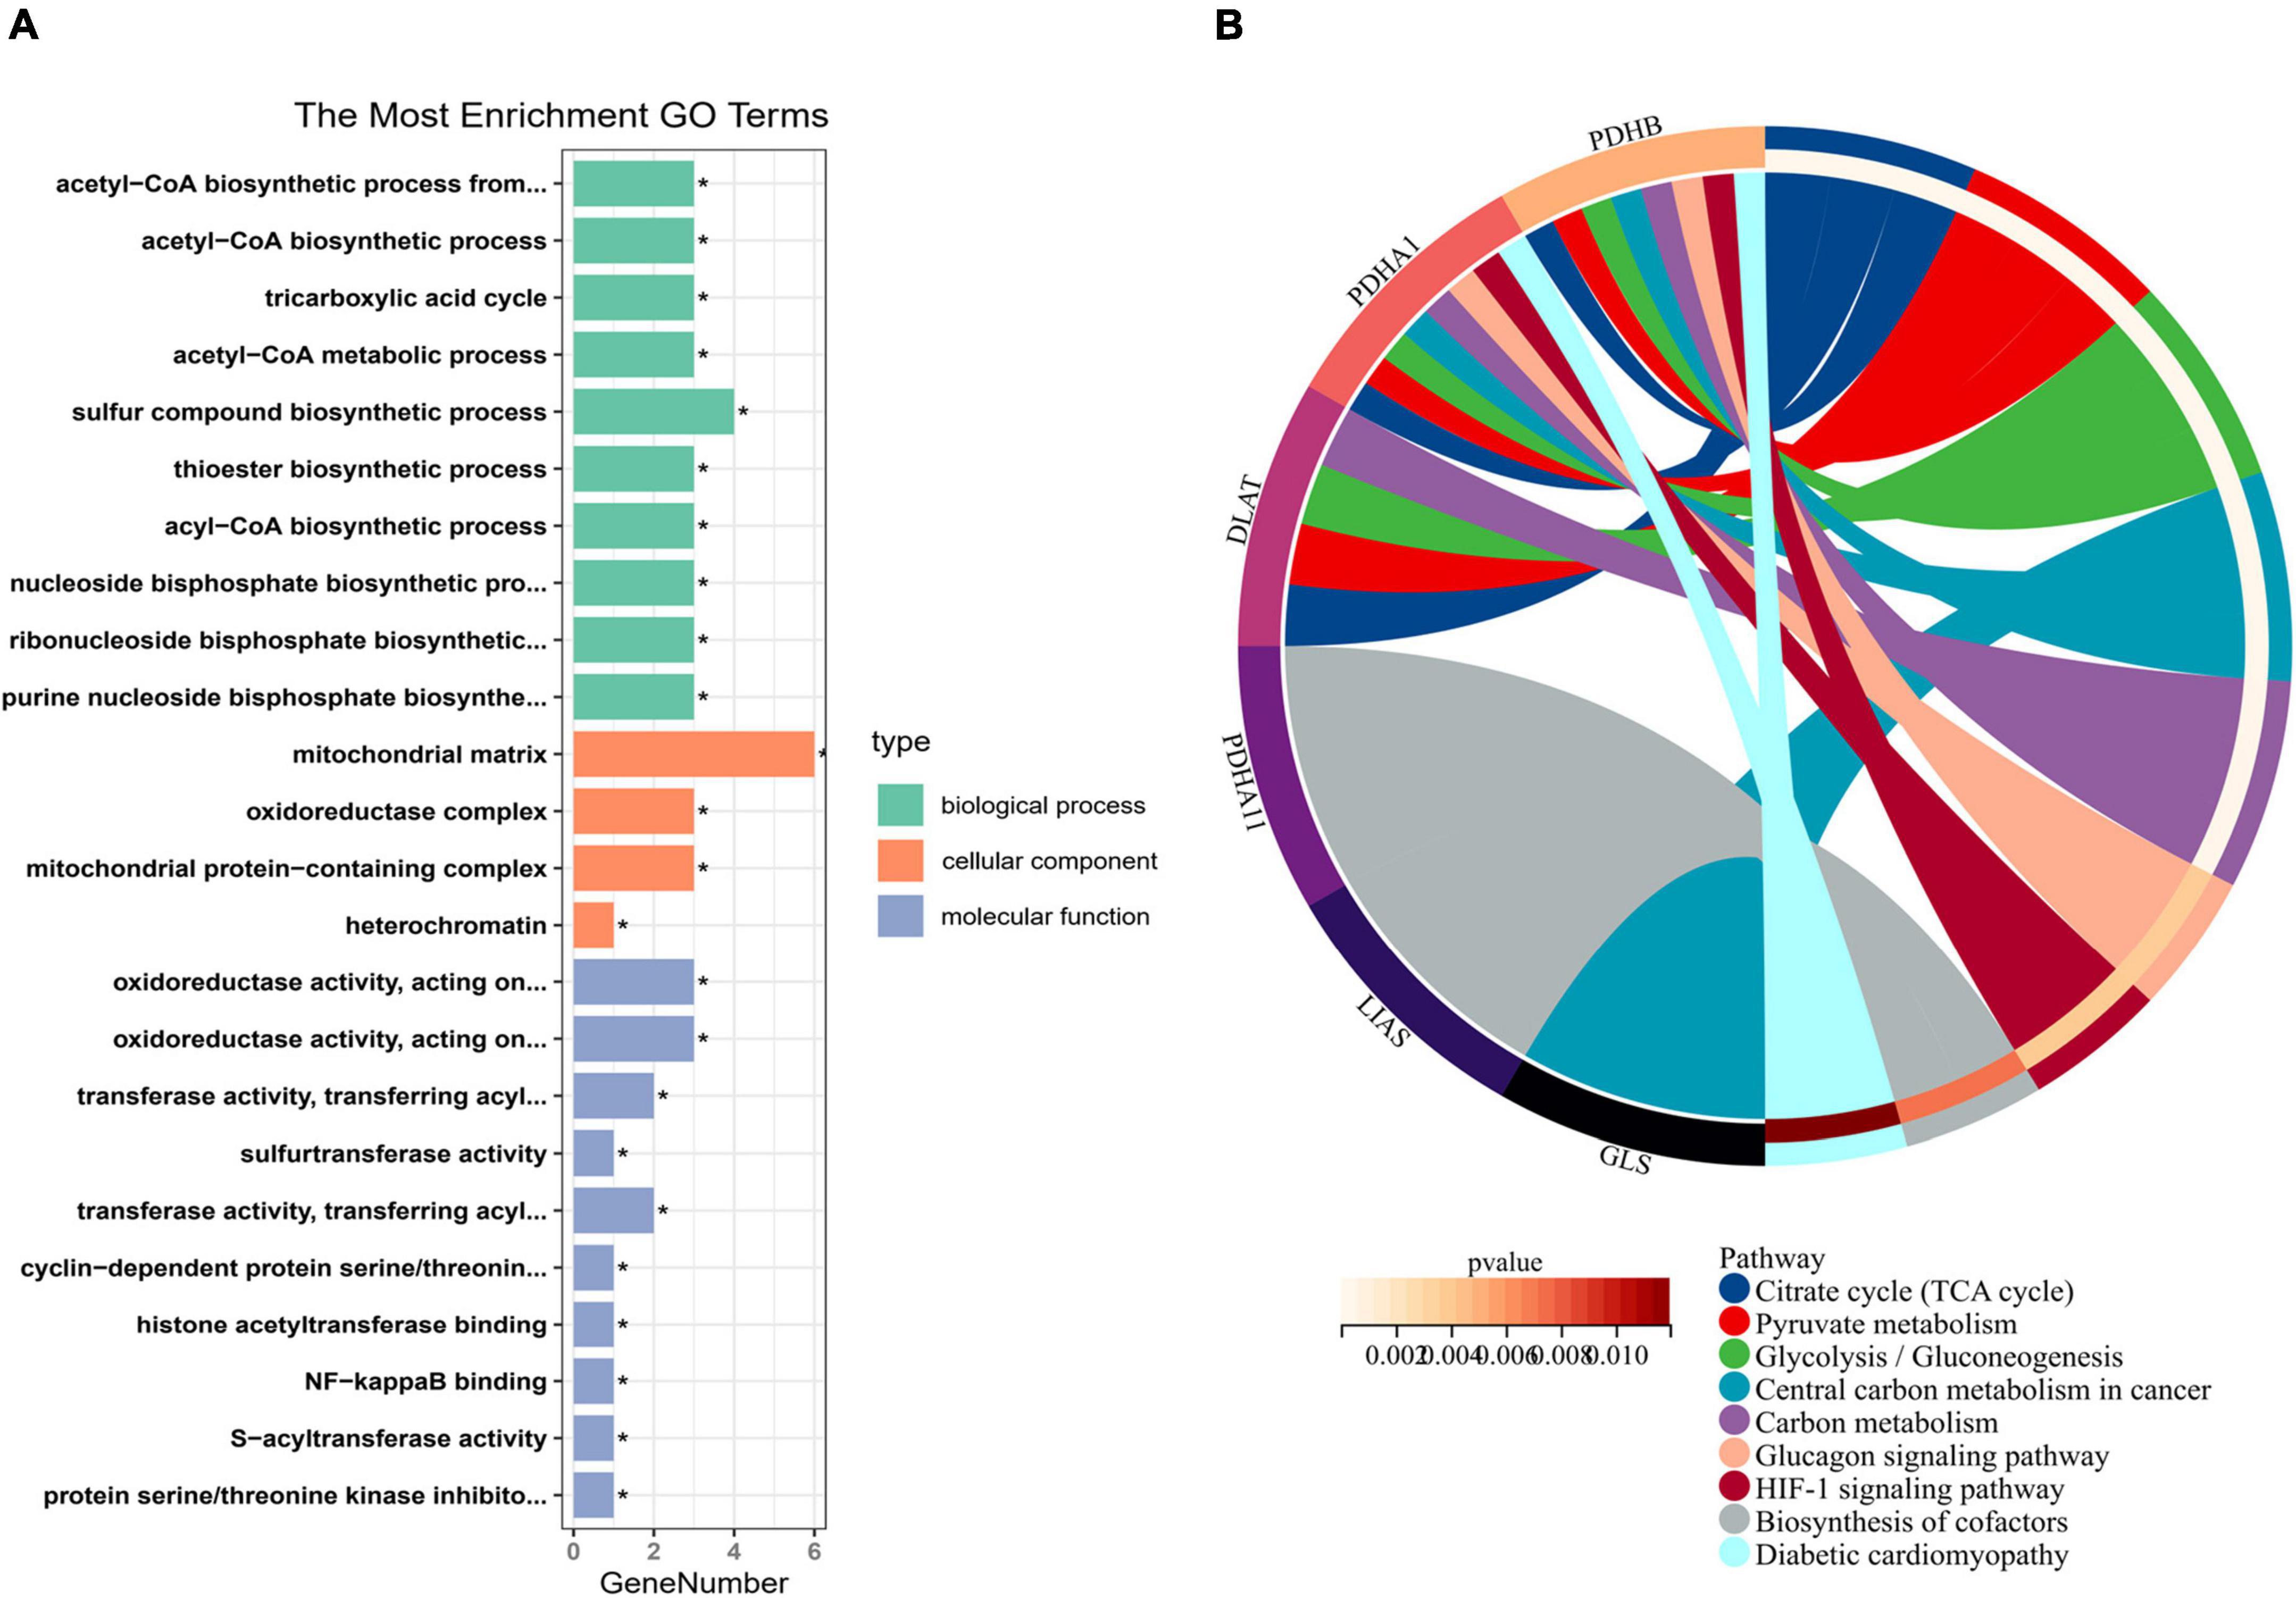
Figure 2. Enrichment analysis of cuproptosis-related genes (CRGs). (A) The histogram of GO analysis (BP, CC, and MF). (B) The Circos of Kyoto Encyclopedia of Genes and Genomes (KEGG) analysis. *P < 0.05.
Initially, we calculated the different expression of m6A-related genes between the stable_CAD and AMI groups. As previously reported (32–34), most m6A-related genes were significantly different between the two groups (Figure 3A), such as KIAA1429, RBM15, HNRNPA2B1, and FMR1, implying that m6A may be involved in the pathogenesis of AMI. We also investigated the relationship between CRGs and m6A-related genes. The results showed that there was a close relationship between them (Figure 3B; Supplementary Table 2). In this relationship network, GLS had the largest positive correlation with FMR1, and MTF1 had the largest negative correlation with HNRNPA2B1 (Figure 3C).
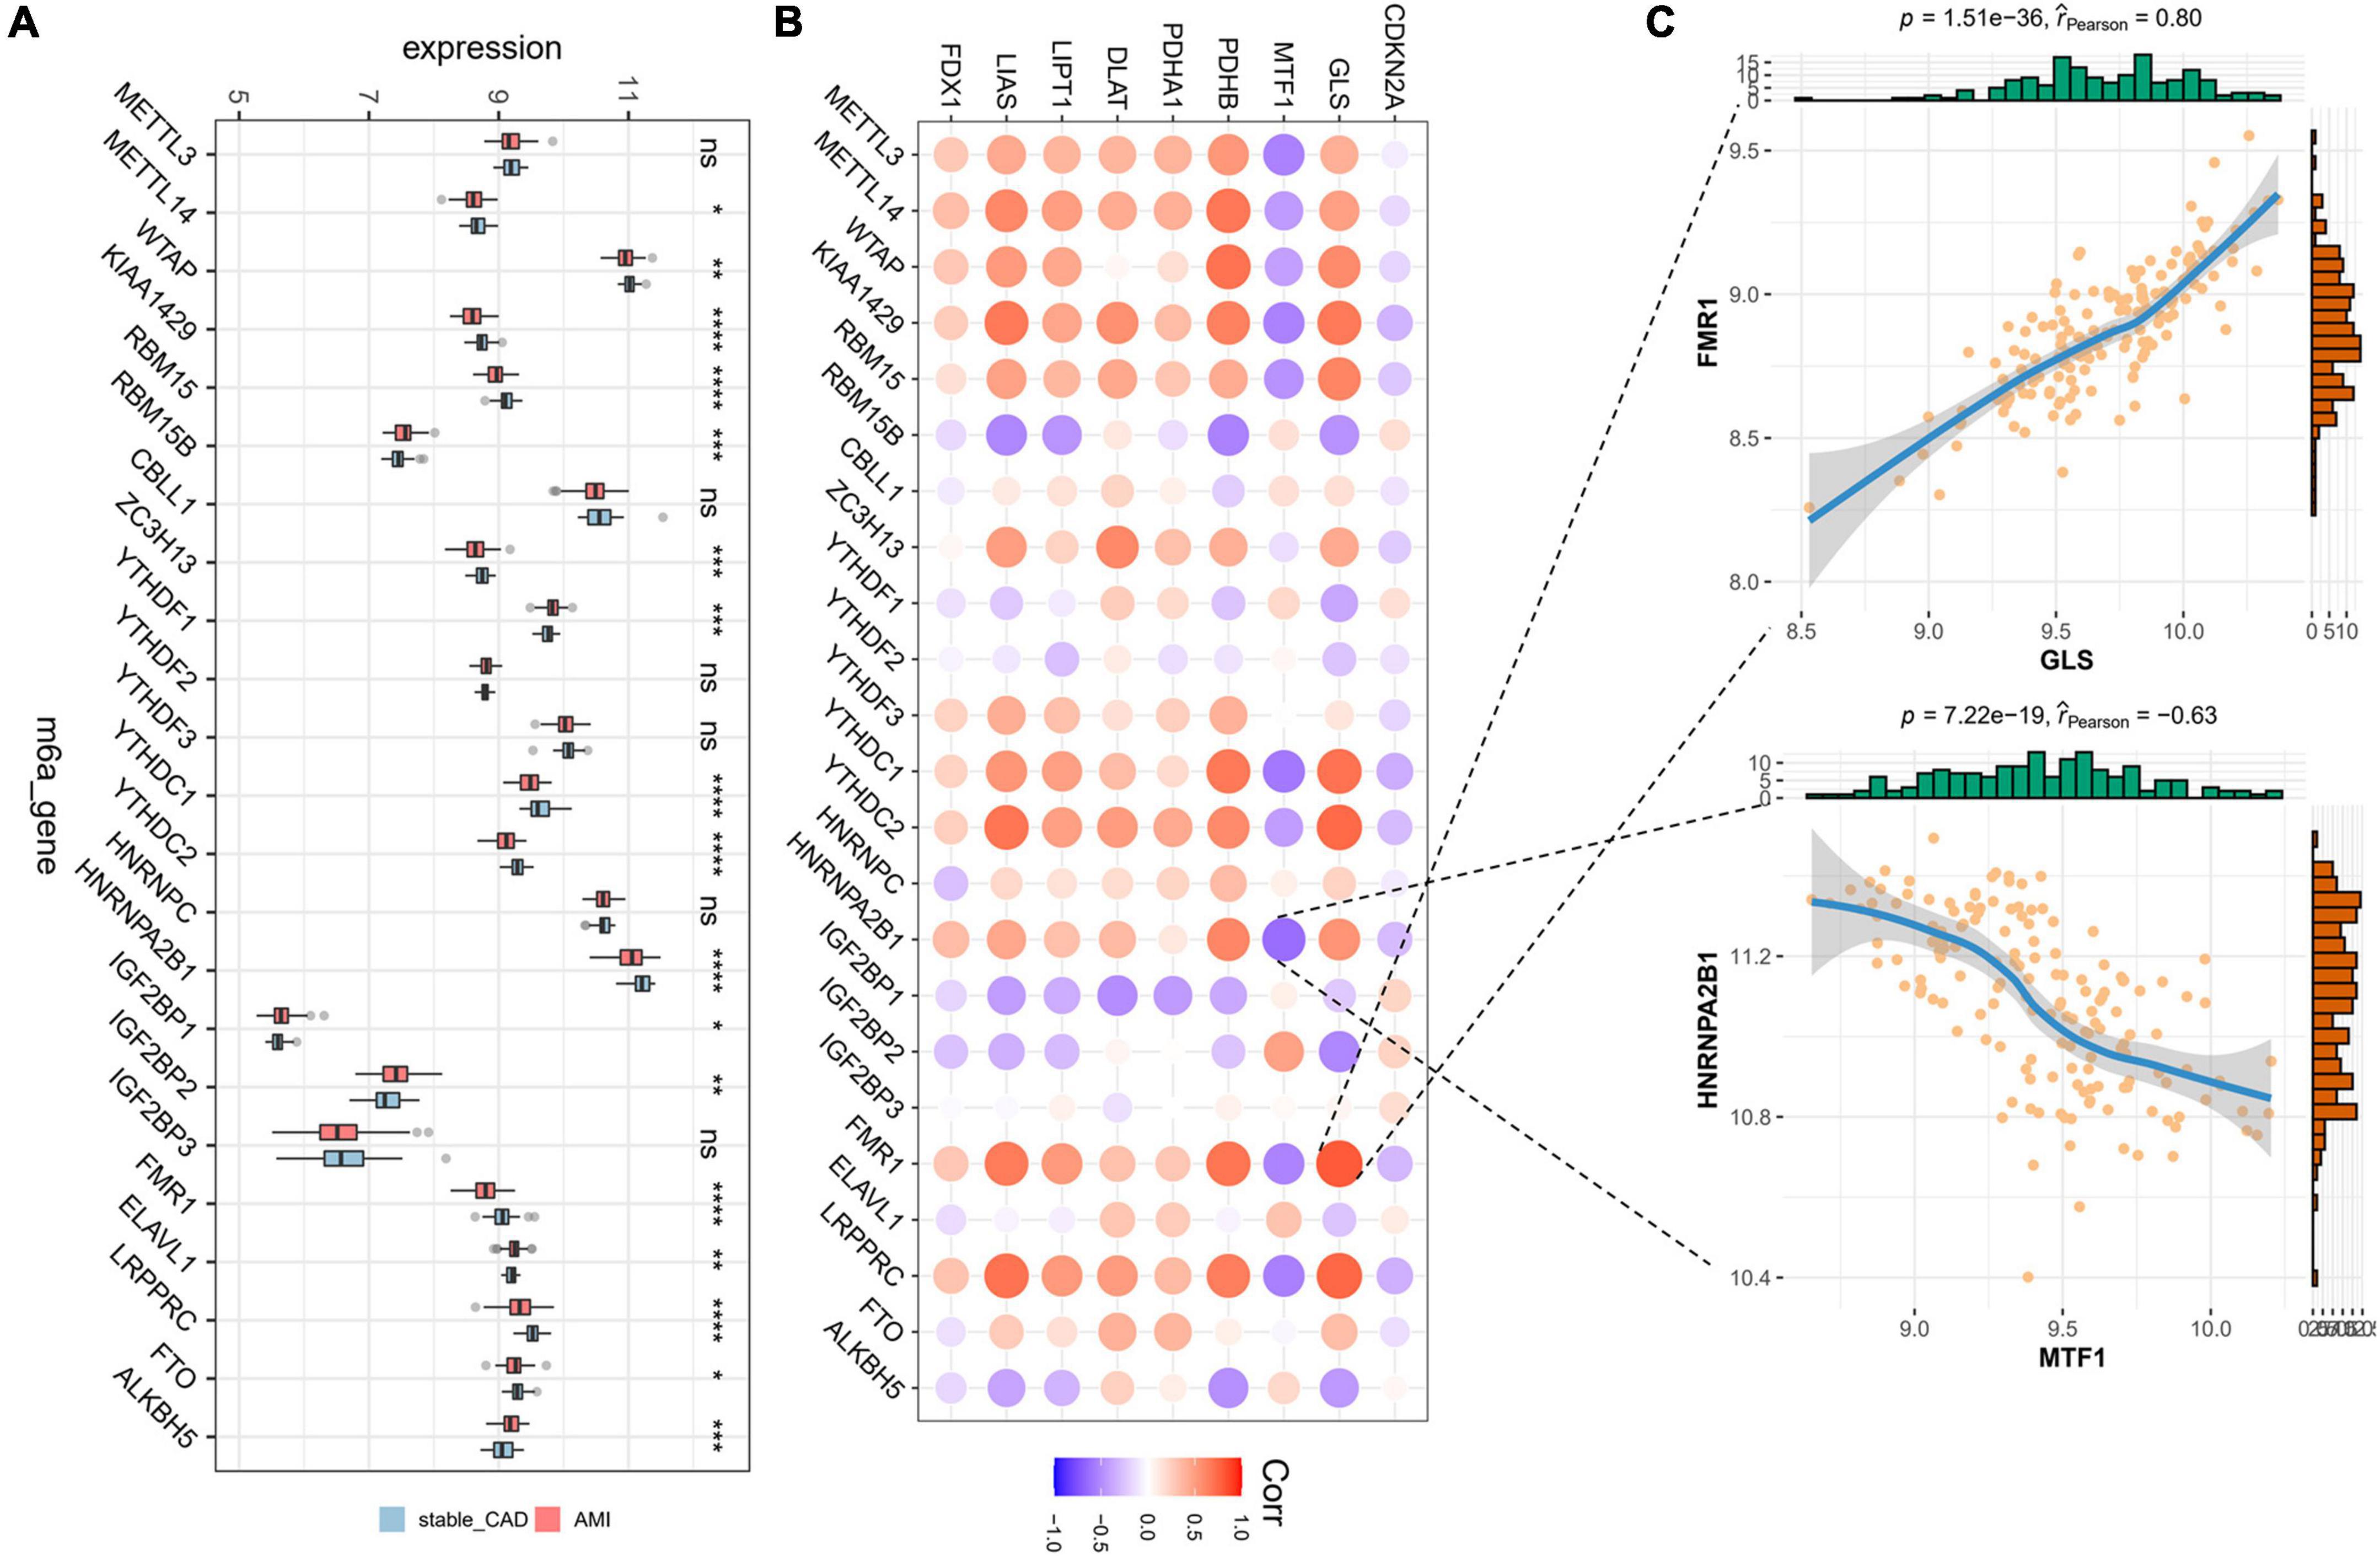
Figure 3. Landscape of m6A-related genes and the correlation degree between cuproptosis-related genes (CRGs) and m6A-related genes. (A) The boxplot of differential expression of m6A-related genes in AMI (stable_CAD, stable coronary heart disease; AMI, acute myocardial infarction). (B) The heatmap of the correlation degree between CRGs and m6A-related genes (the darker the color and the larger the graph, the more relevant it is. Red is positive, and purple is negative). (C) Correlation between GLS and FMR1 as well as MTF1 and HNRNPA2B1. *P < 0.05, **P < 0.01, ***P < 0.001, ****P < 0.0001.
In our study, the immune infiltration abundance was calculated by “CIBERSORT” algorithm, and we found that T cells CD8, T cells CD4 naive, T cells CD4 memory resting, resting NK cells, and monocyte immune infiltrating abundance were higher (Figure 4A). The immune infiltration abundance of nine immune cells was significantly different between the two groups (Figure 4A). Correlation analysis revealed that GLS was closely associated with a variety of immune cells (Figure 4B; Supplementary Table 3), such as T cells CD4 memory resting (P = 3.88e-11, r = 0.50) and monocytes (P = 1.1e-20, r = -0.66) (Figure 4C).
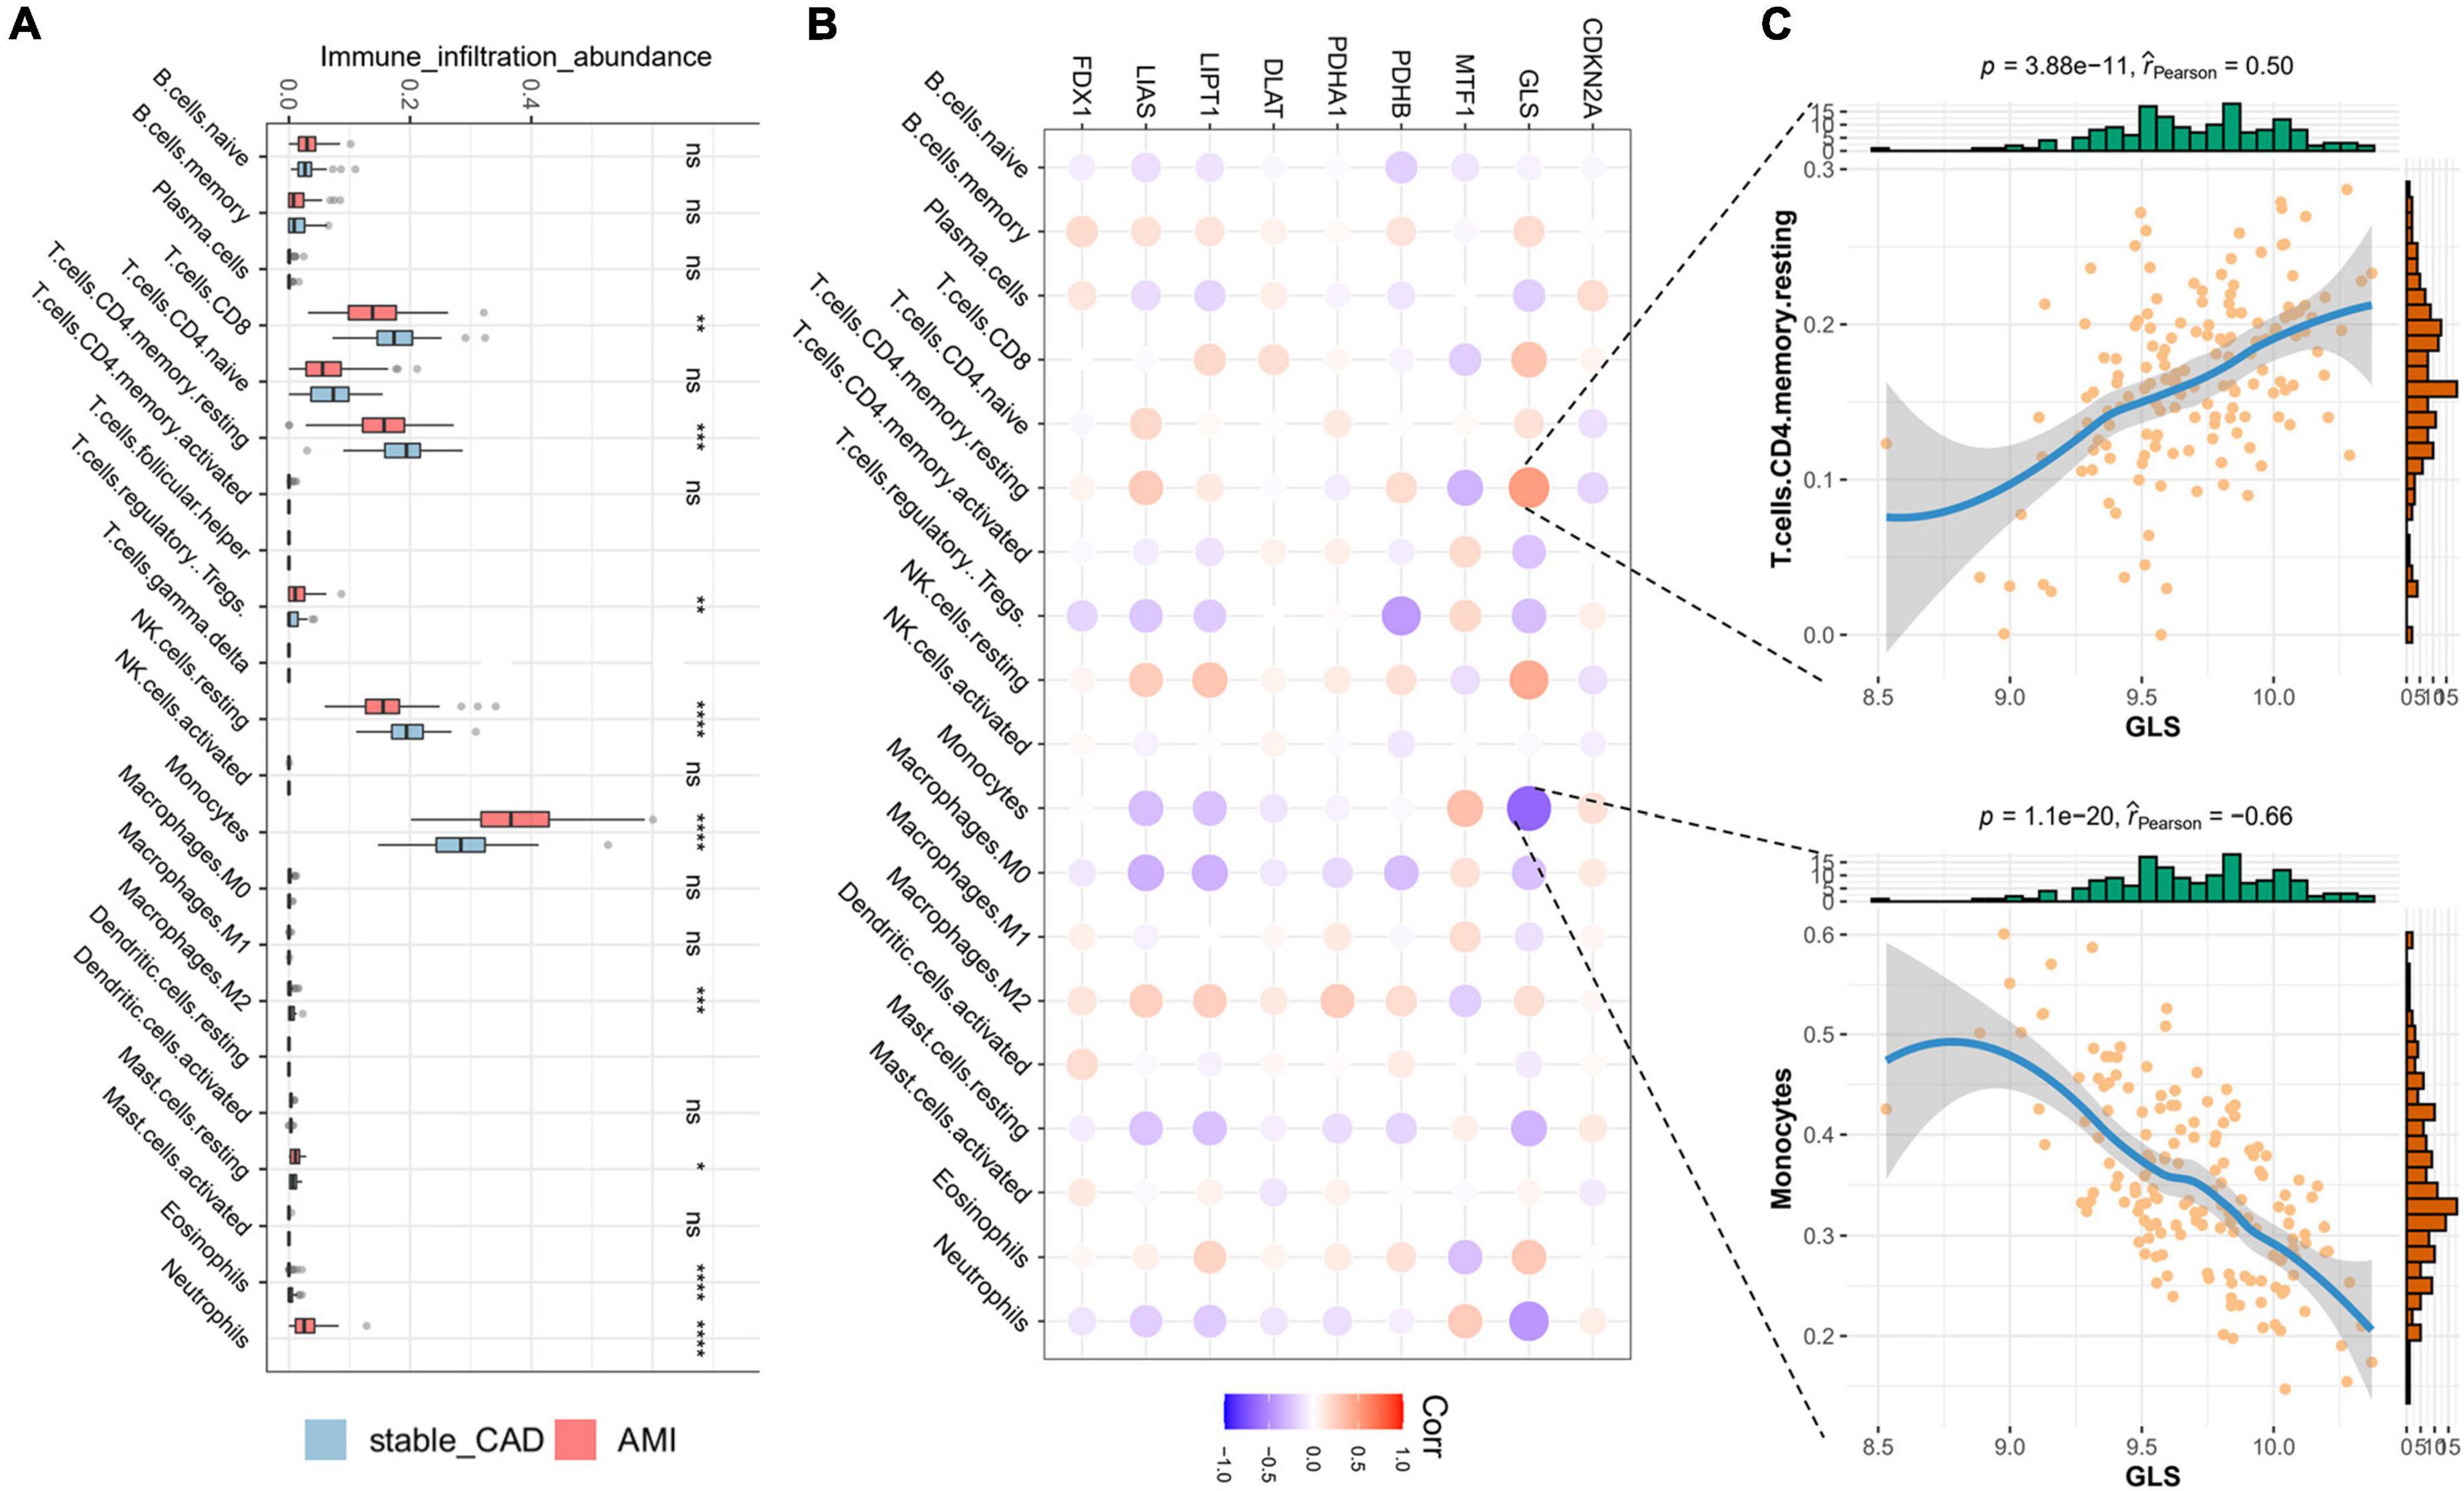
Figure 4. Landscape of immune cells and the correlation degree between cuproptosis-related genes (CRGs) and immune cells. (A) The boxplot of differential expression of immune cells in AMI (stable_CAD: stable coronary heart disease, AMI: acute myocardial infarction). (B) The heatmap of the correlation degree between CRGs and immune cells (the darker the color and the larger the graph, the more relevant it is. Red is positive, and purple is negative). (C) Correlation between GLS and T cells. CD4 memory resting as well as monocytes. *P < 0.05, **P < 0.01, ***P < 0.001, ****P < 0.0001.
NetworkAnalyst was used to analyze ceRNA, TF, and tiny molecule compound identification. The ceRNA network consists of 183 nodes and 213 edges and contains eight CRGs and 175 miRNAs (Figure 5A; Supplementary Table 4). In this network, six CRGs (CDKN2A, DLAT, FDX1, LIAS, MTF1, and PDHB) had close interactions by targeting miRNAs. The TF_mRNA network consists of 102 nodes and 126 edges and contains nine CRGs and 93 TFs (Figure 5B; Supplementary Table 5). The protein–chemical interactions network consists of 218 nodes and 304 edges and contains nine CRGs and 209 chemicals (Figure 5C; Supplementary Table 6). Based on the degree of chemicals in this network, the top 30 were exhibited in Table 2.
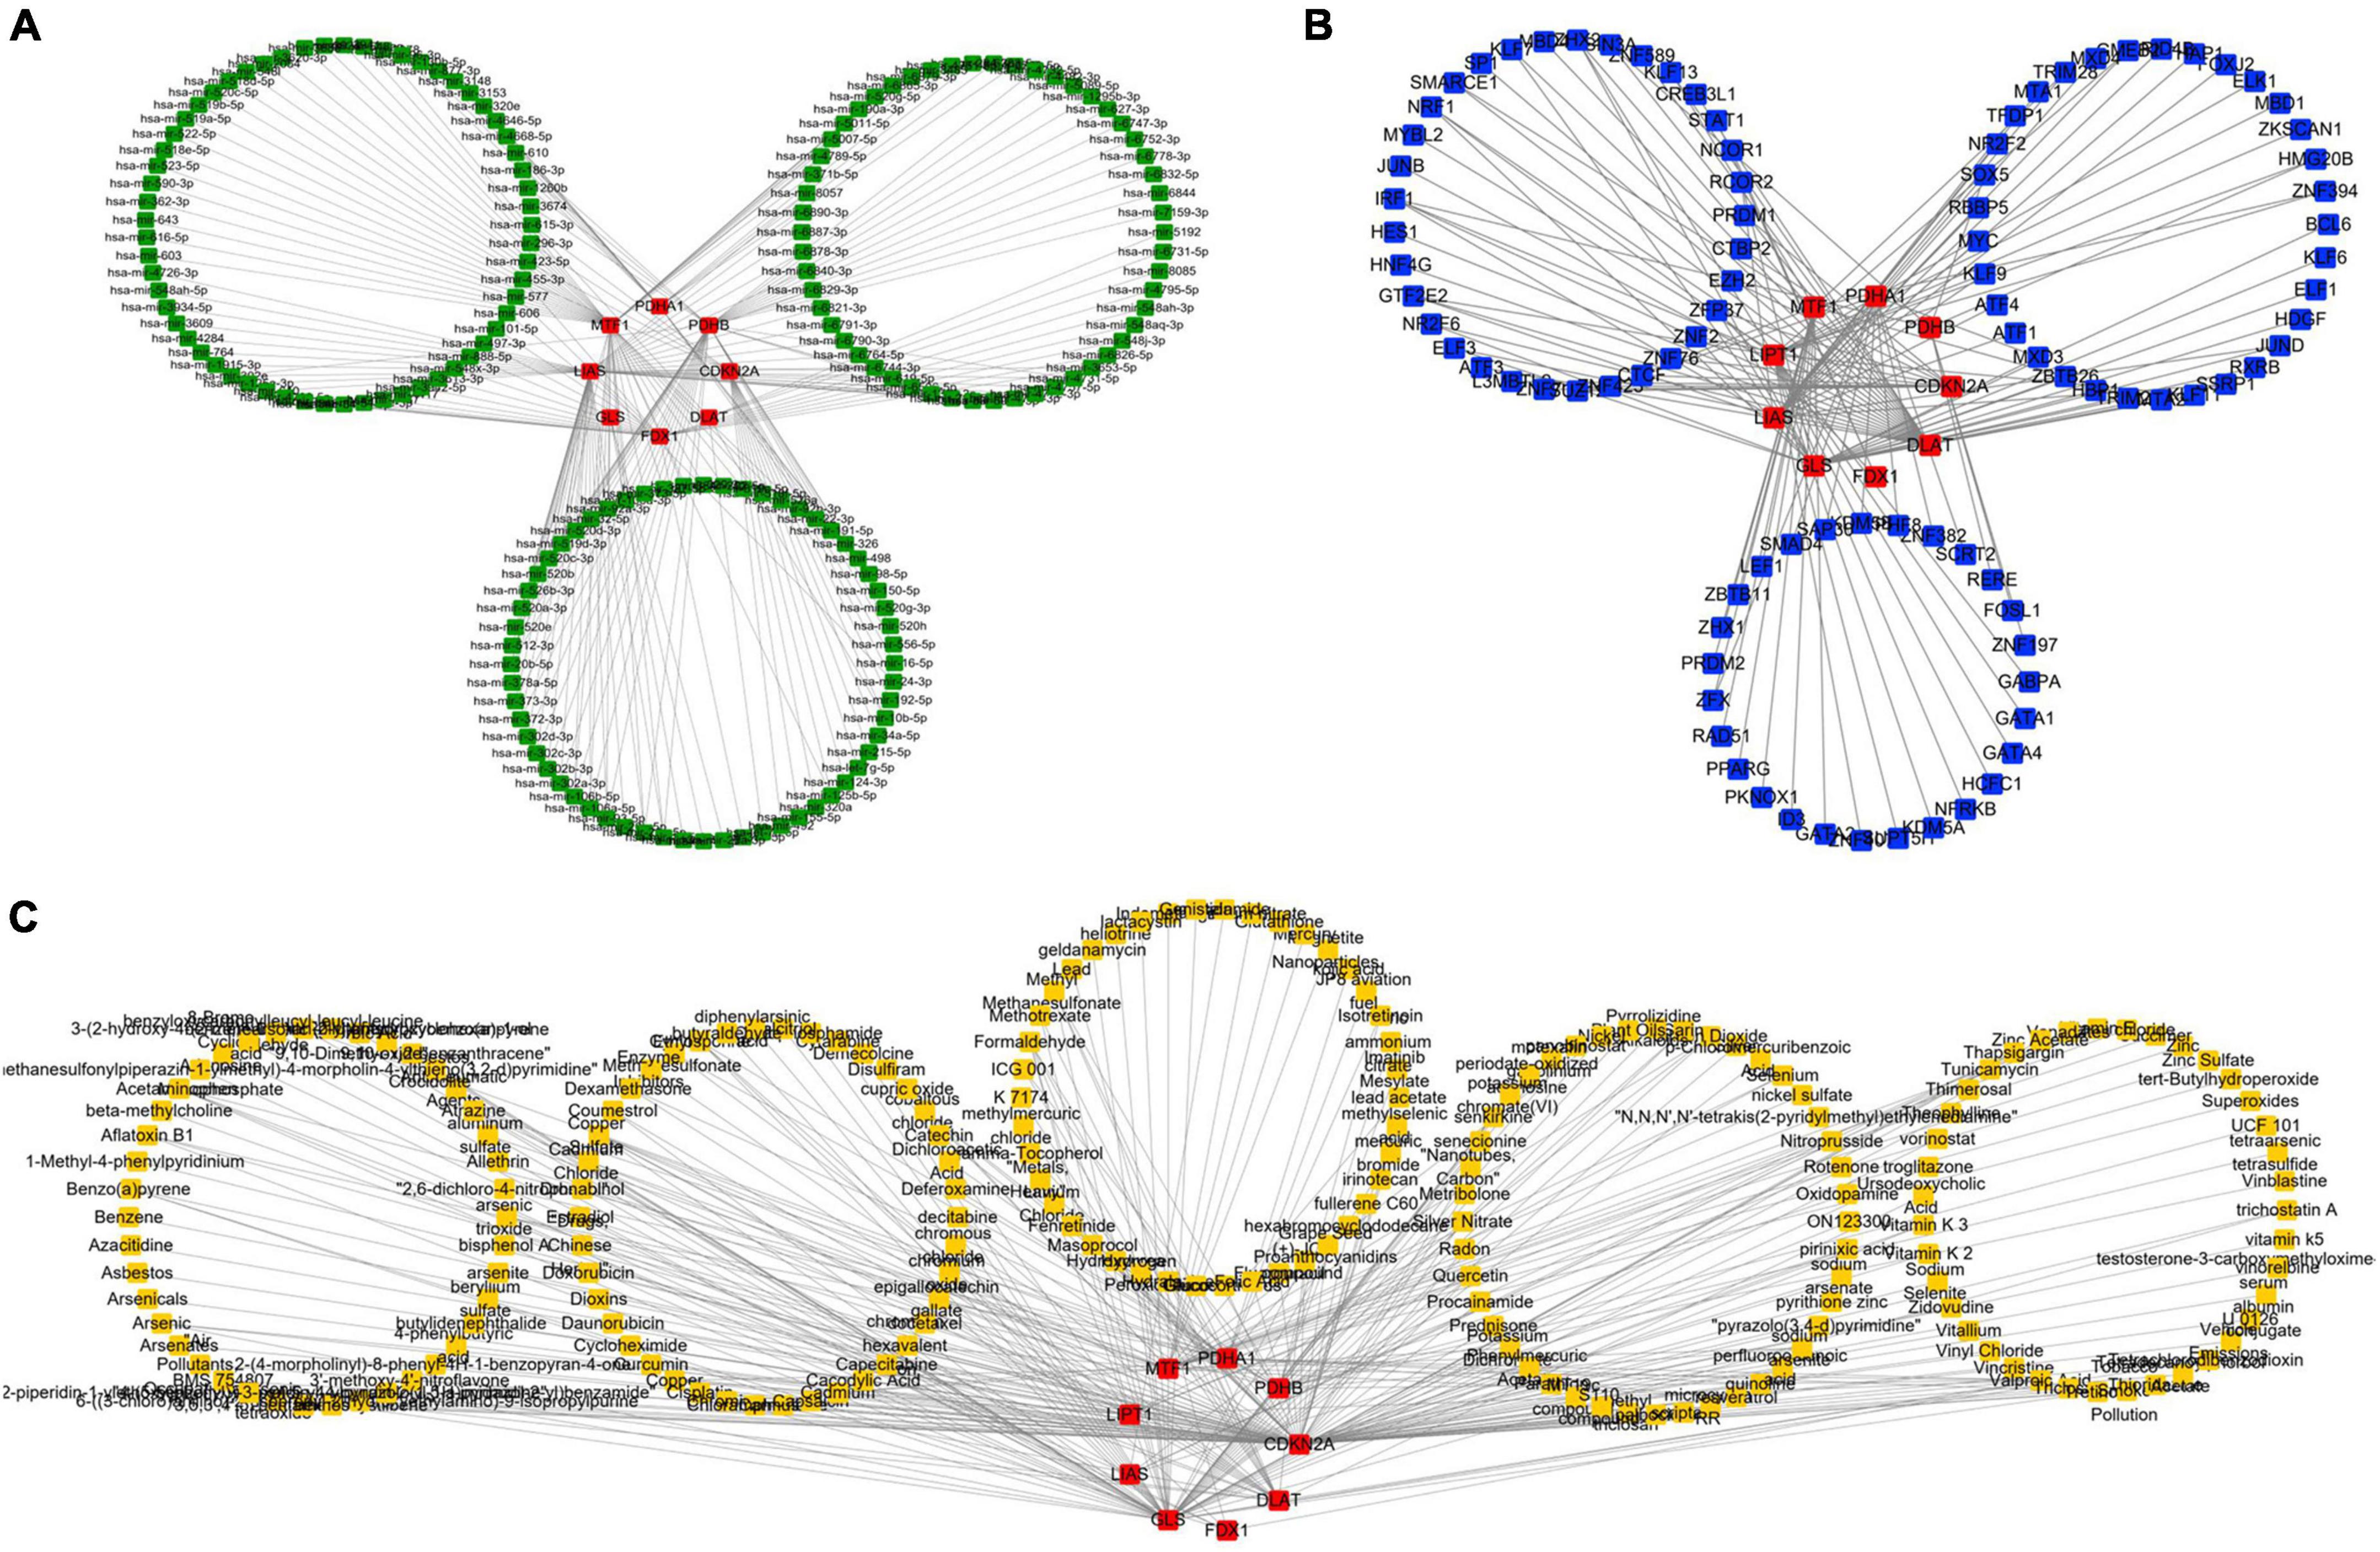
Figure 5. Regulatory mechanism of cuproptosis-related genes (CRGs). (A) The competing endogenous RNA (ceRNA) network of CRGs. (B) The TF network of CRGs. (C) The chemicals network of CRGs (Red nodes represent CRGs, green nodes represent miRNAs, blue nodes represent TF, and yellow nodes represent chemicals).
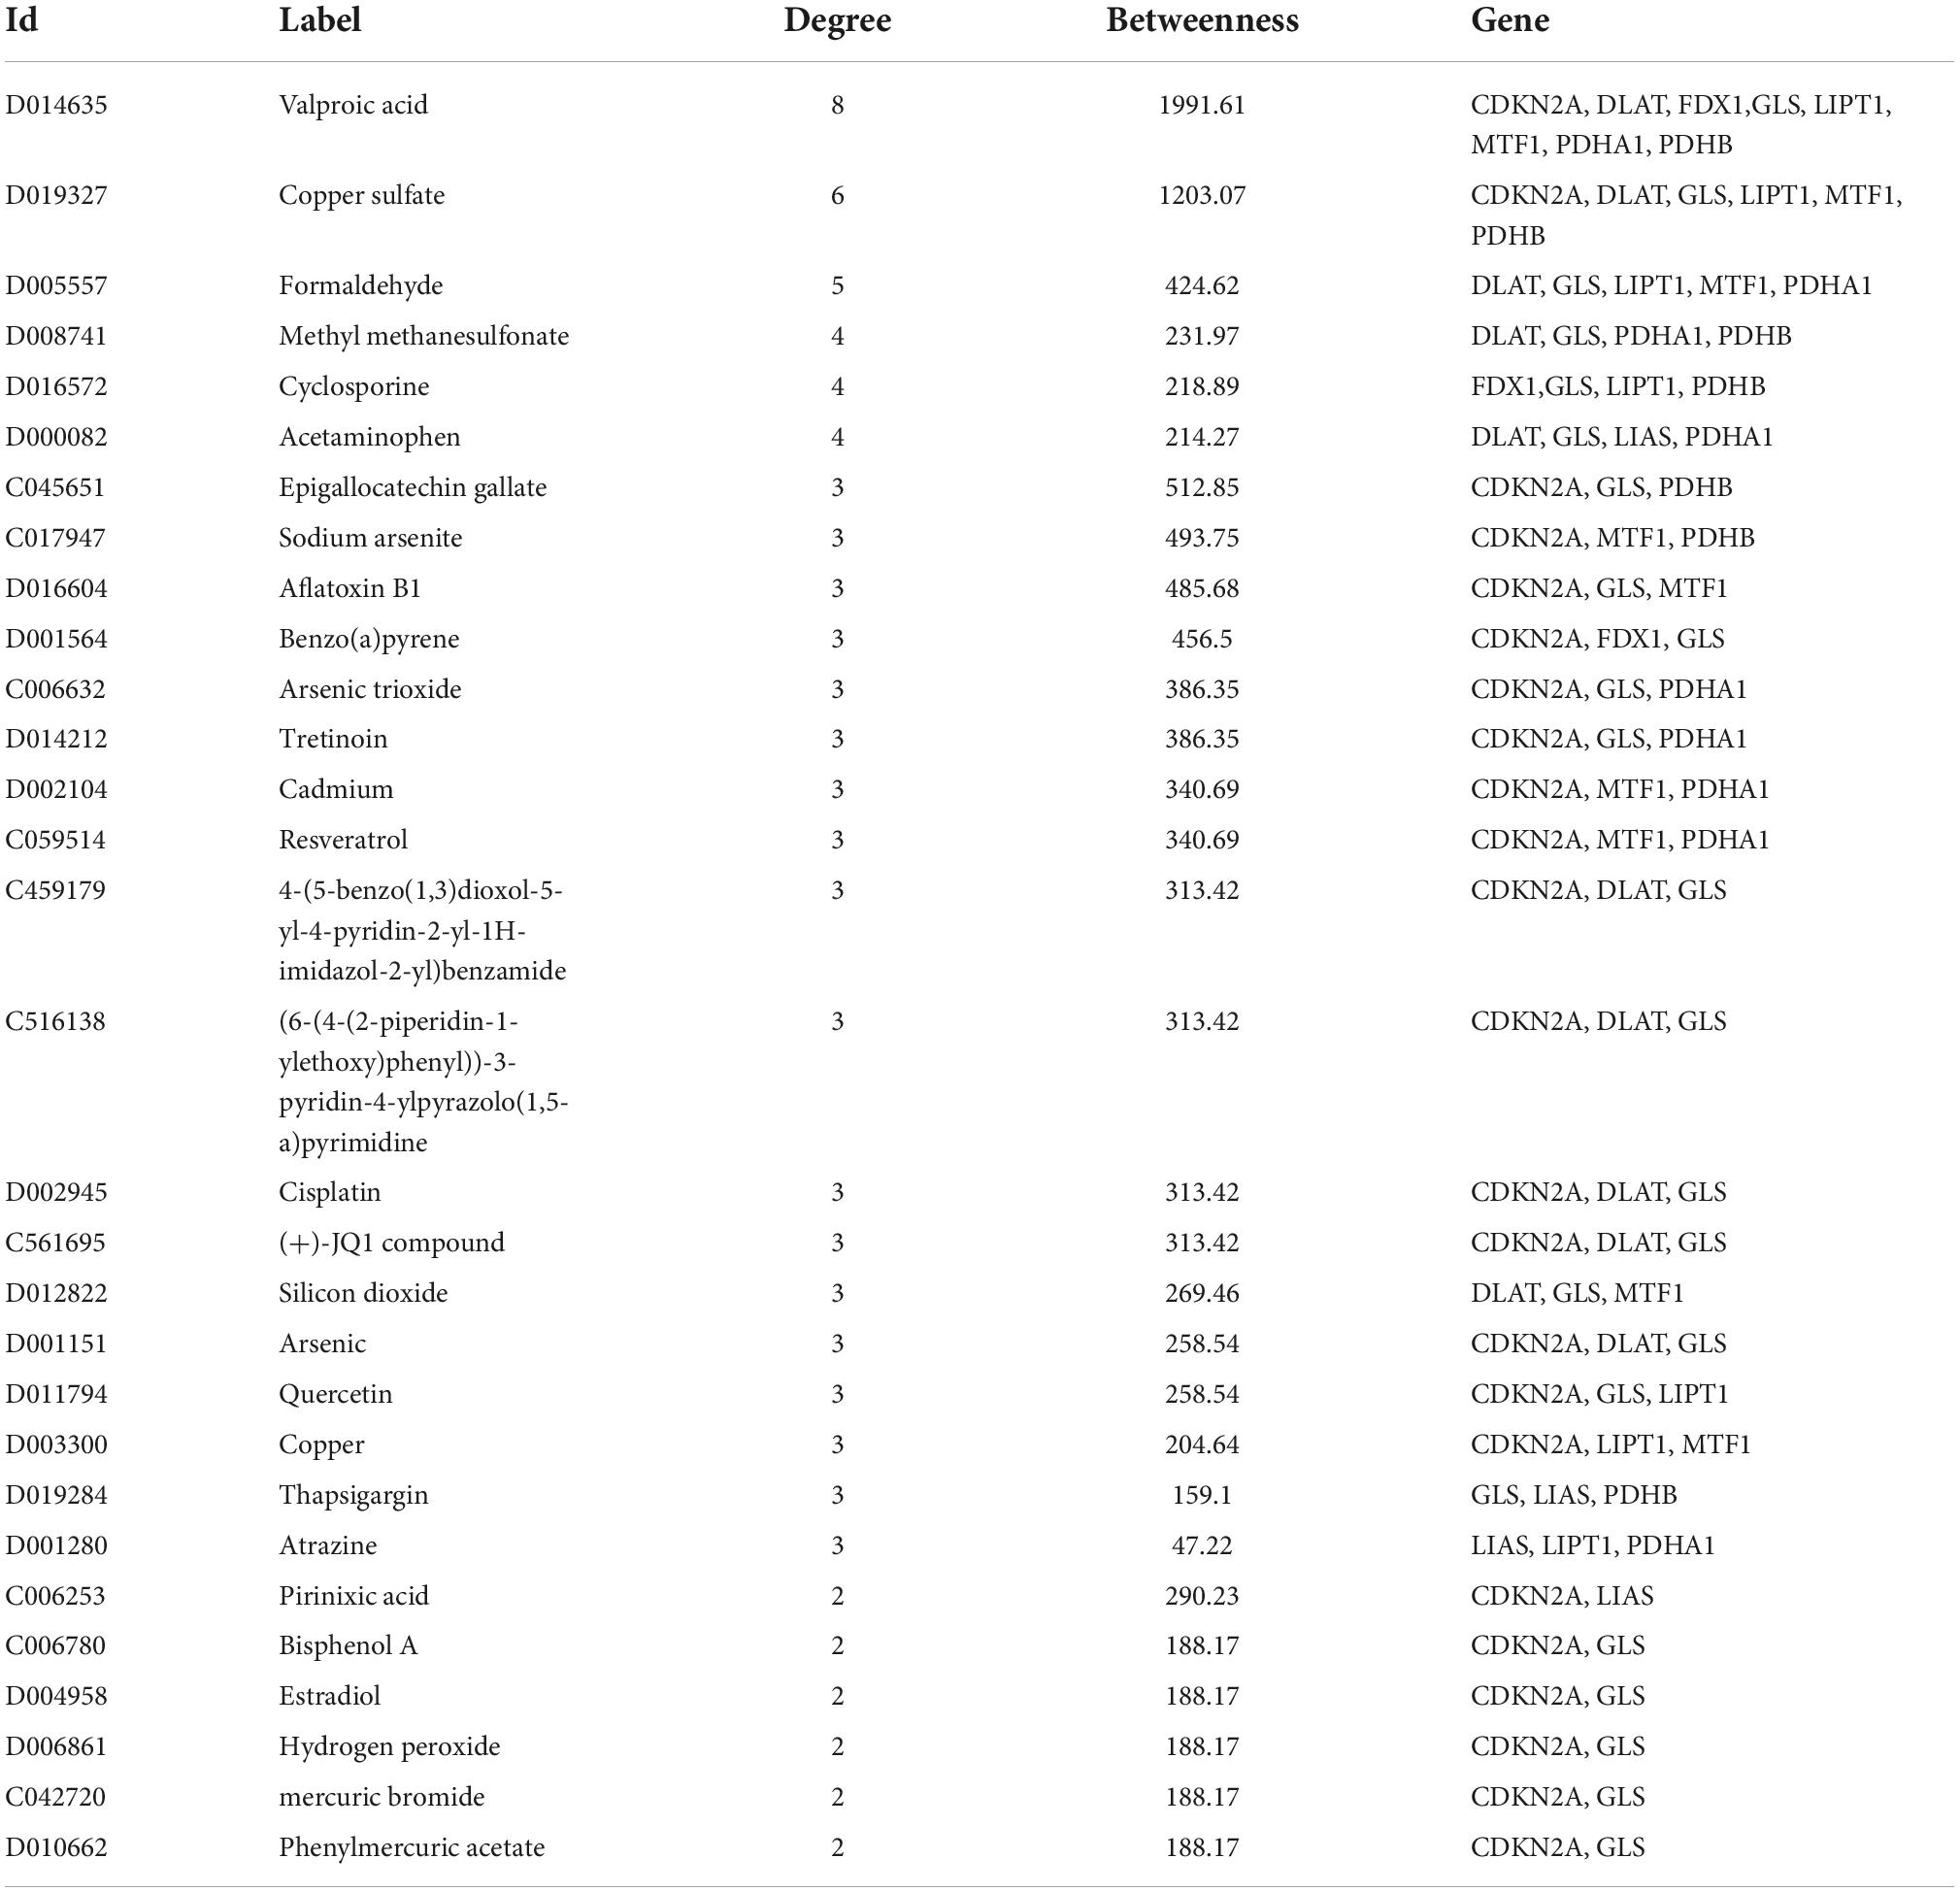
Table 2. Top 30 chemicals.
To further investigate the role of CRGs in AMI, we utilized Kaplan–Meier methods to evaluate their prognostic value in the GSE21545 data set. We discovered that only DLAT had some prognostic value (Figure 6). Patients with high DLAT expression had higher ischemic freedom, suggesting that DLAT had a protective effect on ischemic events.
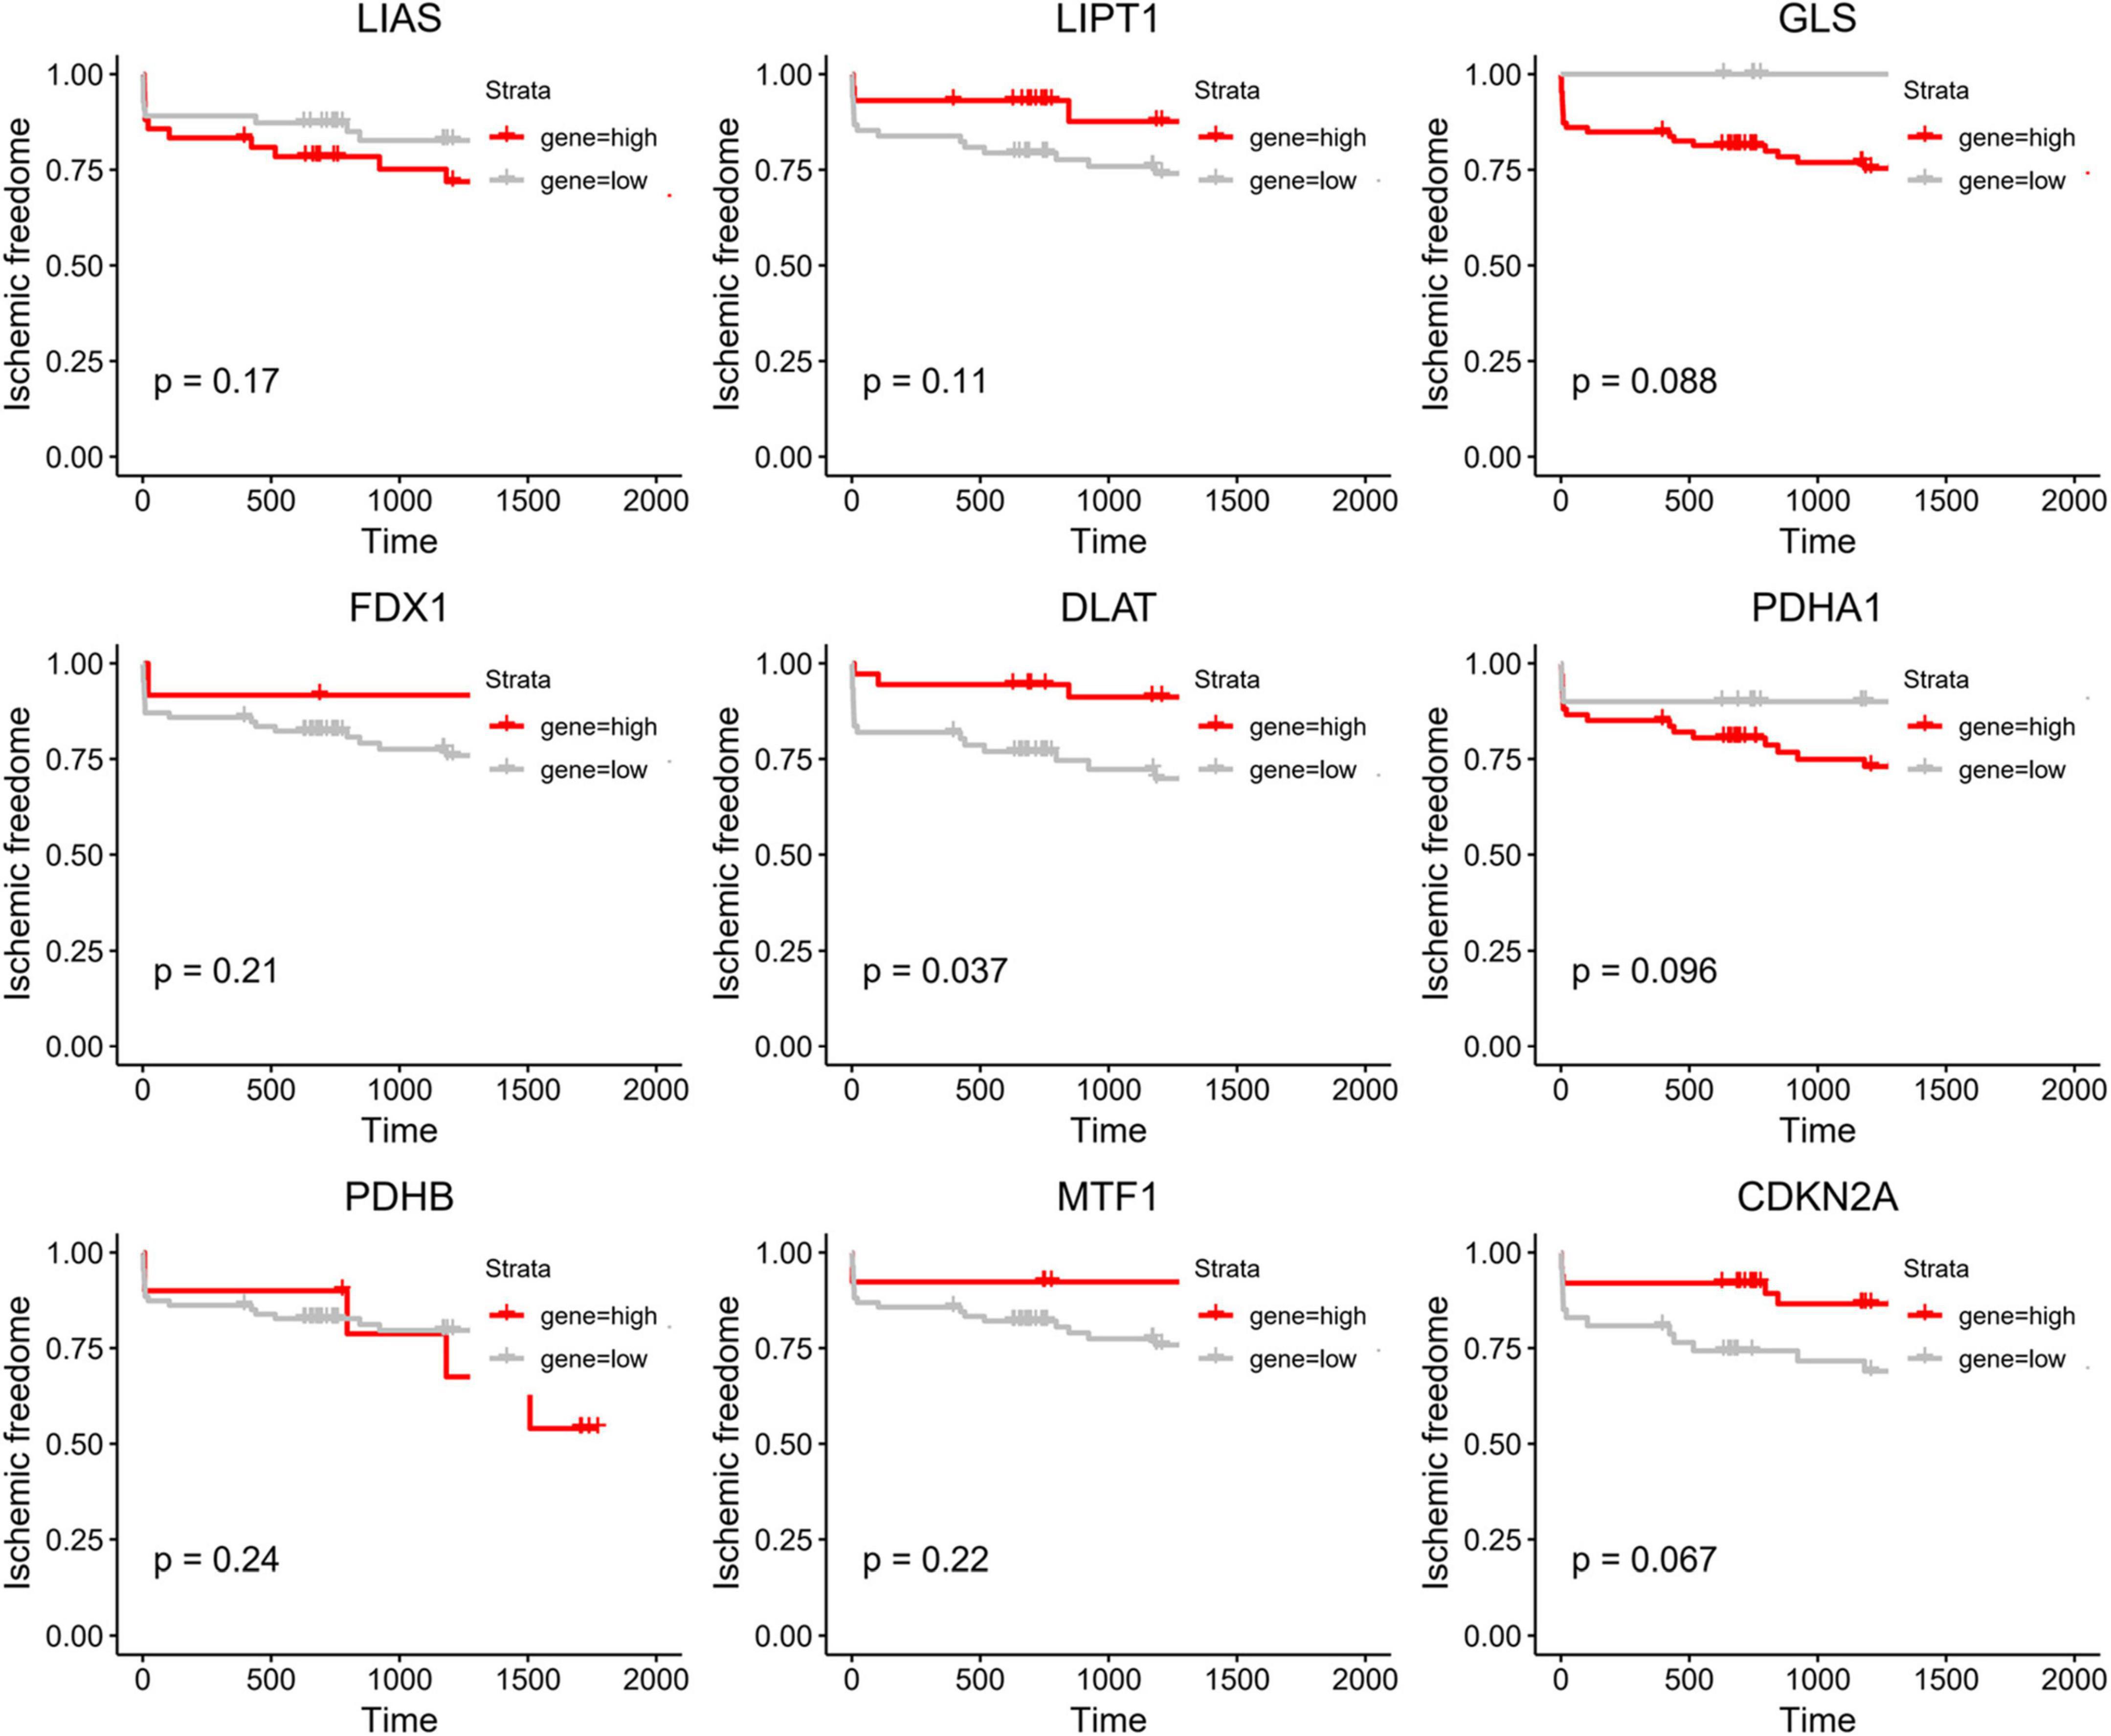
Figure 6. Kaplan–Meier curve of cuproptosis-related genes (CRGs).
Subsequently, we explored the diagnostic value of CRGs. Univariate logistic regression results showed that LIAS (OR: 0, 95% CI: 0–0.03, P < 0.001), LIPT1 (OR: 0.01, 95% CI: 0–0.06, P < 0.001), DLAT (OR: 0.03, 95% CI: 0–0.48, P = 0.01), PDHB (OR: 0.03, 95% CI: 0–0.18, P < 0.001), and GLS (OR: 0, 95% CI: 0–0.01, P < 0.001) were protective factors for AMI, while MTF1 (OR: 6.74, 95% CI: 2.09–21.76, P < 0.001) and CDKN2A (OR: 8.98, 95% CI: 1.15–70.36, P < 0.04) were risk factors for AMI (Figure 7A). Lasso analysis showed that three genes (LIAS, LIPT1, and GLS) were significantly different (Figures 7B,C). Multivariate logistic regression results suggested that only GLS was the protective factor for AMI (Figure 7D). According to ROC curve results, GLS could effectively distinguish AMI from stable_CAD (Figure 7E). The external data set validation results were consistent with the training set results (Figures 7F,G).
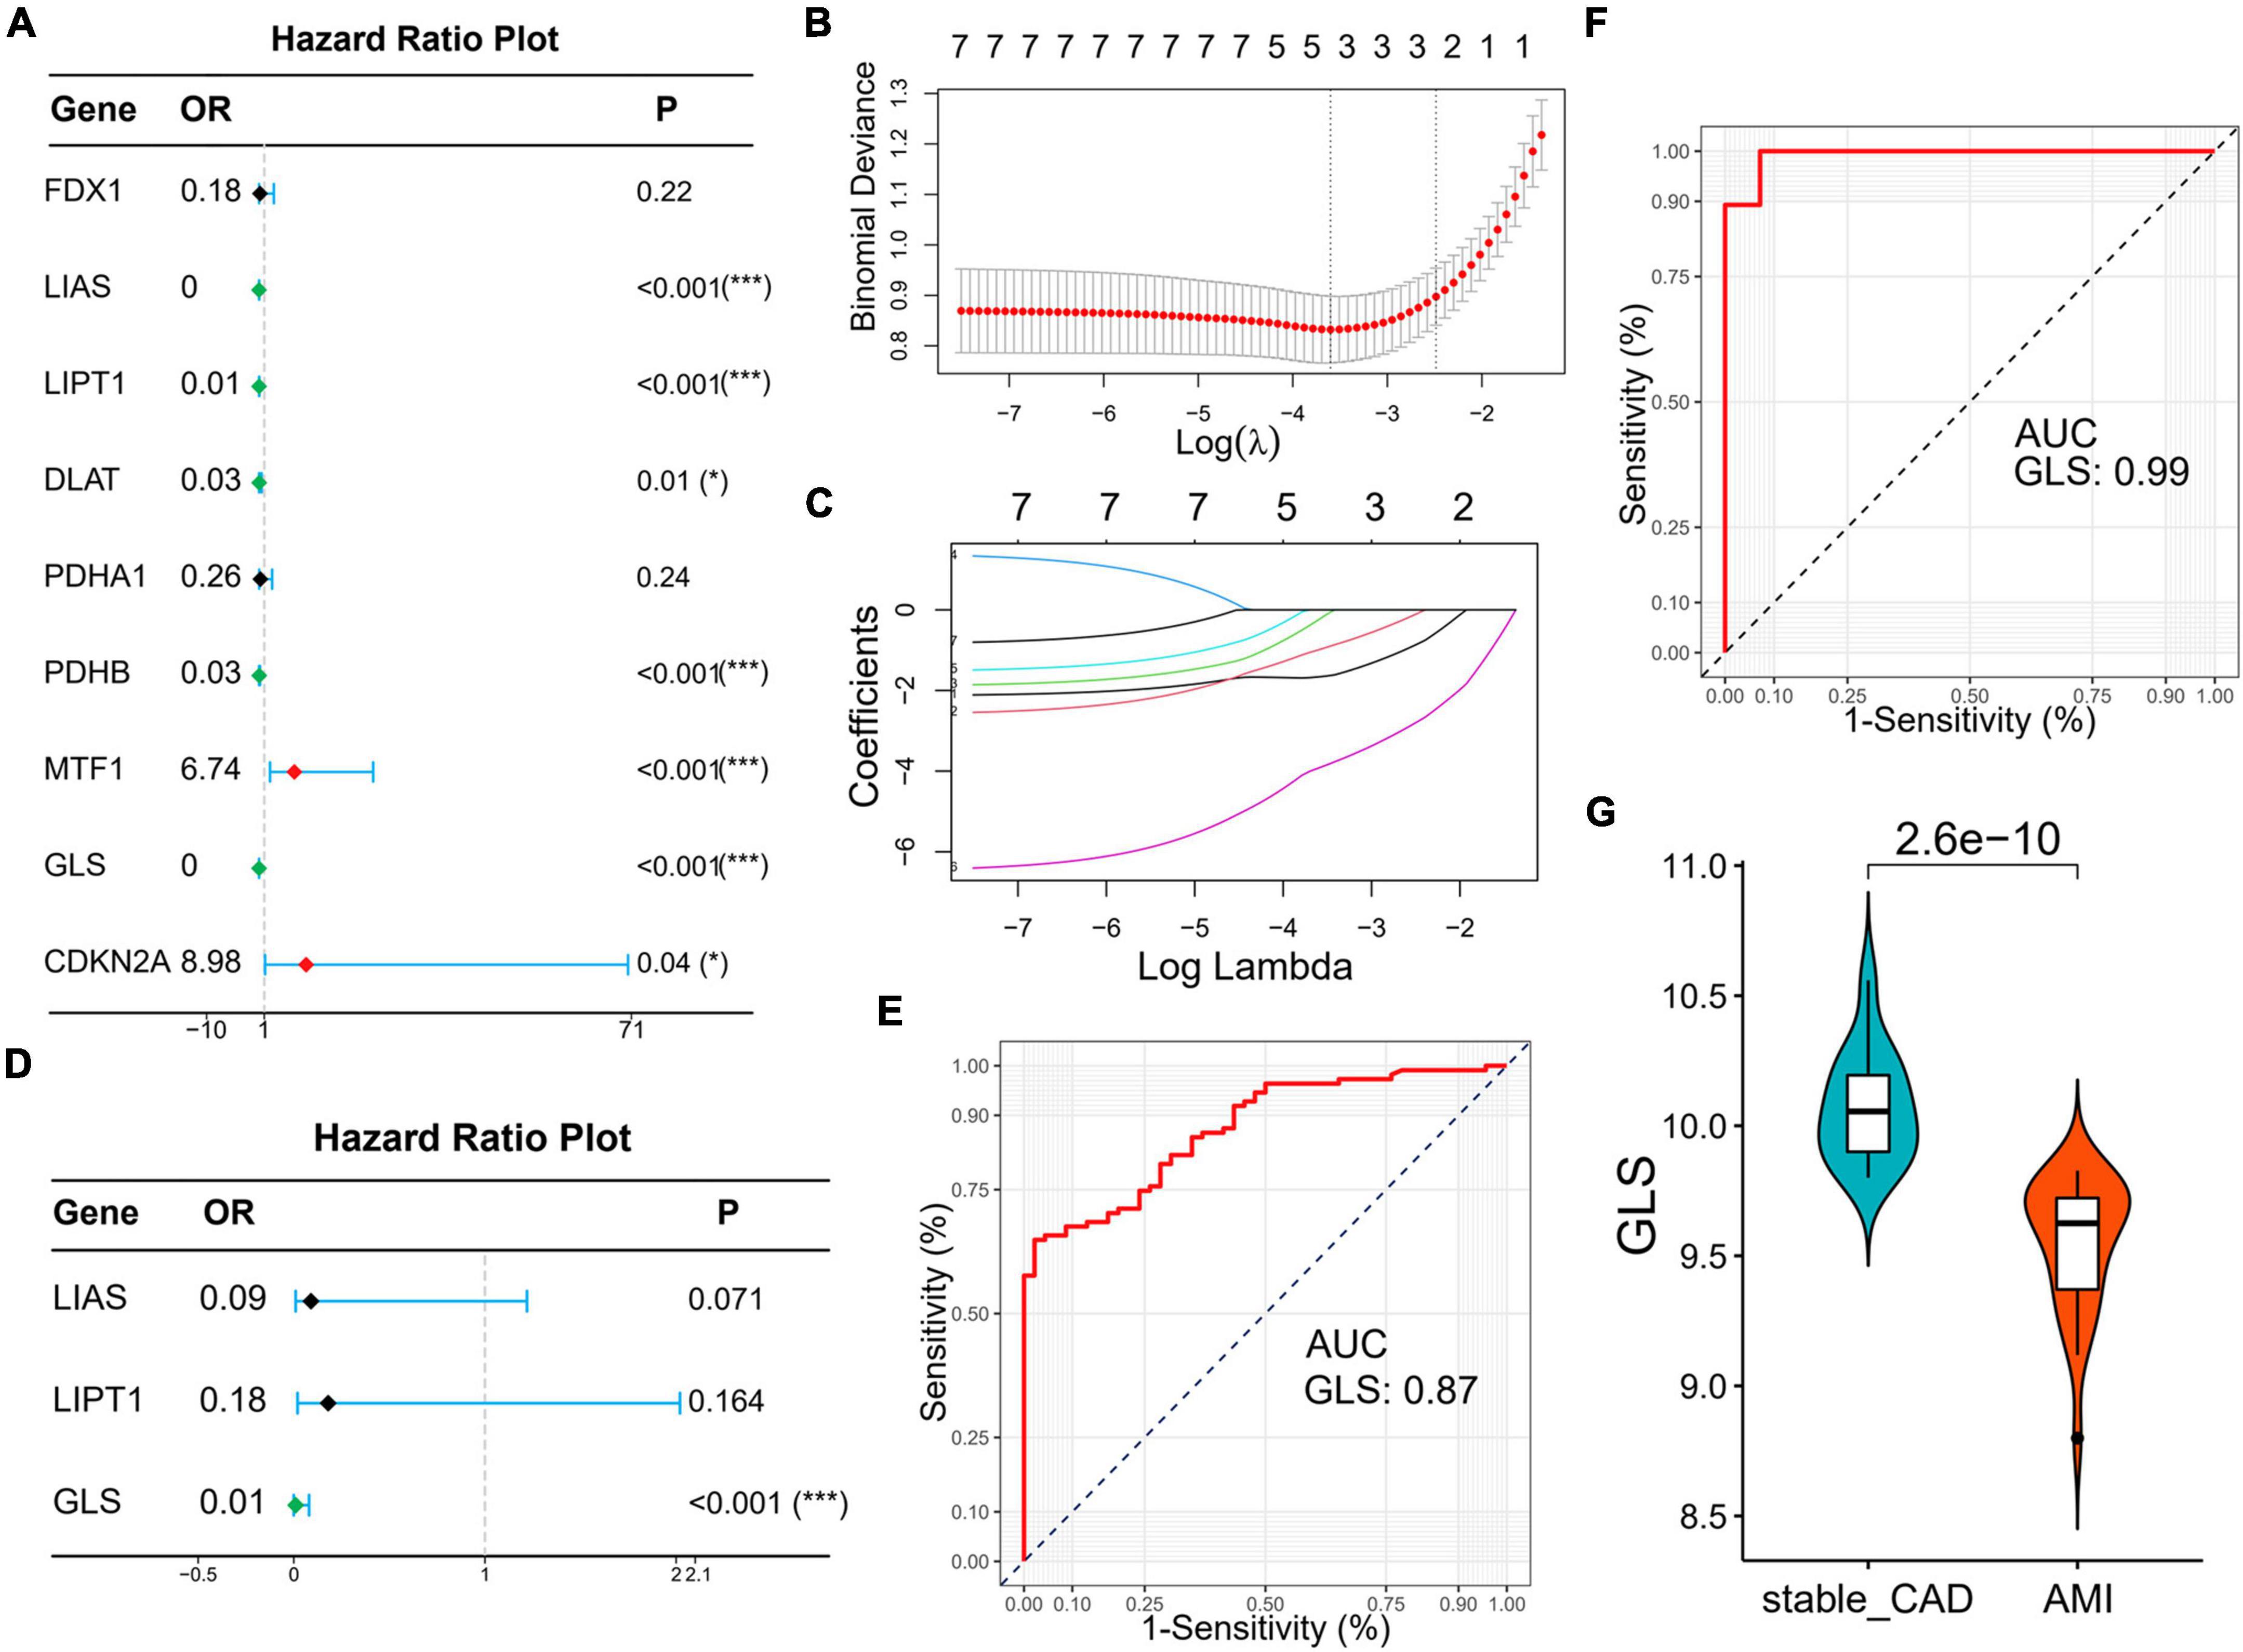
Figure 7. Identification of diagnostic markers for AMI based on logistic regression and lasso analysis. (A) The forest map of univariate logistic regression. (B) Log (Lambda) value of the seven genes in the lasso model. (C) The most proper log (Lambda) value in the lasso model. (D) The forest map of multivariate logistic regression. (E,F) The ROC curve of GLS in the training set and verification set, respectively. (G) The violin diagram of GLS differential expression is in the validation set (stable_CAD, stable coronary heart disease; AMI, acute myocardial infarction). *P < 0.05, ***P < 0.001.
Gene set enrichment analysis was used to further clarify the signaling pathways related to GLS expression. The results revealed that ribosome, herpes simplex virus 1 infection, spliceosome, and nucleocytoplasmic transport signaling pathways were enriched in the high expression group, while neuroactive ligand–receptor interaction, lysosome, neutrophil extracellular trap formation, osteoclast differentiation signaling pathways, tuberculosis, and parathyroid hormone synthesis, secretion, and action were enriched in the low expression group (Figure 8; Supplementary Table 7).
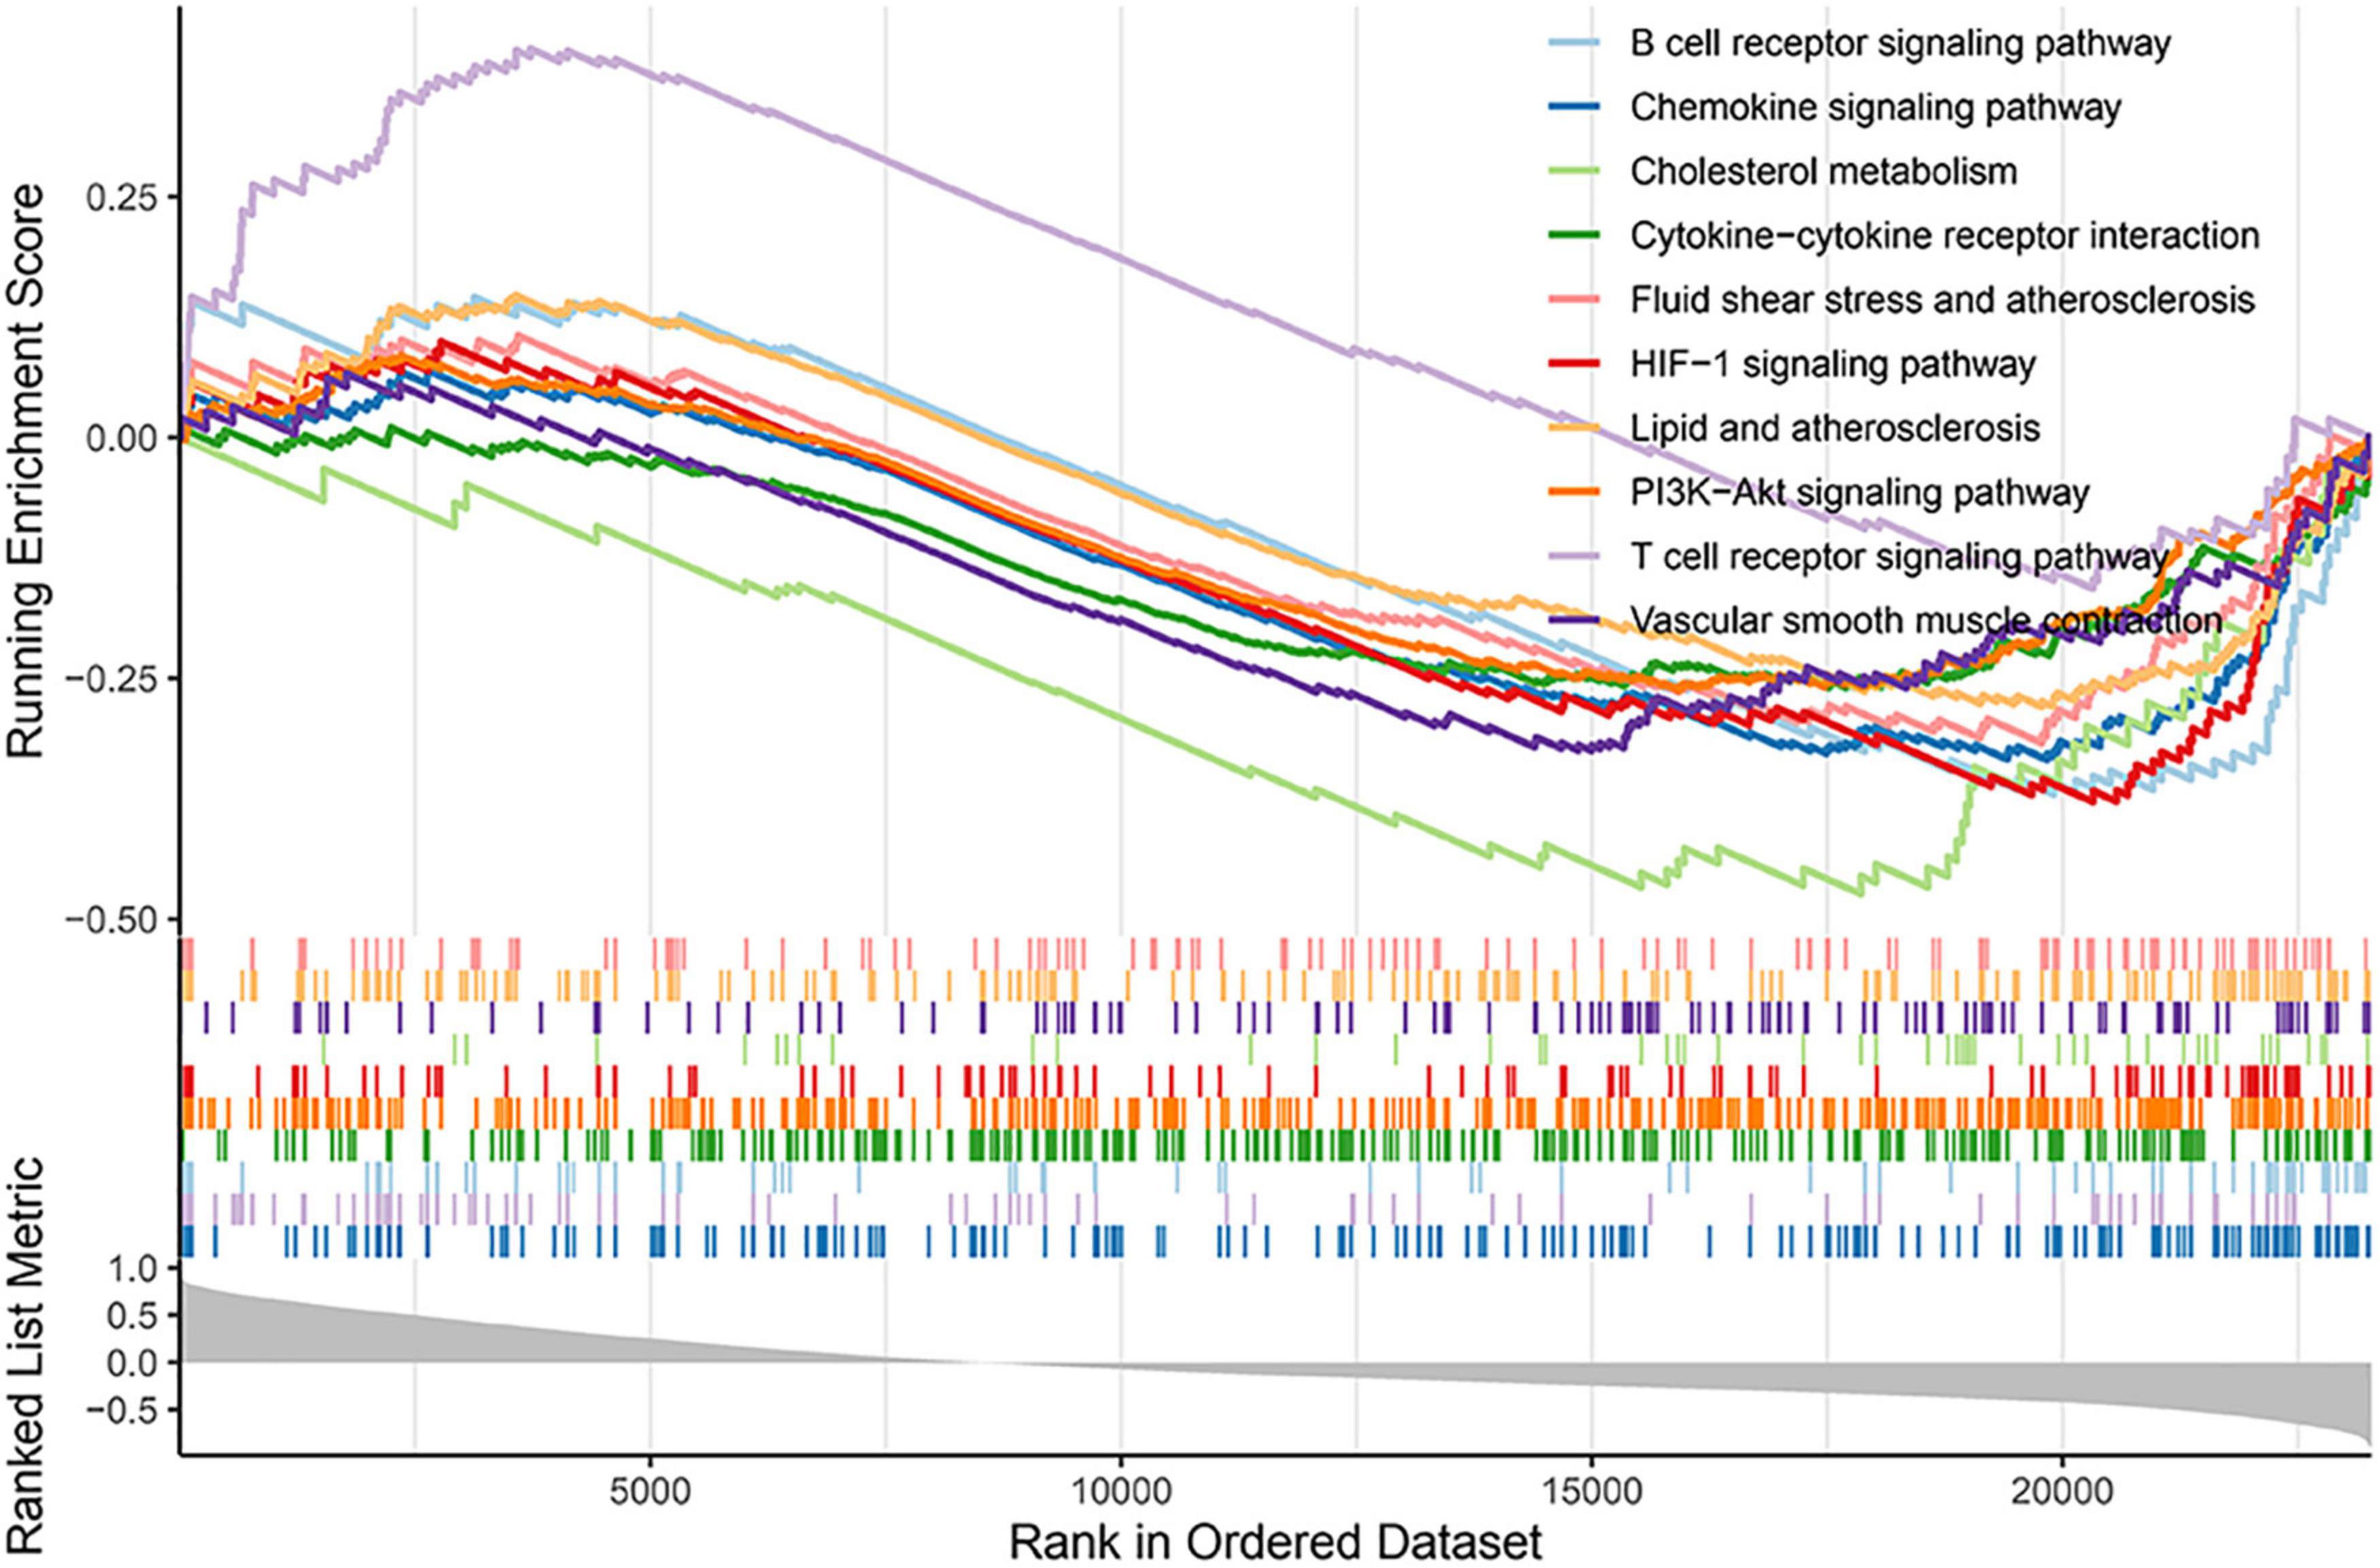
Figure 8. Gene set enrichment analysis (GSEA) results based on GLS expression.
A total of 23,320 genes and 2,223 cells were extracted from the GSE184073 data set after QC filtering. After reduction and clustering, these cells were divided into 12 clusters (Figure 9A). By further cell annotation, we obtained five types of myeloid cells (Figure 9B). In addition, we discovered that GLS is expressed in a variety of myeloid cells, excluding macrophages (Figure 9C). Finally, the differential analysis demonstrated that GLS expression in monocytes was significantly reduced in acute coronary syndrome (ACS) compared with stable angina pectoris (SAP) (Figure 9D).
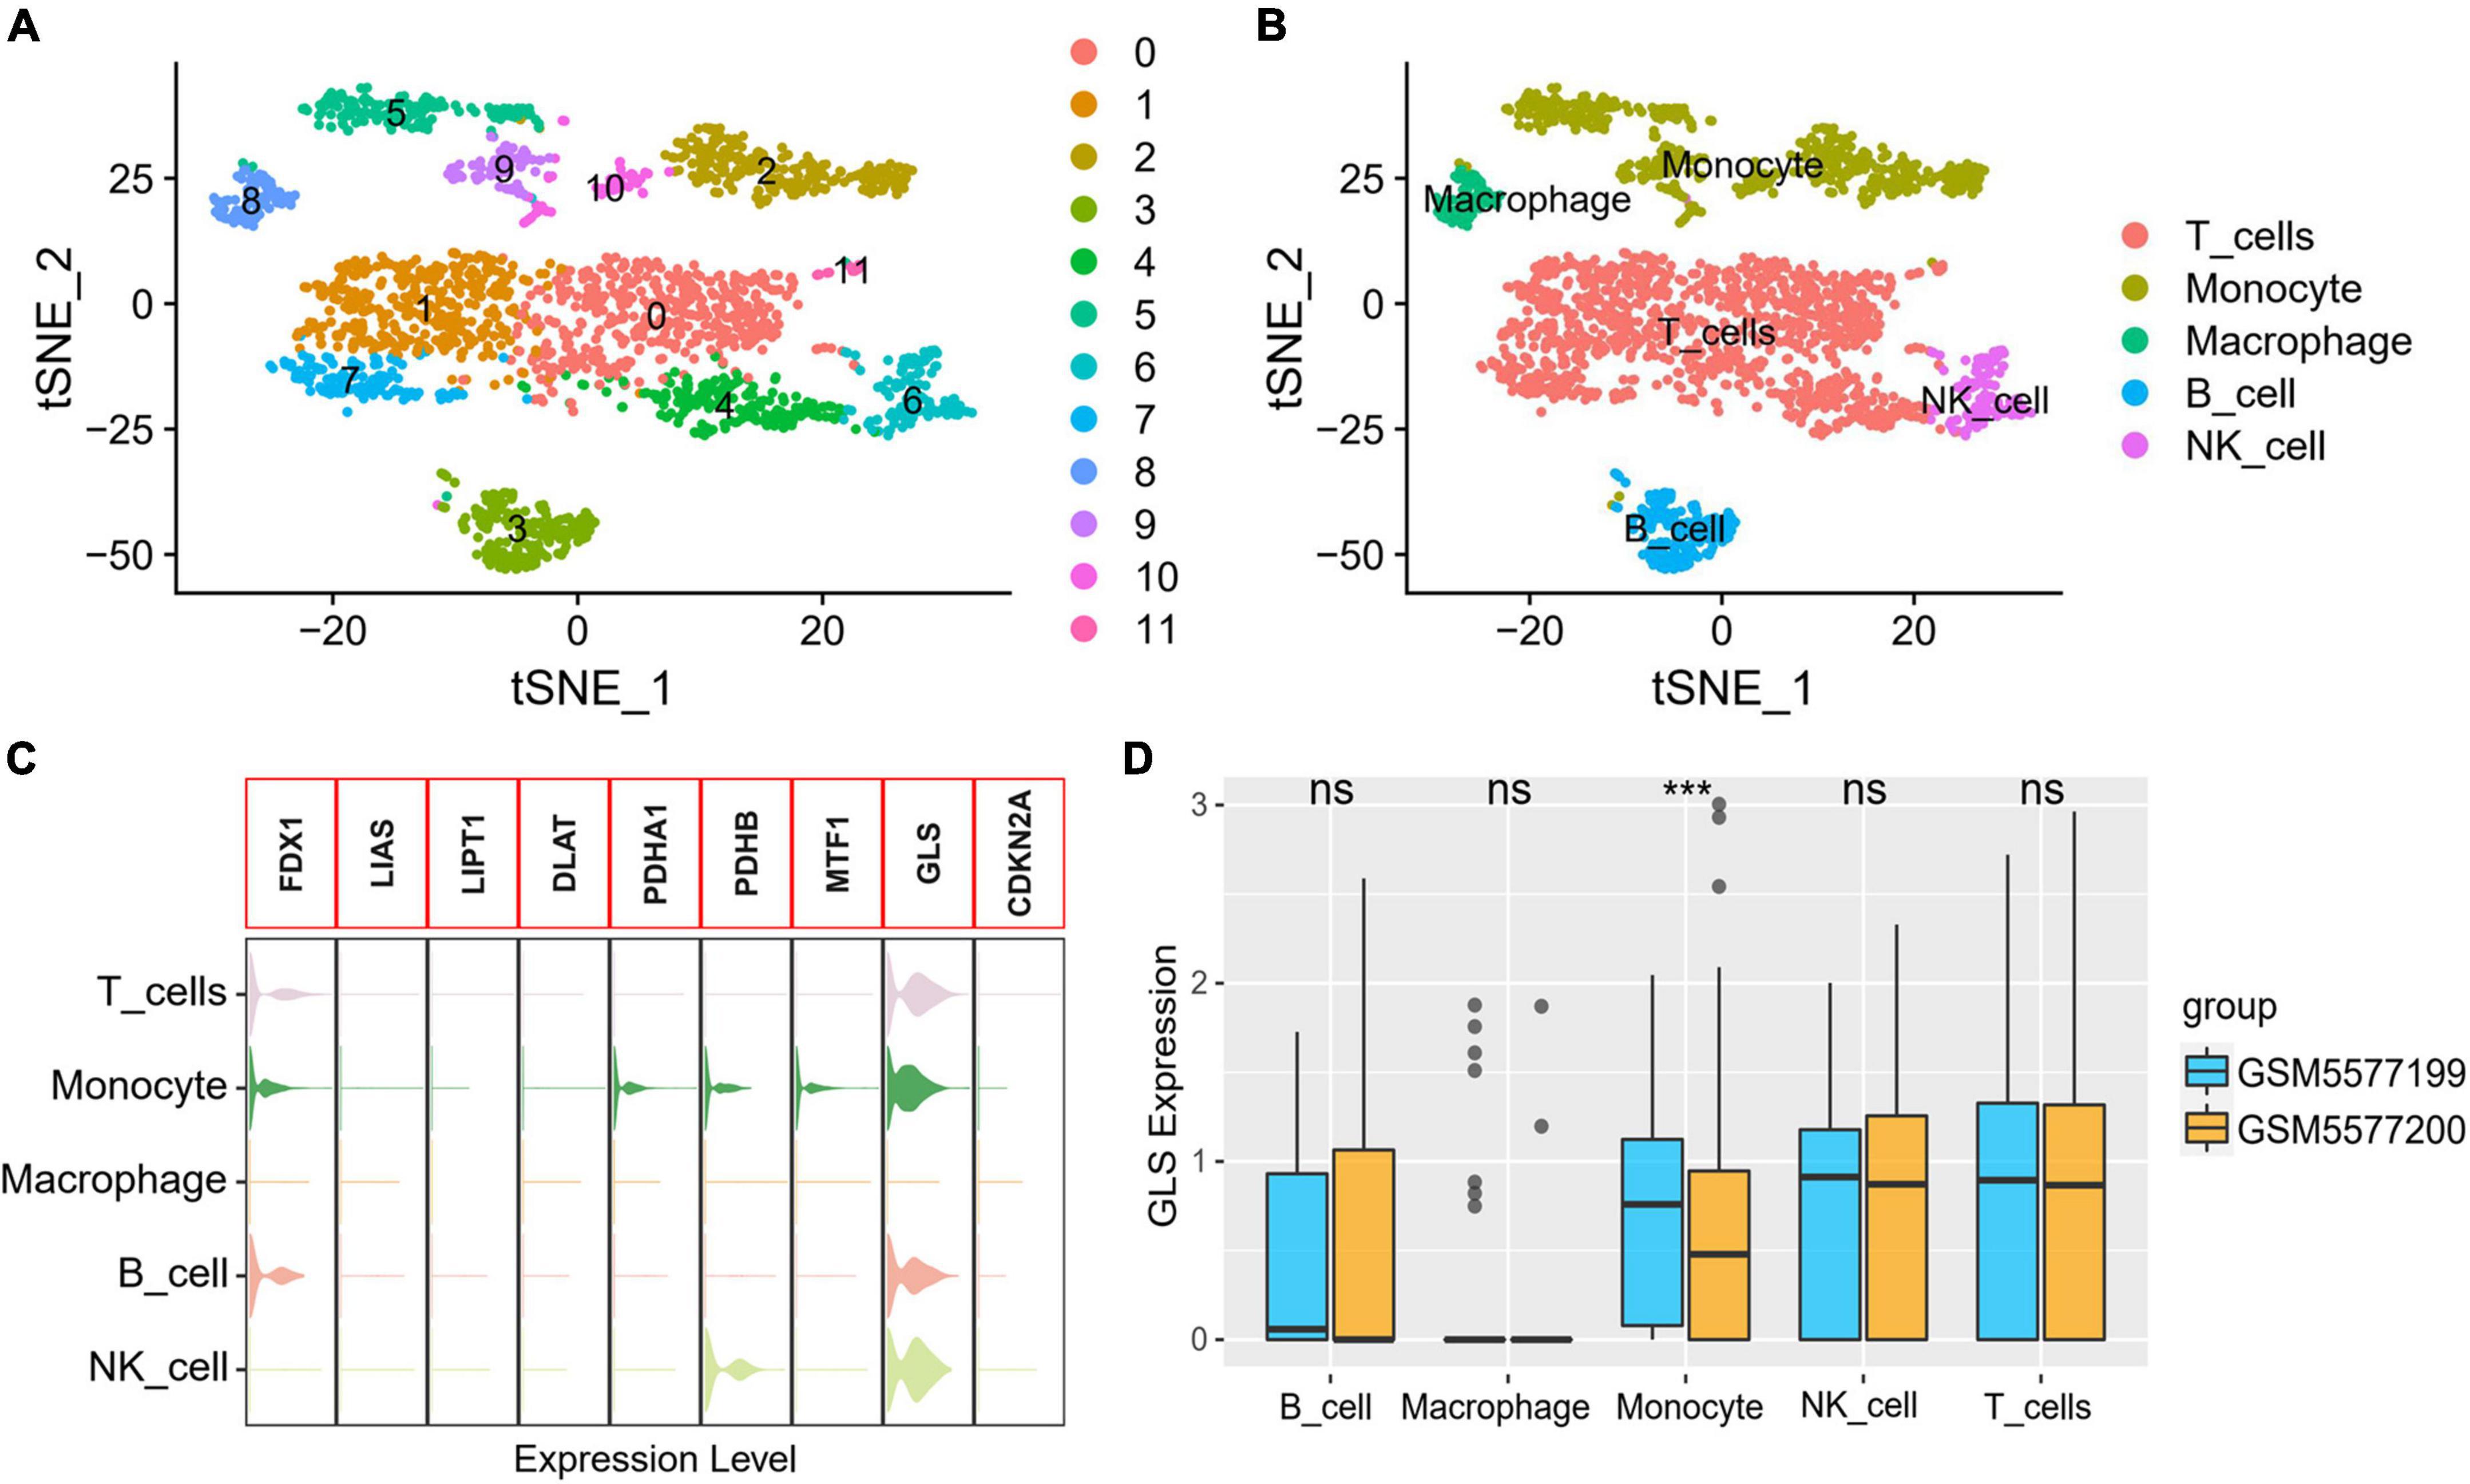
Figure 9. GLS expression in single-cell data. (A) Single-cell sequencing data dimensionality reduction, clustering results. (B) t-Distributed stochastic neighbor embedding (tSNE) visualization of cell annotation results. (C) Expression of CRGs in different cells. (D) Differential expression of GLS in five myeloid cells between two groups. ***P < 0.001.
In 2022, Tsvetkov et al. (17) reported cuproptosis, a form of cell death that is dependent on mitochondrial respiration, but there has been very little research on it in diseases. For the first time, we explore the diagnostic and prognostic value of CRGs and their possible regulatory mechanisms in AMI based on bioinformatics.
First, we performed PPI analysis and gene correlation analysis on CRGs. The results revealed that there was a close relationship between genes positively related to cuproptosis at the protein level. However, at the gene level, all CRGs were closely correlated with AMI. This suggests that there is a heterogeneity in the interactions of CRGs at the protein level and gene level or in different diseases. It was noteworthy that GLS had the largest positive correlation with LIAS and the largest negative correlation with MTF1, which is different from previous reports (17). We speculate that GLS may play different roles in different diseases. Second, we investigated the differences of CRGs between stable_CAD and AMI groups. The results showed that all genes except FDX1, PDHA1, and CDKN2A were significantly dysregulated between the two groups, implying that CRGs may be involved in the occurrence and development of AMI.
Macrophages play an important role in AMI. one–three days after the occurrence of AMI, macrophages derived from monocytes are recruited to the area of injury, and AM1 macrophages with pro-inflammatory effects produce inflammatory response to remove necrotic cell debris (35); then, between 4 and 7 days, M2 macrophages with repair function are used for tissue repair (36). During this process, macrophage polarization and inflammatory response directly alter the prognosis of patients. Studies have disclosed that energy metabolism of macrophages could regulate their polarization and inflammatory responses (37). M1 macrophages preferentially performed glycolysis, enhanced glycolysis derived higher inflammatory responses (38, 39), and inhibited glycolysis suppressed the increase of pro-inflammatory factors. However, M2 macrophages were preferred for TCA metabolic pathway. In conclusion, the regulation of macrophage energy metabolism can regulate macrophage polarization and inflammatory response. KEGG enrichment results indicated that CRGs were mainly involved in energy metabolism pathways such as TCA cycle, pyruvate metabolism, glycolysis/gluconeogenesis and carbon metabolism, and hypoxia-related pathways, such as HIF-1 signaling pathway. The results suggest that these metabolic pathways are expected to be therapeutic targets for AMI.
So far, there is increasing evidence that m6A is involved in the occurrence, development, and prognosis of AMI (32, 40, 41). A study showed that m6A level increased in mice at 4 weeks after AMI, and overexpression of FTO had a cardioprotective effect on AMI mice (32). In addition, FTO significantly reduced fibrosis and scar area in AMI mouse models, which were critical for preventing heart failure after AMI. Another study in a large sample of CAD patients and controls found that 304 m6A-SNPs were associated with CAD (40). The methylation level of m6A mRNA was increased in cardiomyocytes treated with hypoxia/reoxygenation and in IR-treated mice (41). Silencing METTL3 could reduce IR damage by enhancing autophagy and inhibiting apoptosis of H/R-treated credits, while ALKBH5 has the opposite effect to METTL3 (41). On the contrary, HNRNPA2B had been shown to regulate miRNA maturation and variable splicing in the nucleus (42). Recent research has found that FMR1 regulated RNA decay in an m6A-dependent manner (43). In summary, m6A plays an important role in various stages of AMI. Our study showed that there was a close interaction between CRGs and m6A-related genes, especially GLS and FMR1, MTF1, and HNRNPA2B.
Kaplan–Meier analysis showed that DLAT had prognostic value in ischemic events. Dihydrolipoamide S-acetyltransferase (DLAT) is an E2 subunit of the pyruvate dehydrogenase complex (PDC), which is a key enzyme in the catabolic glucose pathway (44). Studies had shown that DLAT was related to cell proliferation, and knocking down DLAT would inhibit cell proliferation by increasing intracellular pyruvate content (45). Moreover, compared with obese patients, DLAT expression was higher in the adipose tissue of healthy patients (46).
To gauge the diagnostic value of CRGs in AMI, COX combined lasso regression algorithm was used. The results showed that only GLS had diagnostic value. GLS, a substance essential for cellular energy metabolism, is responsible for the conversion of glutamine to glutamate. It converts glutamine into stoichiometric ammonia and glutamate after entering the mitochondria through glutamine transporters (47). Glutamate is used to produce adenosine triphosphate (ATP) by TCA cycle or for the synthesis of other amino acids and lipids, which are necessary for bioenergetics and biosynthesis (48). Up till the present moment, research on GLS has focused on oncology (49–51); however, the role in AMI is unclear. Our study suggests that GLS is a promising therapeutic target for AMI.
The ceRNA analysis revealed that eight CRGs (CDKN2A, DLAT, FDX1, GLS, LIAS, MTF1, PDHA1, and PDHB) and 175 miRNAs networks were constructed. Moreover, we analyzed GLS-related miRNAs through literature retrieval. We found that miR-23a-3p and miR-7-5p have been studied in AMI (52–54), but the regulatory mechanism of miR-335-5p in AMI remains unclear. Some studies have shown that miR-23a-3p could be used as a biomarker for ST-segment elevation AMI (52). Subsequently, mechanistic studies suggested that miR-23a-3p knockdown inhibited myocardial injury by curbing ferroptosis (54). Other studies had shown that miR-7-5p regulated the injury of hypoxic cardiomyocytes, and miR-7-5p upregulation promoted the injury of hypoxic H9c2 cells (53, 55). Therefore, the role of Mir-335-5p is worthy of further exploration in AMI.
Immune landscape and single-cell sequencing analysis indicated that GLS was closely related to monocytes. The research indicated that monocyte recruitment blocking was beneficial for the treatment of AMI, and the mechanism was mainly by inhibiting the inflammatory reaction (56). Our study discovered that GLS was negatively correlated with monocyte immune infiltration, and GLS expression was significantly decreased in ACS. We speculate that GLS may play a role in inhibiting monocyte infiltration and thus play an anti-AMI role.
Finally, we also investigated the biological functions and regulatory mechanisms of GLS. Interestingly, GSEA demonstrated that GLS was involved in immune-related signaling pathways, such as T-cell receptor signaling pathway and chemokine signaling pathway. Moreover, GLS was also involved in hypoxia-related pathways, such as HIF-1 signaling pathway, which was consistent with the analysis results of KEGG. Increasing evidence has indicated that immune response and hypoxia play an important role in the occurrence and development of AMI (21, 57, 58). For example, CD4 + T cells promoted myocardial ischemia–reperfusion injury through IFN-γ expression (59); CD8 + T cells induced by cytomegalovirus (CMV) infection participated in acute coronary events (60, 61); macrophage Smad3 signaling stimulated phagocytosis and regulated inflammation, which protected the infarction heart, reduced mortality (62); chemokines, such as CCL2 and CXCL12, were involved in cardiac injury, repaired and remodeled by dominating the inflammatory cascade (63, 64). Moreover, from the current experimental evidence, the activation and inactivation of HIF-1 signaling pathway played a protective role in the heart by participating in the regulation of apoptosis in injured regions (65). Therefore, we hypothesized that GLS may be involved in AMI by regulating the immune microenvironment through HIF-1 signaling pathway.
In conclusion, this research systematically investigated the molecular changes and interactive gene landscape of cuproptosis in AMI. Our research indicates that these CRGs may play a key role in the diagnosis and prognosis of AMI. GLS is likely to participate in the occurrence and development of AMI through the HIF-1 signaling pathway. However, the mechanism of GLS involvement in AMI still warrants further verification at the human, animal, and cellular levels. Even so, our results provide new insights into the diagnosis, prognosis, and therapy of AMI.
The original contributions presented in the study are included in the article/Supplementary material, further inquiries can be directed to the corresponding author.
Ethical review and approval was not required for the study on human participants in accordance with the local legislation and institutional requirements. Written informed consent from the patients/participants or patients/participants’ legal guardian/next of kin was not required to participate in this study in accordance with the national legislation and the institutional requirements.
ZL, LW, and QX were responsible for the design project. ZL, LW, YH, WL, and QY analyzed the data and visualized them. ZL, RL, and NH wrote and edited the manuscript. LW, QX, and XL were responsible for reviewing and correcting the manuscript. All authors contributed to the article and approved the submitted version.
This work was supported by the Natural Science Foundation of Hunan Province (Nos. 2022JJ30575, 2022JJ70127, and 2021JJ40549), the Hunan Traditional Chinese Medicine Scientific Research Project (No. 2021169), and the Scientific Research Project of Xiangtan Medical Association (Nos. 2020xtyx-23 and 2022-xtyx-21).
We would like to thank the authors for providing the data sets (GSE59867, GSE62646, and GSE21545). We thank Dr. Jianming Zeng (University of Macau) and all the members of his bioinformatics team, biotrainee, for generously sharing their experience and codes.
The authors declare that the research was conducted in the absence of any commercial or financial relationships that could be construed as a potential conflict of interest.
All claims expressed in this article are solely those of the authors and do not necessarily represent those of their affiliated organizations, or those of the publisher, the editors and the reviewers. Any product that may be evaluated in this article, or claim that may be made by its manufacturer, is not guaranteed or endorsed by the publisher.
The Supplementary Material for this article can be found online at: https://www.frontiersin.org/articles/10.3389/fcvm.2022.1016081/full#supplementary-material
AMI, acute myocardial infarction; CRGs, cuproptosis-related genes; stable_CAD, stable coronary heart disease; m6A, N6-methyladenosine; GO, gene ontology; BP, biological process; CC, cellular component; MF, molecular function; KEGG, Kyoto Encyclopedia of genes and genomes; AUC, area under curve; ROC, receiver operating characteristic; GSEA, gene set enrichment analysis; GEO, gene expression omnibus database; PPI, protein–protein interaction; TCA, tricarboxylic acid; ceRNA, competing endogenous RNA; TF, transcription factor; ATP, adenosine triphosphate; CMV, cytomegalovirus; CIBERSORT, cell-type identification by estimating relative subsets of RNA transcript; QC, quality control; PCA, principal component analysis; tSNE, t-distributed stochastic neighbor embedding; ACS, acute coronary syndrome; SAP, stable angina pectoris.
1. Mangion K, Gao H, Husmeier D, Luo X, Berry C. Advances in computational modelling for personalised medicine after myocardial infarction. Heart. (2018) 104:550–7. doi: 10.1136/heartjnl-2017-311449
2. Nichols M, Townsend N, Scarborough P, Rayner M. Cardiovascular disease in Europe 2014: epidemiological update. Eur Heart J. (2014) 35:2929. doi: 10.1093/eurheartj/ehu378
3. Gulati R, Behfar A, Narula J, Kanwar A, Lerman A, Cooper L, et al. Acute myocardial infarction in young individuals. Mayo Clin Proc. (2020) 95:136–56. doi: 10.1016/j.mayocp.2019.05.001
4. Anderson JL, Morrow DA. Acute myocardial infarction. N Engl J Med. (2017) 376:2053–64. doi: 10.1056/NEJMra1606915
5. Eapen ZJ, Tang WH, Felker GM, Hernandez AF, Mahaffey KW, Lincoff AM, et al. Defining heart failure end points in ST-segment elevation myocardial infarction trials: integrating past experiences to chart a path forward. Circ Cardiovasc Qual Outcomes. (2012) 5:594–600. doi: 10.1161/circoutcomes.112.966150
6. Drobni ZD, Alvi RM, Taron J, Zafar A, Murphy SP, Rambarat PK, et al. Association between immune checkpoint inhibitors with cardiovascular events and atherosclerotic plaque. Circulation. (2020) 142:2299–311. doi: 10.1161/circulationaha.120.049981
7. Xu L, Yin Y, Li Y, Chen X, Chang Y, Zhang H, et al. A glutaminase isoform switch drives therapeutic resistance and disease progression of prostate cancer. Proc Natl Acad Sci USA. (2021) 118:e2012748118. doi: 10.1073/pnas.2012748118
8. Naik V, Leaf EM, Hu JH, Yang HY, Nguyen NB, Giachelli CM, et al. Sources of cells that contribute to atherosclerotic intimal calcification: an in vivo genetic fate mapping study. Cardiovasc Res. (2012) 94:545–54. doi: 10.1093/cvr/cvs126
9. Cherepanova OA, Gomez D, Shankman LS, Swiatlowska P, Williams J, Sarmento OF, et al. Activation of the pluripotency factor OCT4 in smooth muscle cells is atheroprotective. Nat Med. (2016) 22:657–65. doi: 10.1038/nm.4109
10. Ramel D, Gayral S, Sarthou MK, Augé N, ègre-Salvayre AN, Laffargue M. Immune and smooth muscle cells interactions in atherosclerosis: how to target a breaking bad dialogue? Front Pharmacol. (2019) 10:1276. doi: 10.3389/fphar.2019.01276
11. Durham AL, Speer MY, Scatena M, Giachelli CM, Shanahan CM. Role of smooth muscle cells in vascular calcification: implications in atherosclerosis and arterial stiffness. Cardiovasc Res. (2018) 114:590–600. doi: 10.1093/cvr/cvy010
12. Aherrahrou R, Guo L, Nagraj VP, Aguhob A, Hinkle J, Chen L, et al. Genetic regulation of atherosclerosis-relevant phenotypes in human vascular smooth muscle cells. Circ Res. (2020) 127:1552–65. doi: 10.1161/circresaha.120.317415
13. Wolf D, Ley K. Immunity and inflammation in atherosclerosis. Circ Res. (2019) 124:315–27. doi: 10.1161/circresaha.118.313591
14. Frangogiannis NG. Pathophysiology of myocardial infarction. Compr Physiol. (2015) 5:1841–75. doi: 10.1002/cphy.c150006
15. Culotta V. Cell biology of copper. J Biol Inorg Chem. (2010) 15:1–2. doi: 10.1007/s00775-009-0601-x
16. Wernimont AK, Huffman DL, Lamb AL, O’Halloran TV, Rosenzweig AC. Structural basis for copper transfer by the metallochaperone for the Menkes/Wilson disease proteins. Nat Struct Biol. (2000) 7:766–71. doi: 10.1038/78999
17. Tsvetkov P, Coy S, Petrova B, Dreishpoon M, Verma A, Abdusamad M, et al. Copper induces cell death by targeting lipoylated TCA cycle proteins. Science. (2022) 375:1254–61. doi: 10.1126/science.abf0529
18. Cobine PA, Brady DC. Cuproptosis: cellular and molecular mechanisms underlying copper-induced cell death. Mol Cell. (2022) 82:1786–7. doi: 10.1016/j.molcel.2022.05.001
19. Liu J, Liu Y, Wang Y, Kang R, Tang D. HMGB1 is a mediator of cuproptosis-related sterile inflammation. Front Cell Dev Biol. (2022) 10:996307. doi: 10.3389/fcell.2022.996307
20. Ramachandra CJA, Hernandez-Resendiz S, Crespo-Avilan GE, Lin YH, Hausenloy DJ. Mitochondria in acute myocardial infarction and cardioprotection. EBioMedicine. (2020) 57:102884. doi: 10.1016/j.ebiom.2020.102884
21. Xiong YY, Gong ZT, Tang RJ, Yang YJ. The pivotal roles of exosomes derived from endogenous immune cells and exogenous stem cells in myocardial repair after acute myocardial infarction. Theranostics. (2021) 11:1046–58. doi: 10.7150/thno.53326
22. Maciejak A, Kiliszek M, Michalak M, Tulacz D, Opolski G, Matlak K, et al. Gene expression profiling reveals potential prognostic biomarkers associated with the progression of heart failure. Genome Med. (2015) 7:26. doi: 10.1186/s13073-015-0149-z
23. Kiliszek M, Burzynska B, Michalak M, Gora M, Winkler A, Maciejak A, et al. Altered gene expression pattern in peripheral blood mononuclear cells in patients with acute myocardial infarction. PLoS One. (2012) 7:e50054. doi: 10.1371/journal.pone.0050054
24. Folkersen L, Persson J, Ekstrand J, Agardh HE, Hansson GK, Gabrielsen A, et al. Prediction of ischemic events on the basis of transcriptomic and genomic profiling in patients undergoing carotid endarterectomy. Mol Med. (2012) 18:669–75. doi: 10.2119/molmed.2011.00479
25. Emoto T, Yamamoto H, Yamashita T, Takaya T, Sawada T, Takeda S, et al. Single-cell RNA sequencing reveals a distinct immune landscape of myeloid cells in coronary culprit plaques causing acute coronary syndrome. Circulation. (2022) 145:1434–6. doi: 10.1161/circulationaha.121.058414
26. Szklarczyk D, Franceschini A, Kuhn M, Simonovic M, Roth A, Minguez P, et al. The STRING database in 2011: functional interaction networks of proteins, globally integrated and scored. Nucleic Acids Res. (2011) 39:D561–8. doi: 10.1093/nar/gkq973
27. Wu T, Hu E, Xu S, Chen M, Guo P, Dai Z, et al. clusterProfiler 4.0: a universal enrichment tool for interpreting omics data. Innovation (N Y). (2021) 2:100141. doi: 10.1016/j.xinn.2021.100141
28. Newman AM, Liu CL, Green MR, Gentles AJ, Feng W, Xu Y, et al. Robust enumeration of cell subsets from tissue expression profiles. Nat Methods. (2015) 12:453–7. doi: 10.1038/nmeth.3337
29. Xia J, Gill EE, Hancock RE. NetworkAnalyst for statistical, visual and network-based meta-analysis of gene expression data. Nat Protoc. (2015) 10:823–44. doi: 10.1038/nprot.2015.052
30. Macosko EZ, Basu A, Satija R, Nemesh J, Shekhar K, Goldman M, et al. Highly parallel genome-wide expression profiling of individual cells using nanoliter droplets. Cell. (2015) 161:1202–14. doi: 10.1016/j.cell.2015.05.002
31. Aran D, Looney AP, Liu L, Wu E, Fong V, Hsu A, et al. Reference-based analysis of lung single-cell sequencing reveals a transitional profibrotic macrophage. Nat Immunol. (2019) 20:163–72. doi: 10.1038/s41590-018-0276-y
32. Mathiyalagan P, Adamiak M, Mayourian J, Sassi Y, Liang Y, Agarwal N, et al. FTO-dependent N(6)-methyladenosine regulates cardiac function during remodeling and repair. Circulation. (2019) 139:518–32. doi: 10.1161/circulationaha.118.033794
33. Han Z, Wang X, Xu Z, Cao Y, Gong R, Yu Y, et al. ALKBH5 regulates cardiomyocyte proliferation and heart regeneration by demethylating the mRNA of YTHDF1. Theranostics. (2021) 11:3000–16. doi: 10.7150/thno.47354
34. Shi X, Cao Y, Zhang X, Gu C, Liang F, Xue J, et al. Comprehensive analysis of N6-methyladenosine RNA methylation regulators expression identify distinct molecular subtypes of myocardial infarction. Front Cell Dev Biol. (2021) 9:756483. doi: 10.3389/fcell.2021.756483
35. Lee WW, Marinelli B, van der Laan AM, Sena BF, Gorbatov R, Leuschner F, et al. PET/MRI of inflammation in myocardial infarction. J Am Coll Cardiol. (2012) 59:153–63. doi: 10.1016/j.jacc.2011.08.066
36. Troidl C, Möllmann H, Nef H, Masseli F, Voss S, Szardien S, et al. Classically and alternatively activated macrophages contribute to tissue remodelling after myocardial infarction. J Cell Mol Med. (2009) 13:3485–96. doi: 10.1111/j.1582-4934.2009.00707.x
37. Zhao P, Zhou W, Zhang Y, Li J, Zhao Y, Pan L, et al. Aminooxyacetic acid attenuates post-infarct cardiac dysfunction by balancing macrophage polarization through modulating macrophage metabolism in mice. J Cell Mol Med. (2020) 24:2593–609. doi: 10.1111/jcmm.14972
38. Mills EL, Kelly B, Logan A, Costa ASH, Varma M, Bryant CE, et al. Succinate dehydrogenase supports metabolic repurposing of mitochondria to drive inflammatory macrophages. Cell. (2016) 167:457–470.e13. doi: 10.1016/j.cell.2016.08.064
39. Geeraerts X, Bolli E, Fendt SM, Van Ginderachter JA. Macrophage metabolism as therapeutic target for cancer, atherosclerosis, and obesity. Front Immunol. (2017) 8:289. doi: 10.3389/fimmu.2017.00289
40. Mo XB, Lei SF, Zhang YH, Zhang H. Detection of m(6)A-associated SNPs as potential functional variants for coronary artery disease. Epigenomics. (2018) 10:1279–87. doi: 10.2217/epi-2018-0007
41. Song H, Feng X, Zhang H, Luo Y, Huang J, Lin M, et al. METTL3 and ALKBH5 oppositely regulate m(6)A modification of TFEB mRNA, which dictates the fate of hypoxia/reoxygenation-treated cardiomyocytes. Autophagy. (2019) 15:1419–37. doi: 10.1080/15548627.2019.1586246
42. Liu C, Gu L, Deng W, Meng Q, Li N, Dai G, et al. N6-methyladenosine RNA methylation in cardiovascular diseases. Front Cardiovasc Med. (2022) 9:887838. doi: 10.3389/fcvm.2022.887838
43. Zhang G, Xu Y, Wang X, Zhu Y, Wang L, Zhang W, et al. Dynamic FMR1 granule phase switch instructed by m6A modification contributes to maternal RNA decay. Nat Commun. (2022) 13:859. doi: 10.1038/s41467-022-28547-7
44. Mathias RA, Greco TM, Oberstein A, Budayeva HG, Chakrabarti R, Rowland EA, et al. Sirtuin 4 is a lipoamidase regulating pyruvate dehydrogenase complex activity. Cell. (2014) 159:1615–25. doi: 10.1016/j.cell.2014.11.046
45. Goh WQ, Ow GS, Kuznetsov VA, Chong S, Lim YP. DLAT subunit of the pyruvate dehydrogenase complex is upregulated in gastric cancer-implications in cancer therapy. Am J Transl Res. (2015) 7:1140–51.
46. Chen S, Liu X, Peng C, Tan C, Sun H, Liu H, et al. The phytochemical hyperforin triggers thermogenesis in adipose tissue via a Dlat-AMPK signaling axis to curb obesity. Cell Metab. (2021) 33:565–580.e7. doi: 10.1016/j.cmet.2021.02.007
47. Song M, Kim SH, Im CY, Hwang HJ. Recent development of small molecule glutaminase inhibitors. Curr Top Med Chem. (2018) 18:432–43. doi: 10.2174/1568026618666180525100830
48. Moreadith RW, Lehninger AL. The pathways of glutamate and glutamine oxidation by tumor cell mitochondria. Role of mitochondrial NAD(P)+-dependent malic enzyme. J Biol Chem. (1984) 259:6215–21.
49. Matés JM, Campos-Sandoval JA, de Los Santos-Jiménez J, Segura JA, Alonso FJ, Márquez J. Metabolic reprogramming of cancer by chemicals that target glutaminase isoenzymes. Curr Med Chem. (2020) 27:5317–39. doi: 10.2174/0929867326666190416165004
50. de Los Santos-Jiménez J, Campos-Sandoval JA, Márquez-Torres C, Urbano-Polo N, Brøndegaard D, Martín-Rufián M, et al. Glutaminase isoforms expression switches microRNA levels and oxidative status in glioblastoma cells. J Biomed Sci. (2021) 28:14. doi: 10.1186/s12929-021-00712-y
51. Xu S I, Ilyas PJ, Little H, Li D, Kamato X, Zheng X, et al. Endothelial dysfunction in atherosclerotic cardiovascular diseases and beyond: from mechanism to pharmacotherapies. Pharmacol Rev. (2021) 73:924–67. doi: 10.1124/pharmrev.120.000096
52. Bukauskas T, Mickus R, Cereskevicius D, Macas A. Value of serum miR-23a, miR-30d, and miR-146a biomarkers in ST-elevation myocardial infarction. Med Sci Monit. (2019) 25:3925–32. doi: 10.12659/msm.913743
53. Shu L, Zhang W, Huang C, Huang G, Su G, Xu J. lncRNA ANRIL protects H9c2 cells against hypoxia-induced injury through targeting the miR-7-5p/SIRT1 axis. J Cell Physiol. (2020) 235:1175–83. doi: 10.1002/jcp.29031
54. Song Y, Wang B, Zhu X, Hu J, Sun J, Xuan J, et al. Human umbilical cord blood-derived MSCs exosome attenuate myocardial injury by inhibiting ferroptosis in acute myocardial infarction mice. Cell Biol Toxicol. (2021) 37:51–64. doi: 10.1007/s10565-020-09530-8
55. Hu D, Gu Y, Wu D, Zhang J, Li Q, Luo J, et al. Icariside II protects cardiomyocytes from hypoxia-induced injury by upregulating the miR-7-5p/BTG2 axis and activating the PI3K/Akt signaling pathway. Int J Mol Med. (2020) 46:1453–65. doi: 10.3892/ijmm.2020.4677
56. Wang Q, Wang K, Zhao X. Monocytes recruitment blocking synergizes with mesenchymal stem cell transplantation for treating myocardial infarction. Regen Med. (2021) 16:9–17. doi: 10.2217/rme-2020-0047
57. Hofmann U, Frantz S. Role of T-cells in myocardial infarction. Eur Heart J. (2016) 37:873–9. doi: 10.1093/eurheartj/ehv639
58. Chen B, Frangogiannis NG. Chemokines in myocardial infarction. J Cardiovasc Transl Res. (2021) 14:35–52. doi: 10.1007/s12265-020-10006-7
59. Yang Z, Day YJ, Toufektsian MC, Xu Y, Ramos SI, Marshall MA, et al. Myocardial infarct-sparing effect of adenosine A2A receptor activation is due to its action on CD4+ T lymphocytes. Circulation. (2006) 114:2056–64. doi: 10.1161/circulationaha.106.649244
60. Savva GM, Pachnio A, Kaul B, Morgan K, Huppert FA, Brayne C, et al. Cytomegalovirus infection is associated with increased mortality in the older population. Aging Cell. (2013) 12:381–7. doi: 10.1111/acel.12059
61. Hoffmann J, Shmeleva EV, Boag SE, Fiser K, Bagnall A, Murali S, et al. Myocardial ischemia and reperfusion leads to transient CD8 immune deficiency and accelerated immunosenescence in CMV-seropositive patients. Circ Res. (2015) 116:87–98. doi: 10.1161/circresaha.116.304393
62. Chen B, Huang S, Su Y, Wu YJ, Hanna A, Brickshawana A, et al. Macrophage Smad3 protects the infarcted heart, stimulating phagocytosis and regulating inflammation. Circ Res. (2019) 125:55–70. doi: 10.1161/circresaha.119.315069
63. Dewald O, Zymek P, Winkelmann K, Koerting A, Ren G, Abou-Khamis T, et al. CCL2/Monocyte Chemoattractant Protein-1 regulates inflammatory responses critical to healing myocardial infarcts. Circ Res. (2005) 96:881–9. doi: 10.1161/01.RES.0000163017.13772.3a
64. Saxena A, Fish JE, White MD, Yu S, Smyth JW, Shaw RM, et al. Stromal cell-derived factor-1alpha is cardioprotective after myocardial infarction. Circulation. (2008) 117:2224–31. doi: 10.1161/circulationaha.107.694992
Keywords: cuproptosis-related genes, acute myocardial infarction, immune landscape analysis, GLS, GSEA
Citation: Liu Z, Wang L, Xing Q, Liu X, Hu Y, Li W, Yan Q, Liu R and Huang N (2022) Identification of GLS as a cuproptosis-related diagnosis gene in acute myocardial infarction. Front. Cardiovasc. Med. 9:1016081. doi: 10.3389/fcvm.2022.1016081
Received: 10 August 2022; Accepted: 24 October 2022;
Published: 11 November 2022.
Edited by:
Turgay Celik, VM Medical Park Ankara (Keçiören), TurkeyCopyright © 2022 Liu, Wang, Xing, Liu, Hu, Li, Yan, Liu and Huang. This is an open-access article distributed under the terms of the Creative Commons Attribution License (CC BY). The use, distribution or reproduction in other forums is permitted, provided the original author(s) and the copyright owner(s) are credited and that the original publication in this journal is cited, in accordance with accepted academic practice. No use, distribution or reproduction is permitted which does not comply with these terms.
*Correspondence: Nan Huang, NjA0NTAxMjA3QHFxLmNvbQ==
†These authors have contributed equally to this work
Disclaimer: All claims expressed in this article are solely those of the authors and do not necessarily represent those of their affiliated organizations, or those of the publisher, the editors and the reviewers. Any product that may be evaluated in this article or claim that may be made by its manufacturer is not guaranteed or endorsed by the publisher.
Research integrity at Frontiers
Learn more about the work of our research integrity team to safeguard the quality of each article we publish.