- 1Department of Cardiology, Tehran Heart Center, Tehran University of Medical Sciences, Tehran, Iran
- 2Department of Research, Tehran Heart Center, Tehran University of Medical Sciences, Tehran, Iran
Background: Normal range values of right atrial (RA) phasic function markers are essential for the identification of normal and abnormal values, comparison with reference values, and the clinical meaning of obtained values. Accordingly, we aimed to define the normal range values of RA phasic function markers obtained by 2D speckle-tracking echocardiography through a meta-analysis and determine the main sources of heterogeneity among reported values.
Methods: PUBMED, SCOPUS, and EMBASE databases were searched for the following keywords: “right atrial/right atrium” and “strain/speckle/deformation” and “echocardiography.” Studies were selected that included a human healthy adult group without any cardiovascular diseases or risk factors and that were written in the English language. For the calculation of each marker of RA phasic functions, a random-effect model was used. Meta-regression was employed to define the major sources of variabilities among reported values.
Results: Fifteen studies that included 2,469 healthy subjects were selected for analysis. The normal range values for RA strain and strain rate were 42.7% (95% CI, 39.4 to 45.9%) and 2.1 s−1 (95% CI, 2.0 to 2.1 s−1) during the reservoir phase, respectively, 23.6% (95% CI, 20.7 to 26.6%) and −1.9 s−1 (95% CI, −2.2 to −1.7 s−1) during the conduit phase, correspondingly, and 16.1% (95% CI, 13.6 to 18.6%) and −1.8 s−1 (95% CI, −2.0 to −1.5 s−1) during the contraction phase, respectively. The sources of heterogeneity for the normal range of these markers were the number of participants, the type of software, the method of global value calculation, the right ventricular fractional area change, the left ventricular (LV) ejection fraction, the RA volume index, sex, the heart rate, the diastolic blood pressure, the body mass index, and the body surface area.
Conclusions: Using 2D speckle-tracking echocardiography, we defined normal values for RA phasic function markers and identified the sources of heterogeneity as demographic, anthropometric, hemodynamic, and echocardiography factors.
Systematic Review Registration: https://www.crd.york.ac.uk/prospero/display_record.php?ID=CRD42021236578, identifier: CRD42021236578.
Introduction
The right atrium (RA) is pivotal for blood entrance to the heart. It manages not only right ventricular (RV) filling during diastole by reserving the blood during systole but also the delivery of the stored blood during early diastole and further RV filling by contraction in late diastole. Unlike the left atrium (LA), the RA interacts with a lower pressure chamber, the RV, which has less myocardial mass than the LV (1).
RA phasic functions can be evaluated by several methods such as echocardiography and cardiac magnetic resonance (2, 3). Nonetheless, echocardiography has been the main method for the assessment of RA phasic functions because of its availability and low cost. Consequently, the recent decades have witnessed the advent of several echocardiographic modalities for the evaluation of RA phasic functions (4, 5). Among these modalities, 2D speckle-tracking echocardiography (2DSTE) is prominent because of its angle independence when compared with tissue Doppler imaging, low load dependency when compared with volumetric methods in normal subjects, and relative resistance against translational motion (6–8). The 2DSTE modality can evaluate RA phasic functions in healthy subjects and demonstrate impairment in various disorders such as diabetes and pulmonary hypertension (4, 9–23). This echocardiographic modality also has a prognostic role in pulmonary hypertension and post-myocardial infarction events (24–26). Comparison between feature-tracking magnetic resonance imaging and 2DSTE demonstrates a good agreement between these two methods in the assessment of the deformation parameters of RA phasic functions (27). Although there is a consensus regarding how to measure the deformation indices of RA phasic functions by 2DSTE (28), the lack of a normal reference range for comparison impedes more clinical usage of this method.
In this study, we drew upon a systematic review and a meta-analysis to obtain the normal ranges of various 2DSTE-derived markers of RA phasic functions and to clarify the main sources of heterogeneity in their reported values.
Methods
Search Profile
On April 29, 2021, we searched PUBMED, SCOPUS, and EMBASE databases via the following keywords: “right atrial/right atrium” and “strain/speckle/deformation” and “echocardiography”. The search was limited to studies in the English language (Supplementary Material 1). References were also searched to find other related studies. We applied the Preferred Reporting Items for Systematic Reviews and Meta-Analyses (PRISMA) guidelines (29). On March 13, 2021, our study was recorded in the Prospero database (CRD42021236578).
Study Selection
The inclusion criteria were composed of the evaluation of the RA by 2DSTE or velocity vector imaging and the inclusion of a normal healthy control group without any cardiovascular diseases or risk factors. The exclusion criteria consisted of animal studies, conference articles, case reports, editorials, letters to the editor, review articles, articles without abstracts, the inclusion of subjects below 18 years of age, and RA evaluation by tissue Doppler imaging. Also excluded were studies that used the same data set. (The exception was one article featuring a large study population). If articles had the same number of subjects, the article citing the gating for measurements was selected. Additionally, studies that presented the values separately for sex subgroups were excluded. The titles and abstracts of the studies selected from the aforementioned databases were reviewed by three independent researchers (R.M., R.M.B., and A.H.). Discordances among the reviewers were resolved by discussion between A.H. and T.D.
Data Collection
R.M., R.M.B., and A.H. independently reviewed the full text of the eligible studies. The demographic characteristics, clinical information, and echocardiography data (including the deformation markers of RA phasic functions) of the control group were recorded. Discordances between the three aforementioned researchers were resolved through discussion between A.H. and T.D. The studies that seemed to have used the same or overlap data sets were excluded. (The exception was one article, the control group of which had the highest number of subjects of all the studies).
Statistical Analysis
Stata software, Release 16 (College Station, TX: StataCorp LLC), was used for statistical analysis. A random-effects model was employed to calculate the mean and the 95% confidence interval (CI) for each phasic strain and strain rate. Heterogeneity and inconsistency among the selected studies were assessed by Cochrane's Q test (P < 0.1) and I2 statistic, respectively. The results pertaining to each phasic strain and strain rate were demonstrated as forest plots. Reported demographic characteristics, clinical findings, and echocardiography data were considered sources of heterogeneity concerning each phasic strain and strain rate, and the effects of these variables on the variation of the normal range of each phasic strain and strain rate were assessed by meta-regression. Through a comparison between the results of the random-effects model and a fixed-effects model, the stability of the estimated normal range for each phasic strain and strain rate was checked. Egger's test (P < 0.1) and funnel plots were utilized to evaluate publication bias.
The criteria recommended by Downs and Black for the evaluation of the quality (internal and external validity) of studies were drawn upon (30). Well-defined methods were used in the reporting of inter and intraobserver variabilities, the heart rate, systolic and diastolic blood pressures, the phasic strain, and the phasic strain rate. The blindness of the operator who obtained images and the echocardiographer who analyzed videos was considered an additional criterion for quality in keeping with previously published systematic reviews and meta-analyses in this context. R.M., R.M.B., and A.H. independently checked the quality of the studies selected, and the differences in their assessments were resolved through an agreement between A.H. and T.D.
Results
Study Selection
The PRISMA diagram of our study is presented in Figure 1. Our database search yielded 3,190 studies. Following the exclusion of duplicate studies, 2,442 studies were selected for title and abstract review. Eighty-nine studies were identified as suitable for full-text review. Our reference search failed to identify any other studies.
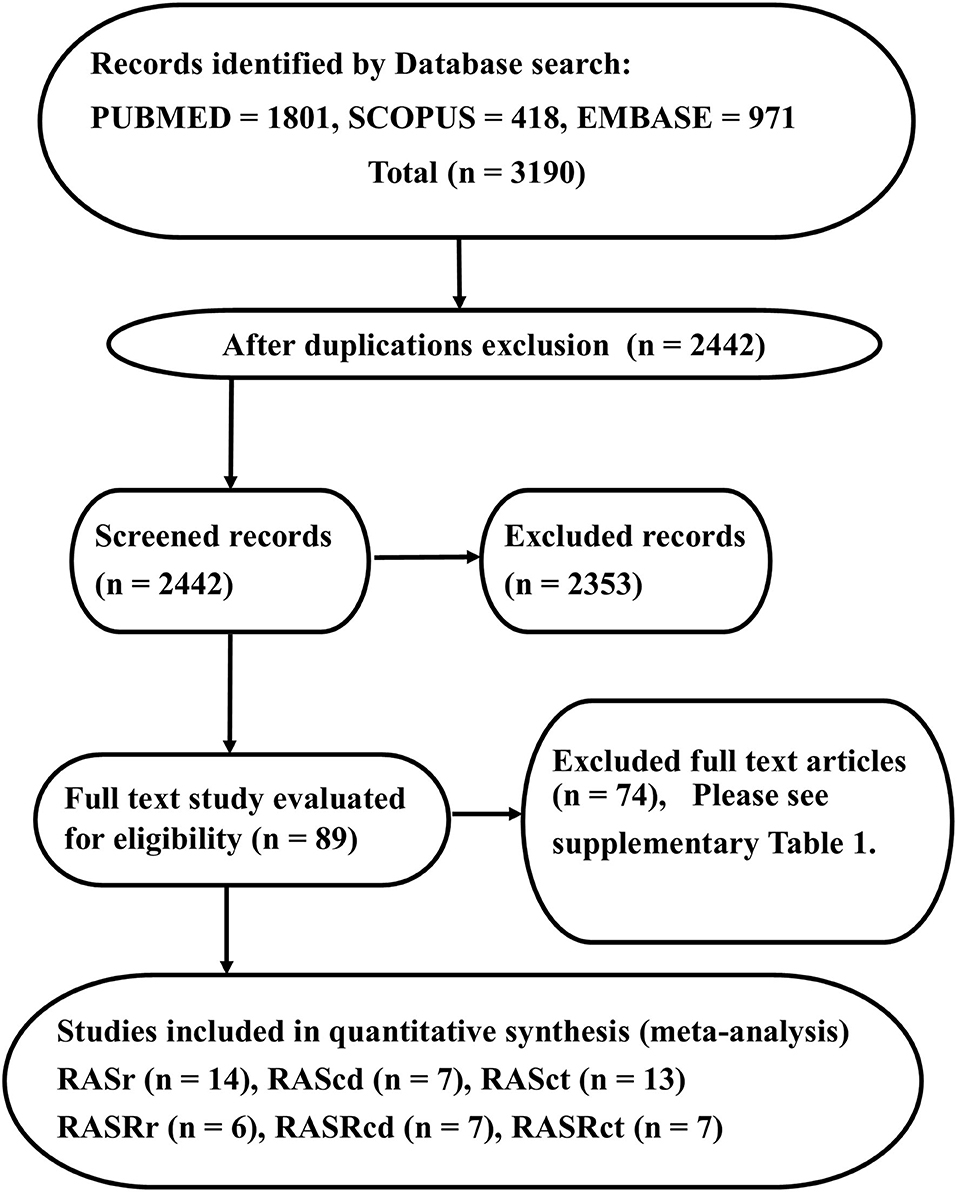
Figure 1. The image presents the study design and the Preferred Reporting Items for Systematic Reviews and Meta-Analyses flowchart, illustrating the selection process of studies. The reasons for full-text exclusion are demonstrated in Supplementary Table 1.
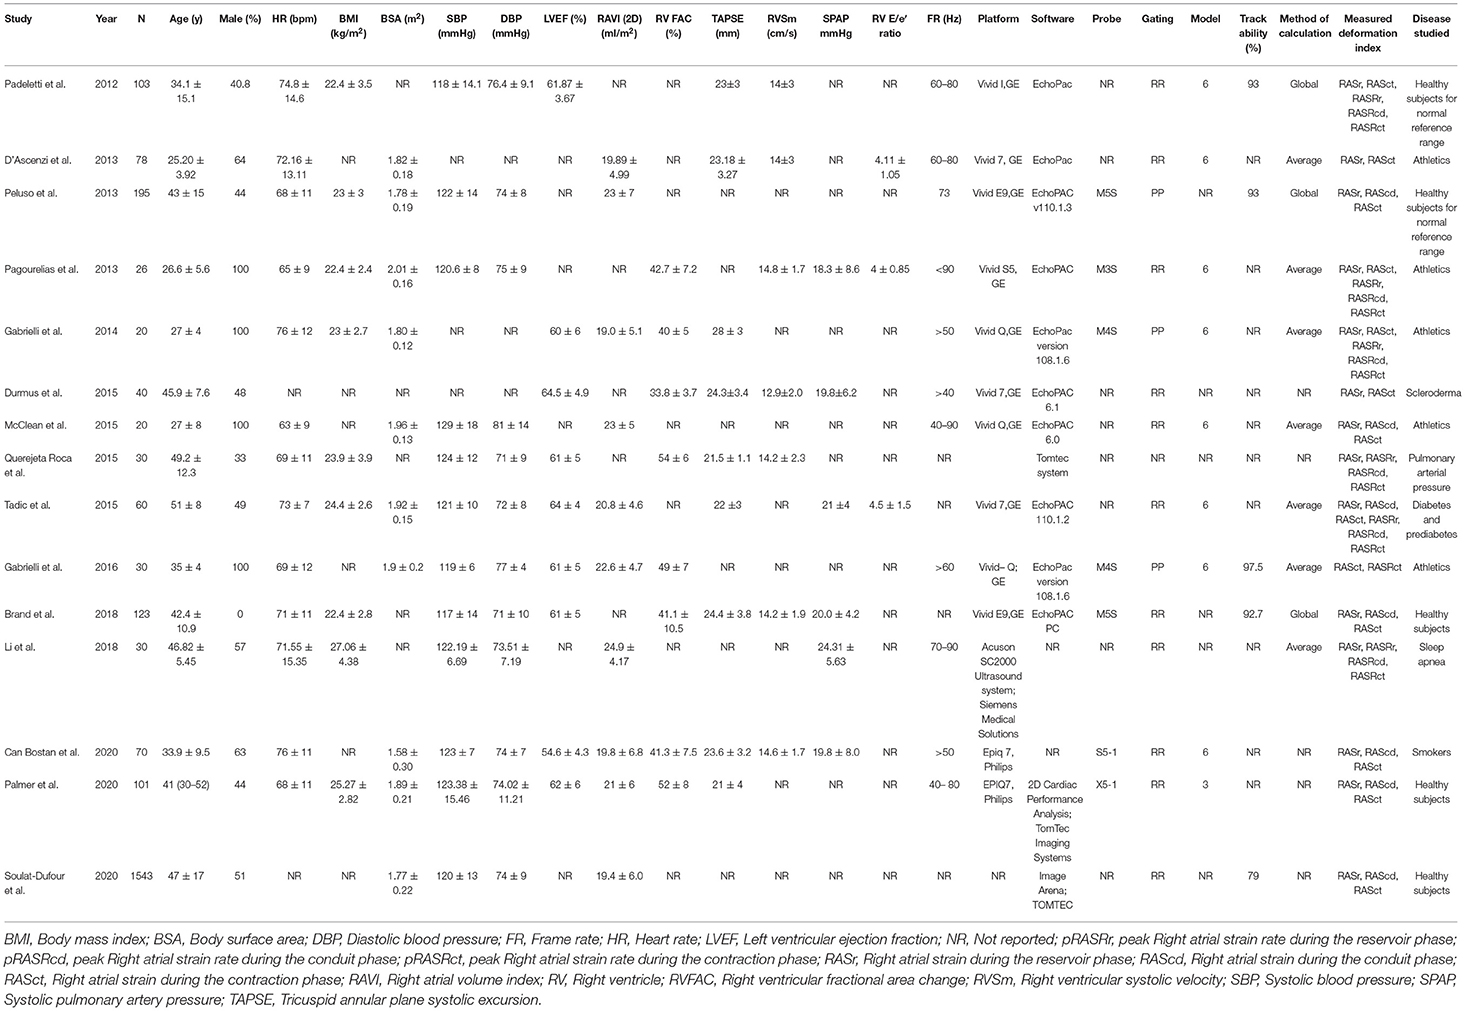
Next, 74 studies were excluded (Supplementary Table 1), and 15 studies were considered eligible for further analysis. Fourteen studies (2,469 subjects) featured RA strain assessment during the reservoir phase (RASr), seven studies (2,112 subjects) assessed RA strain during the conduit phase (RAScd), 13 studies (2,409 subjects) offered RA strain assessment during the contraction phase (RASct), six studies (269 subjects) evaluated the peak RA strain rate during the reservoir phase (pRASRr) and the peak RA strain rate during the conduit phase (pRASRcd), and seven studies (299 subjects) presented peak RA strain rate assessment during the contraction phase (pRASRct) (Table 1). The mean age of the participants in these studies ranged between 25 and 51 years, and male subjects comprised a range from 0 to 100%.
The Normal Ranges of RA Phasic Strain and Strain Rate
Reservoir Function Markers
The reported mean normal value for RASr was 42.7% (95% CI, 39.4 to 45.9%), which ranged from 32.0 to 56.9%. Inter-study heterogeneity (Q = 289; P < 0.01) and inconsistency (I2 = 97.7%) were significant. The fixed-effects model demonstrated a mean RASr value of 43.7% (95% CI, 43.2 to 44.1%) (Figure 2).
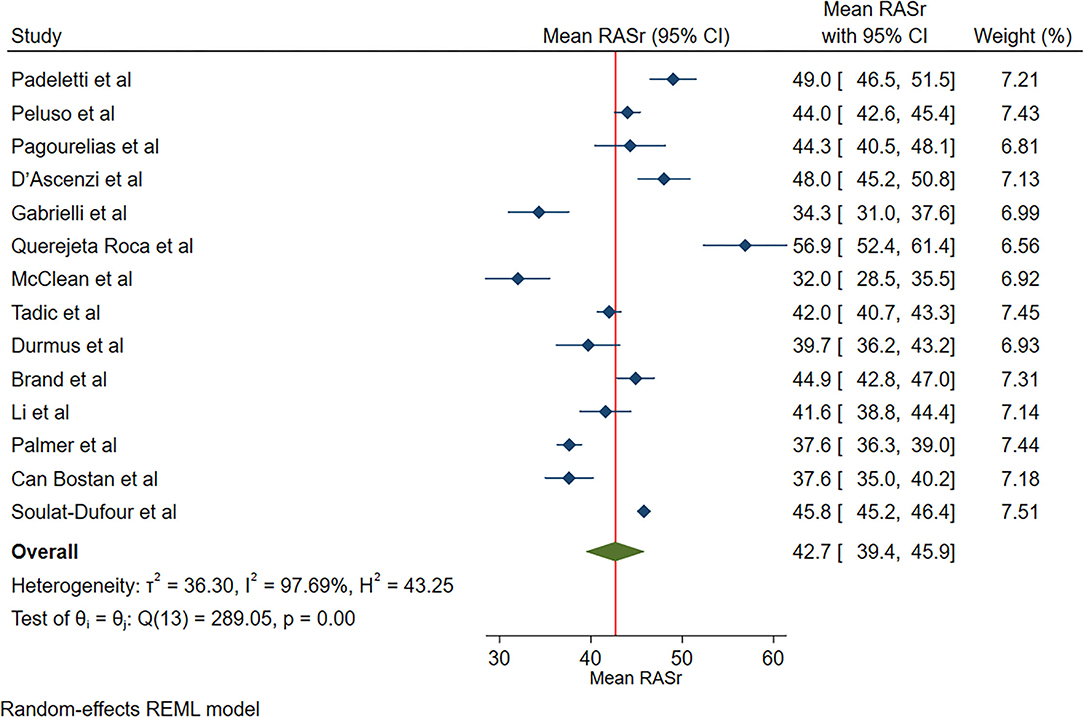
Figure 2. The image demonstrates the normal range of the longitudinal 2D speckle-tracking echocardiography-derived right atrial strain during the reservoir phase.
The reported mean normal value for pRASRr was 2.1 s−1 (95% CI, 2.0 to 2.1 s−1). The normal range of RASRr varied between 2.0 and 2.2 s−1. Inter-study heterogeneity (Q = 5; P = 0.44) and inconsistency (I2 = 6.9%) were non-significant. The fixed-effects model demonstrated a mean value pRASRr value of 2.1 s−1 (95% CI, 2.0 to 2.1 s−1) (Figure 3).
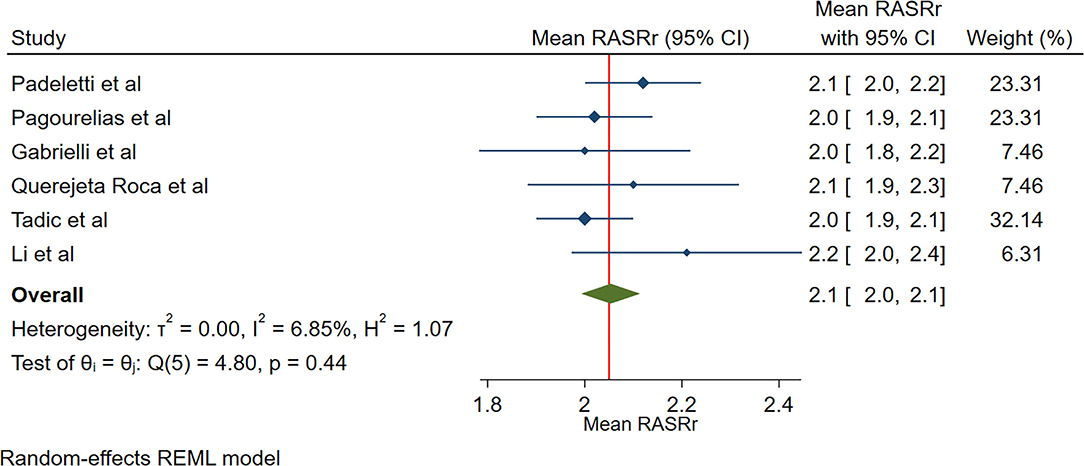
Figure 3. The image demonstrates the normal range of the longitudinal 2D speckle-tracking echocardiography-derived peak right atrial strain rate during the reservoir phase.
Conduit Function Markers
The reported mean normal value for RAScd was 23.6% (95% CI, 20.7 to 26.6%). The normal range of RAScd varied between 18.0 and 27.1%. Inter-study heterogeneity (Q = 431; P < 0.01), and inconsistency (I2 = 98.0%) were significant. The fixed-effects model showed a mean RAScd value of 20.3% (95% CI, 19.9 to 20.6%) (Figure 4).
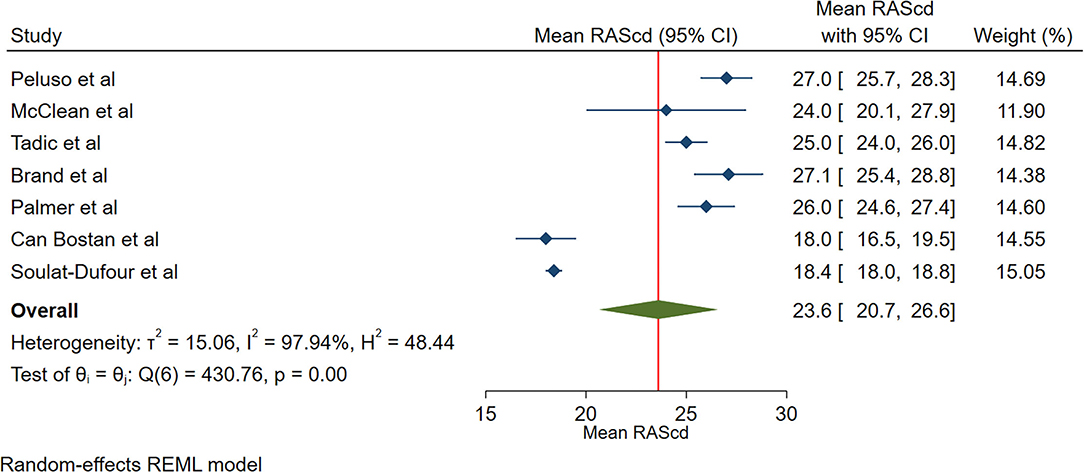
Figure 4. The image demonstrates the normal range of the longitudinal 2D speckle-tracking echocardiography-derived right atrial strain during the conduit phase.
The reported mean normal value for pRASRcd was −1.9 s−1 (95% CI, −2.2 to −1.7 s−1), which ranged from −2.2 to −1.5 s−1. Inter-study heterogeneity (Q = 37; P < 0.01) and inconsistency (I2 = 88.8%) were significant. The fixed-effects model demonstrated a mean pRASRcd value of −2.0 s−1 (95% CI, −2.1 to −1.9 s−1) (Figure 5).
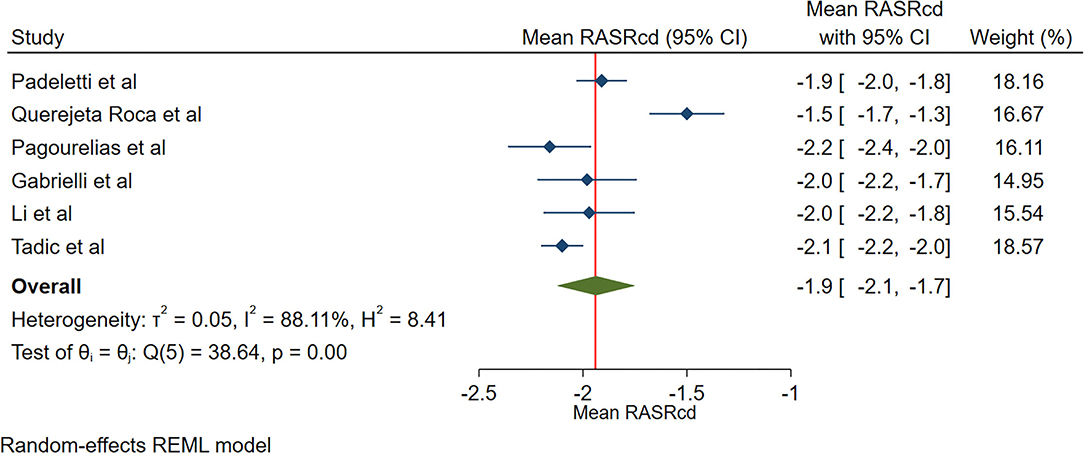
Figure 5. The image demonstrates the normal range of the longitudinal 2D speckle-tracking echocardiography-derived peak right atrial strain rate during the conduit phase.
Contraction Function Markers
The reported mean normal value for RASct was 16.1% (95% CI, 13.6 to 18.6%), which ranged from 11.7 to 27.6%. Inter-study heterogeneity (Q = 2,150; P < 0.01) and inconsistency (I2 = 99.0%) were significant. The fixed-effects model showed a mean RASct value of 18.1 % (95% CI, 17.9 to 18.4%) (Figure 6).
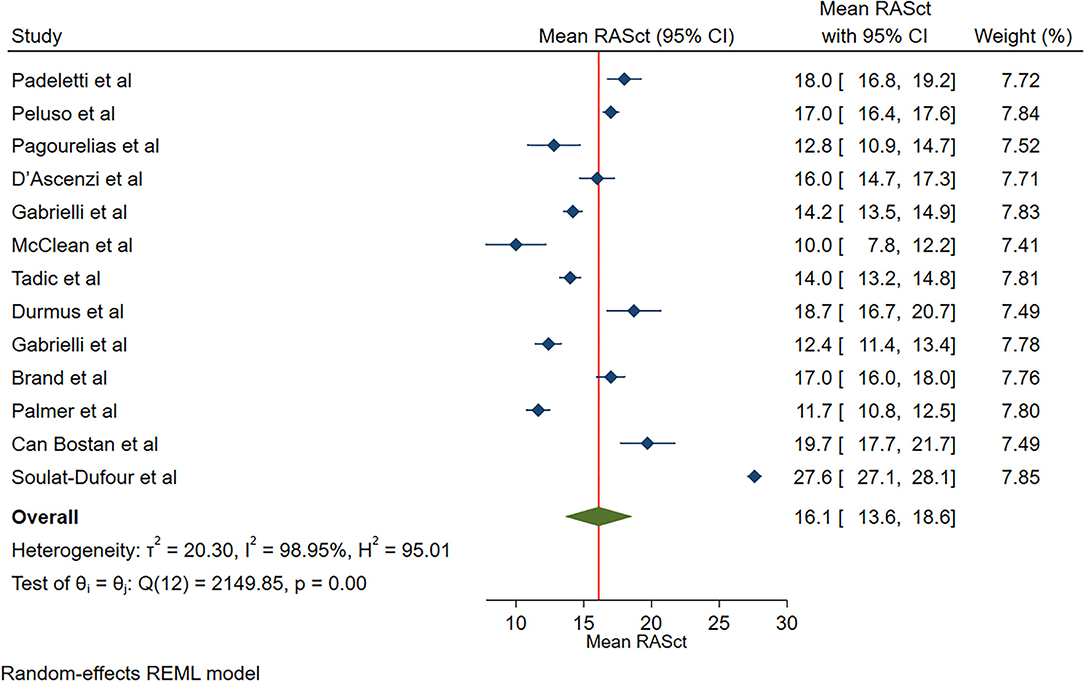
Figure 6. The image demonstrates the normal range of the longitudinal 2D speckle-tracking echocardiography-derived right atrial strain during the contraction phase.
The reported mean normal value for pRASRct was −1.8 s−1 (95% CI, −2.0 to −1.5 s−1). The normal range of pRASRct varied between −2.2 s−1 and −1.5 s−1. Inter-study heterogeneity (Q = 48; P < 0.01) and inconsistency (I2 = 92.3%) were significant. The fixed-effects model demonstrated a mean pRASRct value of −1.7 s−1 (95% CI, −1.7 to −1.6 s−1) (Figure 7).
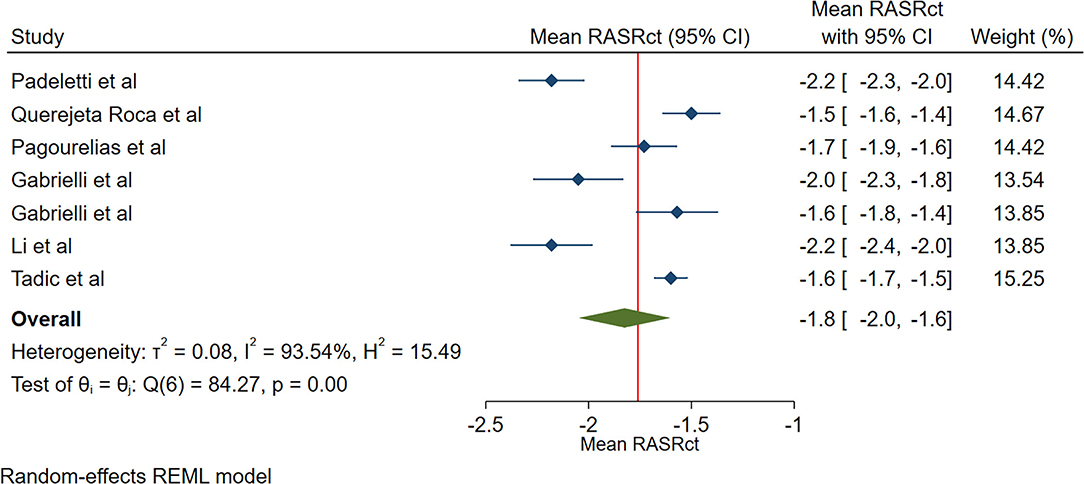
Figure 7. The image demonstrates the normal range of the longitudinal 2D speckle-tracking echocardiography-derived peak right atrial strain rate during the contraction phase.
Meta-Regression
Reservoir Function Markers
In the case of RASr, sex (male) (β = −0.12; P = 0.028) and diastolic blood pressure (β = −1.13; P = 0.036) were sources of between-study heterogeneity. Apropos of pRASRs, between-study heterogeneity was not statistically significant (Table 2).
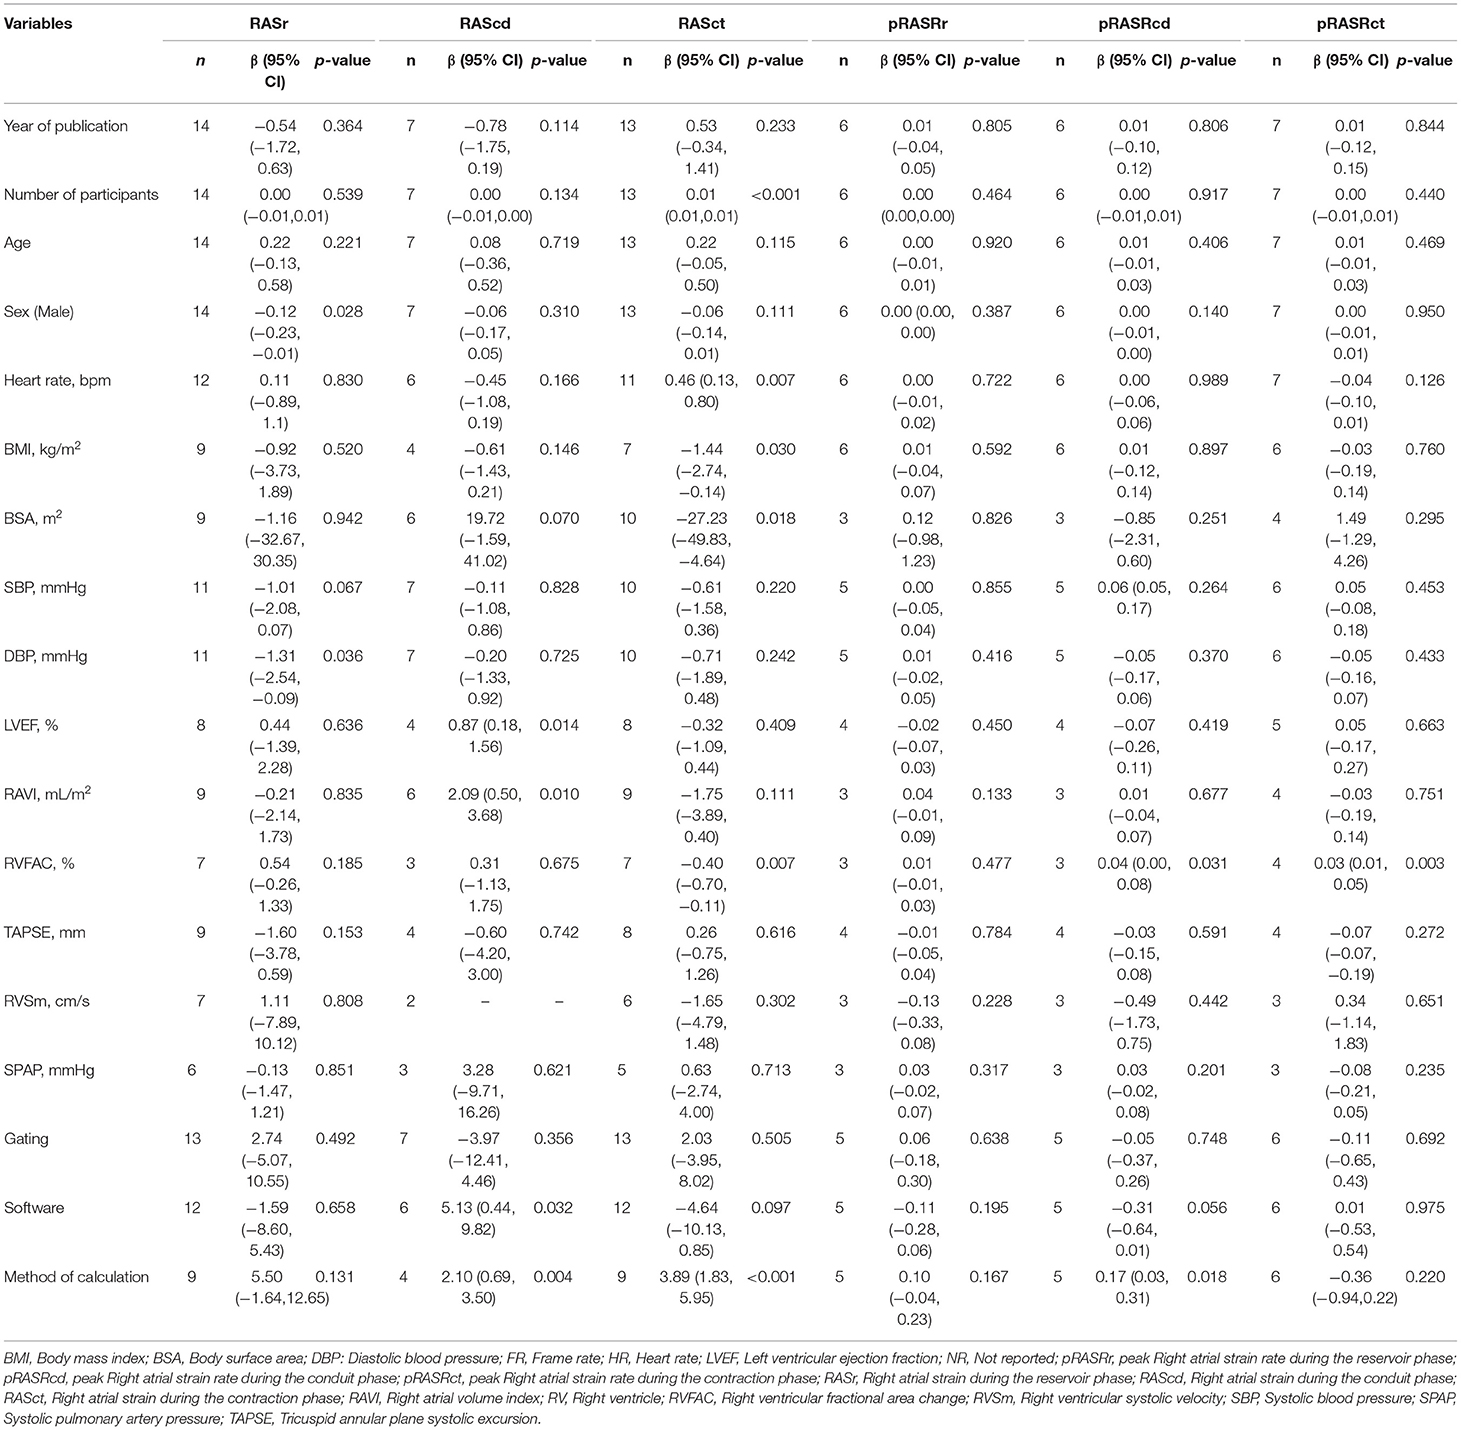
Table 2. Meta-regression analysis for longitudinal two-dimensional speckle tracking echocardiography derived right atrial strains and strain rates.
Conduit Function Markers
The LV ejection fraction (β = 0.87; P = 0.014), the RA volume index (β = 2.09; P = 0.010), the software used for analysis (β = 5.13; P = 0.032), and the method of global value calculation (β = 2.10; P = 0.004) were the sources of inter-study heterogeneity for RAScd. In regard to pRASRcd, the RV fractional area change (β = 0.04; P = 0.031) and the method of global value calculation (β = 0.17; P = 0.018) were the sources of between-study heterogeneity (Table 2).
Contraction Function Markers
With respect to RASct, the number of study participants (β = 0.01; P < 0.001), the heart rate (β = 0.46; P = 0.007), the body mass index (β = −1.44; P = 0.030), the body surface area (β = −27.23; P = 0.018), the RV fractional area change (β = −0.40; P = 0.007), and the method of global value calculation (β = 3.89; P < 0.001) were the sources of between-study heterogeneity. The RV fractional area change (β = 0.03; P = 0.003) was the source of heterogeneity for pRASRct (Table 2).
Publication Bias
Publication bias was non-significant for RASr (P for Egger's test = 0.744), RAScd (P for Egger's test = 0.580), RASct (P for Egger's test = 0.400), RASRr (P for Egger's test = 0.290), RASRcd (P for Egger's test = 0.856), and RASRct (P for Egger's test = 0.118).
Study Quality Assessment
The studies incorporated in the present meta-analysis fulfilled six to nine criteria among the 11 proposed quality criteria. All the studies fulfilled more than 50% of the proposed quality criteria. One study fulfilled nine criteria (82%), five studies fulfilled eight (73%), four studies fulfilled seven (64%), and five studies fulfilled six (55%). All the studies defined their objectives, outcomes, confounders, main findings, and strain imaging protocols (Supplementary Table 2).
Discussion
To the best of our knowledge, we are the first to present the normal ranges of all RA phasic functions (strain and strain rate) through a meta-analysis. A cardiac cycle includes interactions between the RA and the RV. In the RV systolic time, the tricuspid annulus is pulled toward the cardiac apex concurrently with the entrance of the flow from the cava veins into the RA. In this phase (the reservoir phase), the RA myocardium is stretched. In the early RV diastolic time, which is concurrent with the RA conduit phase, the tricuspid valve opens and the tricuspid annulus returns to its original place due to RV relaxation (reduced RA stretching). In the late RV diastolic time, which coincides with the RA contraction phase, the RA contracts, and the length of the RA myocardial fibers decreases (1).
The markers of the 3 RA phasic functions are predictive of prognosis in patients with pulmonary hypertension, while the markers of the RA reservoir and conduit functions are correlated with functional capacity in patients with systemic sclerosis and idiopathic pulmonary hypertension (25, 31–34). In addition, RASr correlates with the RA pressure and the occurrence of postoperative atrial fibrillation (35, 36).
Sources of Heterogeneity
The Reservoir Function
According to some studies, RASr increases in women in comparison with men (4, 11). We found that sex was a source of inter-study variation (37).
In a previous investigation, RASr was decreased in patients with high normal blood pressure, defined as a diastolic blood pressure of about 9 mm Hg higher than the normal diastolic blood pressure in the control group (79 vs. 70 mm Hg), during a 24-h blood pressure monitoring (38). Our findings are in line with that study insofar as the range of the diastolic blood pressure in our study was between 71 and 81 mm Hg.
The Conduit Function
The RA conduit function is correlated with the LV ejection fraction in patients with a reduced ejection fraction (2). In our meta-analysis, we assessed studies that enrolled patients with normal cardiac function. Still, the LV ejection fraction in these studies ranged from 55 to 65%.
A previous investigation demonstrated that during the head-up title test with increased inclination, the LA volume and conduit function decreased (7). Stated otherwise, a decrease in the LA volume is in tandem with a reduction in the LA conduit function. Concerning the RA, in patients with end-stage renal disease, the RA volume and conduit function decrease after hemodialysis, which is compatible with the aforementioned study regarding the LA (39). It can, therefore, be explained why the inter-study difference vis-a-vis the RA volume index may lead to an inter-study difference in terms of the RA conduit function.
The LV systolic function is a determinant of the LA conduit function (40), and the RV fractional area change is a marker of the RV systolic function (41). Hence, it is reasonable that the RV systolic function is a determinant of the RA conduit function and that the difference regarding the RV fractional area change between studies is a source of between-study heterogeneity.
The global strain can be calculated by two methods, one of which uses the entire myocardial line length while computing the global strain, whereas the other one averages the values computed at the segmental level. These methods are mathematically the same. Nevertheless, in practice, the presence of a bad track or noisy signal segment can be a source of difference between these two methods. This segment is included in the calculation in the first method and excluded in the second method. More differences manifest themselves when the segments are not equal in size and the weight of small and large segments is similar (42). Indeed, such differences in the methodology of global strain calculation can be a source of between-study heterogeneity.
The software used by researchers was another source of heterogeneity. Intervendor variability is mainly due to post-processing factors such as differences in algorithms and the calculation methods of deformation markers, as well as the control of outliers and the order in which deformation markers are calculated (43).
The Contraction Function
Some studies have reported that a rise in the body mass index is accompanied by a decline in the LA contraction function (44, 45), which can be used as a rationale to assume that a decrease in the RA contraction function is allied to an increase in the body mass index. This may explain why the body mass index was a source of inter-study heterogeneity in our meta-analysis. The correlation between the body mass index and the body surface area may render the latter a source of between-study variabilities. In addition, with an increase in body size, the initial length of the RA myocardium increases, leading to a decrease in strain since strain is the ratio of length change to the initial length.
The number of participants can be deemed a measure of researchers' expertise in the measurement of strain and strain rates (14). The level of expertise may, thus, affect the results of studies. Studies do not tend to mention the level of their researchers' expertise, and a consensus has yet to emerge regarding the objective criteria of expertise in this field.
Whereas some studies claim that there is a correlation between the heart rate and aggravation in atrial contraction, some other studies refute this notion (27, 46). According to our results, an increase in age was correlated with an increase in the RA contraction function; be that as it may, this association cannot be considered etiologic because what we sought to determine was the source of heterogeneity between studies. The range of the reported heart rate in our study was between 63 and 76 beats per minute, which is acceptable for the normal population.
As was mentioned above, based on our findings, the RV fractional area change was a source of between-study heterogeneity inasmuch as an increase in the RV fractional area change was correlated with an increase in the RA conduit function. While the RV fractional area change was a source of heterogeneity concerning the RA conduit function, an increased RV fractional area change was associated with a decrease in the RA contraction function. This finding can be explained by the fact that with an increase in the conduit phase for RV filling, the RA contraction function decreases and vice versa. This issue is seen in the case of grade I LV diastolic dysfunction, in which a decrease in LV diastolic filling in the early diastole is in tandem with an increase in LV diastolic filling in the late diastole due to the contraction of the LA.
Publication Bias
We found no publication bias. However, the low number of studies, especially in the case of the RA phasic strain rate, undermines the accuracy of our results.
Our study selection was done independently. All the stages of study selection were checked by three researchers, and any discrepancy was ultimately removed through an agreement between two researchers. We think that this adopted method minimized the possibility of missing available studies.
Our study yielded normal ranges for the longitudinal markers of the RA phasic functions obtained by 2DSTE. Although we analyzed a limited number of studies, our study proved preliminary data regarding the normal ranges of these markers. Further research is needed to obtain more robust data on the normal ranges of these markers in different populations. Our study can be helpful for clinicians interested in right heart disease in that it defines what constitutes normal ranges for RA phasic functions. Additionally, information on the normal ranges of the deformation markers of the RA phasic functions may be helpful in patient follow-up since it could identify the time of RA involvement in the disease process. Another salient point raised by our study is the need for further well-designed studies in this field.
Study Limitations
Fifteen studies that included 2,469 healthy subjects were selected for our meta-analysis concerning various markers of the RA phasic functions (strain and strain rate). Despite the low sample size of our investigation, we hope that until larger meta-analyses are undertaken, clinicians will find our results useful. In contrast with previous meta-analyses that included randomized clinical trials, our meta-analysis evaluated observational and case-control studies. Accordingly, the fact that we encountered a high rate of heterogeneity by comparison with the meta-analyses that evaluated randomized clinical trials can be deemed expectable (47).
The expertise level of researchers is another matter that is obscure in studies in this field and should be considered in future studies. The majority of the studies included in the meta-analysis had small patient populations, which further underscores the need for large-scale investigations in this context. What should also be borne in mind in the interpretation of our findings is that we analyzed merely the data of studies and not the data of patients who participated in the studies. Moreover, the quality of the studies subjected to analysis was evaluated through checklists (14, 48). Such checklists offer an insight into the quality of studies, but they lack objectivity in some items (49). Notably, we did not consider the quality of a study an exclusion criterion. The overall quality of the studies meta-analyzed herein was acceptable because they fulfilled six to nine criteria among the 11 proposed quality criteria. In addition, we did not consider the quality of study in our analysis and did not a stratified meta-analysis.
Conclusions
According to the results of the present study, the mean global value was 42.7% for RASr (95% CI, 39.4 to 45.9%), 23.6% for RAScd (95% CI, 20.7 to 26.6%), 16.1% for RASct (95% CI, 13.6 to 18.6%), 2.1 s−1 for pRASRr (95% CI, 2.0 to 2.1 s−1), −1.9 s−1 for pRASRcd (95% CI, −2.2 to −1.7 s−1), and −1.8 s−1 for pRASRct (95% CI, −2.0 to −1.5 s−1). The sources of heterogeneity in terms of the normal ranges of these markers were the number of participants, the type of software, the method of global value calculation, the RV fractional area, the LV ejection fraction, the RA volume index, sex, the heart rate, the diastolic blood pressure, the body mass index, and the body surface area.
Author Contributions
AH, TD, and RM-B: concept/design. AH, TD, RM-B, RM, and AJ: data analysis/interpretation and approval of article. AH: drafting article. TD, RM-B, RM, and AJ: critical revision of article. AJ: statistics. AH, RM, and RM-B: data collection. All authors contributed to the article and approved the submitted version.
Conflict of Interest
The authors declare that the research was conducted in the absence of any commercial or financial relationships that could be construed as a potential conflict of interest.
Publisher's Note
All claims expressed in this article are solely those of the authors and do not necessarily represent those of their affiliated organizations, or those of the publisher, the editors and the reviewers. Any product that may be evaluated in this article, or claim that may be made by its manufacturer, is not guaranteed or endorsed by the publisher.
Supplementary Material
The Supplementary Material for this article can be found online at: https://www.frontiersin.org/articles/10.3389/fcvm.2021.771647/full#supplementary-material
References
1. Tadic M. The right atrium, a forgotten cardiac chamber: An updated review of multimodality imaging. J Clin Ultrasound. (2015) 43:335–45. doi: 10.1002/jcu.22261
2. Jain S, Kuriakose D, Edelstein I, Ansari B, Oldland G, Gaddam S, et al. Right atrial phasic function in heart failure with preserved and reduced ejection fraction. JACC Cardiovasc Imaging. (2019) 12:1460–70. doi: 10.1016/j.jcmg.2018.08.020
3. Huang J, Yang C, Ni CF, Yan ZN, Fan L, Song XT. Right atrial function assessed by volume-derived values and speckle tracking echocardiography in patients with hypertrophic cardiomyopathy. BMC Cardiovasc Disord. (2020) 20:335. doi: 10.1186/s12872-020-01610-1
4. Soulat-Dufour L, Addetia K, Miyoshi T, Citro R, Daimon M, Fajardo PG, et al. Normal values of right atrial size and function according to age, sex, and ethnicity: results of the world alliance societies of echocardiography study. J Am Soc Echocardiogr. (2021) 34:286–300. doi: 10.1016/j.echo.2020.11.004
5. Nemes A, Kormányos Á, Domsik P, Kalapos A, Ambrus N, Lengyel C, et al. Normal reference values of right atrial strain parameters using three-dimensional speckle-tracking echocardiography (results from the MAGYAR-Healthy Study). Int J Cardiovasc Imaging. (2019) 35:2009–18. doi: 10.1007/s10554-019-01655-0
6. Mor-Avi V, Lang RM, Badano LP, Belohlavek M, Cardim NM, Derumeaux G, et al. Current and evolving echocardiographic techniques for the quantitative evaluation of cardiac mechanics: ASE/EAE consensus statement on methodology and indications endorsed by the Japanese Society of Echocardiography. J Am Soc Echocardiogr. (2011) 24:277–313. doi: 10.1093/ejechocard/jer021
7. Genovese D, Singh A, Volpato V, Kruse E, Weinert L, Yamat M, et al. Load dependency of left atrial strain in normal subjects. J Am Soc Echocardiogr. (2018) 31:1221–8. doi: 10.1016/j.echo.2018.07.016
8. Thomas L, Muraru D, Popescu BA, Sitges M, Rosca M, Pedrizzetti G, et al. Evaluation of left atrial size and function: relevance for clinical practice. J Am Soc Echocardiogr. (2020) 33:934–52. doi: 10.1016/j.echo.2020.03.021
9. Padeletti M, Cameli M, Lisi M, Malandrino A, Zacà V, Mondillo S. Reference values of right atrial longitudinal strain imaging by two-dimensional speckle tracking. Echocardiography. (2012) 29:147–52. doi: 10.1111/j.1540-8175.2011.01564.x
10. D'Ascenzi F, Cameli M, Padeletti M, Lisi M, Zacà V, Natali B, et al. Characterization of right atrial function and dimension in top-level athletes: a speckle tracking study. Int J Cardiovasc Imaging. (2013) 29:87–94. doi: 10.1007/s10554-012-0063-z
11. Peluso D, Badano LP, Muraru D, Dal Bianco L, Cucchini U, Kocabay G, et al. Right atrial size and function assessed with three-dimensional and speckle-tracking echocardiography in 200 healthy volunteers. Eur Heart J Cardiovasc Imaging. (2013) 14:1106–14. doi: 10.1093/ehjci/jet024
12. Pagourelias ED, Kouidi E, Efthimiadis GK, Deligiannis A, Geleris P, Vassilikos V. Right atrial and ventricular adaptations to training in male Caucasian athletes: an echocardiographic study. J Am Soc Echocardiogr. (2013) 26:1344–52. doi: 10.1016/j.echo.2013.07.019
13. Gabrielli L, Bijnens BH, Butakoff C, Duchateau N, Montserrat S, Merino B, et al. Atrial functional and geometrical remodeling in highly trained male athletes: for better or worse? Eur J Appl Physiol. (2014) 114:1143–52. doi: 10.1007/s00421-014-2845-6
14. Durmus E, Sunbul M, Tigen K, Kivrak T, Ozen G, Sari I, et al. Right ventricular and atrial functions in systemic sclerosis patients without pulmonary hypertension. Speckle-tracking echocardiographic study. Herz. (2015) 40:709–15. doi: 10.1007/s00059-014-4113-2
15. McClean G, George K, Lord R, Utomi V, Jones N, Somauroo J, et al. Chronic adaptation of atrial structure and function in elite male athletes. Eur Heart J Cardiovasc Imaging. (2015) 16:417–22. doi: 10.1093/ehjci/jeu215
16. Querejeta Roca G, Campbell P, Claggett B, Solomon SD, Shah AM. Right atrial function in pulmonary arterial hypertension. Circ Cardiovasc Imaging. (2015) 8:e003521. doi: 10.1161/CIRCIMAGING.115.003521
17. Tadic M, Ilic S, Cuspidi C, Ivanovic B, Bukarica L, Kostic N, et al. Left and right atrial phasic function and deformation in untreated patients with prediabetes and type 2 diabetes mellitus. Int J Cardiovasc Imaging. (2015) 31:65–76. doi: 10.1007/s10554-014-0536-3
18. Gabrielli L, Bijnens BH, Brambila C, Duchateau N, Marin J, Sitges-Serra I, et al. Differential atrial performance at rest and exercise in athletes: Potential trigger for developing atrial dysfunction? Scand J Med Sci Sports. (2016) 26:1444–54. doi: 10.1111/sms.12610
19. Sanchis L., Sanz-de La Garza M, Bijnens B, Giraldeau G, Grazioli G, Marin J, et al. Gender influence on the adaptation of atrial performance to training. Eur J Sport Sci. (2017) 17:720–6. doi: 10.1080/17461391.2017.1294620
20. Brand A, Bathe M, Hübscher A, Baldenhofer G, Hättasch R, Seeland U, et al. Normative reference data, determinants, and clinical implications of right atrial reservoir function in women assessed by 2D speckle-tracking echocardiography. Echocardiography. (2018) 35:1542–9. doi: 10.1111/echo.14092
21. Li J, Lu C, Wang W, Gong K, Zhao L, Wang Z. Assessment of right atrium dysfunction in patients with obstructive sleep apnea syndrome using velocity vector imaging. Cardiovasc Ultrasound. (2018) 16:32. doi: 10.1186/s12947-018-0150-y
22. Can Bostan O, Ozben B, Bayram T, Sayar N, Eryuksel E. The effect of smoking on atrial and ventricular functions in healthy subjects: A speckle tracking echocardiography study. J Clin Ultrasound. (2020) 48:462–9. doi: 10.1002/jcu.22854
23. Palmer C, Truong VT, Klas B, Wolking S, Ornella A, Young M, et al. Left and right atrial speckle tracking: Comparison of three methods of time reference gating. Echocardiography. (2020) 37:1021–9. doi: 10.1111/echo.14770
24. Bai Y, Yang J, Liu J, Ning H, Zhang R. Right atrial function for the prediction of prognosis in connective tissue disease-associated pulmonary arterial hypertension: a study with two-dimensional speckle tracking. Int J Cardiovasc Imaging. (2019) 35:1637–49. doi: 10.1007/s10554-019-01613-w
25. Alenezi F, Mandawat A., Il'Giovine ZJ, Shaw LK, Siddiqui I, Tapson VF, et al. Clinical utility and prognostic value of right atrial function in pulmonary hypertension. Circ Cardiovasc Imaging. (2018) 11:e006984. doi: 10.1161/CIRCIMAGING.117.006984
26. Schuster A, Backhaus SJ, Stiermaier T, Navarra JL, Uhlig J, Rommel KP, et al. Impact of right atrial physiology on heart failure and adverse events after myocardial infarction. J Clin Med. (2020) 9:210. doi: 10.3390/jcm9010210
27. Truong VT, Palmer C, Young M, Wolking S, Ngo TNM, Sheets B, et al. Right atrial deformation using cardiovascular magnetic resonance myocardial feature tracking compared with two-dimensional speckle tracking echocardiography in healthy volunteers. Sci Rep. (2020) 10:5237. doi: 10.1038/s41598-020-62105-9
28. Badano LP, Kolias TJ, Muraru D, Abraham TP, Aurigemma G, Edvardsen T, et al. Standardization of left atrial, right ventricular, and right atrial deformation imaging using two-dimensional speckle tracking echocardiography: a consensus document of the EACVI/ASE/Industry Task Force to standardize deformation imaging. Eur Heart J Cardiovasc Imaging. (2018) 19:591–600. doi: 10.1093/ehjci/jey042
29. Moher D, Liberati A, Tetzlaff J, Altman DG. PRISMA Group. Preferred reporting items for systematic reviews and meta-analyses: the PRISMA statement. PLoS Med. (2009) 6:e1000097. doi: 10.1371/journal.pmed.1000097
30. Downs SH, Black N. The feasibility of creating a checklist for the assessment of the methodological quality both of randomised and non-randomised studies of health care interventions. J Epidemiol Community Health. (1998) 52:377–84. doi: 10.1136/jech.52.6.377
31. Hasselberg NE, Kagiyama N, Soyama Y, Sugahara M, Goda A, Ryo-Koriyama K, et al. The prognostic value of right atrial strain imaging in patients with precapillary pulmonary hypertension. J Am Soc Echocardiogr. (2021) 34:851–61.e1. doi: 10.1016/j.echo.2021.03.007
32. Nógrádi Á, Porpáczy A, Porcsa L, Minier T, Czirják L, Komócsi A, et al. Relation of right atrial mechanics to functional capacity in patients with systemic sclerosis. Am J Cardiol. (2018) 122:1249–54. doi: 10.1016/j.amjcard.2018.06.021
33. Saha SK, Söderberg S, Lindqvist P. Association of right atrial mechanics with hemodynamics and physical capacity in patients with idiopathic pulmonary arterial hypertension: insight from a single-center cohort in northern Sweden. Echocardiography. (2016) 33:46–56. doi: 10.1111/echo.12993
34. Liu W, Wang Y, Zhou J, Bai H, Wang F, Wang J. The association of functional capacity with right atrial deformation in patients with pulmonary arterial hypertension: a study with two-dimensional speckle tracking. Heart Lung Circ. (2018) 27:350–8. doi: 10.1016/j.hlc.2017.02.029
35. Miah N, Faxén UL, Lund LH, Venkateshvaran A. Diagnostic utility of right atrial reservoir strain to identify elevated right atrial pressure in heart failure. Int J Cardiol. (2021) 324:227–32. doi: 10.1016/j.ijcard.2020.09.008
36. Aksu U, Kalkan K, Gulcu O, Aksakal E, Öztürk M, Topcu S. The role of the right atrium in development of postoperative atrial fibrillation: a speckle tracking echocardiography study. J Clin Ultrasound. (2019) 47:470–6. doi: 10.1002/jcu.22736
37. Moustafa S, Zuhairy H, Youssef MA, Alvarez N, Connelly MS, Prieur T, et al. Right and left atrial dissimilarities in normal subjects explored by speckle tracking echocardiography. Echocardiography. (2015) 32:1392–9. doi: 10.1111/echo.12880
38. Tadic M, Cuspidi C, Pencic B, Sljivic A, Ivanovic B, Neskovic A, et al. High-normal blood pressure impacts the right heart mechanics: a three-dimensional echocardiography and two-dimensional speckle tracking imaging study. Blood Press Monit. (2014) 19:145–52. doi: 10.1097/MBP.0000000000000043
39. Ünlü S, Sahinarslan A, Gökalp G, Seçkin Ö, Arinsoy ST, Boyaci NB, et al. The impact of volume overload on right heart function in end-stage renal disease patients on hemodialysis. Echocardiography. (2018) 35:314–21. doi: 10.1111/echo.13768
40. Ramkumar S, Yang H, Wang Y, Nolan M, Negishi T, Negishi K, et al. Association of the active and passive components of left atrial deformation with left ventricular function. J Am Soc Echocardiogr. (2017) 30:659–66. doi: 10.1016/j.echo.2017.03.014
41. Lang RM, Badano LP, Mor-Avi V, Afilalo J, Armstrong A, Ernande L, et al. Recommendations for cardiac chamber quantification by echocardiography in adults: an update from the American Society of Echocardiography and the European Association of Cardiovascular Imaging. J Am Soc Echocardiogr. (2015) 28:1–39.e14. doi: 10.1016/j.echo.2014.10.003
42. Voigt JU, Pedrizzetti G, Lysyansky P, Marwick TH, Houle H, Baumann R, et al. Definitions for a common standard for 2D speckle tracking echocardiography: consensus document of the EACVI/ASE/Industry Task Force to standardize deformation imaging. Eur Heart J Cardiovasc Imaging. (2015) 16:1–11. doi: 10.1093/ehjci/jeu184
43. Negishi K, Lucas S, Negishi T, Hamilton J, Marwick TH. What is the primary source of discordance in strain measurement between vendors: imaging or analysis? Ultrasound Med Biol. (2013) 39:714–20. doi: 10.1016/j.ultrasmedbio.2012.11.021
44. Mohseni-Badalabadi R, Mehrabi-Pari S, Hosseinsabet A. Evaluation of the left atrial function by two-dimensional speckle-tracking echocardiography in diabetic patients with obesity. Int J Cardiovasc Imaging. (2020) 36:643–52. doi: 10.1007/s10554-020-01768-x
45. Tadic M, Cuspidi C, Ilic I, Suzic-Lazić J, Zivanovic V, Jozika L, et al. The relationship between blood pressure variability, obesity and left atrial phasic function in hypertensive population. Int J Cardiovasc Imaging. (2016) 32:603–12. doi: 10.1007/s10554-015-0822-8
46. Qu YY, Buckert D, Ma GS, Rasche V. Quantitative assessment of left and right atrial strains using cardiovascular magnetic resonance based tissue tracking. Front Cardiovasc Med. (2021) 8:690240. doi: 10.3389/fcvm.2021.690240
47. Delgado-Rodríguez M. Systematic reviews of meta-analyses: applications and limitations. J Epidemiol Community Health. (2006) 60:90–2. doi: 10.1136/jech.2005.035253
48. Truong VT, Phan HT, Pham KNP, Duong HNH, Ngo TNM, Palmer C, et al. Normal ranges of left ventricular strain by three-dimensional speckle-tracking echocardiography in adults: a systematic review and meta-analysis. J Am Soc Echocardiogr. (2019) 32:1586–97.e5. doi: 10.1016/j.echo.2019.07.012
49. Levy PT, Machefsky A, Sanchez AA, Patel MD, Rogal S, Fowler S, et al. Reference ranges of left ventricular strain measures by two-dimensional speckle-tracking echocardiography in children: a systematic review and meta-analysis. J Am Soc Echocardiogr. (2016) 29:209–25.e6. doi: 10.1016/j.echo.2015.11.016
Keywords: right atrium, speckle-tracking echocardiography, strain, normal range, meta-analysis
Citation: Hosseinsabet A, Mahmoudian R, Jalali A, Mohseni-Badalabadi R and Davarpasand T (2021) Normal Ranges of Right Atrial Strain and Strain Rate by Two-Dimensional Speckle-Tracking Echocardiography: A Systematic Review and Meta-Analysis. Front. Cardiovasc. Med. 8:771647. doi: 10.3389/fcvm.2021.771647
Received: 06 September 2021; Accepted: 24 November 2021;
Published: 17 December 2021.
Edited by:
Luigi P. Badano, University of Milano Bicocca, ItalyReviewed by:
Matteo Cameli, University of Siena, ItalyChristoph Sinning, University Heart and Vascular Center Hamburg (UHZ), Germany
Copyright © 2021 Hosseinsabet, Mahmoudian, Jalali, Mohseni-Badalabadi and Davarpasand. This is an open-access article distributed under the terms of the Creative Commons Attribution License (CC BY). The use, distribution or reproduction in other forums is permitted, provided the original author(s) and the copyright owner(s) are credited and that the original publication in this journal is cited, in accordance with accepted academic practice. No use, distribution or reproduction is permitted which does not comply with these terms.
*Correspondence: Ali Hosseinsabet, QWxpX2hvc3NlaW5zYWJldEB5YWhvby5jb20=
 Ali Hosseinsabet
 Roshanak Mahmoudian1