 Renzheng Chen1,2
 Xiaowei Ye1,2
 Mengjia Sun1,2
 Jie Yang1,2
 Jihang Zhang1,2Xubin Gao1,2
 Chuan Liu1,2
 Jingbin Ke1,2Chunyan He1,2
 Fangzhengyuan Yuan1,2Hailin Lv1,2
 Yuanqi Yang1,2
 Ran Cheng1,2
 Hu Tan1,2
 Lan Huang1,2*
- 1Institute of Cardiovascular Diseases of Chinese People's Liberation Army (PLA), The Second Affiliated Hospital, Third Military Medical University (Army Medical University), Chongqing, China
- 2Department of Cardiology, The Second Affiliated Hospital, Third Military Medical University (Army Medical University), Chongqing, China
Background: Acute high altitude (HA) exposure results in blood pressure (BP) variations in most subjects. Previous studies have demonstrated that higher BP is potentially correlated with acute mountain sickness (AMS). The BP load may be of clinical significance regarding systemic circulation status.
Objectives: This study aimed to examine HA-induced BP changes in patients with AMS compared to those in healthy subjects. Further, we provided clinical information about the relationship between variations in 24-h ambulatory parameters (BP level, BP variability, and BP load) and AMS.
Methods: Sixty-nine subjects were enrolled and all participants ascended Litang (4,100 m above sea level). They were monitored using a 24-h ambulatory blood pressure device and underwent echocardiography within 24 h of altitude exposure. The 2018 Lake Louise questionnaire was used to evaluate AMS.
Results: The AMS group comprised more women than men [15 (65.2%) vs. 13 (28.3%), P < 0.001] and fewer smokers [4 (17.4%) vs. 23 (50.0%), P = 0.009]. The AMS group exhibited significant increases in 24-h BP compared to the non-AMS group (24-h SBP variation: 10.52 ± 6.48 vs. 6.03 ± 9.27 mmHg, P = 0.041; 24-h DBP variation: 8.70 ± 4.57 vs. 5.03 ± 4.98 mmHg, P = 0.004). The variation of mean 24-h cBPL (cumulative BP load) (mean 24-h cSBPL: 10.58 ± 10.99 vs. 4.02 ± 10.58, P = 0.016; 24-h mean cDBPL: 6.03 ± 5.87 vs. 2.89 ± 4.99, P = 0.034) was also obviously higher in AMS subjects than in non-AMS subjects after HA exposure. 24-h mean cSBPL variation (OR = 1.07, P = 0.024) and 24-h mean cDBPL variation (OR = 1.14, P = 0.034) were independent risk factors of AMS. Moreover, variation of 24-h mean cSBPL showed a good correlation with AMS score (R = 0.504, P < 0.001).
Conclusions: Our study demonstrated that patients with AMS had higher BP and BP load changes after altitude exposure than healthy subjects. Excessive BP load variations were associated with AMS. Thus, BP load could be an effective indicator regarding systemic circulation status of AMS.
Introduction
An increasing number of people are exposed to high altitudes (HA) for various reasons. However, HA can induce a series of cardiovascular responses due to hypobaric and hypoxic influences (1, 2). The changes in BP are particularly prominent. Some maladaptive individuals may suffer acute mountain sickness (AMS), which is characterized by headache and other related symptoms (3, 4). Previous studies have indicated that certain cardiovascular system indicators including electrocardiogram changes and cardiac systolic function are related to the occurrence and development of AMS (5, 6). Moreover, excessive elevation of arterial BP is detrimental to the body and is considered to be closely associated with AMS (7). Therefore, accurate and effective monitoring of the BP after HA exposure is important for AMS prevention and treatment.
The BP load mainly refers to the degree of arterial BP above set thresholds (8). Although studies have demonstrated that the BP load is an important predictor of adverse cardiovascular events (9), the traditional method of BP load calculation (BP readings above normal) is of limited clinical significance for risk predictions based on the 24-h BP level (10). The BP load calculated by the area under the time-pressure curve effectively reflects for the BP status (11). During acute HA exposure, adverse cardiovascular responses are primarily related to sympathetic hyperactivation (12). The BP load indicates the fluctuation in the BP caused by sympathetic activity and is better calculated in this way compared to the traditional method. Therefore, we propose that it may be a significant indicator of the BP status in AMS with superior predictive value.
Thus, in the present study, we obtained 24-h ambulatory BP (ABP) at both low altitude (LA) and HA in patients with AMS as well as in non-AMS susceptible subjects. Two different methods are used to calculate the BP load. We sought to ascertain whether there was an association between the BP load variations at HA in individuals with AMS and aimed to provide related information.
Materials and Methods
Study Population and Ethical Considerations
This prospective observational cohort study involving 24-h ABP monitoring was conducted in Chengdu, China, in 2019. All subjects underwent a comprehensive medical examination before embarking on the expedition at LA (Chongzhou, 400 m above sea level) and underwent ABP monitoring and echocardiography both at the LA and HA (Litang, 4100 m above sea level). The exclusion criteria were as follows: (1) Any clinical conditions that may affect HA-adaptation, including known pulmonary diseases, cardiovascular diseases, hematological diseases, and so on. (2) Use of any medication. (3) Long term residence history and recent exposure history of altitude (last 6 months). Notably, subjects diagnosed with hypertension first according to the ABP data at LA (24-h BP > 130/80 mmHg and/or daytime BP > 135/85 mmHg and/or nighttime BP > 120/70 mmHg) (13) and 24-h ABP monitor recordings of <80% of the total data recorded (14) were excluded. Finally, 69 subjects were included, all of whom provided written informed consent. This study was performed in agreement with the Declaration of Helsinki and was approved by the Human Ethics Committee of the Xinqiao Hospital, Third Military Medical University (Identification code, 201907501) which registered at www.chictr.org.cn (ChiCTR-TRC-No.1900025728).
BP Measurement and BP Load Calculation
Two well-trained cardiovascular physicians performed ABP measurements using an ABM device (Spacelabs 90207, Redmond, WA, USA). The BP cuff was applied to the non-dominant arm on a weekday morning and was removed 24 h later. All participants were asked to remain still during the measurements. The subjects were instructed to avoid any unusual physical activities and follow a standard schedule at both LA and HA. Daytime and nighttime were defined as 6:00 to 22:00 and 22:00 to 6:00, respectively (11). The BP was recorded every 30 min during the daytime and every 60 min at night (15). The average real variability (ARV) of SBP and DBP was calculated as described in a previous study (16). BP load is the proportion of times that the BP exceeds normal values of the total number of recorded BP measurements during a certain period of time (day, night, and over 24 h) (17). To more accurately reflect the pressure load of the blood vessels, we calculated the cumulative BP load (cBPL), which is defined as the area between the fluctuating ABP curve and the time axis (11). Fitting the fluctuating BP curve by connecting adjacent data points with straight lines was used to determine the magnitude and durations of 24-h cumulative BP increases. By deconstructing the curve into many small trapezoids, we determine their areas, and summed the values. Due to missing data for some periods, we calculated the mean cBPL by dividing the total area by the number of periods measured. The interval between BP measurements at night (1 h) is twice as long as that during the day (30 min) (Figure 1); therefore, the number of periods measured doubled in the calculation of mean cBPL.
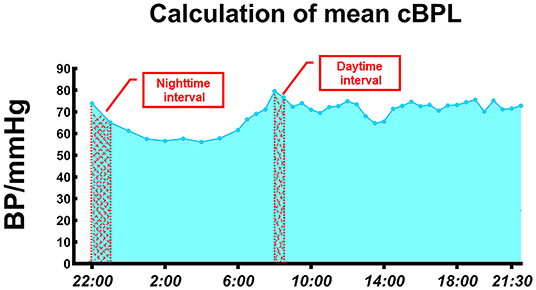
Figure 1. Calculation of mean cBP load. BP, blood pressure; cBPL, cumulative blood pressure load.
Echocardiography Examination
Echocardiographic examination was performed using an ultrasound machine (CX50, Philips Ultrasound System, Andover, MA, USA) to acquire left ventricular (LV) data. Images were saved digitally for subsequent offline analysis using QLAB software (QLAB 10.5, Philips Healthcare, Andover, MA, USA). We measured the LV dimensions and volumes by a computerized analysis software system. Ejection fraction (EF) was calculated by the LV volume data. Mitral inflow pattern from the tips level was analyzed for peak early diastolic velocity (E) as well as late diastolic velocity (A), and E/A. Reproducibility of main echocardiographic measurements was assessed in 20 randomly selected subjects. Interobserver variability was tested by two different physicians, and intraobserver variability was tested by the same physician at least 1 month apart. Both the interobserver and intraobserver variabilities were determined using the intraclass correlation coefficient (ICC). The ICC values were all over 0.85 and p-value < 0.001.
Assessment of AMS
All subjects traveled by automobiles from LA to HA within 2 days (Figure 2). AMS was diagnosed using the latest Lake Louise questionnaire (2018) ~8 h after arriving at HA. This comprises a four-item self-administered questionnaire based on the most frequent AMS symptoms: headache, dizziness, light-headedness, gastrointestinal symptoms, and fatigue. Participants completed the questionnaire with the assistance of an experienced physician. Each item is scored from 0 to 3, according to the severity of the symptom (0: no symptoms, 1: mild symptoms, 2: moderate symptoms; and 3: severe symptoms). AMS was defined as a total score ≥ 3, with at least one point from the headache (18).
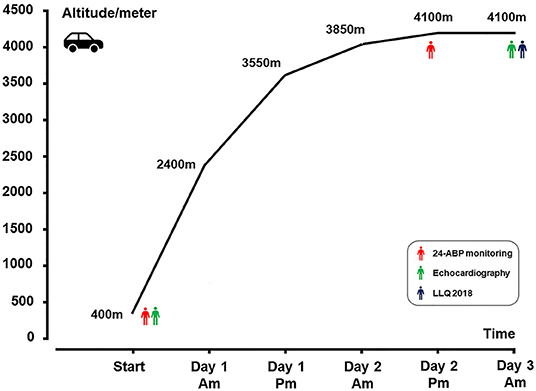
Figure 2. Ascent profile. ABP, ambulatory blood pressure monitoring; LLQ, Lake Louise questionnaire.
Statistical Analysis
Continuous variables are presented as means ± standard deviations. Differences in measurements between men and women with normal distribution were tested using an independent-sample t-test, whereas the data that did not fit a normal distribution were analyzed using the Mann–Whitney U test. Categorical data were presented as percentages (%) and were compared using the chi-square test, continuity correction, or Fisher's exact test, as appropriate. Binary logistic regression was used to predict the risk factors of AMS. Spearman correlation coefficients were used to determine the correlation between the different BP index variations after acute HA exposure and AMS scores. Statistical significance was set at P < 0.05. Statistical analyses were performed using SPSS software Version 26 (IBM, Armonk, NY, USA). Statistical power calculations were performed using the PASS software, version 11 (NCSS, LLC, Kaysville, UT, USA). The results suggested that 69 subjects would provide more than 75% power to detect differences in targeted BP parameters between subgroups using a two-sided alpha of 0.05.
Results
Demography and AMS-Related Symptoms Parameters
Twenty-three subjects developed AMS in the final data analysis. Age and BMI did not differ significantly between the two groups. The AMS group comprised a higher proportion of women (65.2 vs. 28.3%, P = 0.001) but a lower proportion of smokers (17.4 vs. 50.0%, P = 0.009). The AMS score and the percentage of AMS-related symptoms were also significantly higher in the AMS group (Table 1).
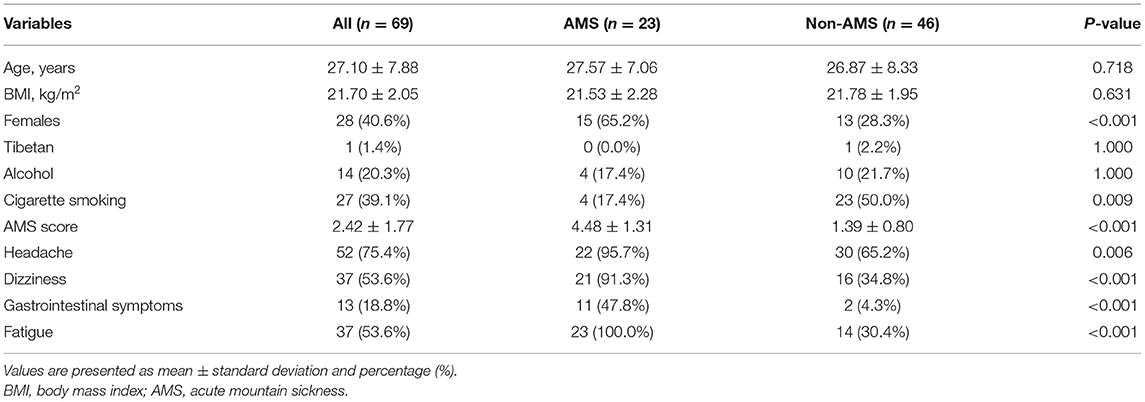
Table 1. Demographic and AMS symptoms parameters.
Baseline Parameters
Patients with AMS had a higher nighttime heart rate (HR) (62.71 ± 8.29 vs. 57.58 ± 7.71 beat/min, P = 0.017) and a lower daytime BP (daytime SBP, 114.94 ± 10.77 vs. 122.60 ± 6.50 mmHg, P = 0.004; daytime DBP, 69.51 ± 5.83 vs. 72.58 ± 4.55 mmHg, P = 0.019) at LA. Both 24-h SBP load and daytime SBP load were lower in the AMS group than in the non-AMS group at LA (24-h SBP load: 15.75 ± 9.53 vs. 21.63 ± 10.25%, P = 0.025; daytime SBP load: 15.67 ± 11.35 vs. 23.09 ± 11.45%, P = 0.013). Moreover, 24-h mean cSBPL (92.81 ± 10.36 vs. 98.47 ± 7.86, P = 0.014), daytime mean cSBPL (114.98 ± 11.34 vs. 122.70 ± 57.30, P = 0.001), and daytime mean cDBPL (69.15 ± 6.02 vs. 72.75 ± 4.64, P = 0.008), which were calculated using the BP-time curve area, were higher in non-AMS participants at LA. Besides, there was no obvious difference in the ARV and cardiac function between the two groups at LA.
Parameters After Acute HA Exposure
After arriving at HA, AMS subjects showed a lower SpO2 at HL, but no statistical difference was found in SpO2 variation between the two groups. Both daytime and nighttime BP increased after acute HA exposure in each group (Figure 3). 24-h BP increased significantly in the AMS group compared to the non-AMS group (24-h SBP variation: 10.52 ± 6.48 vs. 6.03 ± 9.27 mmHg, P = 0.041; 24-h DBP variation: 8.70 ± 4.57 vs. 5.03 ± 4.98, P = 0.004) which attributed to a higher elevation of daytime BP in subject with AMS (daytime SBP variation: 12.68 ± 8.91 vs. 6.46 ± 11.12, P = 0.023; daytime DBP variation: 9.15 ± 5.41 vs. 5.05 ± 6.35 mmHg, P = 0.010) (Table 2). 24-h DBP load variation (19.98 ± 11.42 vs. 11.21 ± 5.41%, P = 0.011) and daytime DBP load variation (19.71 ± 10.30 vs. 10.81 ± 6.66%, P = 0.008) were significantly higher in the AMS group compared to the non-AMS group. Furthermore, 24-h mean cBPL variation (24-h mean cSBPL 10.58 ± 10.99 vs. 4.02 ± 10.58, P = 0.016; 24-h mean cDBPL: 6.03 ± 5.87 vs. 2.89 ± 4.99, P = 0.034) and daytime mean cBPL variation (daytime mean cSBPL: 15.55 ± 13.99 vs. 6.77 ± 11.59, P = 0.007; daytime mean cDBPL: 9.00 ± 5.66 vs. 4.63 ± 6.97, P = 0.011) were also obviously higher in AMS subjects than in non-AMS subjects (Table 2). In addition, there was no obvious difference in the ARV and cardiac function between the two groups (Table 2).
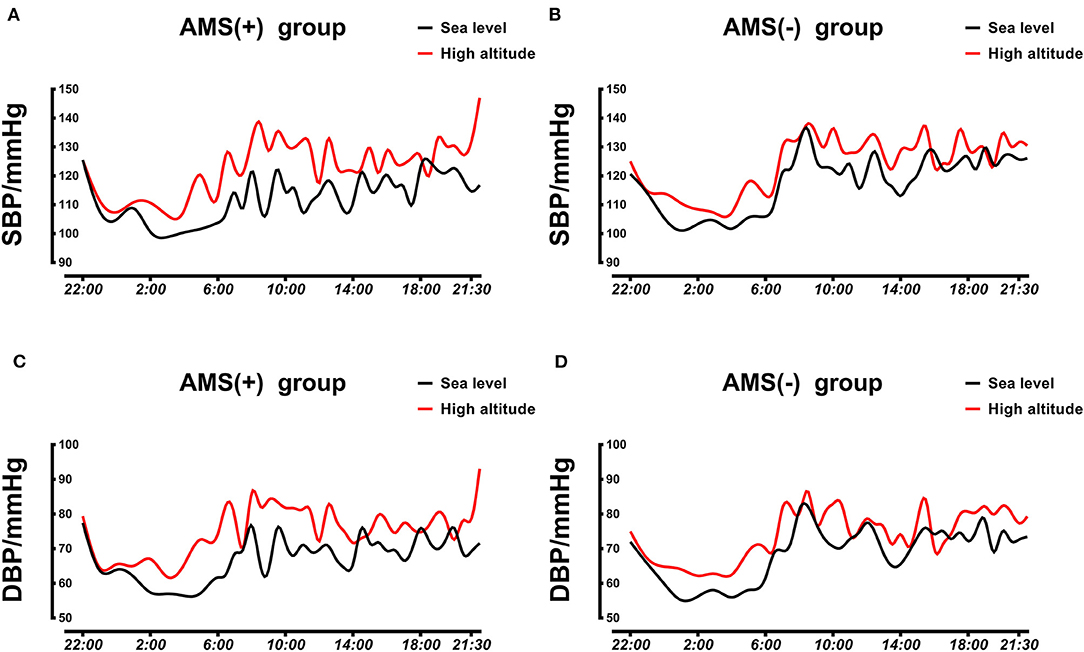
Figure 3. Averaged 24-h SBP and DBP profiles in AMS and non-AMS subjects. (A) Averaged 24-h SBP in AMS subjects at LA and HA. (B) Averaged 24-h SBP in non-AMS subjects at LA and HA. (C) Averaged 24-h DBP in AMS subjects at LA and HA. (D) Averaged 24-h DBP in non-AMS subjects at LA and HA. SBP, systolic blood pressure; DBP, diastolic blood pressure; LA, low altitude; HA, high altitude; AMS, acute mountain sickness.
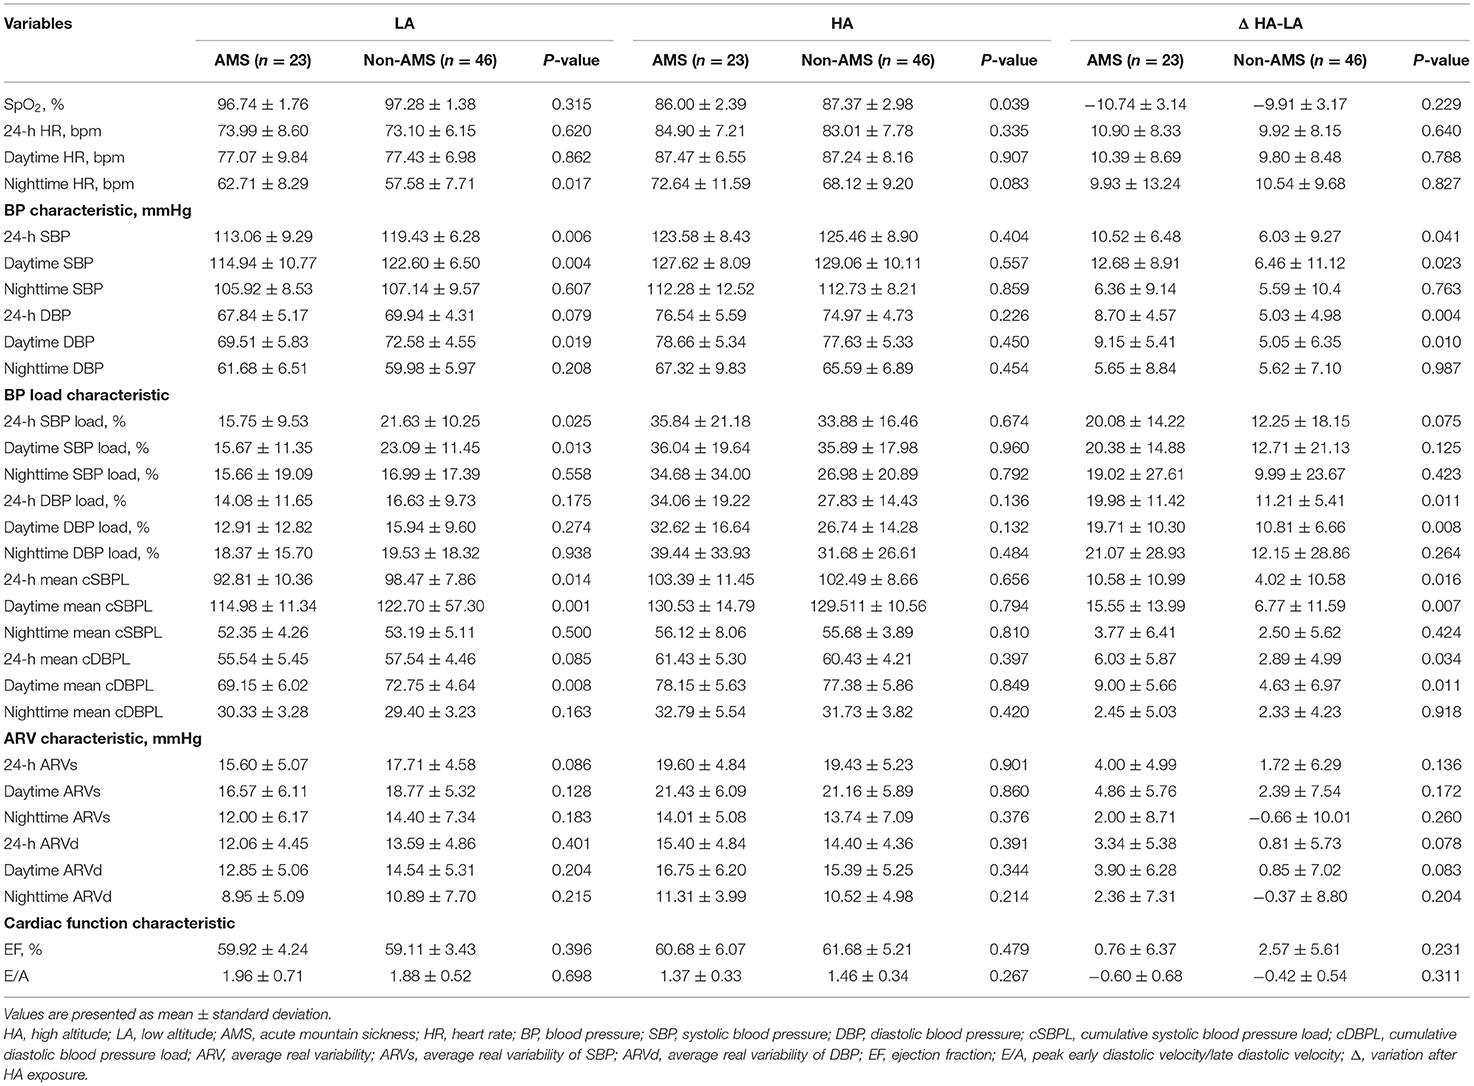
Table 2. Effect of acute HA exposure.
Risk Factors of AMS Associated With BP Variation
We looked for the risk factors of AMS which associated with the BP changes. After adjusting for age, sex, BMI, and smoking status, the results of the regression analysis showed that 24-h SBP variation (OR = 1.08, P = 0.036), 24-h DBP variation (OR = 1.21, P = 0.007), 24-h SBP load variation (OR = 1.05, P = 0.010), 24-h DBP load variation (OR = 1.06, P = 0.016), 24-h mean cSBPL variation (OR = 1.07, P = 0.024), 24-h mean cDBPL variation (OR = 1.14, P = 0.034) were independent risk factors of AMS (Table 3).
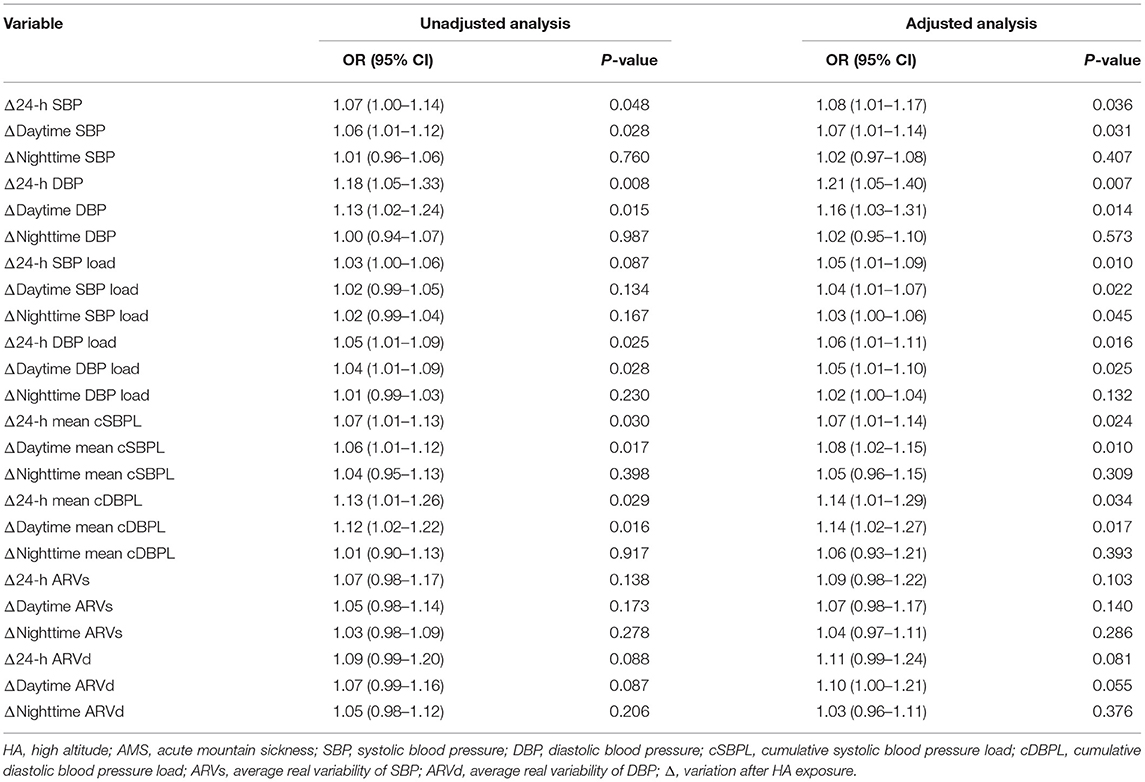
Table 3. Risk factors of AMS.
Correlation Between BP Parameters Variations and AMS
In order to more effectively evaluate the BP status of individuals and the relationship between BP changes and AMS during HA exposure, we analyzed the correlation between the changes in some BP indicators and the AMS. The variations in BP load (24-h SBP load variation, R = 0.369, P = 0.001; 24-h DBP load variation, R = 0.310, P = 0.005) as well as mean cBPL (24-h mean cSBPL variation, R = 0.504, P < 0.001; 24-h mean cDBPL variation, R = 0.290, P = 0.007) were also correlated with AMS score; which indicated that the BP load could also reflect BP status at HA and was associated with AMS (Figure 4; Supplementary Figure 1).
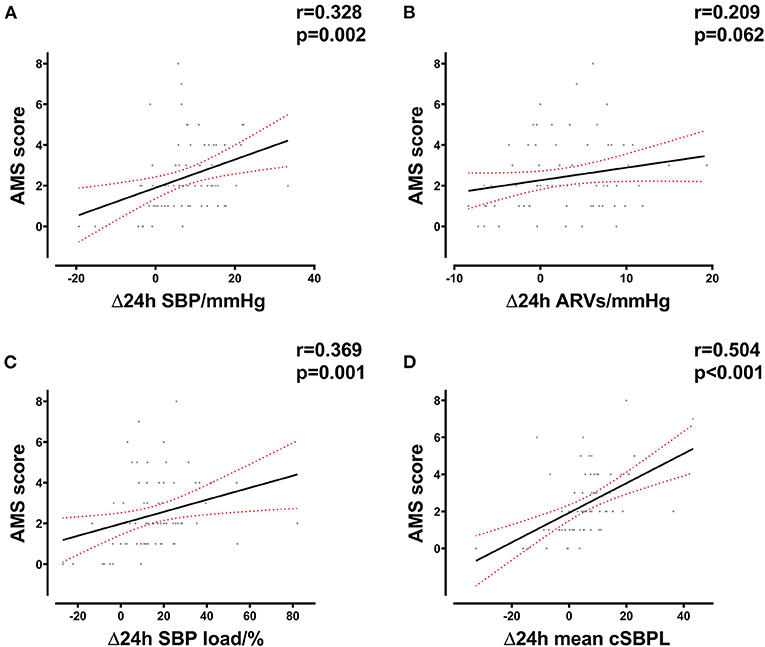
Figure 4. Correlation between delta 24-h SBP parameters and AMS score. (A) Correlation between delta 24-h SBP after HA exposure and AMS score in all subjects. (B) Correlation between delta 24-h ARVs after HA exposure and AMS score in all subjects. (C) Correlation between delta 24-h SBP load after HA exposure and AMS score in all subjects. (D) Correlation between delta mean 24-h cSBPL after HA exposure and AMS score in all subjects. HA, high altitude; AMS, acute mountain sickness; SBP, systolic blood pressure; cSBPL, cumulative systolic blood pressure load; ARVs, average real variability of SBP.
Discussion
Our study is the first to demonstrate that changes in the BP load and AMS occur upon acute HA exposure in both healthy and AMS subjects. We analyzed the correlation between BP indicator variations and AMS. Interestingly, we observed that subjects with AMS displayed a higher BP level and BP load elevation than those without AMS after acute HA exposure. BP load changes during altitude may be closely correlated with the incidence of AMS. It could be an effective indicator of BP status assessment in AMS patients at HA.
BP Changes After HA Exposure
BP remained largely unchanged over the first few minutes or hours after HA exposure. However, the BP increased remarkably and persisted with prolonged altitude exposure over the next few days. The rise appeared to be continuous and proportional to altitude. It was particularly pronounced at night, which resulted in a reduction in the decline in nocturnal BP; the circadian rhythm of 24-h BP fluctuations disappeared. BP primarily returned to the baseline level when on the return to sea level (18, 19). While in hypertensive subjects, a higher hypoxia-driven upward shift and steepening of the BP response to exercise were observed (20, 21). Initially, the secretion of vasodilator factors, such as nitric oxide, could counteract the effect of sympathetic activation (22). Subsequently, pressor mechanisms begin to dominate. The enhanced sympathetic nerve activity caused by hypobaric hypoxia is related to the sympathetic reflex stimulated by chemoreceptors in the carotid sinus and aortic arch, which stimulates the release of catecholamines. Mazzeo and Reeves have also confirmed this point that while the activity of the renin-angiotensin-aldosterone system was inhibited, the increase in vasoconstrictor factor secretion results in the elevation of peripheral vascular resistance caused by contraction of the smooth muscle arterioles (23). However, difference in peripheral α-adrenergic sensitivity to norepinephrine between sexes may produce different hypoxia-induced BP changes (24). Factors including endothelin-1 levels and erythropoietin are also potentially involved (25). Although cardiac diastolic relaxation was decreased, an elevated systolic function may result in BP increase (26).
Clinical Meaning of BP Load
The BP load was introduced by pioneering studies published in the early 1990s (27). This may provide supplementary information for the diagnosis of hypertension in individuals when 24-h ABP would be misleading (27). At present, in addition to the mean BP, the degree of BP fluctuation has garnered increasing attention. Further, owing to the limited information provided by calculating the number of readings exceeding the normal BP threshold levels, several investigators have proposed a method for calculating the area under the curve (28). This reflects the extent and duration of the cumulative rise in BP, and may provide information that more closely reflects the actual BP status. In addition, other indicators that assess BP fluctuations, such as ARV, exhibited little independent prognostic significance (29). Previous studies suggested that the BP load was also closely associated with signs of target organ damage and adverse clinical cardiovascular events as the BP level (30, 31). Meanwhile, some studies have recommended to combining BP level and BP load to define hypertension and assess BP status (32). As no additional predictive value for the risk of target organ damage or cardiovascular complications after average the BP is considered (9, 33). However, the application of BP load to demonstrate BP status remains to be confirmed in extreme environments, and it may possess unique significance for the prediction and evaluation of HA cardiovascular disease.
Association Between BP, BP Load and AMS
The relationship between changes in BP after altitude exposure and AMS remains controversial in previous studies. Although study has shown that BP remains relatively safe and stable at altitudes without to be symptomatic (34), it was also previously demonstrated that the BP elevation in AMS is relatively obvious after the acute plateau (35), and that higher BP at HA is related to the onset of AMS (7). Our previous study also revealed that the increase in BP during a certain period is related to sympathetic hyperexcitation, and excessive morning BP surge is associated with the onset of AMS (36). However, in some large size studies, increased BP after acute HA exposure has not been confirmed to be associated with AMS (37), and even a medical history of hypertension may be associated with a lower risk of AMS (37, 38). These conflicting results may be mainly due to individual differences among the populations included in the studies. For example, increased arterial thickness, decreased production of the vasodilator nitric oxide cerebral and lower blood flow might enable hypertensive patients less susceptible to AMS (15, 18). Thus, we excluded individuals with potential hypertension in this cohort study, which may have affected our observed results at HA in order to accurately reflect the relationship between BP changes during HA and the incidence of AMS. Because single BP measurement is not a good reflection of systemic circulation status, we also performed ABP measurement. Previous studies have confirmed some AMS risk factors. And certain factor, such as sex difference, may have an effect on BP changes during hypoxia (39, 40). We performed multivariate logistic regression and found BP load variation was independent risk factor of AMS after adjusting. Besides, we also demonstrated that there was a linear relationship between BP level variation and AMS although the degree of correlation was weak. Few previous reports have analyzed the relationship between high BP load and the risk of cardiovascular disease at HA. The excessive BP load is primarily due to the sympathetic excitation of the body (21). Moreover, AMS was associated with autonomic nervous dysfunction in previous studies. Patients with AMS development may accompanied with a disturbed BP control and an insufficient vasoconstriction function during altitude exposure (41, 42). And hyperactivation of the short-sympathetic after the acute plateau may be the main mechanism of pathogenesis. AMS may be induced by the elevation of BP after HA exposure, because an excessive rise in BP might result in symptoms, such as dizziness and headaches (36, 43). Therefore, we believe that BP load might be a good indicator of systemic circulation status assessment potentially during HA exposure. Our results also confirmed that changes in the BP load calculated using different methods are associated with AMS. Especially 24-h mean cSBPL showed a better correlation with AMS score compared with other ABP parameters. However, we also found that the variation in BP variability, which also reflects the degree of sympathetic excitation, was poorly associated with AMS. BP load may be a better indicator that reflect systemic circulation status in individuals with AMS at HA. A larger population study is required to confirm this point in the future. Notably, the explicit pathophysiology of AMS still remains unclear now. Previous study has proven that hypoxia could induce the blood-brain barrier disruption and lead to the development of cerebral edema subsequently. An increased brain volume with hypobaric hypoxia elevated intracranial pressure and impaired intracranial buffering capacity, which contributes to the development of the symptoms that define AMS (44). Sympathetic excitation causes the increase of systemic circulation BP load, cerebrovascular may also appear similar hemodynamic changes related to cerebral edema. But unfortunately, the relevant data were not tested. But at least, clinical evidences of the autonomic nervous system effects on AMS development could stimulate future research.
Limitations
There are several limitations to the present study. Most importantly, due to the limitations of the HA conditions in this study, the BP data were not as complete as those of some studies conducted at LA, although the ABP recordings were still more than 80% of the total ABP data recorded. Therefore, we adjusted the calculation method of the cBPL by calculating the mean cumulative BP load. Notably, there might be a superior method of calculating the area under the fitting curve that is above the hypertension threshold (30). However, we did not use this method, because we were constrained by the discontinuity of the data. Secondly, the diagnosis of AMS was based on self-report, which could have led to classification bias. Moreover, we did not assess sleep status. Sleep may be disturbed during night ABP measurement. In addition, we did not examine some important indexes which could reflect the potential mechanism of AMS, such as cerebral hemodynamic monitoring. Lastly, different demography, such as race, smoking and drinking history may affect the established results. This conclusion is still need to be examined.
Conclusion
To date, little is known about the relationship between BP load and AMS. Our study demonstrated that individuals with AMS exhibited higher BP levels and BP load changes after exposure to altitude. Excessive BP load variations are associated with AMS. BP load could be an effective indicator of systemic circulation status in AMS patients. These results may provide novel insights into the mechanisms underlying the occurrence of AMS.
Data Availability Statement
The original contributions presented in the study are included in the article/Supplementary Material, further inquiries can be directed to the corresponding author/s.
Ethics Statement
The studies involving human participants were reviewed and approved by Human Ethics Committee of the Xinqiao Hospital, Third Military Medical University (Identification code, 201907501) which registered at www.chictr.org.cn (ChiCTR-TRC-No.1900025728). The patients/participants provided their written informed consent to participate in this study. Written informed consent was obtained from the individual(s) for the publication of any potentially identifiable images or data included in this article.
Author Contributions
RChen and LH worked on the conception of the study. RChen, MS, YY, JK, FY, CH, RCheng, and HL contributed to the data collection. CL and JY checked the data. RChen and XY performed the statistical analysis. RChen drafted the manuscript. XG, CL, JY, HT, JZ, and LH reviewed the manuscript. All authors read and approved the final version of the manuscript.
Funding
This work was supported by grants from the National Natural Science Foundation of China (Grant No. 81730054), Research Project of PLA (Grant No. BLJ18J007), and the Ministry of Health of P.R. China (Grant No. 201002012).
Conflict of Interest
The authors declare that the research was conducted in the absence of any commercial or financial relationships that could be construed as a potential conflict of interest.
Publisher's Note
All claims expressed in this article are solely those of the authors and do not necessarily represent those of their affiliated organizations, or those of the publisher, the editors and the reviewers. Any product that may be evaluated in this article, or claim that may be made by its manufacturer, is not guaranteed or endorsed by the publisher.
Acknowledgments
We appreciated all the subjects who participated in the study.
Supplementary Material
The Supplementary Material for this article can be found online at: https://www.frontiersin.org/articles/10.3389/fcvm.2021.765422/full#supplementary-material
Supplementary Figure 1. Correlation between delta 24-h DBP parameters and AMS score. (A) Correlation between delta 24-h DBP after HA exposure and AMS score in all subjects. (B) Correlation between delta 24-h ARVd after HA exposure and AMS score in all subjects. (C) Correlation between delta 24-h DBP load after HA exposure and AMS score in all subjects. (D) Correlation between delta mean 24-h cDBPL after HA exposure and AMS score in all subjects. HA, high altitude; AMS, acute mountain sickness; DBP, diastolic blood pressure; cDBPL, cumulative diastolic blood pressure load; ARVd, average real variability of DBP.
References
1. Riley CJ, Gavin M. Physiological changes to the cardiovascular system at high altitude and its effects on cardiovascular disease. High Alt Med Biol. (2017) 18:102–13. doi: 10.1089/ham.2016.0112
2. Naeije R. Physiological adaptation of the cardiovascular system to high altitude. Prog Cardiovasc Dis. (2010) 52:456–66. doi: 10.1016/j.pcad.2010.03.004
3. Luks AM, Swenson ER, Bärtsch P. Acute high-altitude sickness. Eur Respir Rev. (2017) 26:160096. doi: 10.1183/16000617.0096-2016
4. Imray C, Wright A, Subudhi A, Roach R. Acute mountain sickness: pathophysiology, prevention, and treatment. Prog Cardiovasc Dis. (2010) 52:467–84. doi: 10.1016/j.pcad.2010.02.003
5. Ke J, Liu C, Yu S, Bian S, Zhang C, Yang J, et al. Low stroke volume index in healthy young men is associated with the incidence of acute mountain sickness after an ascent by airplane: a case-control study. Biomed Res Int. (2020) 2020:6028747. doi: 10.1155/2020/6028747
6. Hamm W, Kassem S, von Stülpnagel L, Maier F, Klemm M, Schüttler D, et al. Deceleration capacity and periodic repolarization dynamics as predictors of acute mountain sickness. High Alt Med Biol. (2020) 21:417–422. doi: 10.1089/ham.2020.0131
7. White WB. Impact of the daily blood pressure load on the development of hypertensive heart disease. Cardiology. (1992) 81:299–306. doi: 10.1159/000175820
8. Liu Y, Zhang JH, Gao XB, Wu XJ, Yu J, Chen JF, et al. Correlation between blood pressure changes and AMS, sleeping quality and exercise upon high-altitude exposure in young Chinese men. Mil Med Res. (2014) 1:19. doi: 10.1186/2054-9369-1-19
9. Liu M, Li Y, Wei FF, Zhang L, Han JL, Wang JG. Is blood pressure load associated, independently of blood pressure level, with target organ damage? J Hypertens. (2013) 31:1812–8. doi: 10.1097/HJH.0b013e3283624f9b
10. Parati G, Liu X, Ochoa JE. What matters is not only how often but also how much blood pressure rises. Limitations of blood pressure load. J Hypertens. (2013) 31:1776–9. doi: 10.1097/HJH.0b013e328364105e
11. Zhou B, Li C, Shou J, Zhang Y, Wen C, Zeng C. The cumulative blood pressure load and target organ damage in patients with essential hypertension. J Clin Hypertens. (2020) 22:981–90. doi: 10.1111/jch.13875
12. Simpson LL, Busch SA, Oliver SJ, Ainslie PN, Stembridge M, Steinback CD, et al. Baroreflex control of sympathetic vasomotor activity and resting arterial pressure at high altitude: insight from Lowlanders and Sherpa. J Physiol. (2019) 597:2379–90. doi: 10.1113/JP277663
13. chinese guidelines for prevention and treatment of hypertension-a report of the revision committee of Chinese guidelines for prevention and treatment of hypertension. J Geriatr Cardiol. (2019) 16:182–241. doi: 10.11909/j.issn.1671-5411.2019.03.014
14. Hermida RC, Crespo JJ, Otero A, Domínguez-Sardiña M, Moyá A, Ríos MT, et al. Asleep blood pressure: significant prognostic marker of vascular risk and therapeutic target for prevention. Eur Heart J. (2018) 39:4159–71. doi: 10.1093/eurheartj/ehy475
15. Phelan B, Mather L, Regmi N, Starling J, Twillmann D, McElwee M, et al. Ambulatory blood pressure at sea level and high altitude in a climber with a kidney transplant and hypertension. High Alt Med Biol. (2019) 20:307–11. doi: 10.1089/ham.2018.0118
16. Mena L, Pintos S, Queipo NV, Aizpúrua JA, Maestre G, Sulbarán T. A reliable index for the prognostic significance of blood pressure variability. J Hypertens. (2005) 23:505–11. doi: 10.1097/01.hjh.0000160205.81652.5a
17. Grossman E, Alster Y, Shemesh J, Nussinovitch N, Rosenthal T. Left ventricular mass in hypertension: correlation with casual, exercise and ambulatory blood pressure. J Hum Hypertens. (1994) 8:741–6.
18. Verratti V, Ferrante C, Soranna D, Zambon A, Bhandari S, Orlando G, et al. Effect of high-altitude trekking on blood pressure and on asymmetric dimethylarginine and isoprostane production: results from a Mount Ararat expedition. J Clin Hypertens. (2020) 22:1494–503. doi: 10.1111/jch.13961
19. Bilo G, Caravita S, Torlasco C, Parati G. Blood pressure at high altitude: physiology and clinical implications. Kardiol Pol. (2019) 77:596–603. doi: 10.33963/KP.14832
20. Bilo G, Villafuerte FC, Faini A, Anza-Ramírez C, Revera M, Giuliano A, et al. Ambulatory blood pressure in untreated and treated hypertensive patients at high altitude: the High Altitude Cardiovascular Research-Andes study. Hypertension. (2015) 65:1266–72. doi: 10.1161/HYPERTENSIONAHA.114.05003
21. Caravita S, Faini A, Baratto C, Bilo G, Macarlupu JL, Lang M, et al. Upward shift and steepening of the blood pressure response to exercise in hypertensive subjects at high altitude. J Am Heart Assoc. (2018) 7:e008506. doi: 10.1161/JAHA.117.008506
22. Parati G, Ochoa JE, Torlasco C, Salvi P, Lombardi C, Bilo Aging G. High altitude, and blood pressure: a complex relationship. High Alt Med Biol. (2015) 16:97–109. doi: 10.1089/ham.2015.0010
23. Mazzeo RS, Reeves JT. Adrenergic contribution during acclimatization to high altitude: perspectives from Pikes Peak. Exerc Sport Sci Rev. (2003) 31:13–8. doi: 10.1097/00003677-200301000-00004
24. Freedman RR, Sabharwal SC, Desai N. Sex differences in peripheral vascular adrenergic receptors. Circ Res. (1987) 61:581–5. doi: 10.1161/01.RES.61.4.581
25. Berger MM, Macholz F. Endothelin-1 plasma levels and acute mountain sickness. High Alt Med Biol. (2016) 17:141. doi: 10.1089/ham.2016.0019
26. van Mil AC, Pearson J, Drane AL, Cockcroft JR, McDonnell BJ, Stohr EJ. Interaction between left ventricular twist mechanics and arterial haemodynamics during localised, non-metabolic hyperaemia with and without blood flow restriction. Exp Physiol. (2016) 101:509–20. doi: 10.1113/EP085623
27. Zachariah PK, Sumner WE 3rd. The clinical utility of blood pressure load in hypertension. Am J Hypertens. (1993) 6:194s−7s.
28. Nobre F, Mion D Jr. Is the area under blood pressure curve the best parameter to evaluate 24-h ambulatory blood pressure monitoring data? Blood Press Monit. (2005) 10:263–70. doi: 10.1097/01.mbp.0000180669.38161.6e
29. Hansen TW, Thijs L, Li Y, Boggia J, Kikuya M, Björklund-Bodegård K, et al. Prognostic value of reading-to-reading blood pressure variability over 24 hours in 8938 subjects from 11 populations. Hypertension. (2010) 55:1049–57. doi: 10.1161/HYPERTENSIONAHA.109.140798
30. Bauwens F, Duprez D, De Buyzere M, Clement DL. Blood pressure load determines left ventricular mass in essential hypertension. Int J Cardiol. (1992) 34:335–8. doi: 10.1016/0167-5273(92)90032-X
31. Mulè G, Nardi E, Andronico G, Cottone S, Raspanti F, Piazza G, et al. Relationships between 24 h blood pressure load and target organ damage in patients with mild-to-moderate essential hypertension. Blood Press Monit. (2001) 6:115–23. doi: 10.1097/00126097-200106000-00001
32. Flynn JT, Kaelber DC, Baker-Smith CM, Blowey D, Carroll AE, Daniels SR, et al. Clinical practice guideline for screening and management of high blood pressure in children and adolescents. Pediatrics. (2017) 140:e20171904. doi: 10.1542/peds.2017-1904
33. Li Y, Thijs L, Boggia J, Asayama K, Hansen TW, Kikuya M, et al. Blood pressure load does not add to ambulatory blood pressure level for cardiovascular risk stratification. Hypertension. (2014) 63:925–33. doi: 10.1161/HYPERTENSIONAHA.113.02780
34. Keyes LE, Sallade TD, Duke C, Starling J, Sheets A, Pant S, et al. Blood pressure and altitude: an observational cohort study of hypertensive and nonhypertensive himalayan trekkers in Nepal. High Alt Med Biol. (2017) 18:267–77. doi: 10.1089/ham.2017.0001
35. Shen Y, Yang YQ, Liu C, Yang J, Zhang JH, Jin J, et al. Association between physiological responses after exercise at low altitude and acute mountain sickness upon ascent is sex-dependent. Mil Med Res. (2020) 7:53. doi: 10.1186/s40779-020-00283-3
36. Chen R, Yang J, Liu C, Sun M, Ke J, Yang Y, et al. Sex-dependent association between early morning ambulatory blood pressure variations and acute mountain sickness. Front Physiol. (2021) 12:649211. doi: 10.3389/fphys.2021.649211
37. Duke CB, Sallade TD, Starling J, Pant S, Sheets A, McElwee MK, et al. Hypertension and acute mountain sickness in himalayan trekkers in nepal: an observational cohort study. Wilderness Environ Med. (2020) 31:157–64. doi: 10.1016/j.wem.2020.01.004
38. Burtscher M, Philadelphy M, Gatterer H, Burtscher J, Faulhaber M, Nachbauer W, et al. Physiological responses in humans acutely exposed to high altitude (3480 m): minute ventilation and oxygenation are predictive for the development of acute mountain sickness. High Alt Med Biol. (2019) 20:192–7. doi: 10.1089/ham.2018.0143
39. Jacob DW, Ott EP, Baker SE, Scruggs ZM, Ivie CL, Harper JL, et al. Sex differences in integrated neurocardiovascular control of blood pressure following acute intermittent hypercapnic hypoxia. Am J Physiol Regul Integr Comp Physiol. (2020) 319:R626–36. doi: 10.1152/ajpregu.00191.2020
40. Burtscher M, Philadelphy M, Burtscher J, Likar R. Sex-specific differences in blood pressure responses following acute high-altitude exposure. J Travel Med. (2021). doi: 10.1093/jtm/taab035 [Epub ahead of print].
41. Niebauer JH, Niebauer J, Wille M, Burtscher M. Systemic blood pressure variation during a 12-hour exposure to normobaric hypoxia (4500 m). High Alt Med Biol. (2020) 21:194–9. doi: 10.1089/ham.2019.0130
42. Lanfranchi PA, Colombo R, Cremona G, Baderna P, Spagnolatti L, Mazzuero G, et al. Autonomic cardiovascular regulation in subjects with acute mountain sickness. Am J Physiol Heart Circ Physiol. (2005) 289:H2364–72. doi: 10.1152/ajpheart.00004.2005
43. Iturriaga R, Andrade DC, Del Rio R. Enhanced carotid body chemosensory activity and the cardiovascular alterations induced by intermittent hypoxia. Front Physiol. (2014) 5:468. doi: 10.3389/fphys.2014.00468
Keywords: ambulatory blood pressure monitoring, blood pressure load, area under the blood pressure curve, acute mountain sickness, high altitude
Citation: Chen R, Ye X, Sun M, Yang J, Zhang J, Gao X, Liu C, Ke J, He C, Yuan F, Lv H, Yang Y, Cheng R, Tan H and Huang L (2022) Blood Pressure Load: An Effective Indicator of Systemic Circulation Status in Individuals With Acute Altitude Sickness. Front. Cardiovasc. Med. 8:765422. doi: 10.3389/fcvm.2021.765422
Received: 27 August 2021; Accepted: 13 December 2021;
Published: 03 January 2022.
Edited by:
Nicola Mumoli, ASST Ovest Milanese, ItalyReviewed by:
Matiram Pun, University of Calgary, CanadaMartin Burtscher, University of Innsbruck, Austria
Copyright © 2022 Chen, Ye, Sun, Yang, Zhang, Gao, Liu, Ke, He, Yuan, Lv, Yang, Cheng, Tan and Huang. This is an open-access article distributed under the terms of the Creative Commons Attribution License (CC BY). The use, distribution or reproduction in other forums is permitted, provided the original author(s) and the copyright owner(s) are credited and that the original publication in this journal is cited, in accordance with accepted academic practice. No use, distribution or reproduction is permitted which does not comply with these terms.
*Correspondence: Lan Huang, aHVhbmdsYW4yNjBAMTI2LmNvbQ==