- 1The Cardiovascular Institute Hospital, Tokyo, Japan
- 2School of Medicine, Cardiff University, Cardiff, United Kingdom
- 3Tokyo Medical University Hospital, Tokyo, Japan
Background: Discriminating between different patterns of diastolic dysfunction in heart failure (HF) is still challenging. We tested the hypothesis that an unsupervised machine learning algorithm would detect heterogeneity in diastolic function and improve risk stratification compared with recommended consensus criteria.
Methods: This study included 279 consecutive patients aged 24–97 years old with clinically stable HF referred for echocardiographic assessment, in whom diastolic variables were measured according to the current guidelines. Cluster analysis was undertaken to identify homogeneous groups of patients with similar profiles of the variables. Sequential Cox models were used to compare cluster-based classification with guidelines-based classification for predicting clinical outcomes. The primary endpoint was hospitalization for worsening HF.
Results: The analysis identified three clusters with distinct properties of diastolic function that shared similarities with guidelines-based classification. The clusters were associated with brain natriuretic peptide level (p < 0.001), hemoglobin concentration (p = 0.017) and estimated glomerular filtration rate (p = 0.001). During a mean follow-up period of 2.6 ± 2.0 years, 62 patients (22%) experienced the primary endpoint. Cluster-based classification predicted events with a hazard ratio 1.68 (p = 0.019) that was independent from and incremental to the Meta-analysis Global Group in Chronic Heart Failure (MAGGIC) risk score for HF, and from left ventricular end-diastolic volume and global longitudinal strain, whereas guidelines-based classification did not retain its independent prognostic value (hazard ratio = 1.25, p = 0.202).
Conclusion: Machine learning can identify patterns of diastolic function that better stratify the risk for decompensation than the current consensus recommendations in HF. Integrating this data-driven phenotyping may help in refining prognostication and optimizing treatment.
Introduction
Left ventricular (LV) diastolic dysfunction is a key pathophysiological feature of heart failure (HF) and its assessment plays an important role in diagnosing, monitoring and prognosticating HF. It appears early in the natural course of various types of cardiovascular diseases and once severe, diastolic dysfunction is associated with elevated left atrial pressure (1, 2). The clinical diagnosis of HF requires not only the presence of symptoms and/or signs of HF, but also objective evidence of cardiac structural or functional abnormalities, including LV diastolic dysfunction, especially when LV ejection fraction (LVEF) is preserved. LV diastolic dysfunction also predicts adverse outcomes in HF, as demonstrated in a number of large-scale cohort studies (1, 3–5).
In clinical practice, LV diastolic function is assessed using echocardiography by measuring multiple variables, for example from transmitral flow and mitral annular velocity profiles. Each variable reflects a different physiological aspect of LV filling, and all are inter-related in a complex manner (2). Standard criteria do not always change linearly with the elevation of LV filling pressure (6). No single parameter by itself is robust enough to be used for diagnosing diastolic dysfunction, so it is recommended that all relevant parameters should be taken into account when grading diastolic dysfunction. Consensus diagnostic recommendations propose decision-tree algorithms which have been constructed based on expert consensus and theoretical considerations rather than on clinical evidence (7). The utility of the updated consensus recommendations requires further investigation.
Machine learning is a method for analyzing data that, unlike traditional statistics, can deal with complex datasets with multivariable non-linear interactions. It constructs analytical models to extract insights, patterns and relationships that can be used for decision-making. In cardiovascular medicine, machine learning has identified new clinical phenotypes, predicted responses to treatment, and improved prognostication (8–10). Accordingly, we tested the hypothesis that applying cluster analysis would detect heterogeneity in diastolic function and improve risk stratification in a HF population.
Materials and Methods
Study Population
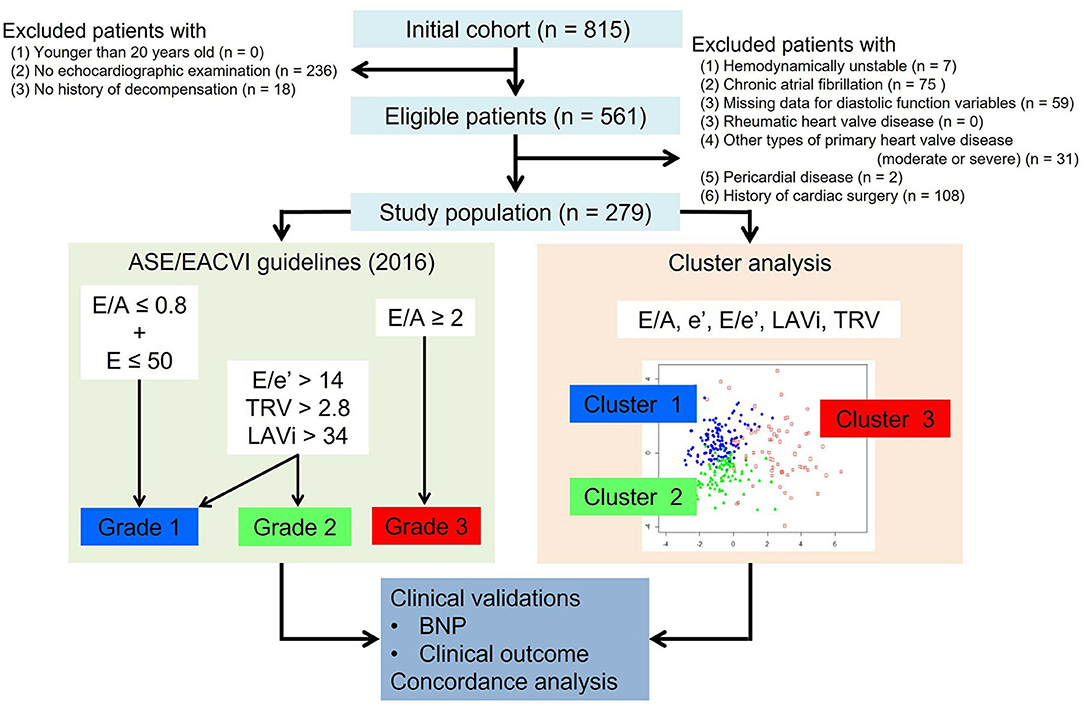
From the HF database of the Cardiovascular Institute, Japan (Shinken database, registered in University Hospital Medical Information Network, ID000008598), we retrospectively identified a consecutive series of 815 patients with clinically stable HF. Patients were eligible for this study if they were older than 20 years at the time of the index echocardiographic examination, and if they had been referred to echocardiography for hemodynamic assessment between February 2010 and August 2018, and if they had a history of previous hospitalization for acute decompensated HF with symptoms sufficient to warrant hospitalization and for which intravenous therapy was required. In total 561 patients fulfilled these criteria, but those were excluded who had any of the following: (1) being treated with intravenous therapy at the index examination, (2) atrial fibrillation at the index examination (patients with paroxysmal atrial fibrillation who were in sinus rhythm at the index examination were included), (3) any missing data for diastolic variables, (4) rheumatic heart valve disease, (5) any other types of primary heart valve disease more than moderate, (6) pericardial disease and (7) history of cardiac surgery (Figure 1). This exclusion left 279 patients as the study population.
This study was approved by the institutional review board. All the patients gave written informed consent when registered in the hospital database.
LV Chamber Quantification and Guidelines-Based Classification of Diastolic Function
Comprehensive echocardiographic examination was performed, using commercially available ultrasound machines with a 2.5 MHz sector transducer (Vivid E95 and E9, General Electric Company; iE33 and Epic7, Phillips; Artida, Cannon; Prosound alpha10, Hitachi). LV end-diastolic and end-systolic volumes and LVEF were calculated by the disk summation method. LV mass was calculated as recommended and normalized by body surface area (LVMi). LV global longitudinal and circumferential strains were measured using Image Arena (TOMTEC Imaging Systems GmbH, Germany). Left atrial volume was also measured by the disk summation method and normalized by body surface area (LAVi). Pulse-wave Doppler tracings at the tip of the mitral valve leaflets were recorded, and early to late diastolic transmitral velocity ratio (E/A) was calculated. Mitral annular velocities were recorded using pulsed tissue Doppler from the base of the septum in an apical 4-chamber view, to evaluate LV longitudinal function (s', e' and a'). Left atrial pressure was estimated from the ratio of transmitral E velocity to early diastolic mitral annular velocity (E/e'). A continuous-wave Doppler tracing of tricuspid regurgitation (TRV) was recorded to assess pulmonary hypertension. Right ventricular end-diastolic area and fractional area change were measured in an apical 4-chamber view to derive right ventricular size and systolic function.
The current American Society of Echocardiography/European Association of Cardiovascular Imaging consensus recommendations proposed two different algorithms for assessing diastolic function (7). In this study, diastolic function was graded using the algorithm for patients with reduced LVEF and/or myocardial disease. This algorithm uses 4 variables: E/A, E/e', LAVi, and TRV and classifies patients into grade 1–3 diastolic dysfunction. Because lateral e' velocity was not available, we employed septal E/e'>15, instead of average E/e'>14 for grading (7). Because it was an inclusion criterion for this study that every patient had a complete dataset of diastolic variables, no patient was graded as indeterminate.
Cluster Analysis
Model-based cluster analysis, an unsupervised machine learning algorithm, was performed using mclust package in R (version 3.5.1, Vienna, Austria). This assumes that data points within a cluster are normally distributed, and it finds the mixture of multi-dimensional Gaussian probability distributions that best models the input dataset (11).
The analysis was applied in order to group the study population into clusters with distinct diastolic function properties. The diastolic variables used for cluster modeling were chosen based on their inclusion in current consensus recommendations (E/A, e', E/e', LAVi and TRV) (7). The degree of correlations between these variables were assessed by partial correlation analysis. All these variables were standardized to a mean = 0 and a standard deviation = 1 so that they were equally weighted in the analysis. The optimal number of clusters was selected based on Bayesian information criterion. The model parameters were estimated using expectation-maximization algorithm. The patients were assigned to a cluster where their posterior probability of membership was the highest. The clusters were numbered from low to high average values of E/e' and LAVi.
Clinical Relevance
The learned clusters were characterized by comparing clinical and echocardiographic variables. These variables, including demographics, vital signs, cardiac risk factors, HF symptoms, time since the first diagnosis of HF, drug treatment, and laboratory data such as hemoglobin level and estimated glomerular filtration rate (eGFR), which had all been recorded within 3 months of the index examination, were collected from the hospital database. Brain natriuretic peptide (BNP) measurement was available in 193 (70%) patients. The Meta-analysis Global Group in Chronic Heart Failure (MAGGIC) score, an established clinical risk score for HF, was calculated from all relevant variables (12).
Whether or not the learned clusters reasonably captured diastolic phenotypes was tested by studying the associations of BNP level and clinical outcomes with the clusters. The outcome data were obtained from the hospital database which integrates events documented in the hospital medical records and those recorded through an annual postal survey. Patients were censored when they stopped visiting the hospital or responding to the postal survey. Those who continued to attend and remained free from events at 5 years were automatically censored then. The primary endpoint was hospitalization for worsening HF. The secondary endpoint was a composite of cardiovascular death and hospitalization for worsening HF. The cardiovascular death was ascertained from medical records of the patients and from direct contact with local physicians. Sudden death was considered as cardiovascular death in this study.
Discordance Between Cluster-Based and Guidelines-Based Classifications
We did not expect full agreement between the two classifications and would rather highlight discordance where cluster-based classification could help further risk stratification. Principal component analysis was performed on the same five diastolic variables as used for the clustering, to plot and compare the patterns of grade and cluster distribution. A contingency table was created to identify where cluster-based classification was the most discordant with guidelines-based classification. BNP level and clinical outcomes were compared among the clusters in a subgroup of patients with discordant classifications.
Statistical Analysis
Categorical variables were expressed as number and percentage and were compared using chi-square test. Continuous variables were expressed as mean ± standard deviation and were compared using analysis of variance if the variables were normally distributed. If they were not found to be normally distributed, they were expressed as median (25–75th percentile) and were compared using Kruskal-Wallis test. Survival curves were estimated separately for cluster-based and guidelines-based classifications, using the Kaplan-Meier method, and compared using a log-rank test. Sequential Cox models were used to compare cluster-based and guidelines-based classifications. A baseline model was constructed by entering MAGGIC score and LV end-diastolic volume (LVEDV) and LV global longitudinal strain (LVGLS). We did not add LVEF in the model because it is already included in the MAGGIC score. Nested Cox models with separate addition of cluster-based and guidelines-based classification to the baseline model were constructed. The increase in predictive power after the addition of the classification variables was assessed by the change in overall model χ (2). Concordance between the two diastolic function classifications was assessed using Cohen's kappa statistic and Kendall's correlation coefficient. P value < 0.05 was considered as statistically significant. All statistical analyses were performed using IBM SPSS statistics version 19 (International Business Machines Corporation, Illinois, United States of America).
Results
Study Population
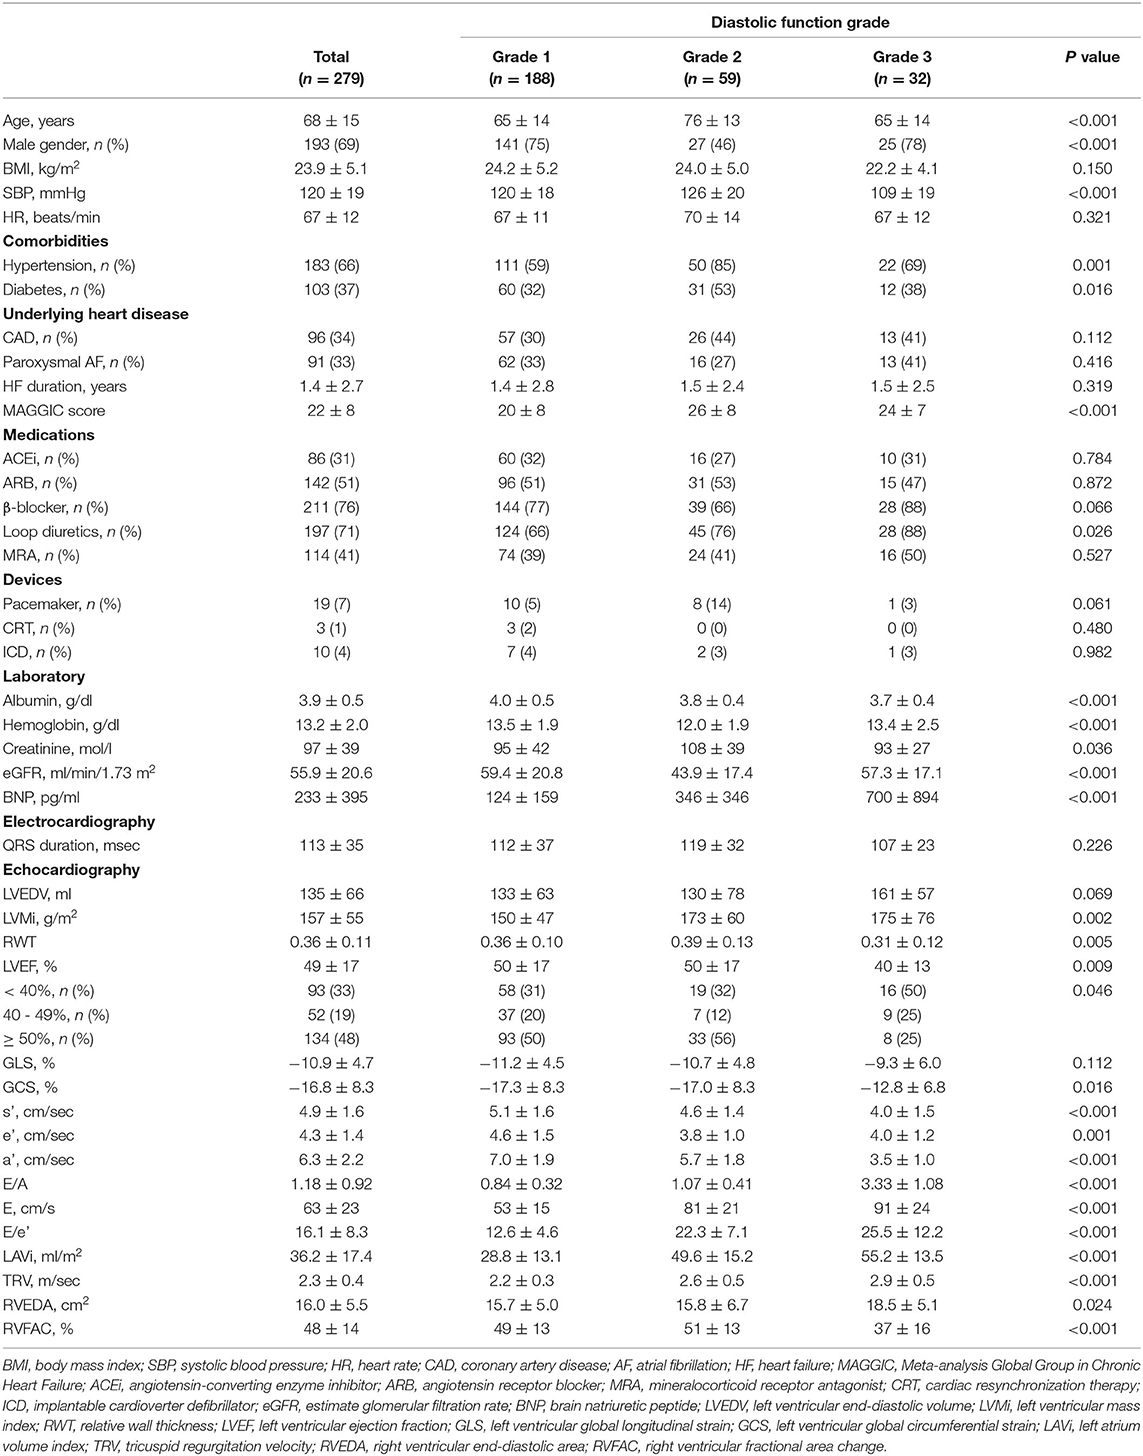
The comparisons of diastolic variables across the grades are illustrated in Figure 2 and the baseline characteristics are summarized in Table 1. A majority of the subjects (70%) were diagnosed as grade 1 diastolic dysfunction according to the current consensus recommendations. By definition, E/A (p < 0.001), E/e' (p < 0.001), LAVi (p < 0.001) and TRV (p < 0.001) progressively increased from grade 1 to 3. The e' (p = 0.001) was higher in grade 1 than in grade 2 and 3. Patients with grade 2 diastolic dysfunction were older (p < 0.001), more often women (p < 0.001) and more often had comorbidities such as hypertension (p = 0.001), diabetes (p = 0.016) than those with the other grades; heart failure with preserved ejection fraction (HFpEF, LVEF ≥ 50%) accounted for more than half in this subgroup. In comparison, patients with grade 3 diastolic dysfunction had lower blood pressure (p < 0.001) and were more often prescribed diuretics (p = 0.026). Heart failure with reduced ejection fraction (HFrEF, LVEF < 40%) associated with was prevalent in this subgroup; global circumferential strain was lower (p = 0.016) than in the other grades, although LVGLS was not different (p = 0.112); right ventricular function was also reduced (p < 0.001).
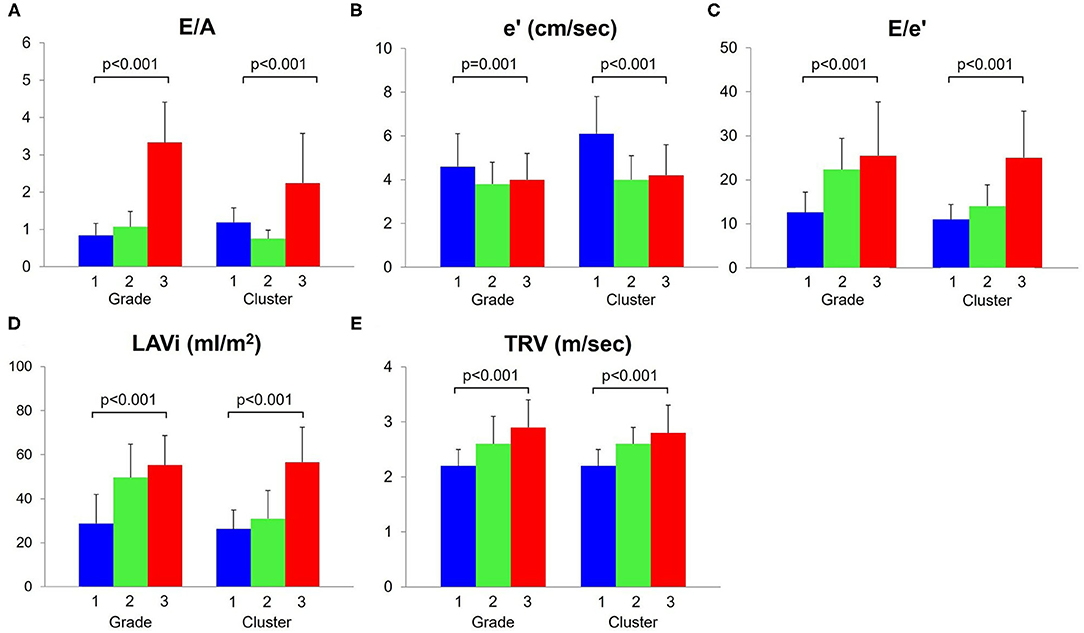
Figure 2. Comparisons of diastolic function variables. These five variables (A–E) were used for cluster analysis. The e' (B) decreased and E/e' (C), LAVi (D) and TRV (E) increased, as diastolic function worsened (grade/cluster number increased). LAVi, left atrium volume index; TRV, tricuspid regurgitation velocity.
Clustering
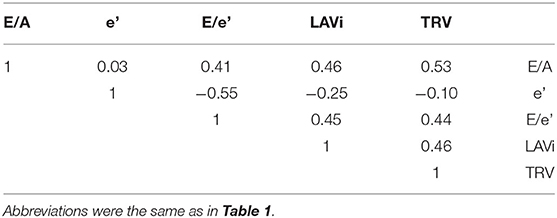
After confirming that diastolic variables (E/A, e', E/e', LAVi and TRV) were not strongly correlated each other (Table 2), we performed a cluster analysis using only these variables as input. Bayesian information criterion indicated that a three-cluster models best fit the dataset, because absolute value of Bayesian information criterion was the lowest when the dataset was modeled with three clusters (Figure 3).
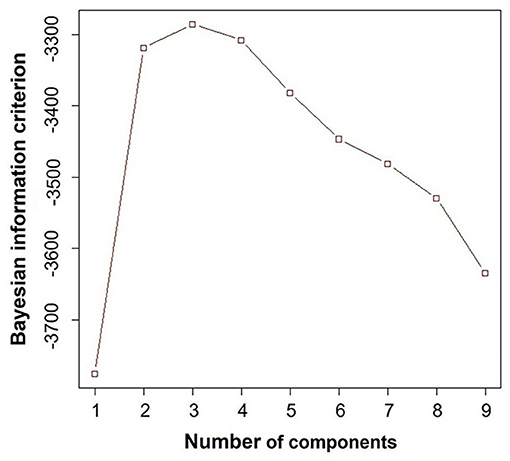
Figure 3. Bayesian information criterion. This result demonstrated that three-cluster model fit the best, because the absolute value of Bayesian information criterion was the lowest when the dataset was modeled with three clusters.
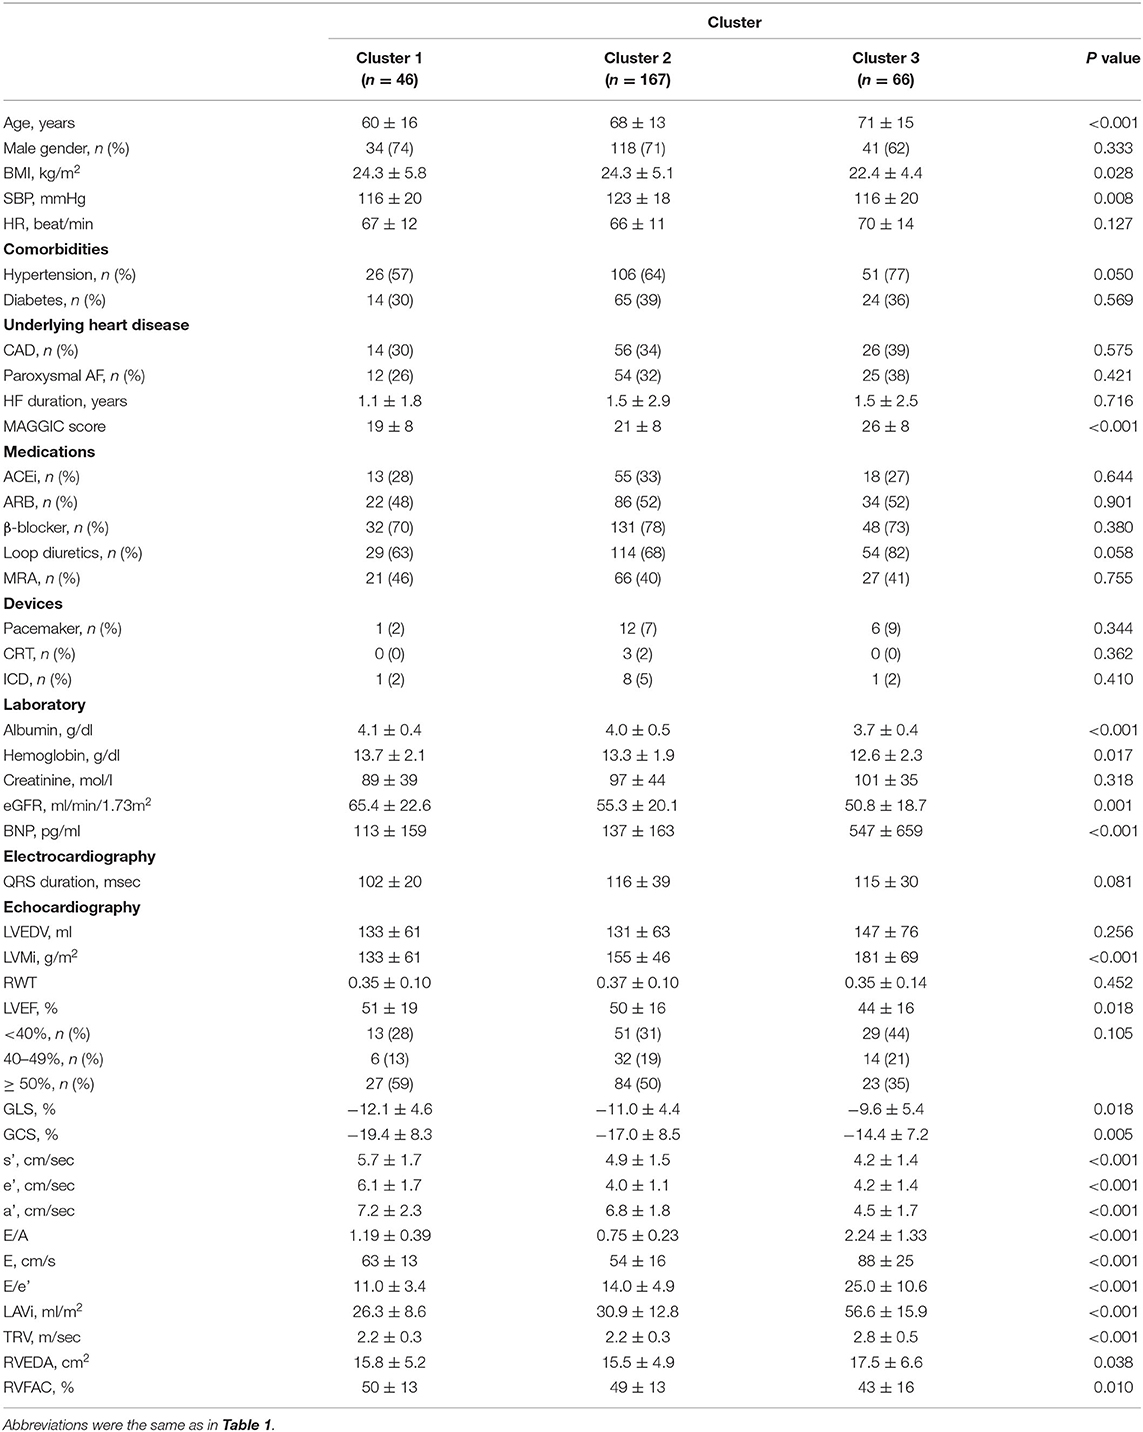
E/e' (p < 0.001), LAVi (p < 0.001) and TRV (p < 0.001) progressively increased from cluster 1 to 3, as assigned (Table 3, Figure 2). Cluster 1 had higher E/A and e' than cluster 2, indicating that cluster 1 represented less abnormal diastolic function. From cluster 1 to 3, patients were older (p < 0.001) and thinner (p = 0.028). HFpEF was dominant in clusters 1 (59%) and 2 (50%), whereas HFrEF was more prevalent in cluster 3 (44%). LV myocardial function measured by LVGLS and LV circumferential strains was abnormal in all the clusters and decreased gradually from cluster 1 to 3 (p = 0.018 and p = 0.005, respectively). Right ventricular function was reduced in cluster 3 (p = 0.010). These trends resulted in increasing MAGGIC scores from cluster 1 to 3 (p < 0.001).
Clinical Relevance
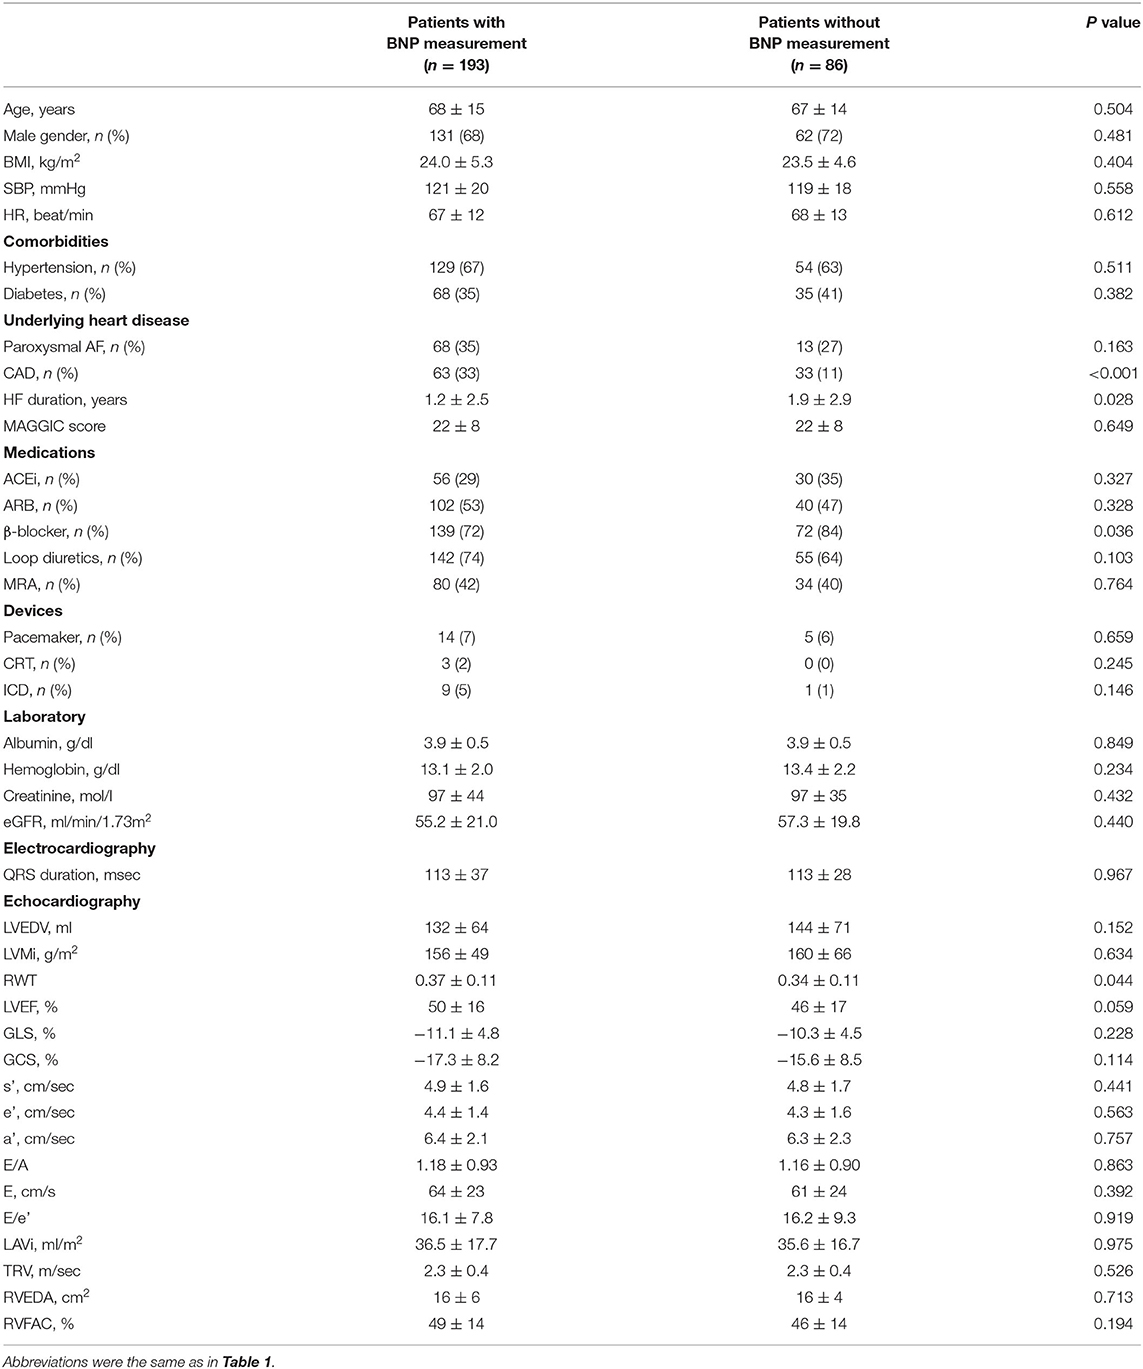
Figure 4A compares BNP level across the clusters and grades; in 193 patients (70%) in whom BNP measurements were available, the median values increased similarly for both classifications (p < 0.001). There were no significant differences in major baseline characteristics between patients with and without BNP measurement (Table 4). Figures 4B,C show progressive anemia (p = 0.017) and worsening renal function (eGFR, p = 0.001) across the clusters but not across the grades.
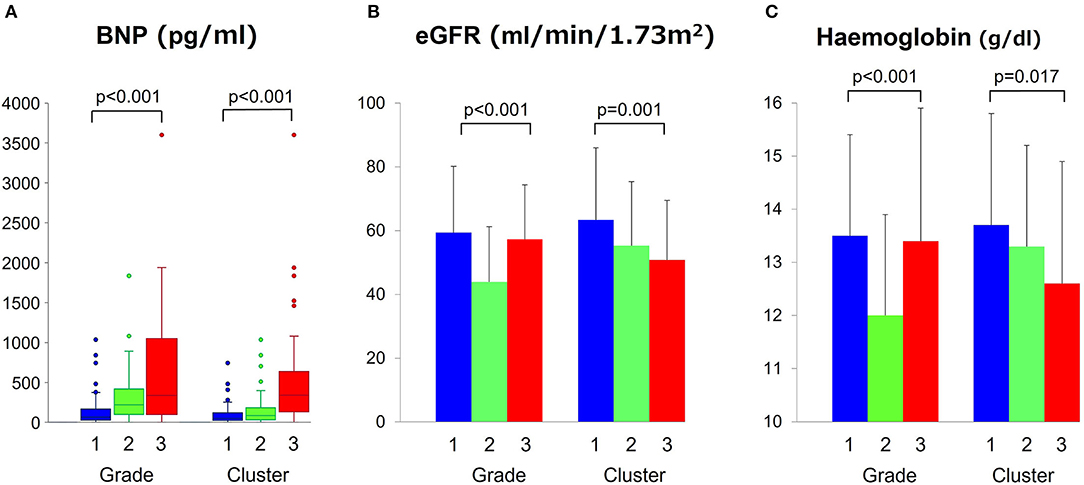
Figure 4. Comparisons of BNP, eGFR and hemoglobin level across grades and clusters. (A) Comparisons of BNP, (B) eGFR, and (C) hemoglobin level across grades and clusters. BNP, brain natriuretic peptide; eGFR, estimate glomerular filtration rate.
During a follow-up period of 2.6 ± 2.0 years, 62 patients (22%) experienced the primary endpoint of worsening HF, and 69 patients (25%) experienced the secondary composite endpoint of worsening HF (62 patients) and/or cardiovascular death (seven patients). Figure 5 compares survival curves stratified by guidelines-based classification with those obtained using cluster-based classification. When stratified by grades, the survival curves showed significant overall separations for both primary and secondary endpoints, but grades 2 and 3 diastolic dysfunction had similar survival curves (Figures 5A,B). Cluster-based classification, however, produced clearer separations of survival curves for both primary and secondary endpoints (Figures 5C,D), as demonstrated by higher χ2 (primary endpoint: χ2 = 20.3, p < 0.001 for clusters, χ2 = 13.1, p = 0.001 for grades; secondary endpoint: χ2 = 25.8, p < 0.001 for clusters, χ2 = 16.9, p < 0.001 for grades). In the sequential Cox proportional hazard analysis, the baseline model including MAGGIC score, LVEDV and LVGLS gave an overall χ2 value of 48.1 for the primary endpoint and 44.5 for the secondary endpoint (Figure 6). The addition of diastolic function grades did not improve the predictive power (χ2 = 50.5, p = 0.211 for primary endpoint; χ2 = 48.4, p = 0.101 for secondary endpoint), whereas the addition of clusters significantly improved the predictive power for both study endpoints (χ2 = 54.6, p = 0.017 for primary endpoint: and χ2 = 54.4, p = 0.003 for secondary endpoint).
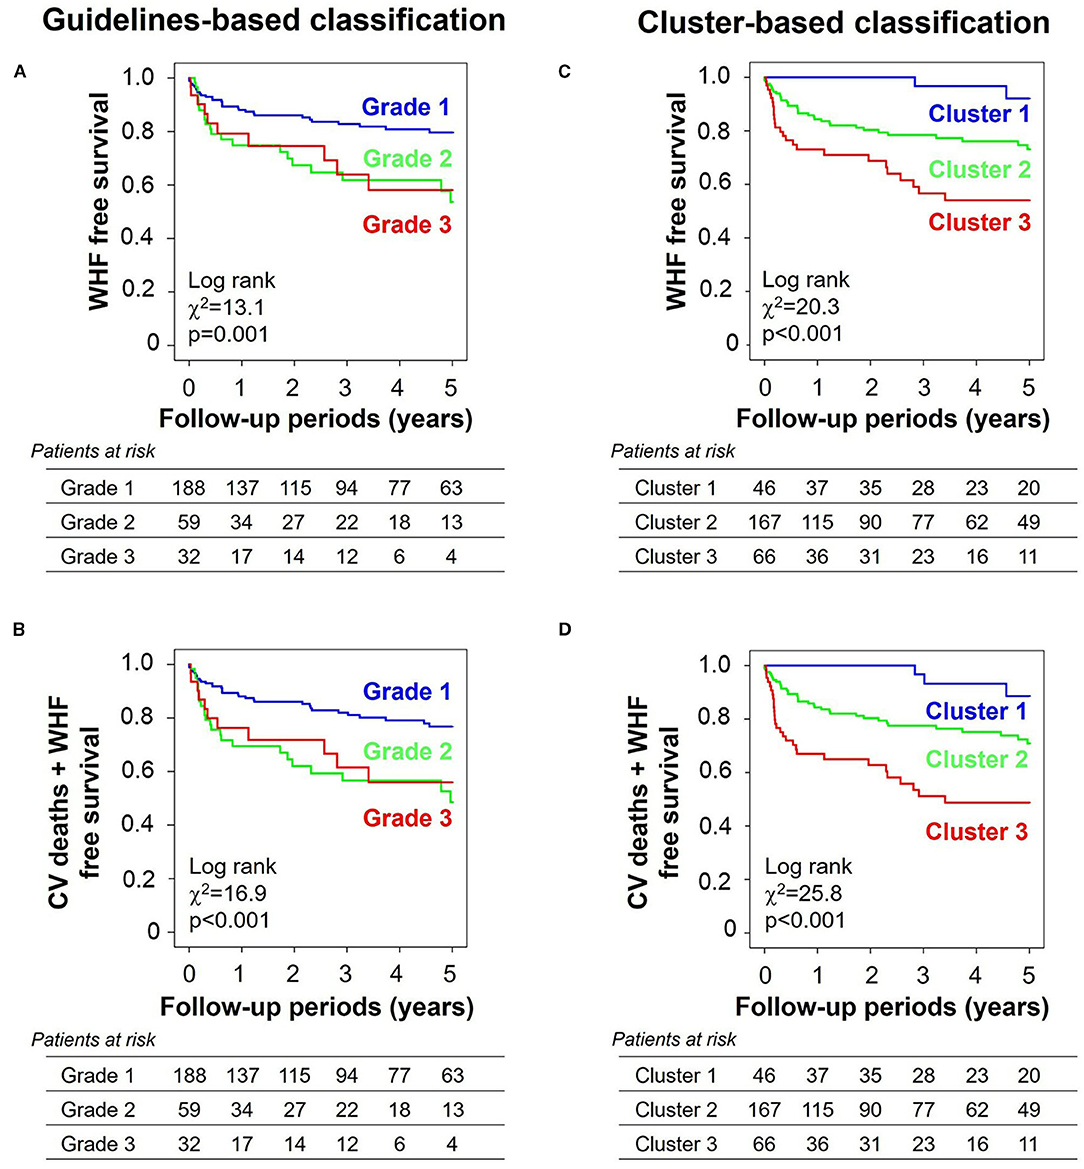
Figure 5. Kaplan–Meier curves stratified by grades and clusters. (A) Primary endpoint (WHF) and (B) secondary endpoint (a composite of CV deaths and WHF) when stratified by guidelines-based classification. (C) Primary endpoint and (D) secondary endpoint when stratified by cluster-based classification. WHF, worsening heart failure; CV, cardiovascular.
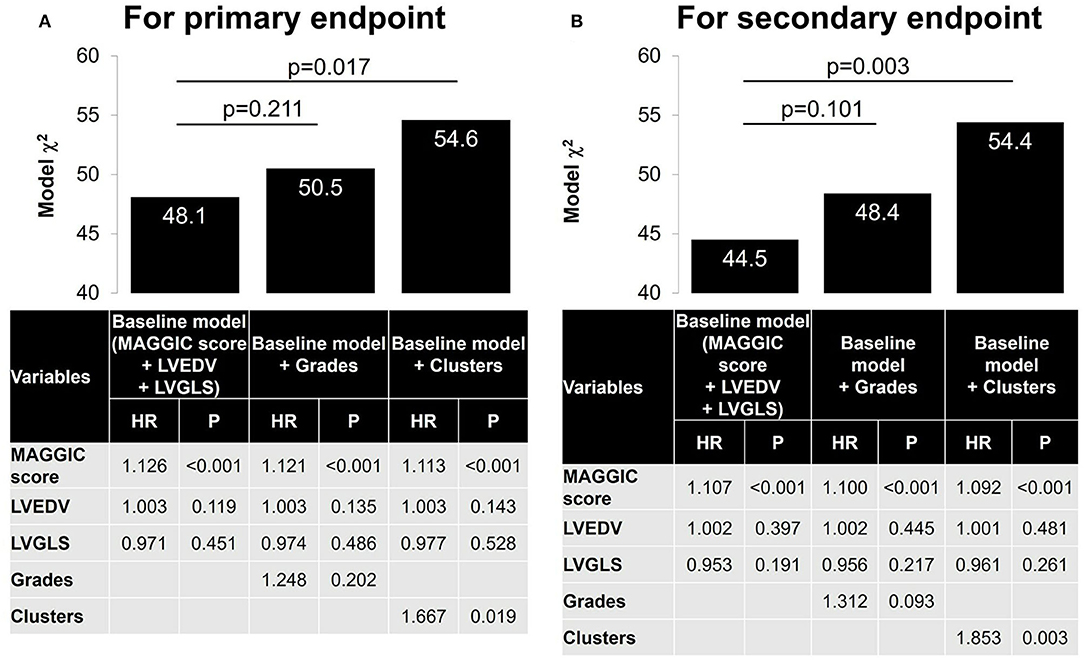
Figure 6. Nested Cox models. A baseline Cox model was first constructed with MAGGIC score, LVEDV and LVGLS. A nested model was then constructed by adding grades and cluster separately. (A) For primary endpoint. (B) For secondary endpoint. MAGGIC, Meta-analysis Global Group in Chronic Heart Failure; LVEDV, left ventricular end-diastolic volume; LVGLS, left ventricular global longitudinal strain.
Concordance Between Cluster-Based and Guidelines-Based Classifications
The patterns of grade and cluster distributions were mapped in Figure 7. The whole study population was distributed in a U-shape; grade 1 to 3 were aligned sequentially from the left to the right side, indicating that there was a spatial gradient of diastolic function in the patient distribution map; cluster 1–3 were aligned similarly, although the boundaries between the clusters shifted leftward. Table 5 shows a contingency table comparing cluster-based classification against guidelines-based classification; moderate ordinal association was observed (Kappa statistic = 0.113, Kendall's correlation coefficient = 0.599, p < 0.001 for both statistics). Patients diagnosed as grade 1 diastolic dysfunction by the guidelines (n = 188) were allocated mostly to cluster 1 (22%) and cluster 2 (76%) but 5 patients (3%) were allocated even to cluster 3.

Figure 7. Comparison of grade and cluster distribution. Grade (A) and cluster (B) distribution in the first 2 dimensions identified by principal component analysis. (C) Mahalanobis distance from each subject to the center of cluster 1 was color-coded.
To assess whether clustering helped stratify risk in grade 1 diastolic dysfunction, BNP levels and clinical outcomes were assessed within this subgroup (Figure 8). BNP levels increased from cluster 1 to cluster 3, but not significantly so perhaps because of the small number of subjects in cluster 3 in this subgroup. Kaplan-Meier curves demonstrated a progressive deterioration in prognosis for both primary and secondary endpoints from cluster 1–3, that was significant by Cox regression analysis (hazard ratio = 5.61, p < 0.001) even after adjusting for MAGGIC score, LVEDV and LVGLS.
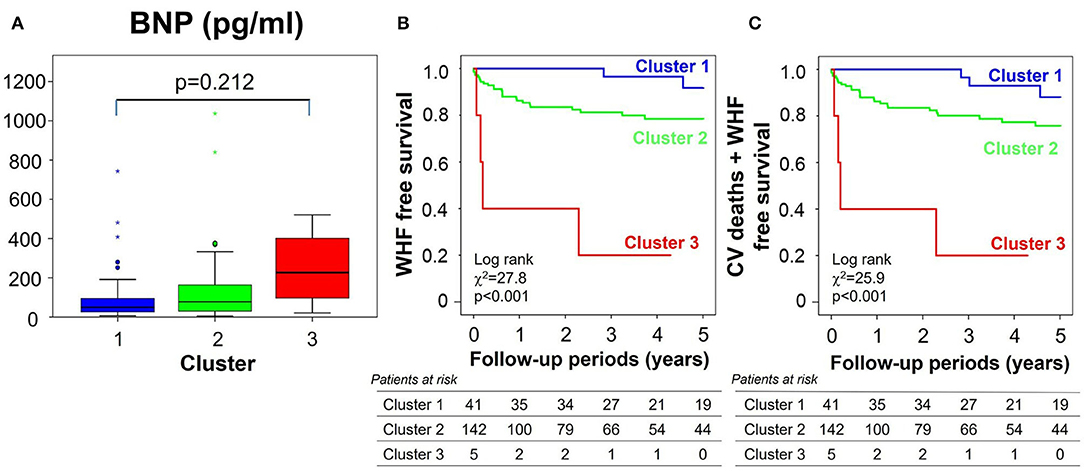
Figure 8. Clinical validations of clusters in the subgroup of all 188 patients with grade 1 diastolic dysfunction by echocardiographic criteria. (A) Comparison of BNP level, (B,C) clinical outcomes [(B) for primary endpoint, (C) for secondary endpoint] stratified by clusters. BNP, brain natriuretic peptide; WHF, worsening heart failure; CV, cardiovascular.
Discussion
We demonstrated that cluster analysis outperforms diastolic function classification by echocardiographic consensus recommendations, for the prediction of hospitalizations or cardiovascular deaths in patients with HF, irrespective of LVEF. The improved performance was the greatest for subjects with grade 1 diastolic dysfunction. These results suggest a more data-driven approach for developing diagnostic recommendations.
Advantage of Using Cluster Analysis for Discriminating Diastolic Function Patterns
Precise assessment of diastolic function is essential for diagnosing and managing HF. To grade diastolic function in clinical practice, the consensus recommendations have proposed complex decision-tree algorithms that evolved through multiple iterations (7). The update published in 2016 narrowed down the diastolic variables and simplified the algorithms for ease of daily clinical application. The iterations resulted in considerable changes in the diagnosis of diastolic function, as shown by retrospective analyses of population-based cohorts; (13, 14) it decreased when diagnosed by the 2016 recommendation (1.4%), compared with the 2009 recommendations (38.1%) (13). Large validation studies indicated that the 2016 update increased specificity for detecting elevated LV filling pressure (from 70–75 to 74–81%) but did not improve overall accuracy (67–75%, compared to 63–74% for the 2009 version) (15–17).
There are some reasons why the current diagnostic algorithms remain suboptimal. The algorithms have been developed by theoretical considerations that diastolic variables uniformly follow typical changes during the progression from normal to severe diastolic dysfunction in all patients (1, 2). However, LV diastolic filling involves several distinct physiological processes, including myocardial relaxation and LV compliance (7). These processes may be differentially affected in different cardiac diseases (18, 19). Because each diastolic variable reflects a different aspect of LV diastolic filling, it would be better if diastolic variables are considered separately and independently.
The current diagnostic algorithms use discrete categorizations defined by cut-off points. These categorizations are easier for us to analyze and interpret than measured continuous variables themselves, but they cause a loss of information on between-subject variability. For example, two subjects between whom a diastolic variable differs greatly but with both values above the cut-off point will be graded similarly, while two subjects with a similar difference in a diastolic variable but with one value lying above and the other below the cut-off point will be categorized in different grades. Echocardiographic measurements of diastolic variables are subject to errors of 5–10% (20). This small degree of variance can result in different grading, if measured variables fall close to cut-off points. Each diastolic variable has been shown to correlate with left atrial pressure (15), so treating them as continuous would be better than dichotomizing them to predict left atrial pressure.
Cluster analysis captures the natural structure of multivariate data without a priori knowledge and it has been applied extensively in medical science, for example to identify clinical phenotypes (8, 21). This approach is suitable for creating new diagnostic criteria for LV diastolic function, because it can overcome the above issues involved in the current diagnostic recommendations. It can categorize diastolic function, independent of the current diagnostic labels, so that the resulting model will not be biased by possible erroneous diagnoses. It can also treat multiple variables independently and continuous variables as continuous.
A previous study has already investigated the natural clustering of diastolic variables and successfully isolated a high-risk phenotype in a convenience sample of subjects predominantly with preserved LVEF (22). Our current study extended this application to a consecutive series of patients with HF comprised equally of HFpEF and HFrEF and confirmed that cluster analysis blindly identified distinct diastolic function phenotypes that exhibited a clear association with BNP level and a more significant prognostic impact than did conventional grading of diastolic function. The learned clusters were found to correlate with LV myocardial strains and with the prevalence of cardiovascular risk factors such as age, hypertension and chronic kidney disease, more than did the diastolic function grades. These correlations may lead to an increased sensitivity for detecting at-risk patients, especially when diastolic function was diagnosed as grade 1 by the consensus recommendations.
Clinical Implications
The learned clusters can be used for assessing new patients. Model-based cluster analysis, which we used in this study, will give the probability of membership for each cluster or distance from each cluster if we enter diastolic variables obtained from new patients into the learned model (Figure 7C); those criteria could then be used to help diagnose HF or quantify treatment effects. A prognostic score developed using cluster analysis can also be more adaptable and give a continuous probability of adverse outcomes in HF. Large-scale datasets of echocardiographic diastolic variables are required to establish a definitive cluster model.
There are several limitations. Firstly, because of the retrospective nature of this study, there were some patients in the HF database in whom all the diastolic variables were not measured. We excluded them from the study population to avoid imputation for cluster modeling. This exclusion may bias the results. Secondly, we did not include stress echocardiographic data in the cluster modeling. Previous studies have demonstrated that diastolic variables obtained using resting echocardiography were not sensitive enough to diagnose elevated left atrial pressure and diastolic stress test would improve the diagnosis (23), so current consensus recommendations advise the use of stress tests to diagnose HF, especially when LVEF is preserved (24). However, a major purpose of this study was to examine whether cluster analysis would improve the diagnosis of diastolic function over current diagnostic criteria, so we included those diastolic variables measured at rest that are listed in the current recommendations. Thirdly, we studied patients with preserved and reduced LVEFs together. The diagnostic accuracy of the current diagnostic criteria has been shown to depend on LVEF (16), so the results might be different if diastolic variables were modeled separately for preserved and reduced LVEFs. Fourthly, septal E/e' instead of average E/e' was used for diastolic grading and clustering, because measuring e' at the septum was our standard protocol at that time. We acknowledge that E/e' is recommended to be measured by averaging septal and lateral e' and lateral e' has been shown to be more sensitive for detecting diastolic dysfunction (25). Fifth, patients with atrial fibrillation, which commonly coexists in HF, were excluded in this study, because their diastolic function cannot be graded by the current diagnostic algorithm. Diastolic variables used for grading in sinus rhythm cannot always be measured nor are useful in atrial fibrillation, for example, E/A and LAVi. Separate clustering would be required to model diastolic function in atrial fibrillation. Sixth, our learned model has not been tested in a different population. External validation is required to assess the generalizability of the model.
Conclusions
Machine learning allows echocardiographic diastolic function phenotyping that associates with HF biomarker and stratifies HF risk better than the current recommendations. The results of this study provide the basis for applying this data-driven approach for precise diagnosis and prognostication in HF, in order to formulate diagnostic recommendations that are based on evidence rather than consensus.
Data Availability Statement
The original contributions presented in the study are included in the article/Supplementary Material, further inquiries can be directed to the corresponding author.
Author Contributions
HK and TU contributed to conception and design of the study, performed statistical analyses, interpreted results, and drafted the manuscript. HK, TU, LT, JC, SS, and YK constructed the database. AF helped revise the manuscript. All authors approved the final version of the manuscript.
Conflict of Interest
TU received a research funding from Hitachi. SS received a lecture fee from Daiichi-Sankyo and a research funding from Daiichi-Sankyo and Mitsubishi-Tanabe. TY has received a research funding from Daiichi-Sankyo, Bayer Healthcare, and Bristol Meyers Squibb and a remuneration from Daiichi-Sankyo, Pfizer, Bayer Healthcare, Bristol-Myers Squibb, Toa Eiyo, and Ono Pharmaceutical.
The remaining authors declare that the research was conducted in the absence of any commercial or financial relationships that could be construed as a potential conflict of interest.
Publisher's Note
All claims expressed in this article are solely those of the authors and do not necessarily represent those of their affiliated organizations, or those of the publisher, the editors and the reviewers. Any product that may be evaluated in this article, or claim that may be made by its manufacturer, is not guaranteed or endorsed by the publisher.
Acknowledgments
We thank all the sonographers at the Cardiovascular Institute for echo data acquisition.
Supplementary Material
The Supplementary Material for this article can be found online at: https://www.frontiersin.org/articles/10.3389/fcvm.2021.755109/full#supplementary-material
References
1. Redfield MM, Jacobsen SJ, Burnett JC Jr, Mahoney DW, Bailey KR, Rodeheffer RJ. Burden of systolic and diastolic ventricular dysfunction in the community: appreciating the scope of the heart failure epidemic. JAMA. (2003) 289:194–202. doi: 10.1001/jama.289.2.194
2. Nagueh SF. Left ventricular diastolic function: understanding pathophysiology, diagnosis, and prognosis with echocardiography. JACC Cardiovasc Imaging. (2020) 13:228–44. doi: 10.1016/j.jcmg.2018.10.038
3. Somaratne JB, Whalley GA, Gamble GD, Doughty RN. Restrictive filling pattern is a powerful predictor of heart failure events postacute myocardial infarction and in established heart failure: a literature-based meta-analysis. J Card Fail. (2007) 13:346–52. doi: 10.1016/j.cardfail.2007.01.010
4. Wang M, Yip GWK, Wang AYM, Zhang Y, Ho PY, Tse MK, et al. Peak early diastolic mitral annulus velocity by tissue Doppler imaging adds independent and incremental prognostic value. J Am Coll Cardiol. (2003) 41:820–6. doi: 10.1016/S0735-1097(02)02921-2
5. Hillis GS, Møller JE, Pellikka PA, Gersh BJ, Wright RS, Ommen SR, et al. Noninvasive estimation of left ventricular filling pressure by E/e' is a powerful predictor of survival after acute myocardial infarction. J Am Coll Cardiol. (2004) 43:360–7. doi: 10.1016/j.jacc.2003.07.044
6. Nagueh SF, Bhatt R, Vivo RP, Krim SR, Sarvari SI, Russell K, et al. Echocardiographic evaluation of hemodynamics in patients with decompensated systolic heart failure. Circ Cardiovasc Imaging. (2011) 4:220–7. doi: 10.1161/CIRCIMAGING.111.963496
7. Nagueh SF, Smiseth OA, Appleton CP, Byrd BF 3rd, Dokainish H, Edvardsen T, et al. Recommendations for the evaluation of left ventricular diastolic function by echocardiography: an update from the American society of echocardiography and the european association of cardiovascular imaging. J Am Soc Echocardiogr. (2016) 29:277–314. doi: 10.1016/j.echo.2016.01.011
8. Ahmad T, Pencina MJ, Schulte PJ, O'Brien E, Whellan DJ, Pina IL, et al. Clinical implications of chronic heart failure phenotypes defined by cluster analysis. J Am Coll Cardiol. (2014) 64:1765–74. doi: 10.1016/j.jacc.2014.07.979
9. Shah SJ, Katz DH, Selvaraj S, Burke MA, Yancy CW, Gheorghiade M, et al. Phenomapping for novel classification of heart failure with preserved ejection fraction. Circulation. (2015) 131:269–79. doi: 10.1161/CIRCULATIONAHA.114.010637
10. Cikes M, Sanchez-Martinez S, Claggett B, Duchateau N, Piella G, Butakoff C, et al. Machine learning-based phenogrouping in heart failure to identify responders to cardiac resynchronization therapy. Eur J Heart Fail. (2019) 21:74–85. doi: 10.1002/ejhf.1333
11. Fraley C, Raftery AE. Model-based clustering, discriminant analysis and density estimation. J Am Stat Assoc. (2002) 97:611–31. doi: 10.1198/016214502760047131
12. Pocock SJ, Ariti CA, McMurray JJ, Maggioni A, Køber L, Squire IB, et al. Predicting survival in heart failure: a risk score based on 39 372 patients from 30 studies. Eur Heart J. (2013) 34:1404–13. doi: 10.1093/eurheartj/ehs337
13. Almeida JG, Fontes-Carvalho R, Sampaio F, Ribeiro J, Bettencourt P, Flachskampf FA, et al. Impact of the 2016 ASE/EACVI recommendations on the prevalence of diastolic dysfunction in the general population. Eur Heart J Cardiovasc Imaging. (2018) 19:380–6. doi: 10.1093/ehjci/jex252
14. Huttin O, Fraser AG, Coiro S, Bozec E, Selton-Suty C, Lamiral Z, et al. Impact of changes in consensus diagnostic recommendations on the echocardiographic prevalence of diastolic dysfunction. J Am Coll Cardiol. (2017) 69:3119–21. doi: 10.1016/j.jacc.2017.04.039
15. Balaney B, Medvedofsky D, Mediratta A, Singh A, Ciszek B, Kruse E, et al. Invasive Validation of the echocardiographic assessment of left ventricular filling pressures using the 2016 diastolic guidelines: head-to-head comparison with the 2009 guidelines. J Am Soc Echocardiogr. (2018) 31:79–88. doi: 10.1016/j.echo.2017.09.002
16. Andersen OS, Smiseth OA, Dokainish H, Abudiab MM, Schutt RC, Kumar A, et al. Estimating left ventricular filling pressure by echocardiography. J Am Coll Cardiol. (2017) 69:1937–48. doi: 10.1016/j.jacc.2017.01.058
17. Lancellotti P, Galderisi M, Edvardsen T, Donal E, Goliasch G, Cardim N, et al. Echo-Doppler estimation of left ventricular filling pressure: results of the multicentre EACVI Euro-Filling study. Eur Heart J Cardiovasc Imaging. (2017) 18:961–8. doi: 10.1093/ehjci/jex067
18. Nishimura RA, Appleton CP, Redfield MM, Ilstrup DM, Holmes DR Jr, Tajik AJ. Noninvasive doppler echocardiographic evaluation of left ventricular filling pressures in patients with cardiomyopathies: a simultaneous Doppler echocardiographic and cardiac catheterization study. J Am Coll Cardiol. (1996) 28:1226–33. doi: 10.1016/S0735-1097(96)00315-4
19. Rakowski H, Carasso S. Quantifying diastolic function in hypertrophic cardiomyopathy: the ongoing search for the holy grail. Circulation. (2007) 116:2662–5. doi: 10.1161/CIRCULATIONAHA.107.742395
20. Spirito P, Maron BJ, Verter I, Merrill JS. Reproducibility of Doppler echocardiographic measurements of left ventricular diastolic function. Eur Heart J. (1988) 9:879–86. doi: 10.1093/oxfordjournals.eurheartj.a062582
21. Sanchez-Martinez S, Duchateau N, Erdei T, Kunszt G, Aakhus S, Degiovanni A, et al. Machine learning analysis of left ventricular function to characterize heart failure with preserved ejection fraction. Circ Cardiovasc Imaging. (2018) 11:e007138. doi: 10.1161/CIRCIMAGING.117.007138
22. Lancaster MC, Salem Omar AM, Narula S, Kulkarni H, Narula J, Sengupta PP. Phenotypic clustering of left ventricular diastolic function parameters: patterns and prognostic relevance. JACC Cardiovasc Imaging. (2019) 12:1149–61. doi: 10.1016/j.jcmg.2018.02.005
23. Obokata M, Kane GC, Reddy YN, Olson TP, Melenovsky V, Borlaug BA. Role of diastolic stress testing in the evaluation for heart failure with preserved ejection fraction: a simultaneous invasive-echocardiographic study. Circulation. (2017) 135:825–38. doi: 10.1161/CIRCULATIONAHA.116.024822
24. Pieske B, Tschöpe C, de Boer RA, Fraser AG, Anker SD, Donal E, et al. How to diagnose heart failure with preserved ejection fraction: the HFA-PEFF diagnostic algorithm: a consensus recommendation from the Heart Failure Association (HFA) of the European Society of Cardiology (ESC). Eur J Heart Fail. (2020) 22:391–412. doi: 10.1002/ejhf.1741
25. Arques S, Roux E, Sbragia P, Ambrosi P, Taieb L, Pieri B, et al. Accuracy of tissue Doppler echocardiography in the emergency diagnosis of decompensated heart failure with preserved left ventricular systolic function: comparison with B-type natriuretic peptide measurement. Echocardiography. (2005) 22:657–64. doi: 10.1111/j.1540-8175.2005.40076.x
Keywords: machine learning, echocardiogram classification, diastolic function, heart failure, prognostication factor
Citation: Kameshima H, Uejima T, Fraser AG, Takahashi L, Cho J, Suzuki S, Kato Y, Yajima J and Yamashita T (2021) A Phenotyping of Diastolic Function by Machine Learning Improves Prediction of Clinical Outcomes in Heart Failure. Front. Cardiovasc. Med. 8:755109. doi: 10.3389/fcvm.2021.755109
Received: 07 August 2021; Accepted: 10 November 2021;
Published: 23 December 2021.
Edited by:
Nay Aung, Queen Mary University of London, United KingdomReviewed by:
Elisa Rauseo, NIHR Barts Cardiovascular Biomedical Research Unit, United KingdomVictor Chien-Chia Wu, Chang Gung Memorial Hospital, Taiwan
Copyright © 2021 Kameshima, Uejima, Fraser, Takahashi, Cho, Suzuki, Kato, Yajima and Yamashita. This is an open-access article distributed under the terms of the Creative Commons Attribution License (CC BY). The use, distribution or reproduction in other forums is permitted, provided the original author(s) and the copyright owner(s) are credited and that the original publication in this journal is cited, in accordance with accepted academic practice. No use, distribution or reproduction is permitted which does not comply with these terms.
*Correspondence: Tokuhisa Uejima, dC51ZWppbWEmI3gwMDA0MDtuaWZ0eS5jb20=
 Haruka Kameshima
 Tokuhisa Uejima1*
 Lisa Takahashi
 Junji Yajima