 Ruilian You
 Lanlan Chen
 Lubin Xu1
 Limeng Chen
94% of researchers rate our articles as excellent or good
Learn more about the work of our research integrity team to safeguard the quality of each article we publish.
Find out more
ORIGINAL RESEARCH article
Front. Cardiovasc. Med., 01 September 2021
Sec. Hypertension
Volume 8 - 2021 | https://doi.org/10.3389/fcvm.2021.736001
This article is part of the Research TopicDiabetes, Hypertension and Cardiovascular Diseases, Volume IIView all 12 articles
Background: The association of uromodulin and hypertension has been observed in clinical studies, but not proven by a causal relationship. We conducted a two-sample Mendelian randomization (MR) analysis to investigate the causal relationship between uromodulin and blood pressure.
Methods: We selected single nucleotide polymorphisms (SNPs) related to urinary uromodulin (uUMOD) and serum uromodulin (sUMOD) from a large Genome-Wide Association Studies (GWAS) meta-analysis study and research in PubMed. Six datasets based on the UK Biobank and the International Consortium for Blood Pressure (ICBP) served as outcomes with a large sample of hypertension (n = 46,188), systolic blood pressure (SBP, n = 1,194,020), and diastolic blood pressure (DBP, n = 1,194,020). The inverse variance weighted (IVW) method was performed in uUMOD MR analysis, while methods of IVW, MR-Egger, Weighted median, and Mendelian Randomization Pleiotropy RESidual Sum and Outlier (MR-PRESSO) were utilized on sUMOD MR analysis.
Results: MR analysis of IVM showed the odds ratio (OR) of the uUMOD to hypertension (“ukb-b-14057” and “ukb-b-14177”) is 1.04 (95% Confidence Interval (CI), 1.03-1.04, P < 0.001); the effect sizes of the uUMOD to SBP are 1.10 (Standard error (SE) = 0.25, P = 8.92E-06) and 0.03 (SE = 0.01, P = 2.70E-04) in “ieu-b-38” and “ukb-b-20175”, respectively. The β coefficient of the uUMOD to DBP is 0.88 (SE = 0.19, P = 4.38E-06) in “ieu-b-39” and 0.05 (SE = 0.01, P = 2.13E-10) in “ukb-b-7992”. As for the sUMOD, the OR of hypertension (“ukb-b-14057” and “ukb-b-14177”) is 1.01 (95% CI 1.01–1.02, all P < 0.001). The β coefficient of the SBP is 0.37 (SE = 0.07, P = 1.26E-07) in “ieu-b-38” and 0.01 (SE = 0.003, P = 1.04E-04) in “ukb-b-20175”. The sUMOD is causally associated with elevated DBP (“ieu-b-39”: β = 0.313, SE = 0.050, P = 3.43E-10; “ukb-b-7992”: β = 0.018, SE = 0.003, P = 8.41E-09).
Conclusion: Our results indicated that high urinary and serum uromodulin levels are potentially detrimental in elevating blood pressure, and serve as a causal risk factor for hypertension.
As a leading cause of cardiovascular disease, hypertension is a complex chronic clinical syndrome with multiple risk factors such as smoking (1), alcohol use (2), obesity (3), and high salt intake (4). Incidence has been rising throughout the last decades (5). At present, we have not discovered all the driving factors of hypertension.
Uromodulin, also named Tamm-Horsfall protein (THP), was first described by Carlo Rovida in 1873. It is produced by the cells in the thick ascending limb (TAL) and the distal convoluted tubule (DCT) with daily secretion of 50–150 mg in urine (6). Uromodulin is physiologically secreted into the renal interstitium, enters the blood to form serum uromodulin (sUMOD), with a level <0.001 of the level of urinary uromodulin (uUMOD) (7). uUMOD plays a crucial role in various biochemical processes, such as protection against urinary tract infection, immunomodulation, and regulating water and salt balance (8). sUMOD was significantly associated with many diseases, such as impaired glucose metabolism, kidney function, and risk for kidney allograft failure (9–11). The association of uUMOD level and salt-sensitive hypertension was observed, but the causal effect of uUMOD on hypertension has not been confirmed (12). Since traditional observational studies might be biased by many underlying confounders such as lifestyles and socioeconomic status (5), the cost of a large randomized controlled trial (RCT), or cohort studies is extremely expensive; as such few studies have focused on exploring the causal relationship between uromodulin and hypertension. Therefore the causal effect of uromodulin on hypertension requires a new strategy in order to be investigated.
“Mendelian randomization” (MR) is an emerging research method that can simulate randomized controlled trials using genetic variants (usually single nucleotide polymorphisms, SNPs) as instrumental variables. Because the gene is allocated randomly at conception (13), MR was designed as a natural randomization method that could minimize the effects of confounders. Nowadays, the MR method has been widely applied to estimate the causal effect of exposure on outcome, and successfully confirmed that lower low-density lipoprotein (LDL) cholesterol contributed to fewer cardiovascular events (14). Recently, many studies have tried to disentangle the risk factors for hypertension by MR methods. Besides some traditional risk factors for hypertension such as body weight index (BMI), adiposity, dietary dairy consumption, smoking, and alcohol intake, it also disclosed some further potential risk factors; namely uric acid, vitamin D levels, gamma-glutamyl transferase, total bilirubin, glycated hemoglobin, beta-2-microglobulin, and apolipoprotein E (15).
In this study, we tried to use two-sample MR methods to unveil the causal effect of uromodulin on hypertension, systolic blood pressure (SBP), and diastolic blood pressure (DBP) using increasingly available public genome-wide association studies (GWAS) datasets.
MR analysis is based on three assumptions: (1) The instrumental variable (IV) is closely associated with the exposure. (2) The IV is not associated with any potential confounders. (3) The IV can only influence the outcome via the exposure, and not by any other ways. We constructed a directed acyclic graph by using genetic instruments (UMOD-related SNPs), exposures (serum uromodulin and urinary uromodulin), and outcomes (hypertension, diastolic blood pressure, and systolic blood pressure, Figure 1).
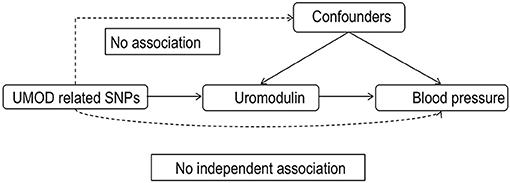
Figure 1. Directed acyclic graph composed of the genetic instrument (UMOD-related SNPs), exposure (UMOD), and outcome (blood pressure). SNPs, Single nucleotide polymorphisms; UMOD, Uromodulin.
We initially extracted all five SNPs associated with uUMOD levels from the largest GWAS meta-analysis of uUMOD (16). This study was a fixed-effects meta-analysis combining results of 10,884 participants of European descent, consisting of three genetic isolates and three urban cohorts. The details of the SNPs are in Supplementary Table 1. We selected IVs with P ≤ 5 × 10⁻⁸, minor allele frequency (MAF) >0.01, and low linkage disequilibrium (LD) (r2 < 0.1). Finally, two SNPs (rs12917707 and rs4494548) were valid for further MR analysis of uUMOD.
sUMOD-related SNPs were obtained from 4,147 participants in the Outcome Reduction with Initial Glargine Intervention (ORIGIN) trial (17), which selected SNPs within 300 kb of the UMOD gene significantly associated with sUMOD, and pruned the SNPs for LD at a threshold of r2 > 0.1 using 1,000 Genomes data (Europeans). Sixteen SNPs were selected as the IVs in the MR analysis of sUMOD, and rs12446494 was excluded for high LD to rs12917707 (r2 = 0.16) (Supplementary Table 2).
We extracted the outcome data (blood pressure) from the MR-base database (18) (https://gwas.mrcieu.ac.uk/), which is a curated database including a summary originated from 1,094 GWASs involving 889 traits of physiological characteristics and disease phenotypes. We searched the traits “hypertension”, “high blood pressure”, “systolic blood pressure”, and “diastolic blood pressure” as keywords, filtered by the European population up to 2020 in the MR-base database. We chose the largest sample size study with available data in the different consortium as outcomes (Figure 2). Two summary datasets with IDs “ukb-b-14057” (non-cancer illness code, self-reported: Hypertension) and “ukb-b-14177” (vascular/heart problems diagnosed by doctor: High blood pressure) were selected as the outcome of hypertension and high blood pressure. They were originated from the MRC Integrative Epidemiology Unit (MRC-IEU) consortium (http://www.bristol.ac.uk/integrative-epidemiology/) based on the UK Biobank, which is a large and detailed genotyped biobank that has globally recruited over 500,000 participants (aged 40–69 years) between 2006 and 2010 (19). The “ukb-b-14057” ID contains 46,293 people while “ukb-b-14177” includes 46,188 participants. We selected two summary datasets “ukb-b-20175” (systolic blood pressure, automated reading) and “ieu-b-38” (systolic blood pressure) as the outcome of SBP. The IDs “ieu-b-39” (diastolic blood pressure) and “ukb-b-7992” (diastolic blood pressure, automated reading) were selected as the datasets of the DBP. The “ieu-b-38” (systolic blood pressure) and “ieu-b-39” IDs (diastolic blood pressure) included summary level data based on the International Consortium for Blood Pressure (ICBP) (20) (www.ncbi.nlm.nih.gov/projects/gap/cgibin/study.cgi?study_id=phs000585.v1.p1), which is a multi-stage GWAS study of systolic and diastolic blood pressure in 200,000 individuals of European descent (21, 22). While “ukb-b-20175” and “ukb-b-7992” included summary data of the UK biobank (Supplementary Tables 3, 4).
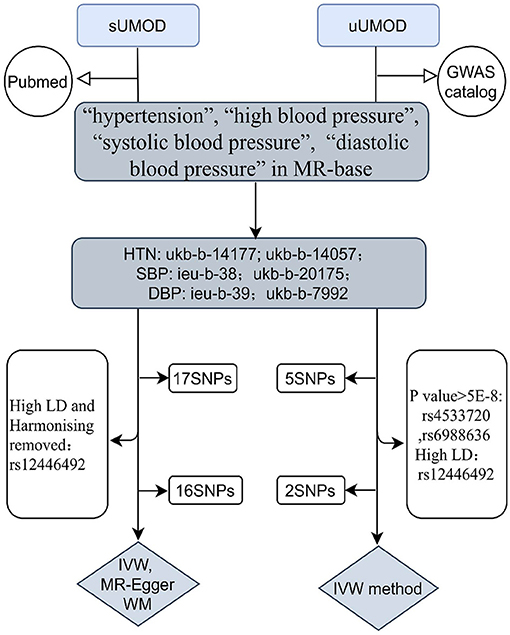
Figure 2. The flow chart of the study design. For instrumental variants (IVs) of the uUMOD, we removed two SNPs (rs4533720 and rs6988636) because of their p-value (>5e-8), and one SNP (rs12446492) due to its high linkage disequilibrium (LD) to rs12917707 (r20 = 0.16). For IVs of the sUMOD, rs12446492 was excluded for the same reason as uUMOD being palindromic with intermediate allele frequencies. uUMOD, Urinary uromodulin; sUMOD, Serum uromodulin; SBP, Systolic blood pressure; DBP, Diastolic blood pressure; HTN, Hypertension; IVW, Inverse variance weighted; WM, Weighted median; MR-Egger, Mendelian randomization-Egger; SNPs, Single Nucleotide Polymorphisms.
In two-sample MR, it is necessary to ensure that the effect allele of IVs in exposure and outcome between different databases correspond to the same allele. Thus, we tried to infer the forward strand alleles using allele frequency information to harmonize the data and discarded ambiguous IVs or not inferable palindromic ones.
For IVs with more than three SNPs, we performed MR analysis through several robust analytical methods based on different assumptions of two-sample MR analysis; namely inverse variance weighted (IVW), MR-Egger, and weighted median (WM). The IVW method utilizes a meta-analysis approach to pool Wald ratios for each SNP (i.e., the β coefficient of the SNP for UMOD is divided by the β coefficient of the SNP for outcomes) to get the combined estimates of the effect of uromodulin on outcomes (hypertension, DBP, SBP) (23). MR-Egger regression makes a weighted linear regression of the outcome coefficients on the exposure coefficients. It can provide unbiased estimates even when all genetic variants are invalid (24). The WM method calculates the median of the empirical distribution of MR association estimates weighted for their precision and offers consistent estimates. For IVs with less than three SNPs, we performed MR analysis by the IVW method.
We performed Cochran's Q statistic to assess heterogeneity between individual genetic variants in the IVW method. A random-effects model was used when the heterogeneity was high (25). We then conducted scatter plots and the leave-one-out method to evaluate the robustness of these findings. To confirm the influential outliers and horizontal pleiotropy, we adopted MR-PRESSO (Mendelian Randomization Pleiotropy RESidual Sum and Outlier) to detect and correct for potential outliers (P < 0.05). We also used MR-PRESSO to test the significant differences in the causal estimates before and after correction for outliers (26) and the intercept of MR-Egger to further test the horizontal pleiotropy (P < 0.05). The analysis was performed by packages “Two Sample MR” and “MR-PRESSO” in R 4.0.2 software.
We used the F statistic to evaluate the strength of the association between SNP and exposure. The formula to calculate the F statistic is F = (27). Where N represents the sample size, k is the number of SNPs. The variance (R2) represents the phenotype variance induced by the SNPs. When R2 is not available, we use the formula R2 = 2 × MAF × (1–MAF) × beta2 (where beta represents the effect value of the genetic variant in the exposure and MAF represents the effect allele frequency) (28). When the F statistic is >10, it reveals a strong correlation between SNP and exposure with sufficient statistical power. Combined F statistics were also conducted to further assess weak instrument bias. We recalculated the power using a web-based application (https://sb452.shinyapps.io/power/) (29).
For the outcome of hypertension, we observed that the elevated urinary uromodulin level could increase the risk of hypertension in dataset “ukb-b-14057” (Oodds ratio (OR) = 1.036, 95% CI, 1.029–1.043, P = 3.07E−26) and “ukb-b-14177” (OR = 1.036, 95% CI, 1.030–1.044, P = 3.29E−26) (Table 1). In the MR analysis of SBP, uUMOD is significantly causally associated with the SBP in “ieu-b-38” (β = 1.100, standard error (SE) = 0.25, P = 8.92E-06) and “ukb-b-20175” (β = 0.03, SE = 0.01, P =2.70E-04). The causal relationship between uUMOD and DBP was significant, as the β coefficient of “ieu-b-39” is 0.88 (SE = 0.19, P = 4.38E−06) and 0.05 for “ukb-b-7992” (SE = 0.01, P = 2.13E−10).
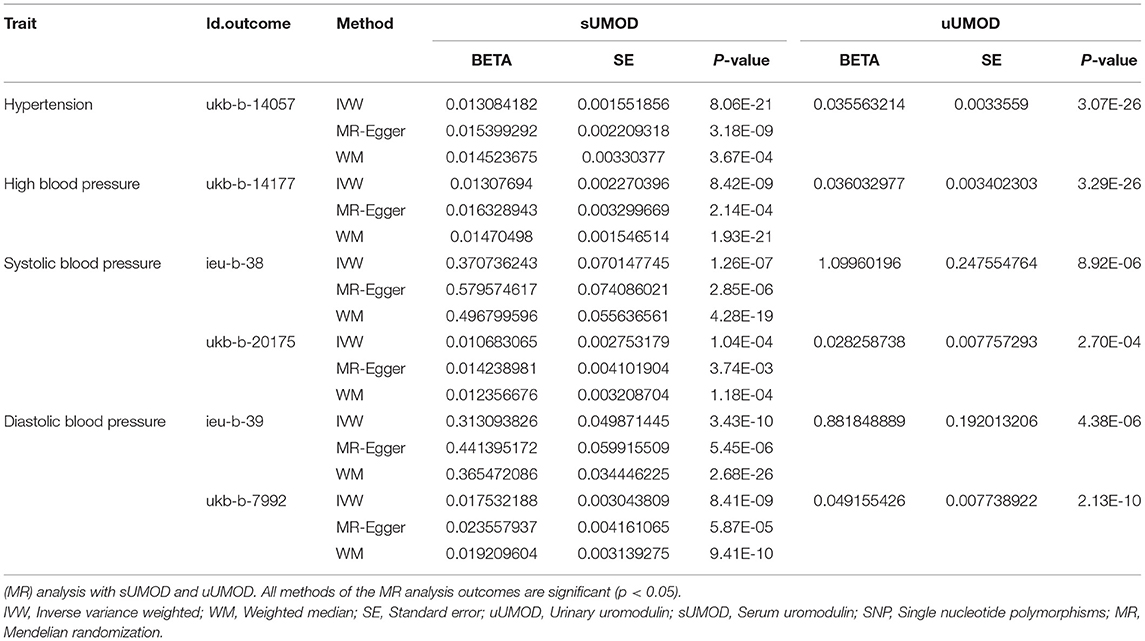
Table 1. The outcomes of two-sample Mendelian randomization.
The effect of sUMOD on hypertension is consistent with uUMOD as the IVW outcome of “ukb-b-14057” and “ukb-b-14177” is the same (OR = 1.013, 95% CI 1.009-1.0018, all P < 0.001). For the outcome of SBP, the β coefficient of IVW in “ieu-b-38” is 0.371 (SE = 0.070, P = 1.26E−07) and 0.011 in “ukb-b-20175” (SE = 0.003, P = 1.04E−04). In the MR analysis, the IVW outcome of the DBP in “ieu-b-39” and “ukb-b-7992” are both significant (β = 0.313 with SE = 0.050 and β = 0.018 with SE = 0.003, respectively, all P < 0.001). All outcomes of three-method MR analysis are shown in Table 1 and Figures 3, 4.
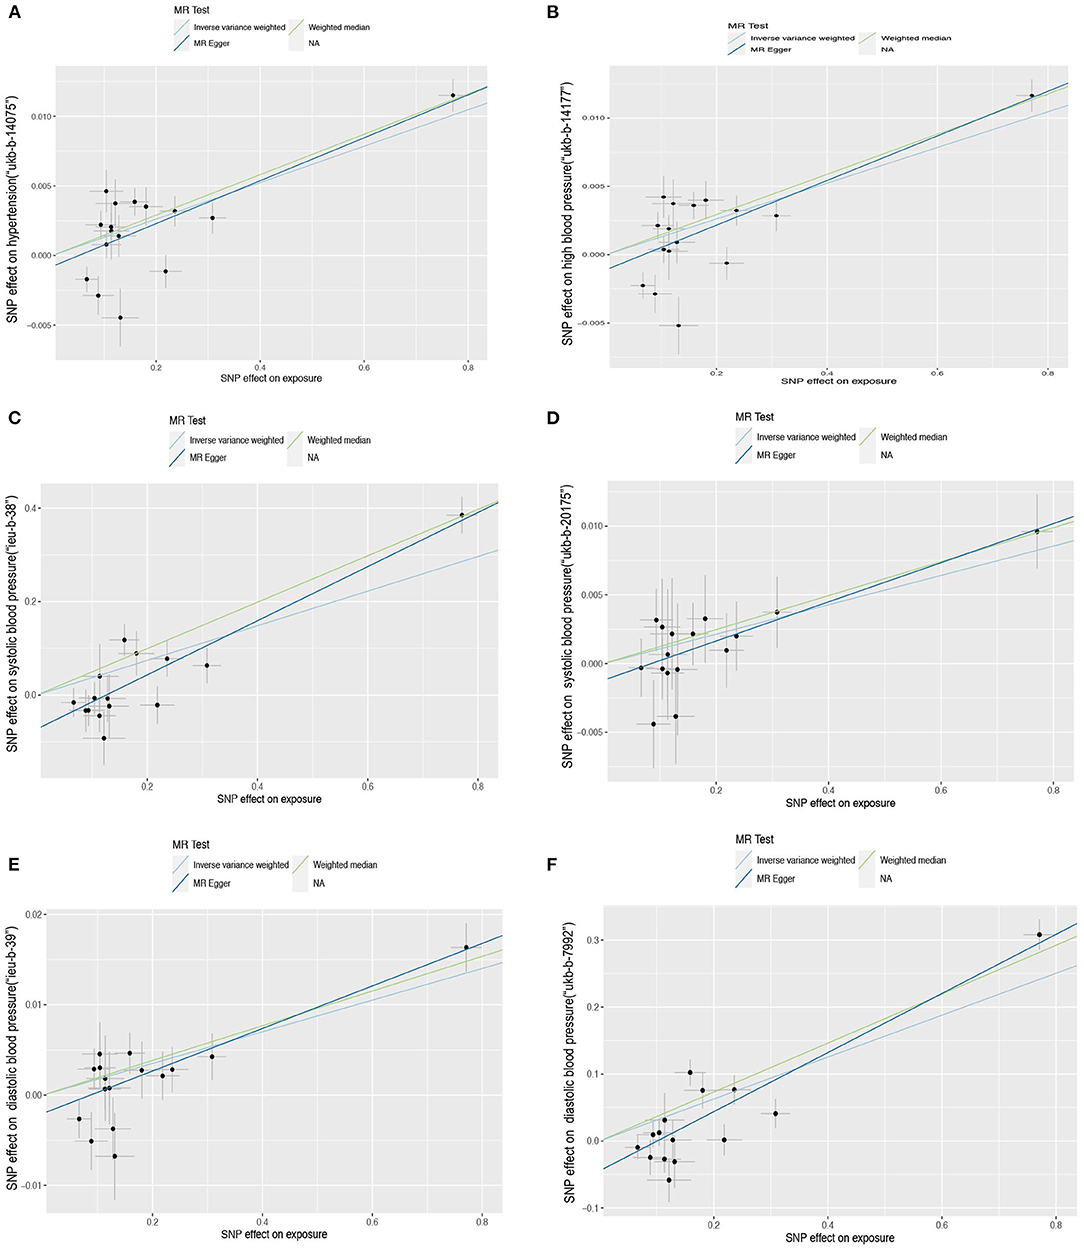
Figure 3. Scatter plot of the Mendelian randomization (MR) outcome. Relationship between the effect size estimates on sUMOD (x-axis) and the effect size estimates on outcomes (y-axis): Hypertension (A,B), systolic blood pressure (C,D), diastolic blood pressure (E,F). The slope of fitted lines represents the estimated causal effect of sUMOD obtained using the inverse variance weighted (IVW), MR-Egger, and weighted median (WM). Hypertension: (A) (ukb-b-14177), (B) (ukb-b-14-57); systolic blood pressure: (C) (ieu-b-38), (D) (ukb-b-20175); diastolic blood pressure: (E) (ieu-b-39), (F) (ukb-b-7992).
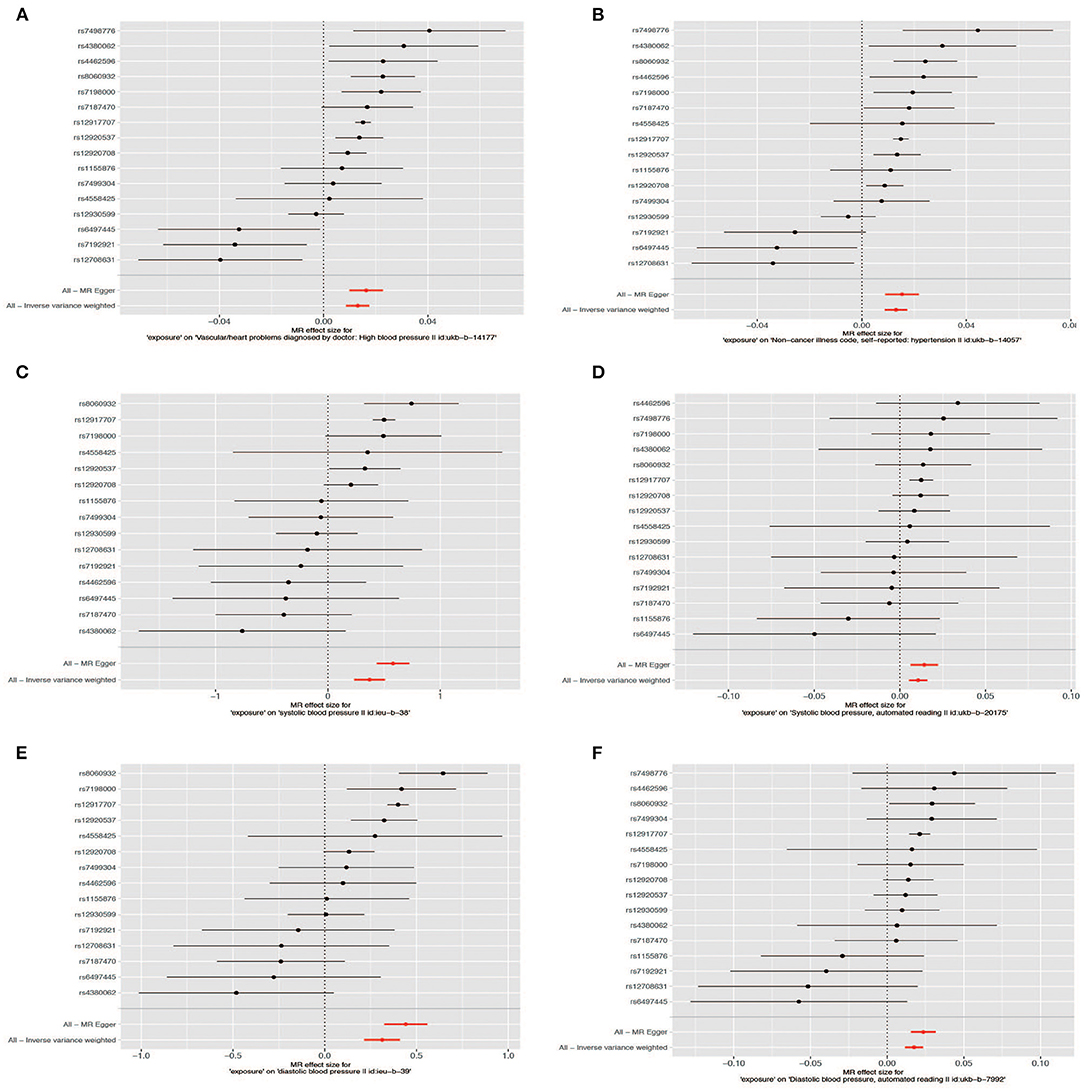
Figure 4. Forest plot of the Mendelian randomization (MR) outcome. Hypertension: (A) (ukb-b-14177), (B) (ukb-b-14-57); systolic blood pressure: (C) (ieu-b-38), (D) (ukb-b-20175); diastolic blood pressure: (E) (ieu-b-39), (F) (ukb-b-7992).
The Scatter plot shows the distribution of the single SNP's effect on the outcome (Figure 3). High heterogeneity was found in hypertension (“ukb-b-14177”), high blood pressure (“ukb-b-14057”), SBP (“ieu-b-38”), and DBP (“ieu-b-39”); while SBP (“ukb-b-20175”) and DBP (“ukb-b-7992”) possess low heterogeneity. The leave-one-out method suggested the outcome is robust except for SBP (“ukb-b-20175” and “ieu-b-38”) (Supplementary Figure 1). The p-value of the MR-Egger intercept is more than 0.05 in hypertension, high blood pressure, and SBP (the dataset “ukb-20175”), indicating no evidence of genetic pleiotropy, while <0.05 in DBP and part of SBP (the dataset “ieu-b-38”). Further horizontal pleiotropy testing with MR-PRESSO showed there are no outliers in DBP (“ukb-b-7992”) and SBP (“ukb-20175”). In the outcome of hypertension (“ukb-b-14177”) and high blood pressure (“ukb-b-14057”), though outliers existed, the corrected outcomes are consistent with the global rate. Rs12917707 and rs12930599 are outliers in the DBP (“ieu-b-39”) with the corrected outcome (β = 0.190, P = 2.37E−02). The MR-PRESSO outcome in SBP (”ieu-b-38“) is not significant when rs12917707 was excluded as an outlier (Table 2).
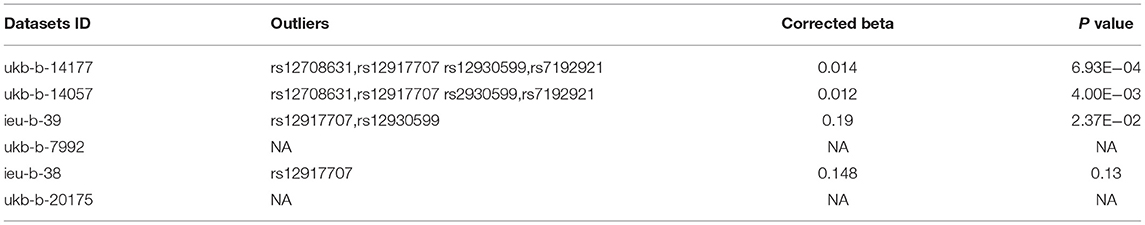
Table 2. Outcomes of Mendelian Randomization Pleiotropy RESidual Sum and Outlier (MR-PRESSO).
In the uUMOD MR analysis, the F statistics of rs12917707 and rs4494548 are 169.58 and 35.80, respectively. The mean F statistic of the sUMOD-related SNPs is 78.28. The high F statistic (empirically > 10) indicated a strong association between SNPs and urinary uromodulin and less weak instrument bias. The power of our MR analysis in different pairs was over 90% at an alpha rate of 5%, except the dataset “ukb-b-20175” (systolic blood pressure) which was 75.2% (Supplementary Table 5).
Our MR analysis unveiled the causal effect of both uUMOD and sUMOD on blood pressure by integrating publicly available GWAS datasets. High sUMOD and uUMOD could contribute to the risk of hypertension (the biggest OR is 1.036, 95% CI, 1.030–1.044). Both sUMOD and uUMOD are causally associated with both SBP (the largest causal estimate being a 0.10 mmHg per unit change in uromodulin) and DBP (the largest causal estimate being a 0.88 mmHg per unit change in uromodulin).
To our limited knowledge, this is the first study designed to research the causal association of both serum and urinary uromodulin and hypertension by MR methods with potential confounders removed by genetic variants. One abstract using MR analysis to reveal the causal association of uUMOD of DBP and SBP only included the “ieu-b-39” and “ieu-b-38” datasets (30). We screened all the summary studies of DBP and SBP on the MR-base up to 2020 and added two datasets. Besides, we further assessed the causal effect of uromodulin on hypertension, utilizing the open data showing the association between SNPs and sUMOD.
We adopted three methods based on different assumptions to ensure our outcome. MR-Egger relies on the assumption that the SNP should affect the risk of the outcome through the exposure, not via other risk factors; namely Instrument Strength Independent of Direct Effect (InSIDE). The WM method does not require InSIDE to be taken into account. This method provides valid estimates when at least 50% of the weight comes from valid variants. It can improve the power of causal effect detection and decrease type I error with distinct superiorities over MR-Egger (31). MR-PRESSO enhances the detection of outliers by rigorously exploring whether the findings were biased due to pleiotropy. Although we cannot entirely rule out pleiotropy, we observed a consistent outcome between uromodulin levels and blood pressure in conventional MR analysis. Our results based on different methods and datasets strengthen the theoretical support for further well-designed prospective randomized clinical trials to verify the causal association of uromodulin and hypertension, larger than those that came before them. Furthermore, our results may further suggest that uromodulin might serve as a new therapeutic target for hypertension management.
The correlation between uromodulin and hypertension was first disclosed in 1998. Duława, J. reported that compared with healthy control, uUMOD excretion was significantly higher in hypertensive individuals (32); and could be normalized by angiotensin converting enzyme inhibitors (ACEI) (33). It is consistent in pre-eclampsia patients (34). RNA-seq data of wild-type (WT) mice treated by a high salt diet showed a significant upregulation of heat-shock proteins Hspa1b (Hsp70) and blood pressure that were both abolished in UMOD knockout mice (35–37). It indicated the potential causal relationship between UMOD and hypertension, but was difficult to confirm in a population study. Our study has shown that UMOD was a causal factor of hypertension by utilizing the Mendelian randomization method.
The underlying mechanism of uromodulin influencing blood pressure is due to its regulation of the ion channel's activity in TAL and DCT, including the renal outer medullary potassium channel (ROMK), epithelial sodium channel (ENaC), Na+-K+-2Cl- cotransporter (NKCC2), and Na+-Cl– cotransporter (NCC). Animal studies proved that UMOD could upregulate the ROMK and ENaC expression in TAL (38) and lead to salt-sensitive hypertension. UMOD knockout mice presented significantly lower systolic blood pressure compared to WT mice under basal conditions (39, 40). UMOD transgenic mice with increased expression and secretion of uromodulin showed higher BP and a significant increase of NKCC2 phosphorylation at activating sites (Thr96 and Thr101). In an in vitro study, co-expression of uromodulin in renal cells induced an obvious increase of NKCC2 phosphorylation and its activity (12). Uromodulin also facilitated NCC phosphorylation which was possible via SPS1-related proline/alanine-rich kinase/oxidative stress response kinase 1 (SPAK-OSR1) modulation (41). The upregulation activity of both NKCC2 and NCC contribute to NaCl reabsorption and retention, leading to salt-sensitive hypertension (42, 43).
Our study had some limitations. First, since all the data came from people of European origin, the results were not representative of a truly random population sample nor applicable to other ethnicities. In the uUMOD MR, we only included two SNPs, which meant we could not conduct MR-Egger, a median-based estimator, model-based estimators, and other analysis methods to examine the horizontal pleiotropy. Second, there was a likely overlap of uUMOD (population from the Framingham Heart Study: 24%) and ICBP (0.3%). However, the overlapping degree is small in ICBP and we included the UK Biobank to confirm the outcome. We assessed the effect of the overlap in the online app (https://sb452.shinyapps.io/overlap/), it showed that when the overlap is below 30%, the bias is <0.018 (44). Third, due to the presence of strong instruments, we consider this overlap not to introduce significant bias (45). Fourth, we could not perform the bidirectional Mendelian randomization owing to a lack of effect size data on hypertension-related SNPs in the exposure population. Fifth, due to the lack of individual data, all MR methods tested only the linear effect of uromodulin on blood pressure, and could not exclude a modest or non-linear effect. Finally, as this was an MR analysis, we also could not overcome general limitations such as the possibility of population stratification, the pleiotropy of SNPs, and canalization (15).
In conclusion, our study based on open datasets suggests a potentially detrimental impact of high levels of uromodulin on the development of hypertension; which is the first time this has been shown to be consistent with the observational study and basic experimental study.
The datasets presented in this study can be found in online repositories. The names of the repository/repositories and accession number(s) can be found in the article/Supplementary Material.
RY conceived and designed the study, performed the study, analyzed the data, wrote the paper, and prepared figures and/or tables. LC performed the MR analysis, analyzed the data, and reviewed drafts of the paper. LX and DZ analyzed the data, prepared figures and tables, and reviewed drafts of the paper. HL performed the study, analyzed the data, and prepared figures and tables. XS designed the study and reviewed drafts of the paper. YZ analyzed the data and reviewed drafts of the paper. LC conceived and designed the study, wrote the paper, and reviewed drafts of the paper. All authors contributed to the article and approved the submitted version.
This work was partially supported by grants from the National Natural Scientific Foundation of China (81970607, 81470937 to LC, 81860136 to YZ); the Key Research and Development Program of Ningxia Hui Autonomous Region (2018BFG02010 to LC); Capital's Funds for Health Improvement and Research (CFH 2020-2-4018 to LC); Beijing Natural Science Foundation (L202035 to LC); CAMS Innovation Fund for Medical Sciences (CIFMS 2020-I2M-C&T-A-001 to LC); Chinese Academy of Medical Sciences Innovation Fund for Medical Sciences (CIFMS 2016-I2M-2-004 to LC); and National Key-point Research Program Precision Medicine Grant (2016YFC0901500 to LC). The funders had no role in study design, data collection, and analysis, decision to publish, or preparation of the manuscript.
The authors declare that the research was conducted in the absence of any commercial or financial relationships that could be construed as a potential conflict of interest.
All claims expressed in this article are solely those of the authors and do not necessarily represent those of their affiliated organizations, or those of the publisher, the editors and the reviewers. Any product that may be evaluated in this article, or claim that may be made by its manufacturer, is not guaranteed or endorsed by the publisher.
We thank the GWAS Catalog and Doc. Matthias Olden et al. for making their data of uUMOD-related SNPs open. We also thank Doctor Jennifer Sjaarda's group for disclosing their study data, especially the effect sizes and standard error of the SNPs of serum uromodulin. Additionally, we are grateful to the MR-base, UK Biobank, ICBP, and MRC-IEU for making the GWAS summary data publicly available, and grateful to all the researchers and participants who contributed to those studies.
The Supplementary Material for this article can be found online at: https://www.frontiersin.org/articles/10.3389/fcvm.2021.736001/full#supplementary-material
1. Talukder MA, Johnson WM, Varadharaj S, Lian J, Kearns PN, El-Mahdy MA, et al. Chronic cigarette smoking causes hypertension, increased oxidative stress, impaired NO bioavailability, endothelial dysfunction, and cardiac remodeling in mice. Am J Physiol Heart Circ Physiol 300(1). (2011) H388–396. doi: 10.1152/ajpheart.00868.2010
2. Klatsky AL. Alcohol-associated hypertension: when one drinks makes a difference. Hypertension 44(6). (2004) 805–6. doi: 10.1161/01.Hyp.0000146538.26193.60
3. AlWabel AH, Almufadhi MA, Alayed FM, Aloraini AY, Alobaysi HM, Alalwi RM. Assessment of hypertension and its associated risk factors among medical students in Qassim University. Saudi J Kidney Dis Transpl 29(5). (2018) 1100–8. doi: 10.4103/1319-2442.243959
4. He FJ, Li J, Macgregor GA. Effect of longer term modest salt reduction on blood pressure: Cochrane systematic review and meta-analysis of randomised trials. Bmj. (2013) 346:f1325. doi: 10.1136/bmj.f1325
5. Samadian F, Dalili N, Jamalian A. Lifestyle Modifications to Prevent and Control Hypertension. Iran J Kidney Dis 10(5). (2016) 237–63.
6. Goodall AA, Marshall RD. Effects of freezing on the estimated amounts of Tamm–Horsfall glycoprotein in urine, as determined by radioimmunoassay. Biochem J 189(3). (1980) 533–9. doi: 10.1042/bj1890533
7. Scherberich JE, Gruber R, Nockher WA, Christensen EI, Schmitt H, Herbst V, et al. Serum uromodulin-a marker of kidney function and renal parenchymal integrity. Nephrol Dial Transplant 33(2). (2018) 284–95. doi: 10.1093/ndt/gfw422
8. Devuyst O, Pattaro C. The UMOD locus: insights into the pathogenesis and prognosis of kidney disease. J Am Soc Nephrol 29(3). (2018) 713–26. doi: 10.1681/asn.2017070716
9. Leiherer A, Muendlein A, Saely CH, Kinz E, Brandtner EM, Fraunberger P, et al. Serum uromodulin is associated with impaired glucose metabolism. Medicine (Baltimore) 96(5). (2017) e5798. doi: 10.1097/md.0000000000005798
10. Bostom A, Steubl D, Garimella PS, Franceschini N, Roberts MB, Pasch A, et al. Serum uromodulin: a biomarker of long-term kidney allograft failure. Am J Nephrol 47(4). (2018) 275–82. doi: 10.1159/000489095
11. Usui R, Ogawa T, Takahashi H, Iwasaki C, Koike M, Morito T, et al. Serum uromodulin is a novel renal function marker in the Japanese population. Clin Exp Nephrol 25(1). (2021) 28–36. doi: 10.1007/s10157-020-01964-y
12. Trudu M, Janas S, Lanzani C, Debaix H, Schaeffer C, Ikehata M, et al. Common noncoding UMOD gene variants induce salt-sensitive hypertension and kidney damage by increasing uromodulin expression. Nat Med 19(12). (2013) 1655–60. doi: 10.1038/nm.3384
13. Emdin CA, Khera AV, Kathiresan S. Mendelian randomization. Jama. (2017) 318:1925–6. doi: 10.1001/jama.2017.17219
14. Preiss D, Tobert JA, Hovingh GK, Reith C. Lipid-modifying agents, from statins to PCSK9 inhibitors: JACC focus seminar. J Am Coll Cardiol. (2020) 75:1945–55. doi: 10.1016/j.jacc.2019.11.072
15. Grau-Perez M, Redon J. Unraveling new factors associated with hypertension: the Mendelian randomization approach. J Hypertens. (2020) 38:30–2. doi: 10.1097/hjh.0000000000002251
16. Olden M, Corre T, Hayward C, Toniolo D, Ulivi S, Gasparini P, et al. Common variants in UMOD associate with urinary uromodulin levels: a meta-analysis. J Am Soc Nephrol. (2014) 25:1869–82. doi: 10.1681/asn.2013070781
17. Sjaarda J, Gerstein HC, Yusuf S, Treleaven D, Walsh M, Mann JFE, et al. Blood HER2 and Uromodulin as Causal Mediators of CKD. J Am Soc Nephrol. (2018) 29:1326–35. doi: 10.1681/ASN.2017070812
18. Hemani G, Zheng J, Elsworth B, Wade KH, Haberland V, Baird D, et al. The MR-Base platform supports systematic causal inference across the human phenome. Elife. (2018) 7:e34408. doi: 10.7554/eLife.34408
19. Sudlow C, Gallacher J, Allen N, Beral V, Burton P, Danesh J, et al. UK biobank: an open access resource for identifying the causes of a wide range of complex diseases of middle and old age. PLoS Med. (2015) 12:e1001779. doi: 10.1371/journal.pmed.1001779
20. Ehret GB, Munroe PB, Rice KM, Bochud M, Johnson AD, Chasman DI, et al. Genetic variants in novel pathways influence blood pressure and cardiovascular disease risk. Nature. (2011) 478:103–9. doi: 10.1038/nature10405
21. International Consortium for Blood Pressure Genome-Wide Association, Ehret S, Munroe GB, Rice PB, Bochud KM, Johnson MAD, et al. Genetic variants in novel pathways influence blood pressure and cardiovascular disease risk. Nature. (2011) 478:103–9.
22. Evangelou E, Warren HR, Mosen-Ansorena D, Mifsud B, Pazoki R, Gao H, et al. Genetic analysis of over 1 million people identifies 535 new loci associated with blood pressure traits. Nat Genet. (2018) 50:1412–25. doi: 10.1038/s41588-018-0205-x
23. Wu F, Huang Y, Hu J, Shao Z. Mendelian randomization study of inflammatory bowel disease and bone mineral density. BMC Med. (2020) 18:312. doi: 10.1186/s12916-020-01778-5
24. Bowden J, Davey Smith G, Burgess S. Mendelian randomization with invalid instruments: effect estimation and bias detection through Egger regression. Int J Epidemiol. (2015) 44:512–25. doi: 10.1093/ije/dyv080
25. Bowden J, Spiller W, Del Greco MF, Sheehan N, Thompson J, Minelli C, et al. Improving the visualization, interpretation and analysis of two-sample summary data Mendelian randomization via the Radial plot and Radial regression. Int J Epidemiol. (2018) 47:1264–78. doi: 10.1093/ije/dyy101
26. Verbanck M, Chen CY, Neale B, Do R. Detection of widespread horizontal pleiotropy in causal relationships inferred from Mendelian randomization between complex traits and diseases. Nat Genet. (2018) 50:693–8. doi: 10.1038/s41588-018-0099-7
27. Levin MG, Judy R, Gill D, Vujkovic M, Verma SS, Bradford Y, et al. Genetics of height and risk of atrial fibrillation: A Mendelian randomization study. PLoS Med. (2020) 17:e1003288. doi: 10.1371/journal.pmed.1003288
28. Palmer TM, Lawlor DA, Harbord RM, Sheehan NA, Tobias JH, Timpson NJ, et al. Using multiple genetic variants as instrumental variables for modifiable risk factors. Stat Methods Med Res. (2012) 21:223–42. doi: 10.1177/0962280210394459
29. Burgess S. Sample size and power calculations in Mendelian randomization with a single instrumental variable and a binary outcome. Int J Epidemiol. (2014) 43:922–9. doi: 10.1093/ije/dyu005
30. Tan LE, Aman A, McCallum L, Dominiczak AF, Padmanabhan S. Causal association of uromodulin with blood pressure independent of renal function. J Hypertens. (2018) 36:e345–6.
31. Bowden J, Davey Smith G, Haycock PC, Burgess S. Consistent estimation in Mendelian randomization with some invalid instruments using a weighted median estimator. Genet Epidemiol. (2016) 40:304–14. doi: 10.1002/gepi.21965
32. Duława J, Kokot F, Kokot M, Pander H. Urinary excretion of Tamm-Horsfall protein in normotensive and hypertensive elderly patients. J Hum Hypertens. (1998) 12:635–7. doi: 10.1038/sj.jhh.1000680
33. Guidi E, Giglioni A, Cozzi MG, Minetti EE. Which urinary proteins are decreased after angiotensin converting–enzyme inhibition? Ren Fail. (1998) 20:243–8. doi: 10.3109/08860229809045108
34. Carty DM, Siwy J, Brennand JE, Zürbig P, Mullen W, Franke J, et al. Urinary proteomics for prediction of preeclampsia. Hypertension 57(3). (2011) 561–9. doi: 10.1161/hypertensionaha.110.164285
35. Wolf MTF, Zhang J, Nie M. Uromodulin in mineral metabolism. Curr Opin Nephrol Hypertens 28(5). (2019) 481–9. doi: 10.1097/mnh.0000000000000522
36. Graham LA, Aman A, Campbell DD, Augley J, Graham D, McBride MW, et al. Salt stress in the renal tubules is linked to TAL-specific expression of uromodulin and an upregulation of heat shock genes. Physiol Genomics 50(11). (2018) 964–72. doi: 10.1152/physiolgenomics.00057.2018
37. Pockley AG, De Faire U, Kiessling R, Lemne C, Thulin T, Frostegård J. Circulating heat shock protein and heat shock protein antibody levels in established hypertension. J Hypertens 20(9). (2002) 1815–20. doi: 10.1097/00004872-200209000-00027
38. Bachmann S, Mutig K, Bates J, Welker P, Geist B, Gross V, et al. Renal effects of Tamm-Horsfall protein (uromodulin) deficiency in mice. Am J Physiol Renal Physiol 288(3). (2005) F559–567. doi: 10.1152/ajprenal.00143.2004
39. Arhatte M, Gunaratne GS, El Boustany C, Kuo IY, Moro C, Duprat F, et al. TMEM33 regulates intracellular calcium homeostasis in renal tubular epithelial cells. Nat Commun. (2019) 10:2024. doi: 10.1038/s41467-019-10045-y
40. Pitzer AL, Van Beusecum JP, Kleyman TR, Kirabo A. ENaC in Salt-sensitive hypertension: kidney and beyond. Curr Hypertens Rep. (2020) 22:69. doi: 10.1007/s11906-020-01067-9
41. Tokonami N, Takata T, Beyeler J, Ehrbar I, Yoshifuji A, Christensen EI, et al. Uromodulin is expressed in the distal convoluted tubule, where it is critical for regulation of the sodium chloride cotransporter NCC. Kidney Int. (2018) 94:701–15. doi: 10.1016/j.kint.2018.04.021 Epub 2018 Jul 12. 2018/07/17.
42. Caceres PS, Ortiz PA. Molecular regulation of NKCC2 in blood pressure control and hypertension. Curr Opin Nephrol Hypertens. (2019) 28:474–80. doi: 10.1097/mnh.0000000000000531
43. Thomson MN, Cuevas CA, Bewarder TM, Dittmayer C, Miller LN, Si J, et al. WNK bodies cluster WNK4 and SPAK/OSR1 to promote NCC activation in hypokalemia. Am J Physiol Renal Physiol. (2020) 318:F216–f228. doi: 10.1152/ajprenal.00232.2019
44. Burgess S, Davies NM, Thompson SG. Bias due to participant overlap in two-sample Mendelian randomization. Genet Epidemiol. (2016) 40:597–608. doi: 10.1002/gepi.21998
Keywords: uromodulin, hypertension, systolic blood pressure, diastolic blood pressure, Mendelian randomization
Citation: You R, Chen L, Xu L, Zhang D, Li H, Shi X, Zheng Y and Chen L (2021) High Level of Uromodulin Increases the Risk of Hypertension: A Mendelian Randomization Study. Front. Cardiovasc. Med. 8:736001. doi: 10.3389/fcvm.2021.736001
Received: 04 July 2021; Accepted: 09 August 2021;
Published: 01 September 2021.
Edited by:
Modar Kassan, University of Tennessee Health Science Center (UTHSC), United StatesCopyright © 2021 You, Chen, Xu, Zhang, Li, Shi, Zheng and Chen. This is an open-access article distributed under the terms of the Creative Commons Attribution License (CC BY). The use, distribution or reproduction in other forums is permitted, provided the original author(s) and the copyright owner(s) are credited and that the original publication in this journal is cited, in accordance with accepted academic practice. No use, distribution or reproduction is permitted which does not comply with these terms.
*Correspondence: Limeng Chen, Y2hlbmxpbWVuZ0BwdW1jaC5jbg==
Disclaimer: All claims expressed in this article are solely those of the authors and do not necessarily represent those of their affiliated organizations, or those of the publisher, the editors and the reviewers. Any product that may be evaluated in this article or claim that may be made by its manufacturer is not guaranteed or endorsed by the publisher.
Research integrity at Frontiers
Learn more about the work of our research integrity team to safeguard the quality of each article we publish.