
94% of researchers rate our articles as excellent or good
Learn more about the work of our research integrity team to safeguard the quality of each article we publish.
Find out more
REVIEW article
Front. Cardiovasc. Med. , 11 November 2021
Sec. Cardiovascular Metabolism
Volume 8 - 2021 | https://doi.org/10.3389/fcvm.2021.734364
This article is part of the Research Topic Metabolic Regulation in Cardiovascular Homeostasis and Disease View all 13 articles
 Anja Karlstaedt1,2*
Although metabolic remodeling during cardiovascular diseases has been well-recognized for decades, the recent development of analytical platforms and mathematical tools has driven the emergence of assessing cardiac metabolism using tracers. Metabolism is a critical component of cellular functions and adaptation to stress. The pathogenesis of cardiovascular disease involves metabolic adaptation to maintain cardiac contractile function even in advanced disease stages. Stable-isotope tracer measurements are a powerful tool for measuring flux distributions at the whole organism level and assessing metabolic changes at a systems level in vivo. The goal of this review is to summarize techniques and concepts for in vivo or ex vivo stable isotope labeling in cardiovascular research, to highlight mathematical concepts and their limitations, to describe analytical methods at the tissue and single-cell level, and to discuss opportunities to leverage metabolic models to address important mechanistic questions relevant to all patients with cardiovascular disease.
Measuring the dynamic range of cardiac metabolism has been a corner stone of cardiovascular research. Understanding how altered metabolism supports cardiac adaptation during stress and diseases requires a systems-wide approach. Translational models that recapitulate cardiac pathophysiology are critical to advance our understanding of cardiovascular diseases (CVDs) and to utilize metabolic vulnerabilities as biomarkers or for the development of therapeutics. Targeted or untargeted measurements of metabolites allow to assess the metabolic state in an organism in vivo. Measurements of metabolic changes in a variety of biological samples are feasible due to advances in chromatographic separation (e.g., hydrophilic interaction chromatography, HILIC; poroshell columns) and improved detection like nuclear magnetic resonance (NMR) and mass spectrometry (MS). However, the interpretation of complex disease models or patient derived samples can be challenging with large scale metabolomics and when a systems-wide understanding of specific pathways is required. Measuring changes in metabolite concentration do not allow to draw any conclusions on metabolic rates or the direction of a flux. Changes in metabolite levels can either result from differential production or utilization of a given intermediate due to increased flux from synthesizing reactions, decreased flux toward consuming reactions, or alterations in transporter activities. For example, during ischemia-reperfusion injury, glycolytic intermediates accumulate despite a reduction in glucose uptake (1–3). Therefore, accurate determination of metabolic flux is necessary for understanding cellular physiology and the pathophysiology of diseases. Steady states in cellular systems are defined by constant values of flux and metabolite concentrations (4). In experimental settings, steady states can be achieved in controlled cell cultures or ex vivo perfusions. However, commonly experiments are performed at pseudo-steady state, where changes in flux or metabolite concentrations are minimal over the observed time frame.
What is metabolic flux? Generally, flux describes the movement of particles across a given area in a specified time. It is important to distinguish between reaction rates and metabolic fluxes. A reaction rate describes the velocity of a given biochemical reaction in response to a substrate and enzyme in isolation, while metabolic fluxes describe the same reaction in the context of a biological system and pathway. Measuring metabolic flux is challenging and cannot be done directly, thus metabolic fluxes are estimations from measurable quantities. Tracer-based approaches provide an apparent straight-forward way of quantitatively assessing dynamic changes in cardiac metabolism. Especially, stable-isotope tracers allow to administer probes to a biological system (e.g., animal cells) in cost-efficient and safe way. At the same time metabolic conversions of labeled nutrients or small molecules allow to track the incorporation of isotopic label (e.g., carbon, nitrogen, or hydrogen) into downstream products and pathways. The detection of specific metabolic products then allows to assess total metabolite changes alongside enzyme activities, flux rates, and overall contribution of specific pathways to the metabolic profile. Tracer studies in isolated perfused murine hearts are commonly used to evaluate metabolic changes in model systems that resemble in vivo conditions as closely as possible (5). In vitro models using cultured cardiomyocytes have also shown to provide valuable information albeit with a limited scope. The selection of a specific method largely depends on the biological question and inherent limitations of models. Radioactive probes are a stable of both clinical cardiology and basic cardiovascular research (e.g., 18F, 3H, 14C) and are used to study in vivo or ex vivo metabolic changes in the heart. There are several clinically relevant radiopharmaceuticals such as 99mtechnetium-sestamibi (99mTC-MIBI, or CardioLite) (6) or [18F]-Fluorodeoxyglucose ([18F]-FDG) (7) for interrogating metabolic parameters such as nutrient uptake rates. These probes allow safe, non-invasive tracing of metabolic changes in vivo. However, readouts of these measurements are serving as surrogates for multiple metabolic pathways. The desire to measure more in-depth metabolic changes in the heart have led to increased application of stable-isotope tracers in clinical studies (8–10). Stable isotope probes (e.g., 2H, 13C, 15N) are less sensitive than radioactive probes, but in a single experiments stable isotope labeling approaches allow to assess multiple pathways simultaneously over longer experimental time periods. Like radiopharmaceuticals, stable-isotope tracers allow flux assessments, but at the same time these probes provide more in-depth analysis of metabolism both using targeted and untargeted discovery oriented analytical approaches. Increased availability and advancements in analytical techniques for metabolomics have made stable isotope tracers increasingly popular in studying cardiac metabolism in vivo and ex vivo. In this review, we describe recent advances in applying stable isotope tracers in cardiovascular research and discuss important aspects to consider during data analysis allowing accurate assessments of metabolic changes (Figure 1).
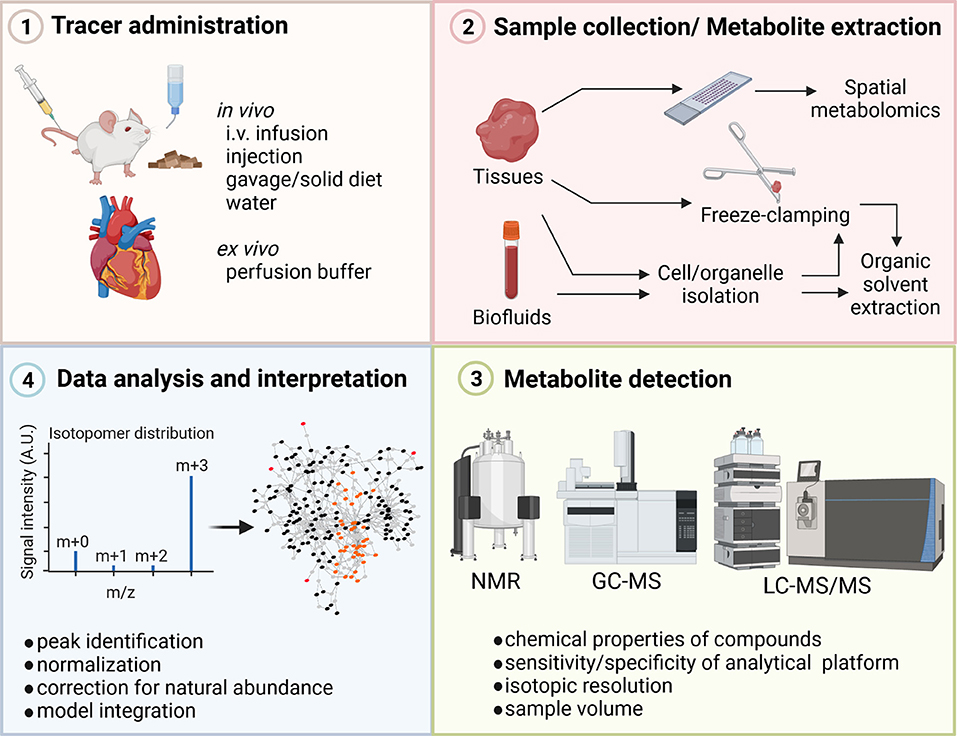
Figure 1. Steps in stable-isotope metabolomics analysis. Stable-isotope tracers to study cardiac metabolism are administered to the model organism or patient using different delivery approaches including, infusion, injections, diet, or ex vivo perfusion. Heart tissue or biofluids are collected and metabolites are extracted based on downstream analytical methods. For examples, tissue sample for total metabolite extraction are freeze-clamped in liquid nitrogen and tissue is quenched during extraction using organic solvents. To assess spatial metabolite abundances, tissue slides need to be prepared. Incorporation of isotopic label into metabolites is determined using analytical techniques such as NMR or MS. The isotopic enrichment profile of different metabolites is assessed after normalization and correction for natural abundances. GC, gas chromatography; i.v., intravenous; LC, liquid chromatography, MS, mass spectrometry; NMR, Nuclear magnetic resonance. Figure was created with BioRender.com.
Multiple techniques are available for the in vivo or ex vivo delivery of stable-isotope tracers including oral administration via diets, gavage or drinking water, direct intravenous infusion, injection, or perfusion of the heart (Figure 1). Each experimental method has its limitation thus the choice for the specific delivery needs to be driven by the biological question. In ex vivo heart perfusions, tracers are delivered via the perfusion buffer. The perfusion technique itself determines how close to physiologic conditions flux rates and metabolic changes can be measured. Two ex vivo perfusion techniques for studying cardiac metabolism and muscle physiology are the method of choice: (1) the Langendorff method and (2) the working heart preparation. The aortic perfusion of Langendorff remains a standard preparation and is popular to this date due to its simpler technical requirements and perfusion apparatus (11–14). However, hearts in this preparation do little or no external work and may require external stimulation which can obfuscate metabolic measurements. The more advanced working heart preparation allows arterial perfusion of the heart. This preparation maintains the physiologic contractile function of the heart and prevents periods of anoxia that may occur during Langendorff preparations (15). Several recent studies applied perfusion techniques in a diverse range of disease models to assess cardiac metabolism (Table 1). Regardless of the perfusion technique, tracers are applied through the chemically defined perfusion buffer and allow collection of samples in small time intervals which facilitates dynamic measurements of cardiac metabolism (Table 1).

Table 1. Overview of recent in vivo and ex vivo stable-isotope tracer studies in cardiovascular research, including administration methods, analytical platform, and chromatographic modes.
Infusion techniques are likely the most advanced method for the delivery of tracers. Stable isotope tracers are introduced intravenously into the systemic circulation of an animal (e.g., mouse, rat) or human participant. Blood or tissue samples are collected before and after tracer infusion, and isotopic enrichment is then analyzed. Another important factor during stable-tracer experiments is the dynamics of tracers and the determination of metabolite pool sizes (e.g., extracellular vs. intracellular), as well as turnover (or half-life) of metabolites (37). For example, the circulatory system or tubing in heart perfusions can be considered as a single pool. Tracers can be administered (1) continuously or (2) in a bolus. Constant infusion of tracer allows to start sample collections once an isotopic equilibrium is reached, while bolus injection results in an initial increase over time followed by an exponential decrease (37). In either case, pool sizes and compartmentalization of metabolites need to be considered for the estimation of intracellular fluxes (37). Recent studies have shown that pool sizes for metabolites need to be treated as parameters and measured as accurately as possible to improve quality of flux estimations from non-stationary fluxes (38). In metabolomics studies, control and monitoring of the nutrient environment is important. For in vivo, special attention needs to be paid to feeding, fasting, diet composition and number of animals per cage. For ex vivo studies, special care for the composition of perfusion buffers and reagent purities needs to be taken. For both in vivo and ex vivo studies it is important to assess if any anesthetic agents may obfuscate metabolic measurements through alterations of plasma metabolite concentrations. The duration of labeling depends on the pathway of interest and whether steady-state data needs to be achieved. In ex vivo heart perfusions, steady-state labeling can be reached within 10 to 20 min for key metabolic pathways (39), whereas in vivo labeling may require longer timeframes depending on the pathways of interest and tracer (10).
Selecting the right tracer depends on the scope of the study and ultimately which metabolic readout is required for a given biological question. The substrate class (e.g., carbohydrate, amino acid, fatty acid), type of atoms (e.g., 13C, 15N), number of labeled atoms (e.g., uniform vs. single) and position of labeled atoms will determine which products and pathways will incorporate the label. Any of these options increase the complexity of the experimental design and subsequent data analysis. Selecting the right combination of tracers allows delivering multiple probes and interrogation of multiple pathways simultaneously. Parallel tracing experiments are limited to few applications, but recent advances in high resolution mass spectrometry and development of new probes show promise. For a comprehensive overview of stable-isotope tracers and their readouts, readers are referred to Table 2 in (78). In uniformly labeled tracers, all atoms of interest are substituted with a stable isotope, while single or select position labeled tracers only carry isotopes at specific atoms. The advantage of uniform labeling is better coverage of a variety of different pathways while select position labeling allows to target specific reaction.
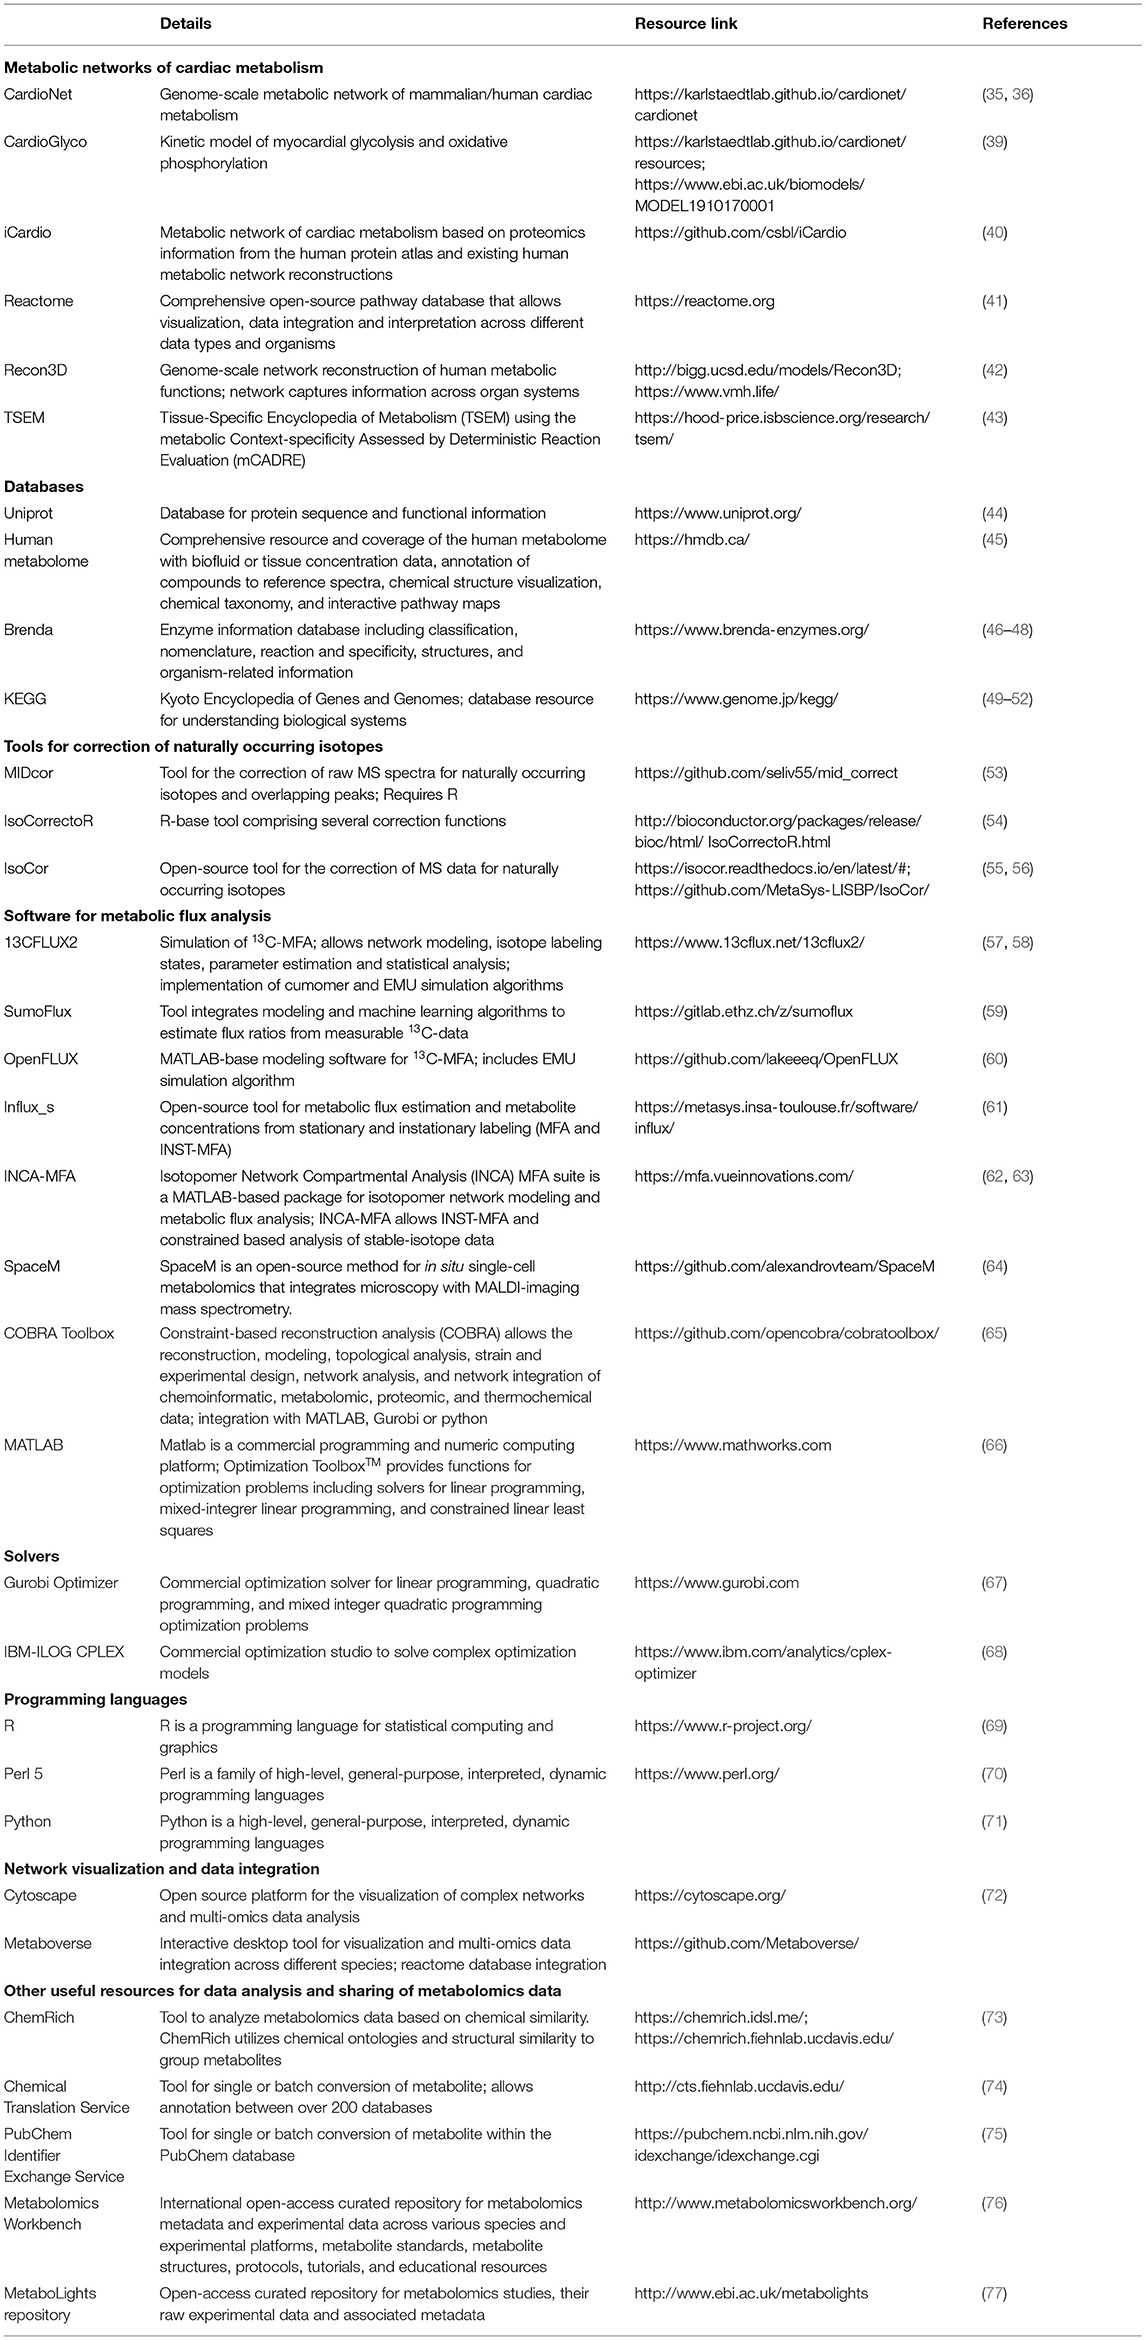
Table 2. Resources for network reconstruction, simulation and visualization of metabolic flux analysis using stable-isotope tracers.
Considering the diversity and versatility of stable isotope tracers, which criteria can we apply to select the optimal probe for a given experiment? The chemical properties, including kinetics, specificity, and turnover, are critical components of tracer selection. Tracer kinetics must be almost identical to unlabeled compounds and probes should not accumulate in tissue. Non-specific binding to other proteins and lipids is generally a concern when using radionucleotides but similar demands need to be met by stable isotope tracers. Lastly, turnover time and tissue concentration of tracers should follow the range of non-labelled metabolites to avoid mass effects and optimal signal-to-noise ratios. Selection of tracers can also be based on metabolic read-outs and targeted toward a pathway of interest. Uniformly labeled tracers of common nutrients (e.g., glucose, fatty acids, or amino acids) can be used to determine how these nutrients are utilized in multiple pathways. Combination with single labeled tracers in parallel experiments then allows to detect specific metabolic fluxes. Different labeling strategies are best described using glucose because of its high abundance, commercial availability, and ease of use in experimental settings. For example, [1-13C]glucose can be used to measure the decarboxylation of 6-phosphogluconate to ribulose 5-phosphate in the oxidative branch of the pentose phosphate pathway and the decarboxylation of pyruvate to acetyl-CoA by pyruvate dehydrogenase in the Krebs cycle (Figure 2A). Pentoses produced via the oxidative pentose phosphate pathway can reenter glycolysis via the non-oxidative pentose phosphate pathway branch. Resolution of both glycolysis and pentose phosphate pathway fluxes can be achieved using [1,2-13C]glucose tracer (Figure 2B). When glucose is converted through glycolysis, unlabeled (m + 0) and twice labeled (m + 2) pyruvate is produced. Conversion of glucose through glycolysis and the oxidative pentose phosphate pathway produces unlabeled (m + 0), single (m + 1) and twice labeled (m + 2) pyruvate. These flux alterations can occur in the background of increased pentose production via the non-oxidative pentose phosphate pathway which will make it difficult to detect changes in pyruvate labeling (79, 80). Parallel labeling using [1-13C], [1,2-13C], and [U-13C]glucose can improve detection of subtle, aberrant changes in metabolic flux (Figure 2B) (81). Alternatively, [3-2H]glucose can also be used to determine redox changes in central carbon metabolism by gaining insight into the de novo NADPH synthesis in the oxidative pentose phosphate pathway (Figure 2C) (82). Likewise [2-13C] and [3-13C]glucose can be used to evaluate the decarboxylation of isocitrate to α-ketoglutarate by isocitrate dehydrogenase and α-ketoglutarate to succinyl-CoA by α-ketoglutarate dehydrogenase (Figure 2A), respectively. Additionally, [2-13C] and [3-13C] glucose enable determining acetyl-CoA and fatty acid synthesis in the mitochondria and cytosol. The measurement of transporter activities can be achieved by using chemical analogs as tracers. Chemical analogs are compounds that have chemical structures like natural substrates, but with modifications at key positions. These modifications limit how these molecules can be metabolized and lead to accumulation of substrates in tissues. For example, the analog 2-deoxyglucose is transported across the cell membrane and phosphorylated by hexokinase in the same manner as glucose, but because the second carbon has been replaced by a hydrogen it cannot undergo further reactions. As such, 2-deoxyglucose competitively inhibits phosphoglucose isomerase and limits glycolysis. Using analogs 2-deoxyglucose or methyl-D-glucose allows determining uptake flux of glucose. In combination with other tracers it is possible to determine the overall utilization (uptake and metabolization) of glucose. To gain insight into the systems-wide response during disease development, it is also necessary to assess how metabolic alterations are linked to protein dynamics and posttranslation modifications (83, 84). Stable isotope tracers enable measuring posttranslational modifications of proteins. Protein methylation and acetylation can be determined by combining 13C-glucose with 15N or 13C-alpha ketoacids and 11C acetate, respectively. The methionine analog, azidohomoalanine, is enables labeling newly synthesized proteins during a short pulse-labeling period (85). The advantage of amino acid analogs compared to 13C or 15N-labeled amino acids is high sensitivity even at early time points when protein alterations are difficult to identify and often obscured by higher abundant proteins (e.g., structural proteins).
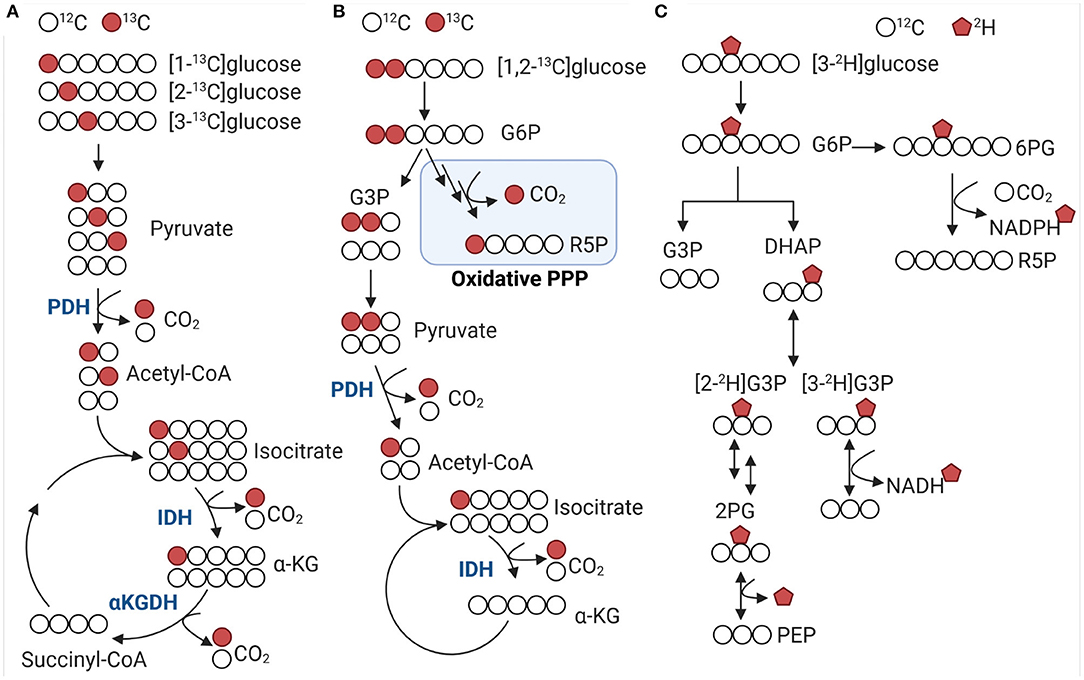
Figure 2. 13C and 2H distribution from labeled glucose in glycolysis and Krebs cycle. (A,B) 13C-glucose is decarboxylated at different steps in the Krebs cycle and oxidative pentose phosphate pathway. Colored circles indicate 13C label for selected metabolic intermediates. [2-13C]glucose and [3-13C]glucose are associated with pyruvate dehydrogenase (PDH) activity producing m+2 and m+3 acetyl-CoA, respectively. Using [1,2-13C]glucose allows to distinguish between glycolysis and oxidative pentose phosphate pathway (PPP) flux. (C) [3-2H]glucose enters the PPP via glucose 6-phosphate (G6P) and decarboxylated to ribulose 5-phosphate (R5P), which generates 2H-NADPH. DHAP, dihydroxyacetone phosphate; G6P, glucose 6-phosphate; G3P, glyceraldehyde 3-phosphate; IDH, isocitrate dehydrogenase; α-KG, α-ketoglutarate; α-KGDH, α-Ketoglutarate dehydrogenase; PDH, pyruvate dehydrogenase; PPP, pentose phosphate pathway; 6PG, 6-phosphogluconate; 2PG, 2-Phosphoglycerate; PEP, phosphoenolpyruvate; R5P, ribulose 5-phosphate.
A prerequisite for accurate metabolic measurements is the sample collection and preparation. Metabolites have different turnover rates and differences in their abundance can easily lead to obfuscation of experimental data. For example, rapid degradation of NADPH and CoA derivatives during sample preparation have been well-documented (86, 87). Developing methods and additives to preserve metabolites remains an area of active research. For tissue specimens, freeze clamping using the Wollenberger technique allows rapid freezing of tissue in liquid-nitrogen (88–90). In contrast to flash freezing, this technique has been shown to be superior in homogenously freezing tissue sample and preserving metabolic data. Tissue specimen can then be stored at −80°C for further processing. Similar, metabolite extractions using organic solvents (e.g., methanol:water, 80:20 w/w) quench metabolic profiles and help to reduce enzymatic activities. Measuring more instable metabolites such as NADPH or AMP, a mixture of acetonitrile:methanol:water (40:40:20, w/w) with 0.1 M formic acid can effectively capture and preserve readouts (86, 91). Additionally, adding internal standards during sample extraction can help tracking sample loss and allows correction between batches (87). Independent of the model system or delivery technique, special attention needs to be paid toward standardization of experimental conditions, and sample collection and preparation to ensure rigor and reproducibility of metabolic tracer experiments (76).
Mathematical modeling and computer simulations can help to understand the complex dynamics and interactions of biological processes. A network of biochemical reactions within an organism can be represented by mathematical equations based on established knowledge or extrapolation from other systems. Metabolic models or networks can help to conceptualize and test biological hypothesis in silico. In the context of stable-isotope tracer analysis, models are required to estimate flux distributions and explain labeling states for specific metabolites. These modeling approaches can describe the metabolic state of a biological system, but they cannot predict or explain it by identifying regulatory enzymes or principles (e.g., feedback interactions) (4).
Tracer studies can be analyzed using different approaches and level of depth. Most studies determine the relative incorporation of tracer into metabolites and assess qualitative changes in pathway activities. Isotopomers are defined as isomers of a given metabolite that differ only in the mass shift of their individual atoms, for example, 13C vs. 12C and 2H vs. 1H in carbon- and hydrogen-labeling studies, respectively. Stable-isotopomer measurements are interpreted by defining mass-distribution vectors (MDVs) that reflect the incorporation of label from a tracer into downstream metabolites (Figure 3A) (57, 92). MDVs are defined as follows:
Where each component Xj (with j = 0, 1,…, n) represents the fraction of a metabolite's pool that corresponds to the jth labeled isotopolog and n is the maximum number of labeled atoms that a metabolite can incorporate. The fractional isotope enrichments, Xj, and their sum equal 1 or 100%. In stable isotope labeling, incorporation of j labeled atoms causes a mass shift of j atomic units nominal to the mass M of the unlabeled metabolite. Therefore, the MDV is often denoted as follows:
Where IC denotes the isotopolog count for a given metabolite j and TC denotes the sum of all isotopolog counts. For example, the MDV for 13C-labeled glucose can be determined as:
with n = 6, because a glucose molecule has six carbon atoms where 13C-label can be incorporated. Xm0 represents the fraction of unlabeled glucose within the total metabolite pool, and Xm2 = 0.1 would indicate that 10% of the total glucose pool carries two 13C-labeled carbons. Based on the MDV it is not possible to assess where the incorporation of label occurred.
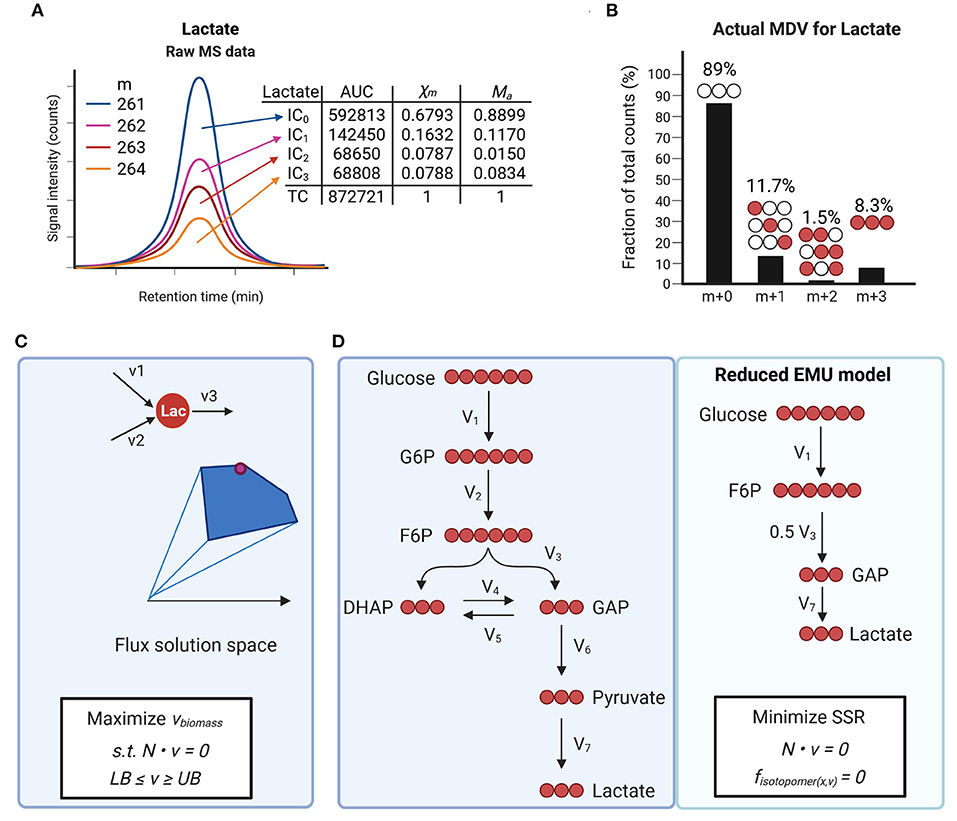
Figure 3. Isotope tracing to measure metabolic fluxes. (A,B) Example of isotopomer distribution analysis using mass spectrometry (MS) for 13C-lactate. Ion counts for different isotopologues (IC) are determined by measuring the area under the curve (AUC). Mass distribution vectors (MDVs) for lactate (Xm) are determined by dividing each IC by the total counts (TC). Measured MDVs are then corrected for naturally occurring isotopes (B). Actual MDVs for lactate can now be used for further data analysis such as metabolic flux analysis. (C) Flux balance analysis allows estimating flux distributions at steady state. Optimization functions are defined based on biological questions and applied to a network. Constraints for each flux vector are defined as lower bonds (LB) and upper bonds (UB) which allow to define flux solution spaces. (D) Schematic of carbon atom distribution in a simplified model of glycolysis using [U-13C]-glucose infusion. Network reactions can be further reduced to a define a final reduced EMU model. Flux distributions are estimated by minimizing the sum of least-squared residuals (SSR) between the measured rates and model predicted rates subject to stoichiometric constrain.
When using stable isotope labeling it is important to correct for natural occurrence of stable isotopes of all atoms within a metabolite. This correction is particularly important when derivatization agents are used during sample preparation (e.g., GC-MS requires derivatization using TBDMS), highly abundant metabolites (e.g., glucose), or single labeled tracers (n = 1) are being used. For instance, carbon appears in the form for two stable isotopes, 12C and 13C, with a natural occurrence of ~98.9 and 1.1%, respectively. When using 13C-tracers, measurements need to be corrected for this natural occurrence. Several tools have been developed (see Table 2) (53–56) that allow automatic correction of labeled isotopologues of a given metabolite by solving a linear equation as follows:
where and depict the measured MDV and actual MDVs for a metabolite, respectively. The jth row of the matrix contains the theoretically predicted MDV for the jth labeled isotopolog. Determining the actual MDVs for each metabolite is a critical step prior to further data analysis and flux interpretation (Figure 3B). To achieve quantitative information about metabolic conversion rates or flux rates different mathematical approaches need to be applied depending on the scope of the study and data type. Techniques in mathematical modeling can be broadly divided into ordinary differential equation and constrained based modeling. For a comprehensive compilation of different modeling techniques and applications, the reader is further referred to Klipp et al. (93).
Flux balance analysis (FBA) is a constrained-based modeling technique that relies on balancing fluxes around metabolites within a network stoichiometry (Figure 3C). Flux distributions in FBA are estimated based on (1) the steady-state assumption, (2) constraints derived from the metabolic environment (e.g., nutrient supply, oxygen consumption), and (3) an objective function such as biomass synthesis, energy provision or another cellular function that is critical for the organ system. Several groups have successfully applied this algorithm and integrated metabolomics data to study cardiac metabolism (35, 36, 40, 94). One limitation of FBA is the requirement for stationary flux patterns without any integration of thermodynamic feasibility. Several methods have been developed to allow inclusion of thermodynamic constraints and even dynamic optimization (95, 96).
13C-Metabolic flux analysis (13C-MFA) is most widely used in assessing flux in stable-isotope tracer experiments (92). In 13C-MFA, isotopomer distributions from labeled substrates (e.g., 13C-glucose) are incorporated into a mathematical model of atom transfers and combined with measurements of nutrient uptakes and secretions, and biomass function. The distribution of fluxes throughout a cellular metabolism is mathematically estimated by iteratively solving a least-square regression problem of isotope labeling measurements and extracellular exchanges rates. The models applied to data regression comprise mass balances and isotopomer balances on all network components, thus often encompasses hundreds of equations. The sum of squared residuals (SSR) is defined as follows:
Stationary fluxes (v) are estimated by the assumption of a steady state (equation 7) and minimizing SSRs between simulated (x) and experimentally derived (r) MDVs for a given metabolite S. The stoichiometry matrix of a given metabolic network is represented by N. Uncertainties, σ, can be estimated based on the root-mean square error of unenriched control samples and the standard error of measurement of technical MS replicates. For a metabolite S, steady state implies that the total rate at which it is supplied is equal to the total rate at which it is removed (see Figure 3). If the whole system is in a steady state these reaction rates are identical to the corresponding fluxes. Therefore, reaction rates and flux are often used interchangeably (97). In studies using direct infusion or ex vivo perfusion techniques, relative fluxes can be converted to absolute fluxes using known infusion rates or flow rates for specific tracers. A prerequisite for applying the above given mathematical concept is that measurements were conducted after reaching isotopic steady state.
A given metabolite comprising n atoms may exist in either labeled or unlabeled states with 2n isotopomers. For example, glucose (C6H12O6) consists of 64 carbon atom isotopomers (n = 6, 26), 4,096 hydrogen atom isotopomers (n = 12, 212), and combined 2.6 × 10⁵ (26 × 212) carbon and hydrogen isotopomers. Therefore, additional methods have been developed to allow the integration of multiple isotopic tracer systems (98). Without these methods, mathematical analysis of tracer studies is often limited to single isotopic tracers to allow efficient simulation of flux distributions. In the elementary metabolite units (EMU) framework labeling information is broken down into multiple individual sub-problems consisting of many coupled non-linear equations (98). The method uses a decomposition algorithm that identifies the minimum amount of information needed to simulate isotopic labeling within a given metabolic network. This approach is different from isotopomer methods, where the model includes all possible isotopomers resulting in an exponentially larger number of variables. The EMU framework requires fewer variables, thus allows the analysis of labeling by multiple isotopic tracers (Figure 3D). For a metabolite comprising n atoms, (2n – 1) EMUs are possible. The algorithm allows to identify a minimal set of EMUs to be considered in the simulation model, which reduces the overall number of variables and makes the computational analysis feasible even for multiple-tracer experiments and larger scale models (98). A given metabolic network is decomposed into different blocks of EMUs (98–100), which are expressed as follows:
where matrices Ai and Bi are strictly linear functions of fluxes. In case 13C labeling has not reached a steady state, isotopically non-stationary MFA (INST-MFA) methods can be used (62). INST-MFA describes the isotopomer balances using ordinary differential equations (ODEs) rather than linear regression models (92). The advantage of 13C-MFA is a higher flux precision and enhanced confidence in the accuracy of estimated fluxes. A typical tracer experiment using [U-13C]-glucose can result in 50 to 100 isotopic labeling measurements which are used to estimate just 20 to 30 independent metabolic flux parameters. This leads to redundancy in flux information and ultimately increases confidence.
Several publicly and commercially available software packages have been developed in recent years to facilitate network reconstructions and computational analysis of metabolic network using 13C-MFA and INST-MFA methods (62). Table 2 provides an overview of selected resources and repositories, which can be used to analyze stable-isotope tracer studies and may serve as a starting point for readers who are less familiar with including mathematical modeling into their data interpretation. Each of the listed resources serve a different purpose during the metabolomics workflow and in some instances can help with experimental design and selection of tracer probes or analytical platforms (Figure 1). For example, genome-scale reconstructions of cardiac metabolism allow to assess during the study design which metabolic reactions may be involved in the phenotype generation (35, 36, 39). In silico simulations can also determine which tracers are required or which metabolites need to be measured for the correct assessment of cardiac metabolic changes. MFA platforms like INCA and SumoFlux allow simulating tracer kinetics, which can be useful to determine when a given tracer may reach steady state under the experimental conditions (59, 63). Here, mathematical modeling can help narrowing done tracer options and provide unbiased analysis prior to experiments. EMU approaches can be used to select tracers for a given network and metabolic pathway by providing one optimal tracer or a reduced list of feasible tracers depending on the probe sensitivity, labeling pattern, and complexity of the metabolic network. Careful consideration of tracer type and labeling pattern prior to an experiment can help reducing potential computational burden of data analysis and improve overall data interpretation by providing clear isotope patterns.
The goal of metabolomics is to comprehensively measure the metabolic composition of a sample in a single analysis. Different analytical platforms combine unbiased, rapid, reproducible, and stable analysis of complex samples in a single run. Each technology has its advantages and disadvantages in terms of sensitivity, throughput, reproducibility, robustness, quantitation, and suitability for specific chemical classes of metabolites. These analytical chemistry techniques range from high-performance liquid chromatography (HPLC), gas chromatography-mass spectrometry (GC-MS), liquid chromatography-mass spectrometry (LC-MS), gas chromatography combustion isotope ratio mass spectrometry (GC-C-IRMS), capillary electrophoresis-mass spectrometry (CE-MS), Fourier transform-ion cyclotron-mass spectrometry (FT-ICR-MS), and nuclear magnetic resonance (NMR). Broadly, analytical chemistry techniques can be divided into (i) separation, (ii) identification, and (iii) quantification of metabolites from a complex sample (e.g., tissue, blood). The separation of metabolites is accomplished using chromatography (GC, HPLC) or CE. Sample detection is then achieved using fluorescence, ion conductivity, or spectrometry (MS, NMR, light absorption). MS and NMR are different types of spectrometers that measure physical characteristics over a given spectrum. MS measures masses within a chemical sample through their mass-to-charge ratio (m/z), while NMR measures the variation of nuclear resonant frequencies. Both detection techniques can be combined with a different separation method allowing customized application methods for a specific type of sample and compound. MS and NMR are widely used in metabolomics to detect and analyze stable isotope tracer studies, such as 1H, 13C, 14N, and 31P. A MS instrument consists of three main components: an ion source, a mass analyzer, and a detector. The ion source ionizes the sample, producing ions and fragment ions, then accelerated through the mass analyzer. Perpendicular magnetic fields deflect ions traveling through the mass analyzer according to their mass allowing to sort and detect ions based on their mass-to-charge ratio (m/z). The output is presented as a mass spectrum where each peak represents a different ion with a specific m/z, and the peak length corresponds with a relative abundance. Combining MS with separation techniques like GC or LC enables analysis of complex samples based on separation times (or retention times) and m/z ratios. The variable ionization of compounds, ion suppression, and instrument cycling times inherently limit the number and type of metabolites that can be distinguished in a single run. Different ionization techniques have been developed including electron ionization (EI) and chemical ionization (CI) for compounds in gas-phase, as well as electrospray ionization (ESI) and matrix-assisted laser desorption/ionization (MALDI) which are suitable for thermally labile and non-volatile analytes (101). After ionization, the mass analyzer sorts the ions by their m/z ratio using magnetic or electrical fields. Common analyzers use time of flight (TOF), quadrupole mass filter, quadrupole ion trap, Fourier transform-ion cyclotron or orbitrap. Each separated ion induces a specific charge which is finally measured in the detector. The advantage of MS over NMR is higher throughput, sensitivity, analysis speed, and a broader range of applications. Continuous improvements in instrumentation design and reduced running costs have led to increased accessibility and implementation of MS in research studies. The sensitivity and resolution of NMR instruments depend on the magnetic field strength, which has been improved in the past decade. 1H NMR spectra have a small chemical shift range, which leads to overlapping peaks in complex samples, limiting detection, and lowering sensitivity. Combination of one-dimensional with two-dimensional NMR spectrometry has improved signal dispersion and compound identifications (102). Implementation of cryo-or microprobes further reduced scanning times needed to record a spectrum and greatly improved the sensitivity. Another advantage of NMR spectrometry is the quantitation and more uniform detection system, which can be directly used to identify and quantify metabolites both ex vivo and in vivo. In addition, the non-destructive nature of NMR methods leads to simplified sample preparation or even enables direct measurement of samples from body fluids (e.g., urine). Another advantage over MS is quantifying multiple compounds without the need for calibration curves for each compound. MS and NMR spectrometry have evolved as the most common techniques in stable isotope tracer and metabolomics studies. However, there is no single analytical platform that can achieve a complete quantification and identification of all molecules within a sample. Therefore, more than one method must be employed for comprehensive metabolic profiling. When deciding on an analytical avenue, the choice primarily depends on the focus of the research study and the nature of the samples, and instrument and know-how accessibility.
Single-cell analysis is a powerful tool to interrogate cellular heterogeneity within the same tissue, allowing for refined assessment of phenotypes and biomarker discovery. Metabolomics at the single-cell level holds the promise to obtain precise spatial and temporal information allowing to assess cell differentiation and division, cell-cell interactions, metabolic cooperation between cell populations and a detailed stress response analysis. In comparison to other omics technology, single-cell metabolomics faces several challenges because of the chemical diversity of metabolites, wide range of concentrations, sample stability, and lack of amplification (103). Recent studies have tried to circumvent challenges in single-cell metabolomics by using co-immunoprecipitation of proteins followed by MS to capture metabolic features (104). These strategies raise the question how much of metabolic regulation is dependent on protein abundance changes. The relationship between enzyme function and metabolites is multifactorial and dynamic, which explains poor correlation between individual proteins and metabolites (105, 106). Integration of proteomics and transcriptomics data with mathematical modeling and machine learning algorithms may improve the predictive value of these methods (107). Metabolomics at the single-cell level includes several pre-processing and sample conditioning steps, including desalting, to decomplexify the sample. These additional steps increase robustness but can also lead to sample loss. The limiting factor in stable-isotope labeling for single-cell analysis is sensitivity and isotopic resolution of a given analytical platform. Detection of metabolites in small sample volumes has been achieved with both NMR and MS (108). However, the sample volume for NMR application is larger than the single-cell level, thus NMR is commonly used with tissue samples or body fluids (e.g., plasma, urine). In recent years, progress has been made to facilitate mass spectrometry-based single-cell metabolomics through increased instrument sensitivities and enhanced technologies. Mass spectrometry Imaging (MSI)-based methods are currently the most sensitive, thus preferred analytical platforms for single-cell metabolomics (103). MSI is a logic progression of laser microdissection technology and combines high-resolution microscopy with MS, which can be applied to thin tissue section or dispersed cell population attached to a grid. MALDI-MSI and ESI-MSI are the two conventional platforms applied for single-cell metabolomics. Both techniques allow spatial resolution of very small sample amounts (μl to pL range), analysis in the attomole ranges, and integration with automation. Recent studies demonstrate that these MS technologies can be applied to identify metabolic alterations in endothelial cell migration (109), tumor cell metastasis (110), and even to the single organelle level (111). The complementary nature of single-cell approaches enables spatial characterization of different cell types, reproducible measurement of metabolic states and organelle analysis when combined with other electrophysiological (e.g., patch clamping) techniques. However, single organelle analysis remains challenging due to limitations in reproducibility, low analyte abundances, limited sample volumes, and interference from sample impurities (103). Single-cell metabolomics is feasible across different platforms due to recent advance in MS technology, which enables enough resolution for monoisotopic detection. For studies that do not require a spatial resolution but molecular characterization at the single-cell level, separation-based methods like capillary electrophoresis (CE), LC, or GC combined with MS or fluorescent tagging approaches can provide sufficient sensitivity for certain applications (112). Analytical platforms like CE-ESI-MS allow qualitative and quantitative analyses of single cells and subcellular compartments with high resolving power and low sample input (<1 μl). CE is a powerful platform and can be coupled with optical, electrochemical, or MS-based detection expanding its applications (112). Compared to other application, one limitation of CE is its low throughput (113). Separations using CE can last up to 1 h, which limits the number of cells that can be assayed from one population (114). Therefore, recent methods have been introduced that directly inject cells into the capillary for lysis and separation reducing the time between cell rupture and analysis. Further advances in MSI and separation-based MS for single-cell metabolomics will offer unique approaches to classify cell types and identify subpopulation thus enhance our understanding of metabolic remodeling during cardiovascular diseases.
Understanding how reprogrammed metabolism supports cardiac adaptation during stress and diseases requires a systems-wide approach. Translational models that recapitulate cardiac pathophysiology are critical to advance our understanding of CVDs and to utilize metabolic vulnerabilities through the development of novel therapeutics or biomarker identification. Stable-isotope labeling and mathematical modeling require multidisciplinary collaborations to bridging animal models into patients. Likewise, clinical studies should inform animal models for mechanistic hypothesis-driven testing. Challenges persist in accurate estimations of fluxes from stable-isotope tracers and integration into clinical trials. Evidence indicates that metabolic phenotypes are a key determinate of disease development and progression. Advancements in analytical methods to quantify metabolic phenotypes in vivo will be critical to identify metabolic vulnerabilities. Ultimately, these efforts may help clinicians to tailor therapeutic interventions based on the metabolic profile of the intact heart.
AK designed and wrote the manuscript.
This research was supported by R00-HL-141702 and institutional funds from Cedars-Sinai Medical Center to AK.
The author declares that the research was conducted in the absence of any commercial or financial relationships that could be construed as a potential conflict of interest.
All claims expressed in this article are solely those of the authors and do not necessarily represent those of their affiliated organizations, or those of the publisher, the editors and the reviewers. Any product that may be evaluated in this article, or claim that may be made by its manufacturer, is not guaranteed or endorsed by the publisher.
The author acknowledges many fruitful discussions with Arpana Vaniya, Heidi Vitrac, and Aleksandr Stotland at UC Davis, Tosoh Biosciences, and Cedars-Sinai Medical Center. Figures were created with BioRender.com.
1. Jaswal JS, Keung W, Wang W, Ussher JR, Lopaschuk GD. Targeting fatty acid and carbohydrate oxidation–a novel therapeutic intervention in the ischemic and failing heart. Biochim Biophys Acta. (2011) 1813:1333–50. doi: 10.1016/j.bbamcr.2011.01.015
2. Nederlof R, Denis S, Lauzier B, Rosiers CD, Laakso M, Hagen J, et al. Acute detachment of hexokinase II from mitochondria modestly increases oxygen consumption of the intact mouse heart. Metabolism. (2017) 72:66–74. doi: 10.1016/j.metabol.2017.04.008
3. Ritterhoff J, Young S, Villet O, Shao D, Neto FC, Bettcher LF, et al. Metabolic remodeling promotes cardiac hypertrophy by directing glucose to aspartate biosynthesis. Circ Res. (2020) 126:182–96. doi: 10.1161/CIRCRESAHA.119.315483
4. Heinrich R, Rapoport SM, Rapoport TA. Metabolic regulation and mathematical models. Prog Biophys Mol Biol. (1977) 32:1–82. doi: 10.1016/0079-6107(78)90017-2
5. Ruiz M, Gelinas R, Vaillant F, Lauzier B, Des Rosiers C. Metabolic tracing using stable isotope-labeled substrates and mass spectrometry in the perfused mouse heart. Methods Enzymol. (2015) 561:107–47. doi: 10.1016/bs.mie.2015.06.026
6. Hage FG, Aljaroudi WA. Review of cardiovascular imaging in the journal of nuclear cardiology in 2016: part 2 of 2-myocardial perfusion imaging. J Nucl Cardiol. (2017) 24:1190–9. doi: 10.1007/s12350-017-0875-2
7. Pirro M, Simental-Mendia LE, Bianconi V, Watts GF, Banach M, Sahebkar A. Effect of statin therapy on arterial wall inflammation based on 18F-FDG PET/CT: a systematic review and meta-analysis of interventional studies. J Clin Med. (2019) 8:118. doi: 10.3390/jcm8010118
8. Kim IY, Williams RH, Schutzler SE, Lasley CJ, Bodenner DL, Wolfe RR, et al. Acute lysine supplementation does not improve hepatic or peripheral insulin sensitivity in older, overweight individuals. Nutr Metab. (2014) 11:49. doi: 10.1186/1743-7075-11-49
9. Kim IY, Schutzler S, Schrader A, Spencer H, Kortebein P, Deutz NE, et al. Quantity of dietary protein intake, but not pattern of intake, affects net protein balance primarily through differences in protein synthesis in older adults. Am J Physiol Endocrinol Metab. (2015) 308:E21–8. doi: 10.1152/ajpendo.00382.2014
10. Neinast MD, Jang C, Hui S, Murashige DS, Chu Q, Morscher RJ, et al. Quantitative analysis of the whole-body metabolic fate of branched-chain amino acids. Cell Metab. (2019) 29:417–29 e414. doi: 10.1016/j.cmet.2018.10.013
11. Bleehen NM, Fisher, R.B. The action of insulin on the isolated rat heart. J Physiol. (1954) 123:260. doi: 10.1113/jphysiol.1954.sp005049
12. Morgan HE, Henderson MJ, Regen DM, Park CR. Regulation of glucose uptake in muscle. I. The effects of insulin and anoxia on glucose transport and phosphorylation in the isolated, perfused heart of normal rats. J Biol Chem. (1961) 236:253–61. doi: 10.1016/S0021-9258(18)64348-0
13. Williamson JR, Krebs HA. Acetoacetate as fuel of respiration in the perfused rat heart. Biochem J. (1961) 80:540–7. doi: 10.1042/bj0800540
14. Opie LH. Coronary flow rate and perfusion pressure as determinants of mechanical function and oxidative metabolism of isolated perfused rat heart. J Physiol. (1965) 180:529–41. doi: 10.1113/jphysiol.1965.sp007715
15. Taegtmeyer H, Hems R, Krebs HA. Utilization of energy-providing substrates in the isolated working rat heart. Biochem J. (1980) 186:701–11. doi: 10.1042/bj1860701
16. Salabei JK, Lorkiewicz PK, Mehra P, Gibb AA, Haberzettl P, Hong KU, et al. Type 2 diabetes dysregulates glucose metabolism in cardiac progenitor cells. J Biol Chem. (2016) 291:13634–48. doi: 10.1074/jbc.M116.722496
17. Lee MH, Malloy CR, Corbin IR, Li J, Jin ES. Assessing the pentose phosphate pathway using [2, 3-(13) C2 ]glucose. NMR Biomed. (2019) 32:e4096. doi: 10.1002/nbm.4096
18. Jin ES, Lee MH, Malloy CR. 13C NMR of glutamate for monitoring the pentose phosphate pathway in myocardium. NMR Biomed. (2021) 34:e4533. doi: 10.1002/nbm.4533
19. Olson AK, Bouchard B, Zhu WZ, Chatham JC, Des Rosiers C. First characterization of glucose flux through the hexosamine biosynthesis pathway (HBP) in ex vivo mouse heart. J Biol Chem. (2020) 295:2018–33. doi: 10.1074/jbc.RA119.010565
20. Zhang Y, Taufalele PV, Cochran JD, Robillard-Frayne I, Marx JM, Soto J, et al. Mitochondrial pyruvate carriers are required for myocardial stress adaptation. Nat Metab. (2020) 2:1248–64. doi: 10.1038/s42255-020-00288-1
21. Zhang H, Uthman L, Bakker D, Sari S, Chen S, Hollmann MW, et al. Empagliflozin decreases lactate generation in an NHE-1 dependent fashion and increases alpha-ketoglutarate synthesis from palmitate in Type II diabetic mouse hearts. Front Cardiovasc Med. (2020) 7:592233. doi: 10.3389/fcvm.2020.592233
22. Ronda O, Van De Heijning BJM, Martini IA, Koehorst M, Havinga R, Jurdzinski A, et al. An early-life diet containing large phospholipid-coated lipid globules programmes later-life postabsorptive lipid trafficking in high-fat diet- but not in low-fat diet-fed mice. Br J Nutr. (2021) 125:961–71. doi: 10.1017/S0007114520002421
23. Wust RCI, Coolen BF, Held NM, Daal MRR, Alizadeh Tazehkandi V, Baks-Te Bulte L, et al. The antibiotic doxycycline impairs cardiac mitochondrial and contractile function. Int J Mol Sci. (2021) 22:4100. doi: 10.3390/ijms22084100
24. Ragavan M, Li M, Giacalone AG, Wood CE, Keller-Wood M, Merritt ME. Application of carbon-13 isotopomer analysis to assess perinatal myocardial glucose metabolism in sheep. Metabolites. (2021) 11:33. doi: 10.3390/metabo11010033
25. Gibb AA, Lorkiewicz PK, Zheng YT, Zhang X, Bhatnagar A, Jones SP, et al. Integration of flux measurements to resolve changes in anabolic and catabolic metabolism in cardiac myocytes. Biochem J. (2017) 474:2785–801. doi: 10.1042/BCJ20170474
26. Madsen KL, Preisler N, Rasmussen J, Hedermann G, Olesen JH, Lund AM, et al. L-carnitine improves skeletal muscle fat oxidation in primary carnitine deficiency. J Clin Endocrinol Metab. (2018) 103:4580–8. doi: 10.1210/jc.2018-00953
27. Parry SA, Rosqvist F, Mozes FE, Cornfield T, Hutchinson M, Piche ME, et al. Intrahepatic fat and postprandial glycemia increase after consumption of a diet enriched in saturated fat compared with free sugars. Diabetes Care. (2020) 43:1134–41. doi: 10.2337/dc19-2331
28. Wang Y, Christopher BA, Wilson KA, Muoio D, Mcgarrah RW, Brunengraber H, et al. Propionate-induced changes in cardiac metabolism, notably CoA trapping, are not altered by l-carnitine. Am J Physiol Endocrinol Metab. (2018) 315:E622–33. doi: 10.1152/ajpendo.00081.2018
29. Renguet E, Ginion A, Gelinas R, Bultot L, Auquier J, Robillard Frayne I, et al. Metabolism and acetylation contribute to leucine-mediated inhibition of cardiac glucose uptake. Am J Physiol Heart Circ Physiol. (2017) 313:H432–45. doi: 10.1152/ajpheart.00738.2016
30. Zhang J, Wang YT, Miller JH, Day MM, Munger JC, Brookes PS. Accumulation of succinate in cardiac ischemia primarily occurs via canonical krebs cycle activity. Cell Rep. (2018) 23:2617–28. doi: 10.1016/j.celrep.2018.04.104
31. Watanabe K, Nagao M, Toh R, Irino Y, Shinohara M, Iino T, et al. Critical role of glutamine metabolism in cardiomyocytes under oxidative stress. Biochem Biophys Res Commun. (2021) 534:687–93. doi: 10.1016/j.bbrc.2020.11.018
32. Lindsay RT, Demetriou D, Manetta-Jones D, West JA, Murray AJ, Griffin JL. A model for determining cardiac mitochondrial substrate utilisation using stable (13)C-labelled metabolites. Metabolomics. (2019) 15:154. doi: 10.1007/s11306-019-1618-y
33. Khairallah M, Labarthe F, Bouchard B, Danialou G, Petrof BJ, Des Rosiers C. Profiling substrate fluxes in the isolated working mouse heart using 13C-labeled substrates: focusing on the origin and fate of pyruvate and citrate carbons. Am J Physiol Heart Circ Physiol. (2004) 286:H1461–70. doi: 10.1152/ajpheart.00942.2003
34. Crown SB, Kelleher JK, Rouf R, Muoio DM, Antoniewicz MR. Comprehensive metabolic modeling of multiple 13C-isotopomer data sets to study metabolism in perfused working hearts. Am J Physiol Heart Circ Physiol. (2016) 311:H881–91. doi: 10.1152/ajpheart.00428.2016
35. Karlstadt A, Fliegner D, Kararigas G, Ruderisch HS, Regitz-Zagrosek V, Holzhutter HG. CardioNet: a human metabolic network suited for the study of cardiomyocyte metabolism. BMC Syst Biol. (2012) 6:114. doi: 10.1186/1752-0509-6-114
36. Aksentijevic D, Karlstaedt A, Basalay MV, O'brien BA, Sanchez-Tatay D, Eminaga S, et al. Intracellular sodium elevation reprograms cardiac metabolism. Nat Commun. (2020) 11:4337. doi: 10.1038/s41467-020-18160-x
37. Wolfe RR, Park S, Kim IY, Moughan PJ, Ferrando AA. Advances in stable isotope tracer methodology part 2: new thoughts about an “old” method-measurement of whole body protein synthesis and breakdown in the fed state. J Investig Med. (2020) 68:11–5. doi: 10.1136/jim-2019-001108
38. Heise R, Fernie AR, Stitt M, Nikoloski Z. Pool size measurements facilitate the determination of fluxes at branching points in non-stationary metabolic flux analysis: the case of Arabidopsis thaliana. Front Plant Sci. (2015) 6:386. doi: 10.3389/fpls.2015.00386
39. Karlstaedt A, Khanna R, Thangam M, Taegtmeyer H. Glucose 6-phosphate accumulates via phosphoglucose isomerase inhibition in heart muscle. Circ Res. (2020) 126:60–74. doi: 10.1161/CIRCRESAHA.119.315180
40. Dougherty BV, Rawls KD, Kolling GL, Vinnakota KC, Wallqvist A, Papin JA. Identifying functional metabolic shifts in heart failure with the integration of omics data and a heart-specific, genome-scale model. Cell Rep. (2021) 34:108836. doi: 10.1016/j.celrep.2021.108836
41. Jassal B, Matthews L, Viteri G, Gong C, Lorente P, Fabregat A, et al. The reactome pathway knowledgebase. Nucleic Acids Res. (2020) 48:D498–503. doi: 10.1093/nar/gkz1031
42. Brunk E, Sahoo S, Zielinski DC, Altunkaya A, Drager A, Mih N, et al. Recon3D enables a three-dimensional view of gene variation in human metabolism. Nat Biotechnol. (2018) 36:272–81. doi: 10.1038/nbt.4072
43. Wang Y, Eddy JA, Price ND. Reconstruction of genome-scale metabolic models for 126 human tissues using mCADRE. BMC Syst Biol. (2012) 6:153. doi: 10.1186/1752-0509-6-153
44. Uniprot C. UniProt: the universal protein knowledgebase in 2021. Nucleic Acids Res. (2021) 49:D480–9. doi: 10.1093/nar/gkaa1100
45. Wishart DS, Feunang YD, Marcu A, Guo AC, Liang K, Vazquez-Fresno R, et al. HMDB 4.0: the human metabolome database for 2018. Nucleic Acids Res. (2018) 46:D608–17. doi: 10.1093/nar/gkx1089
46. Schomburg I, Chang A, Schomburg D. BRENDA, enzyme data and metabolic information. Nucleic Acids Res. (2002) 30:47–9. doi: 10.1093/nar/30.1.47
47. Scheer M, Grote A, Chang A, Schomburg I, Munaretto C, Rother M, et al. BRENDA, the enzyme information system in 2011. Nucleic Acids Res. (2011) 39:D670–6. doi: 10.1093/nar/gkq1089
48. Chang A, Jeske L, Ulbrich S, Hofmann J, Koblitz J, Schomburg I, et al. BRENDA, the ELIXIR core data resource in 2021: new developments and updates. Nucleic Acids Res. (2021) 49:D498–508. doi: 10.1093/nar/gkaa1025
49. Kanehisa M. The KEGG database. Novartis Found Symp. (2002) 247:91–101; discussion 101–103 119–128, 244–152. doi: 10.1002/0470857897.ch8
50. Kanehisa M. Molecular network analysis of diseases and drugs in KEGG. Methods Mol Biol. (2013) 939:263–75. doi: 10.1007/978-1-62703-107-3_17
51. Kanehisa M. KEGG bioinformatics resource for plant genomics and metabolomics. Methods Mol Biol. (2016) 1374:55–70. doi: 10.1007/978-1-4939-3167-5_3
52. Kanehisa M. Enzyme annotation and metabolic reconstruction using KEGG. Methods Mol Biol. (2017) 1611:135–45. doi: 10.1007/978-1-4939-7015-5_11
53. Selivanov VA, Benito A, Miranda A, Aguilar E, Polat IH, Centelles JJ, et al. MIDcor, an R-program for deciphering mass interferences in mass spectra of metabolites enriched in stable isotopes. BMC Bioinformatics. (2017) 18:88. doi: 10.1186/s12859-017-1513-3
54. Heinrich P, Kohler C, Ellmann L, Kuerner P, Spang R, Oefner PJ, et al. Correcting for natural isotope abundance and tracer impurity in MS-, MS/MS- and high-resolution-multiple-tracer-data from stable isotope labeling experiments with IsoCorrectoR. Sci Rep. (2018) 8:17910. doi: 10.1038/s41598-018-36293-4
55. Millard P, Letisse F, Sokol S, Portais JC. IsoCor: correcting MS data in isotope labeling experiments. Bioinformatics. (2012) 28:1294–6. doi: 10.1093/bioinformatics/bts127
56. Millard P, Delepine B, Guionnet M, Heuillet M, Bellvert F, Letisse F. IsoCor: isotope correction for high-resolution MS labeling experiments. Bioinformatics. (2019) 35:4484–7. doi: 10.1093/bioinformatics/btz209
57. Wiechert W, Mollney M, Petersen S, De Graaf AA. A universal framework for 13C metabolic flux analysis. Metab Eng. (2001) 3:265–83. doi: 10.1006/mben.2001.0188
58. Weitzel M, Noh K, Dalman T, Niedenfuhr S, Stute B, Wiechert W. 13CFLUX2–high-performance software suite for (13)C-metabolic flux analysis. Bioinformatics. (2013) 29:143–5. doi: 10.1093/bioinformatics/bts646
59. Kogadeeva M, Zamboni N. SUMOFLUX: a generalized method for targeted 13C metabolic flux ratio analysis. PLoS Comput Biol. (2016) 12:e1005109. doi: 10.1371/journal.pcbi.1005109
60. Quek LE, Wittmann C, Nielsen LK, Kromer JO. OpenFLUX: efficient modelling software for 13C-based metabolic flux analysis. Microb Cell Fact. (2009) 8:25. doi: 10.1186/1475-2859-8-25
61. Sokol S, Millard P, Portais JC. influx_s: increasing numerical stability and precision for metabolic flux analysis in isotope labelling experiments. Bioinformatics. (2012) 28:687–93. doi: 10.1093/bioinformatics/btr716
62. Young JD, Walther JL, Antoniewicz MR, Yoo H, Stephanopoulos G. An elementary metabolite unit (EMU) based method of isotopically nonstationary flux analysis. Biotechnol Bioeng. (2008) 99:686–99. doi: 10.1002/bit.21632
63. Young JD. INCA: a computational platform for isotopically non-stationary metabolic flux analysis. Bioinformatics. (2014) 30:1333–5. doi: 10.1093/bioinformatics/btu015
64. Rappez L, Stadler M, Triana S, Gathungu RM, Ovchinnikova K, Phapale P, et al. SpaceM reveals metabolic states of single cells. Nat Methods. (2021) 18:799–805. doi: 10.1038/s41592-021-01198-0
65. Heirendt L, Arreckx S, Pfau T, Mendoza SN, Richelle A, Heinken A, et al. Creation and analysis of biochemical constraint-based models using the COBRA Toolbox v.3.0. Nat Protoc. (2019) 14:639–702. doi: 10.1038/s41596-018-0098-2
67. Gurobi Optimization Llc. Gurobi Optimizer Reference Manual, Version 9.1 (2021). Available online at: https://www.gurobi.com/documentation/9.1/refman/index.html
68. Cplex II. V12. 1: User's Manual for CPLEX. Int Bus Mach Corp. (2009) 46:157. Available online at: https://www.ibm.com/docs/en/icos/12.10.0?topic=cplex-users-manual
69. R Core Team. R: A Language and Environment for Statistical Computing. Vienna: R Foundation for Statistical Computing (2017).
71. Van Rossum G, Drake FL. Python Reference Manual. Amsterdam: Centrum voor Wiskunde en Informatica (1995).
72. Otasek D, Morris JH, Boucas J, Pico AR, Demchak B. Cytoscape automation: empowering workflow-based network analysis. Genome Biol. (2019) 20:185. doi: 10.1186/s13059-019-1758-4
73. Barupal DK, Fiehn O. Chemical similarity enrichment analysis (ChemRICH) as alternative to biochemical pathway mapping for metabolomic datasets. Sci Rep. (2017) 7:14567. doi: 10.1038/s41598-017-15231-w
74. Wohlgemuth G, Haldiya PK, Willighagen E, Kind T, Fiehn O. The chemical translation service–a web-based tool to improve standardization of metabolomic reports. Bioinformatics. (2010) 26:2647–8. doi: 10.1093/bioinformatics/btq476
75. Kim S, Chen J, Cheng T, Gindulyte A, He J, He S, et al. PubChem in 2021: new data content and improved web interfaces. Nucleic Acids Res. (2021) 49:D1388–95. doi: 10.1093/nar/gkaa971
76. Sud M, Fahy E, Cotter D, Azam K, Vadivelu I, Burant C, et al. Metabolomics Workbench: An international repository for metabolomics data and metadata, metabolite standards, protocols, tutorials and training, analysis tools. Nucleic Acids Res. (2016) 44:D463–70. doi: 10.1093/nar/gkv1042
77. Salek RM, Haug K, Conesa P, Hastings J, Williams M, Mahendraker T, et al. The metabolights repository: curation challenges in metabolomics. Database. (2013) 2013: bat029. doi: 10.1093/database/bat029
78. Jang C, Chen L, Rabinowitz JD. Metabolomics and isotope tracing. Cell. (2018) 173:822–37. doi: 10.1016/j.cell.2018.03.055
79. Liu H, Huang D, Mcarthur DL, Boros LG, Nissen N, Heaney AP. Fructose induces transketolase flux to promote pancreatic cancer growth. Cancer Res. (2010) 70:6368–76. doi: 10.1158/0008-5472.CAN-09-4615
80. Ying H, Kimmelman AC, Lyssiotis CA, Hua S, Chu GC, Fletcher-Sananikone E, et al. Oncogenic Kras maintains pancreatic tumors through regulation of anabolic glucose metabolism. Cell. (2012) 149:656–70. doi: 10.1016/j.cell.2012.01.058
81. Moon SJ, Dong W, Stephanopoulos GN, Sikes HD. Oxidative pentose phosphate pathway and glucose anaplerosis support maintenance of mitochondrial NADPH pool under mitochondrial oxidative stress. Bioeng Transl Med. (2020) 5:e10184. doi: 10.1002/btm2.10184
82. Lewis CA, Parker SJ, Fiske BP, Mccloskey D, Gui DY, Green CR, et al. Tracing compartmentalized NADPH metabolism in the cytosol and mitochondria of mammalian cells. Mol Cell. (2014) 55:253–63. doi: 10.1016/j.molcel.2014.05.008
83. Simithy J, Sidoli S, Yuan ZF, Coradin M, Bhanu NV, Marchione DM, et al. Characterization of histone acylations links chromatin modifications with metabolism. Nat Commun. (2017) 8:1141. doi: 10.1038/s41467-017-01384-9
84. Lund PJ, Kori Y, Zhao X, Sidoli S, Yuan ZF, Garcia BA. Isotopic labeling and quantitative proteomics of acetylation on histones and beyond. Methods Mol Biol. (2019) 1977:43–70. doi: 10.1007/978-1-4939-9232-4_5
85. Mcclatchy DB, Ma Y, Liu C, Stein BD, Martinez-Bartolome S, Vasquez D, et al. Pulsed azidohomoalanine labeling in mammals (PALM) detects changes in liver-specific LKB1 knockout mice. J Proteome Res. (2015) 14:4815–22. doi: 10.1021/acs.jproteome.5b00653
86. Lu W, Wang L, Chen L, Hui S, Rabinowitz JD. Extraction and quantitation of nicotinamide adenine dinucleotide redox cofactors. Antioxid Redox Signal. (2018) 28:167–79. doi: 10.1089/ars.2017.7014
87. Trefely S, Liu J, Huber K, Doan MT, Jiang H, Singh J, et al. Subcellular metabolic pathway kinetics are revealed by correcting for artifactual post harvest metabolism. Mol Metab. (2019) 30:61–71. doi: 10.1016/j.molmet.2019.09.004
88. Wollenberger A, Ristau O, Schoffa G. [A simple technic for extremely rapid freezing of large pieces of tissue]. Pflugers Arch Gesamte Physiol Menschen Tiere. (1960) 270:399–412. doi: 10.1007/BF00362995
89. Wollenberger A, Halle W, Kallabis E, Kleitke B, Hinterberger U, Schulze W. Cultivation of beating heart cells from frozen heart cell suspensions. Naturwissenschaften. (1967) 54:174. doi: 10.1007/BF00590855
90. Janiszewski E, Wollenberger A. [Freezing preservation of heart cells and heart fragments]. Acta Biol Med Ger. (1972) 29:135–47.
91. Davogustto GE, Salazar RL, Vasquez HG, Karlstaedt A, Dillon WP, Guthrie PH, et al. Metabolic remodeling precedes mTORC1-mediated cardiac hypertrophy. J Mol Cell Cardiol. (2021) 158:115–27. doi: 10.1016/j.yjmcc.2021.05.016
92. Wiechert W. 13C metabolic flux analysis. Metab Eng. (2001) 3:195–206. doi: 10.1006/mben.2001.0187
94. Karlstaedt A, Zhang X, Vitrac H, Harmancey R, Vasquez H, Wang JH, et al. Oncometabolite d-2-hydroxyglutarate impairs alpha-ketoglutarate dehydrogenase and contractile function in rodent heart. Proc Natl Acad Sci USA. (2016) 113:10436-41. doi: 10.1073/pnas.1601650113
95. Henry CS, Broadbelt LJ, Hatzimanikatis V. Thermodynamics-based metabolic flux analysis. Biophys J. (2007) 92:1792–805. doi: 10.1529/biophysj.106.093138
96. Hoppe A, Hoffmann S, Holzhutter HG. Including metabolite concentrations into flux balance analysis: thermodynamic realizability as a constraint on flux distributions in metabolic networks. BMC Syst Biol. (2007) 1:23. doi: 10.1186/1752-0509-1-23
97. Cornish-Bowden A. Metabolic control analysis in theory and practice. Adv Mol Cell Biol. (1995) 11:21–64. doi: 10.1016/S1569-2558(08)60247-7
98. Antoniewicz MR, Kelleher JK, Stephanopoulos G. Elementary metabolite units (EMU): a novel framework for modeling isotopic distributions. Metab Eng. (2007) 9:68–86. doi: 10.1016/j.ymben.2006.09.001
99. Antoniewicz MR, Kelleher JK, Stephanopoulos G. Determination of confidence intervals of metabolic fluxes estimated from stable isotope measurements. Metab Eng. (2006) 8:324–37. doi: 10.1016/j.ymben.2006.01.004
100. Antoniewicz MR, Stephanopoulos G, Kelleher JK. Evaluation of regression models in metabolic physiology: predicting fluxes from isotopic data without knowledge of the pathway. Metabolomics. (2006) 2:41–52. doi: 10.1007/s11306-006-0018-2
102. Bingol K, Zhang F, Bruschweiler-Li L, Bruschweiler R. Quantitative analysis of metabolic mixtures by two-dimensional 13C constant-time TOCSY NMR spectroscopy. Anal Chem. (2013) 85:6414–20. doi: 10.1021/ac400913m
103. Taylor MJ, Lukowski JK, Anderton CR. Spatially resolved mass spectrometry at the single cell: recent innovations in proteomics and metabolomics. J Am Soc Mass Spectrom. (2021) 32:872–94. doi: 10.1021/jasms.0c00439
104. Hartmann FJ, Mrdjen D, Mccaffrey E, Glass DR, Greenwald NF, Bharadwaj A, et al. Single-cell metabolic profiling of human cytotoxic T cells. Nat Biotechnol. (2021) 39:186–97. doi: 10.1038/s41587-020-0651-8
105. Fendt SM, Buescher JM, Rudroff F, Picotti P, Zamboni N, Sauer U. Tradeoff between enzyme and metabolite efficiency maintains metabolic homeostasis upon perturbations in enzyme capacity. Mol Syst Biol. (2010) 6:356. doi: 10.1038/msb.2010.11
106. Zelezniak A, Sheridan S, Patil KR. Contribution of network connectivity in determining the relationship between gene expression and metabolite concentration changes. PLoS Comput Biol. (2014) 10:e1003572. doi: 10.1371/journal.pcbi.1003572
107. Zeleniak AE, Huang W, Fishel ML, Hill R. PTEN-dependent stabilization of MTSS1 inhibits metastatic phenotype in pancreatic ductal adenocarcinoma. Neoplasia. (2018) 20:12–24. doi: 10.1016/j.neo.2017.10.004
108. Comi TJ, Do TD, Rubakhin SS, Sweedler JV. Categorizing cells on the basis of their chemical profiles: progress in single-cell mass spectrometry. J Am Chem Soc. (2017) 139:3920–9. doi: 10.1021/jacs.6b12822
109. Wu D, Harrison DL, Szasz T, Yeh CF, Shentu TP, Meliton A, et al. Single-cell metabolic imaging reveals a SLC2A3-dependent glycolytic burst in motile endothelial cells. Nat Metab. (2021) 3:714–27. doi: 10.1038/s42255-021-00390-y
110. Ferraro GB, Ali A, Luengo A, Kodack DP, Deik A, Abbott KL, et al. Fatty acid synthesis is required for breast cancer brain metastasis. Nat Cancer. (2021) 2:414–28. doi: 10.1038/s43018-021-00283-9
111. Zhu H, Li Q, Liao T, Yin X, Chen Q, Wang Z, et al. Metabolomic profiling of single enlarged lysosomes. Nat Methods. (2021) 18:788–98. doi: 10.1038/s41592-021-01182-8
112. Kleparnik K. Recent advances in the combination of capillary electrophoresis with mass spectrometry: from element to single-cell analysis. Electrophoresis. (2013) 34:70–85. doi: 10.1002/elps.201200488
113. Marc PJ, Sims CE, Allbritton NL. Coaxial flow system for chemical cytometry. Anal Chem. (2007) 79:9054–9. doi: 10.1021/ac7017519
Keywords: metabolism, stable-isotope tracer, metabolic flux analysis, systems biology, cardiovascular disease
Citation: Karlstaedt A (2021) Stable Isotopes for Tracing Cardiac Metabolism in Diseases. Front. Cardiovasc. Med. 8:734364. doi: 10.3389/fcvm.2021.734364
Received: 01 July 2021; Accepted: 18 October 2021;
Published: 11 November 2021.
Edited by:
Kedryn K. Baskin, The Ohio State University, United StatesReviewed by:
Seitaro Nomura, The University of Tokyo, JapanCopyright © 2021 Karlstaedt. This is an open-access article distributed under the terms of the Creative Commons Attribution License (CC BY). The use, distribution or reproduction in other forums is permitted, provided the original author(s) and the copyright owner(s) are credited and that the original publication in this journal is cited, in accordance with accepted academic practice. No use, distribution or reproduction is permitted which does not comply with these terms.
*Correspondence: Anja Karlstaedt, YW5qYS5rYXJsc3RhZWR0QGNzbWMuZWR1
Disclaimer: All claims expressed in this article are solely those of the authors and do not necessarily represent those of their affiliated organizations, or those of the publisher, the editors and the reviewers. Any product that may be evaluated in this article or claim that may be made by its manufacturer is not guaranteed or endorsed by the publisher.
Research integrity at Frontiers
Learn more about the work of our research integrity team to safeguard the quality of each article we publish.