
94% of researchers rate our articles as excellent or good
Learn more about the work of our research integrity team to safeguard the quality of each article we publish.
Find out more
ORIGINAL RESEARCH article
Front. Cardiovasc. Med., 15 September 2020
Sec. Heart Failure and Transplantation
Volume 7 - 2020 | https://doi.org/10.3389/fcvm.2020.00163
This article is part of the Research TopicScience in Mechanical Circulatory Support View all 9 articles
Left ventricular assist device (LVAD) has been saving many lives in patients with severe left ventricular (LV) failure. Recently, a minimally invasive transvascular LVAD such as Impella enables us to support unstable hemodynamics in severely ill patients. Although LVAD support increases total LV cardiac output (COTLV) at the expense of decreases in the native LV cardiac output (CONLV), the underlying mechanism determining COTLV remains unestablished. This study aims to clarify the mechanism and develop a framework to predict COTLV under known LVAD flow (COLVAD). We previously developed a generalized framework of circulatory equilibrium that consists of the integrated CO curve and the VR surface as common functions of right atrial pressure (PRA) and left atrial pressure (PLA). The intersection between the integrated CO curve and the VR surface defines circulatory equilibrium. Incorporating LVAD into this framework indicated that LVAD increases afterload, which in turn decreases CONLV. The total LV cardiac output (COTLV) under LVAD support becomes COTLV = CONLV+EFe · COLVAD, where EFe is effective ejection fraction, i.e., Ees/(Ees+Ea). Ees and Ea represent LV end-systolic elastance (Ees) and effective arterial elastance (Ea), respectively. In other words, LVAD shifts the total LV cardiac output curve upward by EFe · COLVAD. In contrast, LVAD does not change the VR surface or the right ventricular CO curve. In six anesthetized dogs, we created LV failure by the coronary ligation of the left anterior descending artery and inserted LVAD by withdrawing blood from LV and pumping out to the femoral artery. We determined the parameters of the CO curve with a volume-change technique. We then changed the COLVAD stepwise from 0 to 70–100 ml/kg/min and predicted hemodynamics by using the proposed circulatory equilibrium. Predicted COTLV, PRA, and PLA for each step correlated well with those measured (SEE; 2.8 ml/kg/min 0.17 mmHg, and 0.65 mmHg, respectively, r2; 0.993, 0.993, and 0.965, respectively). The proposed framework quantitatively predicted the upward-shift of the total CO curve resulting from the synergistic effect of LV systolic function and LVAD support. The proposed framework can contribute to the safe management of patients with LVAD.
Heart failure is one of the most challenging cardiac pathophysiologies, and the survival rate remains unacceptably poor despite the guideline-recommended optimal medical therapy (1). Although heart transplantation strikingly improves the quality of life and prolongs survival in patients with end-stage heart failure, the number of donor's hearts is disproportionally small (2). Therefore, heart transplantation cannot serve as a standard therapeutic modality for every patient with end-stage heart failure. Left ventricular assist device (LVAD) has been saving many lives as a bridge to recovery, transplantation, and decision (3–5). Klotz et al. reported that, even in end-stage heart failure, LVAD could reverse ventricular remodeling. They argued that mechanical LV unloading improves neurohormonal/cytokine milieu and reverses LV remodeling (6).
The latest advance in medical technology has allowed us to develop minimally invasive transvascular LVAD such as Impella® (Abiomed Inc. Danvers, MA, USA). The fact that LVAD promotes recovery of myocardial function makes temporary LVAD implantation as a practical therapeutic option in the treatment of heart failure (7). In myocardial infarction, transvascular LVAD reduces infarct size and promotes LV recovery (8, 9). In fulminant myocarditis, transvascular LVAD helps to suppress inflammation and facilitate recovery (10). Considering those devices development, the appropriate LVAD use improves the outcome of heart failure patients in several stages.
Hemodynamic responses to the “off-pump” trial were critical in weaning LVAD and predicting long-term cardiac stability after weaning (11). Therefore, the prediction of the hemodynamic impact of LVAD support and explantation is a prerequisite in the safety management of hemodynamically compromised patients. We previously reported the impact of total LVAD support, i.e., no LV ejection through the aortic valve, on hemodynamics by using the framework of circulatory equilibrium in an animal model of acute heart failure (12). We could successfully predict total LVAD induced changes in hemodynamics. However, the recovery of LV function increased LV contractility and makes LVAD support partial, i.e., significant LV ejection through the aortic valve. How to predict the hemodynamics of partial LVAD support remains unknown.
This study aims to develop a framework to predict the impact of partial LVAD support on hemodynamics. To answer this complex question, we first analyzed the quantitative effect of partial LVAD support on the LV pressure-volume relationship by using the concept of the left ventricular-arterial coupling (13). We then incorporated the ventricular-arterial coupling into the framework of circulatory equilibrium and predicted hemodynamics. Finally, we compared the predicted hemodynamic variables with those measured in an animal model of heart failure.
In the 1950s, Guyton proposed a disruptive concept, the framework of circulatory equilibrium, because the CO curve alone could not determine cardiac output in the closed-loop circulation (14). They opened the circulatory loop and represented the venous returning (VR) curve and the CO curve as a function of right atrial pressure (PRA). They defined the circulatory equilibrium by the intersection between the CO curve and the VR curve. Although this framework explains numerous pathophysiological conditions such as volume overload, heart failure, and exercise, they failed to express unilateral heart failure and resultant volume redistribution between the systemic circulation and the pulmonary circulation. This inability of the Guyton's framework makes its application seriously limited.
To overcome the limitations of Guyton's circulatory equilibrium, we developed a generalized framework of circulatory equilibrium that consists of the integrated CO curve and the VR surface as common functions of PRA and left atrial pressure (PLA) (15). In this framework, the intersecting curve between the two surfaces, systemic and pulmonary CO surfaces defines the integrated CO curve. The integrated CO curve can separately represent the left and right ventricular pumping function. The VR surface has two slopes along PLA and PRA axes, which represent vascular properties. We experimentally validated the flatness of the VR surface and demonstrated that the changes in stressed blood volume shift the VR surface in parallel along the VR axis. The VR surface allows us to express the redistribution of stressed blood volume between the systemic circulation and the pulmonary circulation resulting from unilateral heart failure. The intersection between the integrated CO curve and the VR surface represents the generalized circulatory equilibrium and defines the operating points of CO, PRA, and PLA.
In the systemic circulation, the effect of downstream pressure, PRA, on COLV is negligible because PRA is much lower than systemic arterial pressure. Therefore, we described the COLV as the curve, not the surface.
As explained in Supplementary Material, a logarithmic function of PLA approximates the native CO curve without LVAD (CONLV) as
where SL and HL represent parameters of the left heart.
Figure 1 illustrates the impact of LVAD on stroke volume (SV) on the LV pressure-volume relationship. As shown in the dashed loop in Figure 1A, the intersection between the end-systolic pressure-volume relationship line and the effective arterial elastance (Ea) line determines SV for a given preload. LVAD flow (COLVAD) increases arterial pressure (AP) independent of LV ejection, thus shifts the Ea line upward by R · COLVAD, where R is systemic resistance. This upward shift of the Ea line indicates the increases LV afterload, and, in turn, decreases SV (Figure 1A, solid loop). The reduction in SV (ΔSV) is geometrically derived as
Rearranging Equation 2 gives
where T is the cardiac cycle length. We define the effective ejection fraction (EFe) as the ratio of Ees to Ees+Ea. Dividing ΔSV by T yields the decrease in COLV (ΔCOLV) as
Thus, the CONLV curve shifts downward under LVAD and CO curve through aortic valve under LVAD (COLV) became following equation (Figure 1B);
By adding COLVAD to Equation 5, the total left ventricular CO (COTLV) curve becomes as following (Figure 1B);
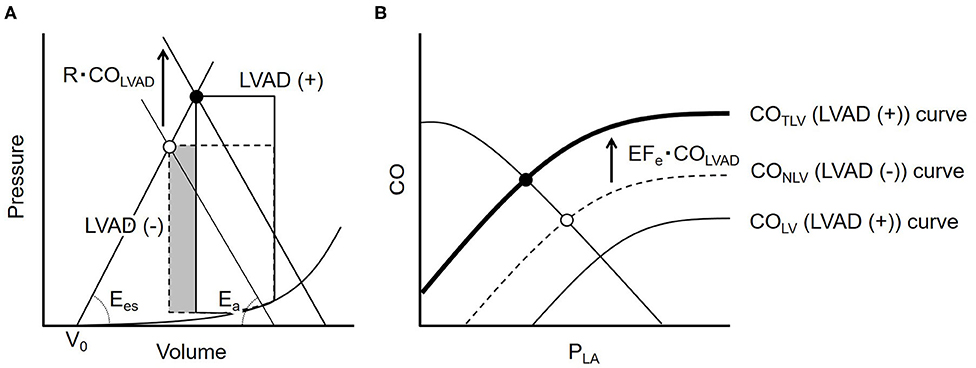
Figure 1. (A) The ventricular-arterial coupling in the pressure-volume trajectory. The dashed line represents the PV loop at baseline. LVAD flow (COLVAD) shifts the effective arterial elastance (Ea) line upward by R · COLVAD and moves the end-systolic point upward from the open circle to the solid one (solid loop). The volume of the shaded part indicates the LVAD induced decrease in stroke volume. (B) The dashed curve illustrates the native LV cardiac output (CONLV) curve without LVAD. COLVAD decreases the CONLV curve downward (thin solid line = COLV curve), but increases the total CO (COTLV) curve, the sum of the COLV and COLVAD, indicating that LVAD shifts the CONLV curve upward by EFe · COLVAD (bold solid line). LVAD, left ventricular assist device; COLVAD, LVAD flow; Ees, end-systolic elastance; Ea, effective arterial elastance; R, systemic vascular resistance; V0, volume axis intercept of LV end-systolic pressure-volume relationship; CONLV, native LV cardiac output through the aortic valve; COLV, LV cardiac output through the aortic valve under LVAD; COTLV, total LV cardiac output; PLA, left atrial pressure; PRA, right atrial pressure; EFe, effective ejection fraction.
In the pulmonary circulation, LVAD does not directly impact the CORV surface. However, the effect of downstream pressure, PLA, is not negligible compared to pulmonary arterial pressure. Furthermore, LVAD significantly perturbs PLA. Therefore, we described the CORV as the surface, not the curve, as functions of PLA and PRA.
where SR, HR, and α are parameters of the right heart (see Supplementary Material in detail).
Since LVAD simply creates the LV-to-aorta bypass, LVAD does not change either the vascular properties or the stressed blood volume. Therefore, LVAD does not shift the VR surface or change its slopes. For the slopes of the VR surface, we used the values reported by Uemura et al. (15). Substituting those parameters into the equation of the VR surface yields
where COVR is the amount of venous return, and VRmax is the maximum venous return.
In the following experiments, we simultaneously solved Equations 6–8 and COTLV=CORV=COVR, derived the operating points of CO, PRA, and PLA (Figure 2), and compared them with those measured.
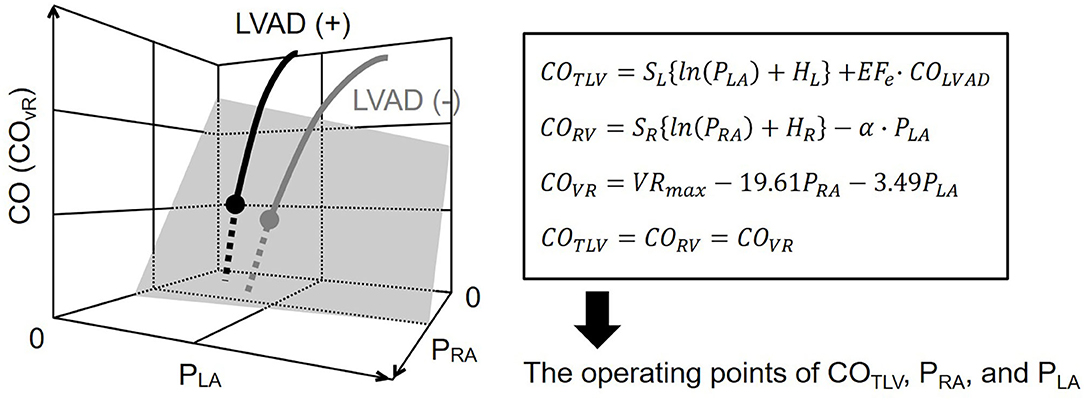
Figure 2. Diagram of circulatory equilibrium in the generalized Guyton's model. The intersection between the integrated CO curve (thick gray curve) and the venous return surface (shaded surface) represents cardiac output (CO), right atrial pressure (PRA), and left atrial pressure (PLA) at the circulatory equilibrium. The left ventricular assist device (LVAD) is incorporated into the framework of the generalized circulatory equilibrium. The LVAD shifts the native integrated CO curve upward. As a result, the intersection between the integrated CO curve and the VR surface moves upward (solid black circle). We numerically derived the equilibrium point on LVAD. SL, HL, are parameters of the left heart. SR, HR, and α are parameters of the right heart. VRmax is the maximum venous return. See detail in the Theoretical Consideration. CO, cardiac output; COTLV, total cardiac output; CORV, RV cardiac output; COVR, amount of venous return; PRA, right atrial pressure; PLA, left atrial pressure; LVAD, left ventricular assist device, EFe, effective ejection fraction.
We used adult mongrel dogs of either gender weighing 16.9–22 kg (n = 11). Animal care was performed in strict accordance with the Guide for the Care and Use of Laboratory Animals by the US National Institutes of Health, and experiments were approved by the Committee on Ethics of Animal Experiment, Kyushu University Graduate School of Medical Sciences. All dogs were initially anesthetized with pentobarbital sodium (25 mg/kg) and vecuronium bromide (0.2 mg/kg). We then performed endotracheal intubation and started mechanical ventilation. We maintained an appropriate anesthesia level during the experiment by continuous infusion of isoflurane (1–2%) and pentobarbital sodium through a 5F catheter introduced into the right femoral vein during the experiment. We isolated the bilateral carotid sinuses and kept intra-sinus pressure constant at 100 mmHg to abolish the arterial baroreflex (16). We exposed the bilateral vagal trunks and cut them in the neck level to eliminate the vagally mediated buffering effects. Systemic arterial pressure (AP) was measured by a catheter-tipped micromanometer (model PC-751, Millar Instruments, Houston, TX) via the right common carotid artery. After a median sternotomy, fluid-filled catheters were placed in the left and right atria and connected to pressure transducers (model DX-360, Nihonkohden, Tokyo) to measure PLA and PRA, respectively. We put an ultrasonic flowmeter (model PSB, Transonic, Ithaca, NY) around the ascending aorta to measure COLV. We ligated the major branches and the first diagonal branch of the left anterior descending coronary artery (LAD), and added left circumflex coronary artery (LCx) ligation as needed to induce substantial worsening of LV function. After the condition was well-stabilized, we used a centrifugal pump (CBBPX-80, Medtronic, Minneapolis, MN) as LVAD (12). A systemic perfusion cannula was inserted in the left femoral artery. A draining cannula was placed in the left ventricle through the apex. We measured COLVAD by an in-line ultrasonic flow probe (model XN, Transonic, Ithaca, NY). We also inserted 5F catheter to left femoral vein to administer physiological saline as needed to keep mean AP above 70 mmHg for conducting 6–7 h experiment.
Before LVAD support, we infused 250 ml of 10% dextran and waited to reach a steady-state of hemodynamics. We then withdrew blood stepwise at 2.5 ml/kg in each step (up to 4 or 5 steps) while recording PLA, PRA, and CO. We then estimated two-parameters (SL and HL) in the COLV-PLA relation and three-parameters (SR, HR, and α) in the CORV-PRA-PLA relation by incorporating obtained hemodynamics into Equations 1 and 7 with the least-squares method.
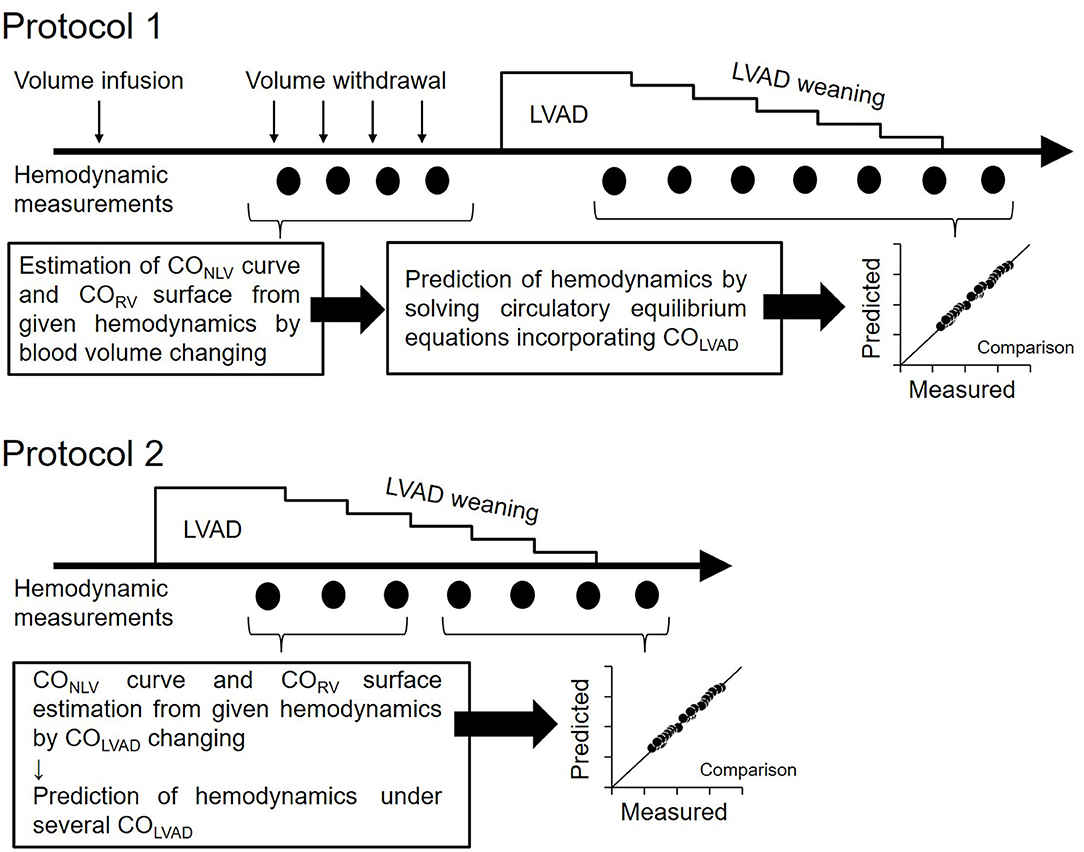
Figure 3. Protocol of this study. Protocol 1: Hemodynamic prediction by the blood volume changing determined CO curve. Protocol 2: Hemodynamic prediction by the COLVAD changing determined CO curve; LVAD, left ventricular assist device; COLVAD, LVAD flow; CONLV, native LV cardiac output through the aortic valve; COLV, LV cardiac output under LVAD; CORV, RV cardiac output.
After the CO curve estimation, we decreased COLVAD stepwise at 5 ml/min/kg in each step from ~70–110 ml/min/kg to 0 ml/min/kg and measured the PLA, PRA, and COLV. Adding the COLVAD to the measured COLV yielded the total LV cardiac output, COTLV, which equals CORV, and venous return, COVR. We then calculated the EFe by substituting both the parameters of the COLV curve (SL and HL) determined above and the equilibrated COLV and PLA at the maximal COLVAD into Equation 4. We similarly obtained VRmax by substituting the COVR, PRA, and PLA at the maximal COLVAD into Equation 8. Assuming that EFe and VRmax are constant irrespective of COLVAD, we predicted COTLV, PRA, and PLA under various LVAD supports by simultaneously solving Equations 6–8. We compared the predicted hemodynamic values with those measured.
The estimation of COLV curve and CORV surface by changing blood volume is impractical if not impossible in clinical settings. Thus, we employed the simplified estimation of hemodynamics on LVAD for another five dogs. We determined the parameters of the COLV curve and CORV surface under LVAD from three equilibrium points induced by the changes in COLVAD. In other words, three sets of measured COLV, PLA, and COLVAD uniquely determined SL, HL, and EFe in Equation 5. We similarly estimated the SR, HR, and α by three sets of measured CORV, PRA, and PLA in Equation 7. After confirming that VRmax calculated in Equation 8 did not change despite the changes in COLVAD, we predicted COTLV, PLA, and PRA under various LVAD supports from Equations 6–8 and COTLV =CORV =COVR, and compared them with those measured. In this prediction, we excluded the data set that had been used to estimate the COLV curve and the CORV surface to avoid logical circularity.
All analog signals were digitized at 200 Hz using a 16-bit analog-to-digital converter (PowerLab 16/35, AD Instruments, Dunedin, New Zealand) with a dedicated laboratory computer system. Each data was averaged over 9 s and used for analysis after hemodynamic stability. Differences between groups were considered significant at P < 0.05 in paired t-test (Ekuseru-Toukei 2013; Social Survey Research Information Co. Ltd, Tokyo, Japan). We calculated the coefficient of determination (r2) for the goodness of fit and the standard error of estimate (SEE) for predictive accuracy.
Table 1 showed the hemodynamics at baseline and after myocardial infarction (MI). The creation of MI significantly increased PLA compared to baseline (P = 0.0019), indicating MI induced LV failure. In contrast, MI did not noticeably affect mean AP (MAP), heart rate (HR), CO, or PRA.
Figure 4 shows the representative cardiac output data where we fitted logarithmic functions to the measured values obtaining by changing blood volume. As shown in Figure 4A, increases in PLA increased CONLV. A two-parameters logarithmic function approximates the CONLV curve (Equation 1) reasonably well. Figure 4B illustrates CORV in response to changes in PRA and PLA. Increases in PRA increased CORV, while increases in PLA decreased CORV. A surface generated by the three-parameters logarithmic function of PRA and PLA (CORV surface, Equation 7) approximated the changes in CORV reasonably well.
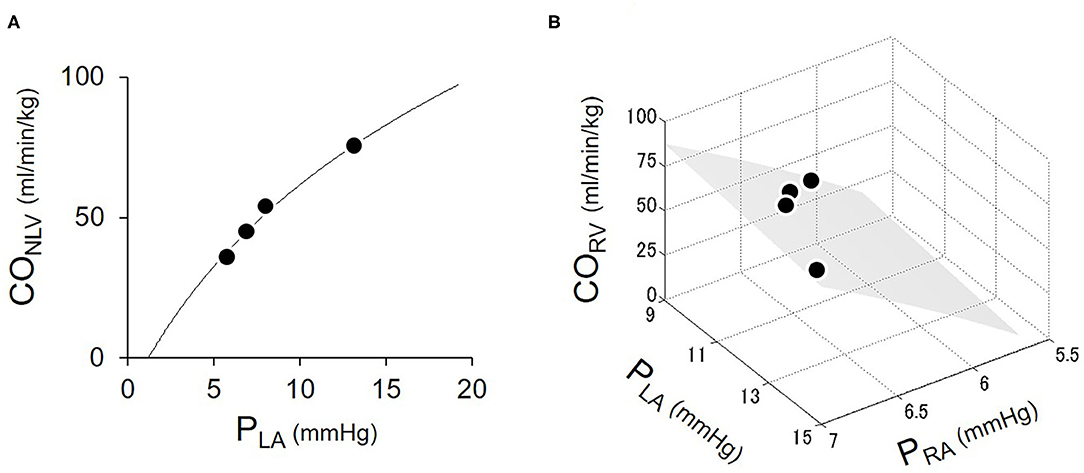
Figure 4. Estimation of LV cardiac output (CONLV) curve (A) and RV cardiac output (CORV) surface (B). Open circles were the measured values obtaining by changing blood volume. The solid curve represented the fitted logarithmic curve. The shaded surface represents the fitted CORV surface. CONLV, native LV cardiac output through the aortic valve; CORV, RV cardiac output; PRA, right atrial pressure; PLA, left atrial pressure.
Table 2 summarized the parameters of CONLV curves and CORV surfaces in all six dogs. The fact that the coefficient of determination was quite high (r2 = 0.94–0.99) in each dog suggested that the 2-parameter function and 3-parameter function accurately represent the CONLV curve and CORV surface, respectively.
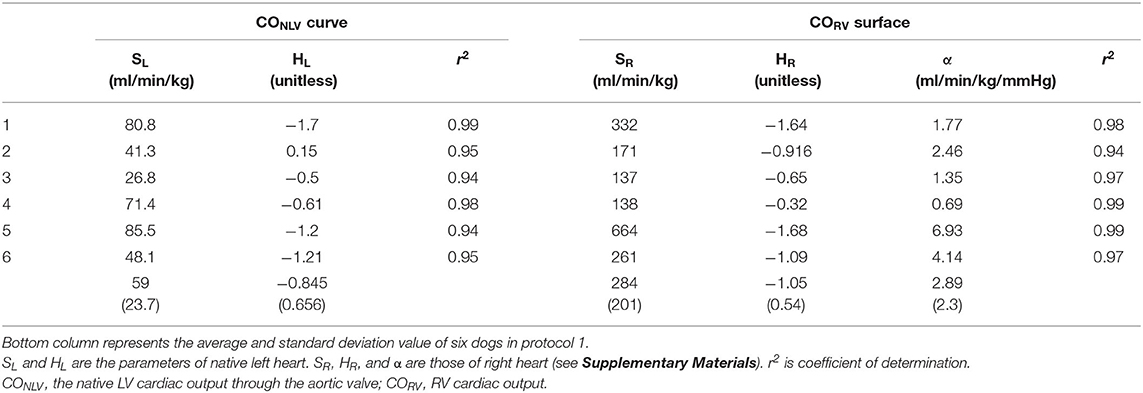
Table 2. The estimated parameters of native left-heart cardiac output (CONLV) curve and right-heart cardiac output (CORV) surface by changing blood volume.
Shown in Figure 5 is the time series of hemodynamics in response to the stepwise decrease in COLVAD. Decreases in COLVAD increased COLV and PLA, while decreased the COTLV and AP. Despite changes in AP, HR remained unchanged because of the abolishment of the baroreflex. Table 3 shows the estimated EFe and VRmax for each dog. As we expected, the creation of MI markedly lowered EFe. VRmax varied among dogs, indicating the variability of stressed blood volume. Figure 6 demonstrates the relationship between predicted and measured COTLV, PRA, and PLA in all dogs. Regression analysis revealed that the predicted COTLV (y = 0.983x + 2.845, r2 = 0.993, SEE = 2.8 ml/min/kg), PRA (y = 1.00x + 0.0824, r2 = 0.993, SEE = 0.17 mmHg), and PLA (y = 1.01x−0.0728, r2 = 0.965, SEE = 0.65 mmHg) matched well with those measured.
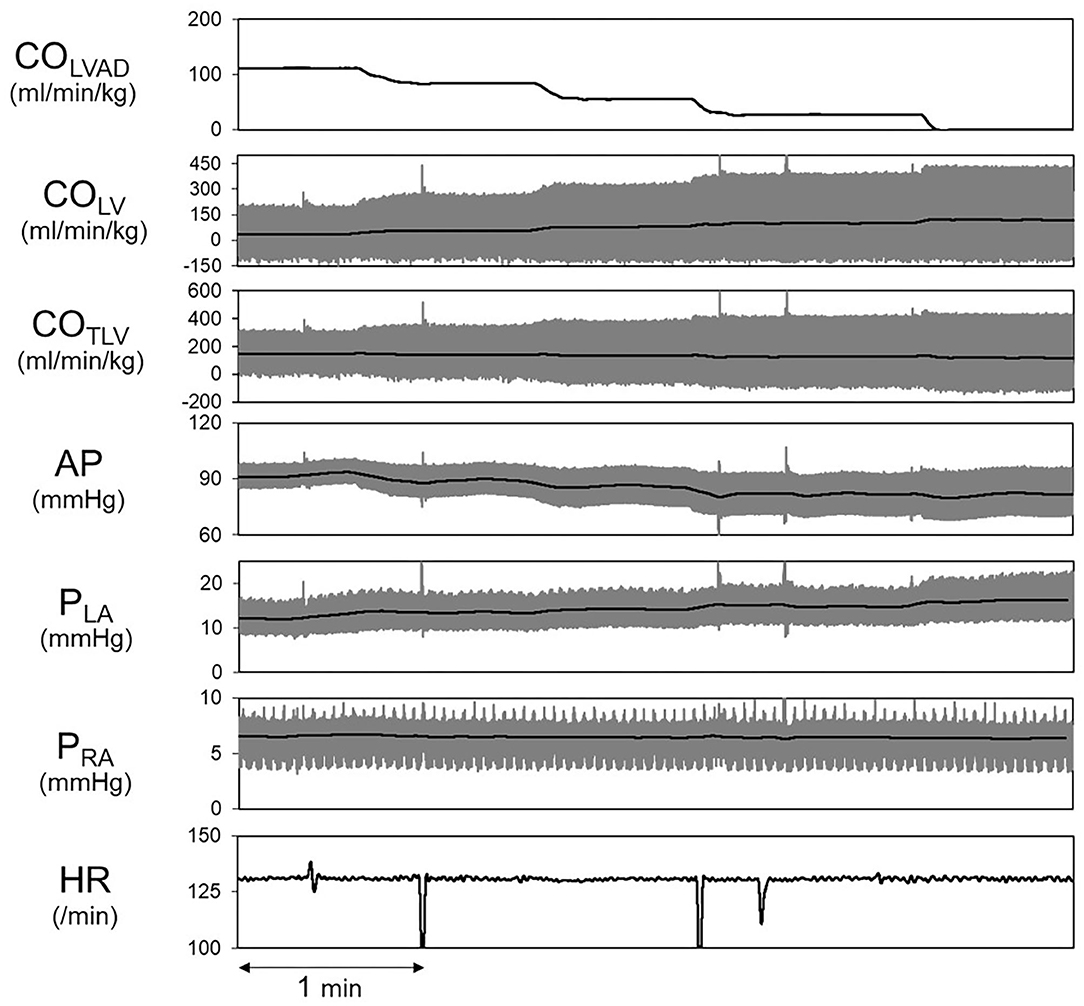
Figure 5. Hemodynamic changes induced by decreasing COLVAD in a representative animal. The thick black lines indicate the averages, and the thin gray lines indicate instantaneous data. LVAD, left ventricular assist device; COLVAD, LVAD flow; COLV, LV cardiac output under LVAD; COTLV, total cardiac output; AP, arterial pressure; PLA, left atrial pressure; PRA, right atrial pressure; HR, heart rate.
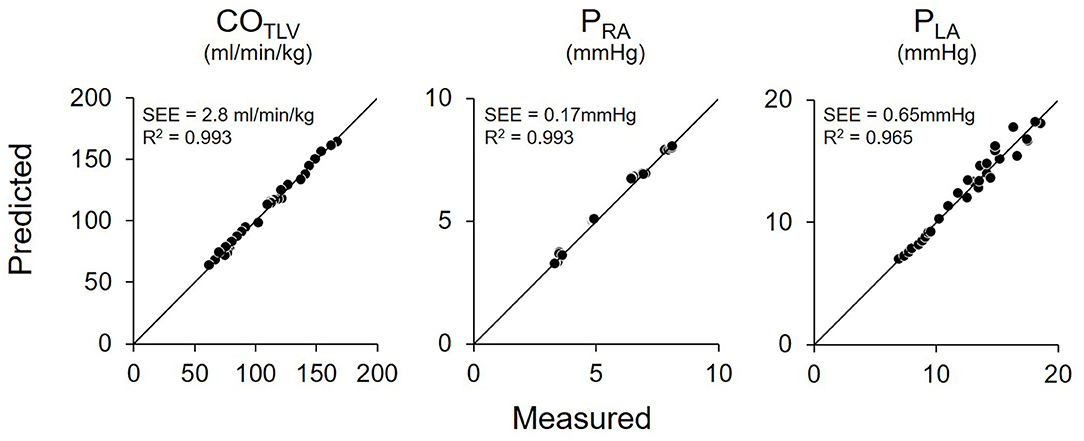
Figure 6. Relationship between predicted and measured in total cardiac output (COTLV), right atrial pressure (PRA), and left atrial pressure (PLA) in pooled data in Protocol 1. The predicted values matched well with those measured. The thin black lines denote the lines of identity. SEE, standard error of estimate; r2, coefficient of determination.
Figure 7 shows the representative time series of hemodynamics under several COLVAD levels. By using three points hemodynamic data in each dog (Table 4), we estimated the parameters of the CONLV curve, the CORV surface, and the VR surface under LVAD support as shown in Table 5. We then predicted COTLV, PRA, and PLA from the data set that had not been used to estimate the CONLV curve, the CORV surface, or the VR surface. The predicted COTLV, PRA, and PLA correlated well with those measured (Figure 8). Regression analysis of COTLV (y = 0.984x + 3.40, r2 = 0.998, SEE = 2.57 ml/min/kg), PRA (y = 1.04x-0.125, r2 = 0.991, SEE = 0.20 mmHg) and PLA (y = 0.925x + 0.721, r2 = 0.984, SEE = 0.634 mmHg) demonstrated the good agreement between the predicted and measured.
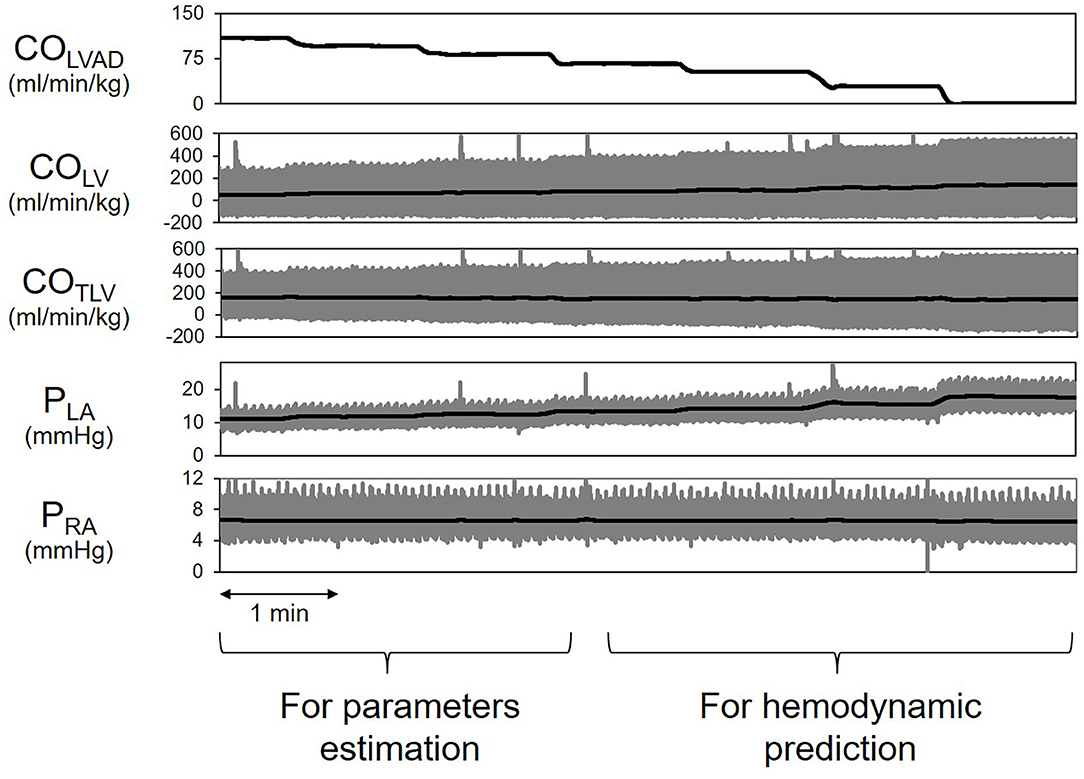
Figure 7. Simplified prediction of circulatory equilibrium in an animal. The measurement of three equilibrium points for given left ventricular assist device flow (COLVAD) enabled us to estimate the native LV cardiac output (CONLV) curve, the RV cardiac output (CORV) surface, and the VR surface. We then numerically predicted the circulatory equilibrium points for the various COLVAD values. LVAD, left ventricular assist device; COLVAD, LVAD flow; COLV, LV cardiac output through the aortic valve under LVAD; COTLV, total CO; AP, arterial pressure; PLA, left atrial pressure; PRA, right atrial pressure.
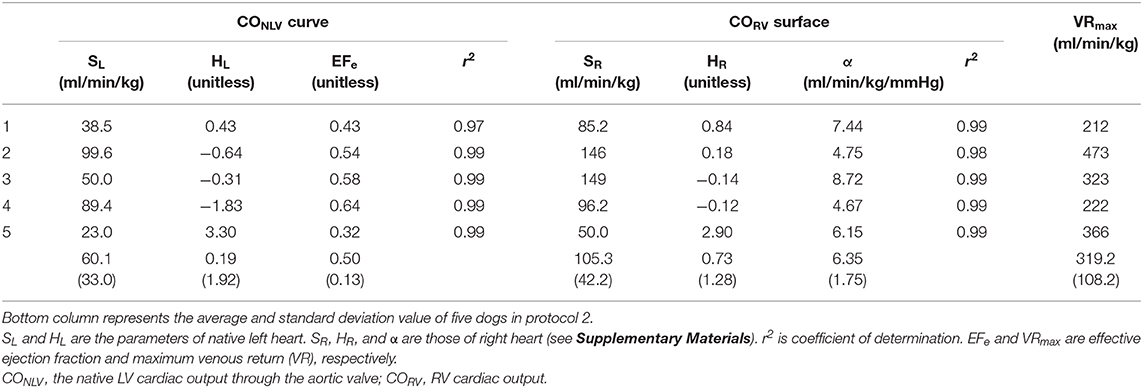
Table 5. The estimated parameters of native left-heart cardiac output (CONLV) curve, right-heart cardiac output (CORV) surface and venous return (VR) surface by changing LVAD flow in protocol 2.
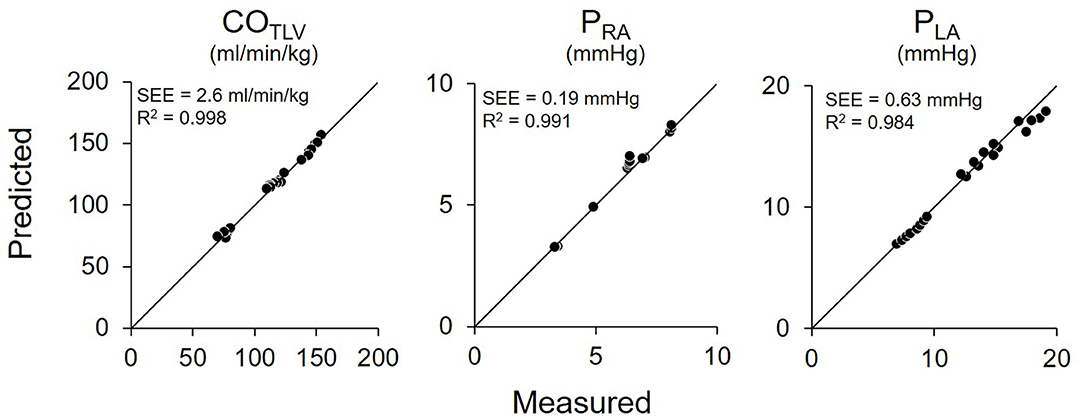
Figure 8. Pooled data of predicted and measured total cardiac output (COTLV), right atrial pressure (PRA), and left atrial pressure (PLA) in Protocol 2. Predicted COTLV, PRA, and PLA values correlated well with those measured. The thin black lines are the lines of identity. SEE, standard error of estimate; r2, coefficient of determination.
In this study, we analyzed the LVAD interaction with the native LV cardiac output in determining total LV cardiac output. We then developed a framework to predict the impact of LVAD on hemodynamics. In Protocol 1, we showed that we could predict hemodynamics on LVAD by determining the CONLV curve and the CORV surface with a volume-changing technique. Furthermore, in Protocol 2, the hemodynamic assessment during the small perturbations of COLVAD enabled us to predict the COTLV, PLA, and PRA when LVAD was weaned.
The most critical result of this study is that the framework of generalized circulatory equilibrium can quantitatively predict the hemodynamic impact of LVAD. We previously reported the impact of total LVAD support on the framework (12). Considering various situations under LVAD, especially LVAD weaning after cardiac recovery, we need to expand this framework to the partial LVAD support. As can be seen in Equation 6 and Figure 1B, the LVAD shifts the COTLV curve upward by EFe · COLVAD, indicating the poorer LV function, the poorer increases in COTLV. The depressed LV is more susceptible to the LVAD-induced increases in LV afterload; that is, LVAD decreases the SV more in low LV contractility than in high LV contractility (Equation 3). In addition, the results of a computational study by using a multi-element cardiovascular model were in line with our results (17). Our framework, in which we incorporated LVAD in the generalized circulatory equilibrium and ventricular-arterial coupling, can algebraically define the cardiovascular system and its equilibrium. This makes the impact of LVAD on COTLV physiologically interpretable such as the reduction of CONLV equals (1-EFe) · COLVAD. The multi-element cardiovascular model cannot easily attribute a particular observation to a specific element of the system. Despite small increases in COTLV in our study, we found the significant decreases in PLA from 19 to 7 mmHg (Figure 6). In the framework of circulatory equilibrium, LV failure flattens the slope of the COTLV curve (18). Thereby, given that LVAD does not change the VR surface, the small upward-shift of the flattened COTLV curve results in more substantial decreases in PLA compared with the steeper COTLV curve. Thus, the framework of generalized circulatory equilibrium is robust in understanding and predicting hemodynamics on LVAD.
In our framework, we need to use EFe to incorporate the LVAD effects into circulatory equilibrium. We defined EFe as the ratio of Ees to (Ees+Ea) (Equation 3). This is equivalent to say that EFe equals SV divided by end-diastolic volume in excess of V0, where V0 is the volume axis intercept of the end-systolic pressure-volume relationship (19). Since Ees characterizes the ventricular chamber property, and Ea characterizes the arterial property, COLVAD cannot change these properties. In this sense, we need to carefully interpret standard ejection fraction (EF), calculated by echocardiogram, under LVAD support. Because EF is the ratio of SV to end-diastolic volume (Ved), EF could markedly change with LVAD support. Furthermore, regional ischemia significantly increases the V0 (20), which makes the difference between EF and EFe even more extensive in our acute MI preparation. For these reasons, we used EFe, not EF, for prediction in the present study.
We previously reported the impact of extracorporeal membrane oxygenation (ECMO) on circulatory equilibrium and showed that ECMO also suppresses the CONLV curve by (1-EFe) · FECMO, where FECMO indicates the ECMO flow (21). In terms of the shift in Ea line, LAVD and ECMO are the same impacts in increasing afterload as long as the support flow is the same. Since LVAD can shift the COTLV curve upward by adding the LVAD flow on a decreased COLV curve, LVAD decreases PLA. ECMO increases total systemic flow, while ECMO increases LV afterload, decreases the native CO curve (=total CO curve), and results in increases of PLA.
As we discussed above, the LVAD shifts the COTLV curve upward by EFe · COLVAD, indicating the poorer LV function, the poorer increases in COTLV. This relationship may become important for the management of transvascular LVAD. Impella 2.5 or sometimes CP cannot necessarily generate sufficient flow to establish total support where LV is no longer ejecting (22). These transvascular LVADs have often been used for cardiogenic shock (23). Since the lower EFe reduces the LVAD increase of COTLV, the hemodynamic benefit of transvascular LVADs is limited in patients with severe LV dysfunction.
The present study suggested that, with small changes in COLVAD, we could identify the native LV cardiac output curve (CONLV curve), EFe in LV, CORV surface, and VR surface as shown in Table 5. The values of parameters were acceptable, while these were different between protocols 1 and 2 because of the differences in dogs, the way of volume changing and parameters estimation. Thus, we need to interpret each parameter carefully. We have validated the accuracy of hemodynamic prediction (CO, PRA, and PLA), while we did not compare the parameters calculated by our proposed equation to those of direct measurements. Further investigations might be needed to evaluate the utility of this method in terms of the estimation of cardio-vascular properties. The proposed framework allows us to predict the hemodynamics even after LVAD weaning. Since the hemodynamic assessment during “off-pump” is critical for patients undergoing LVAD removal (11), the proposed framework would be useful to predict the hemodynamic changes after LVAD removal without switching off LVAD. The present framework does not only elude the risk of thrombosis associated with “off-pump” (24) but also distinguish the patients who might deteriorate to heart failure after LVAD weaning in advance. Further clinical investigations might be needed to evaluate the utility of this hemodynamic prediction method.
There are several limitations in our study. First, we conducted experiments using anesthetized and open-chest dogs. Furthermore, we isolated the bilateral carotid sinuses and cut the vagal trunks. Since both the baroreflex and other reflexes through the vagal nerves alter the vascular as well as cardiac properties (16), we eliminated those reflexes to clarify the isolated impacts of LVAD on hemodynamics. Second, there was some variability of the maximal COLVAD among dogs in our study. It may well be attributed to the fact that we conducted the experiment where LV remained ejecting under LVAD support. It means that the degree of MI affected how much we could increase COLVAD. LV would quickly become the non-ejecting state as we increase COLVAD if MI severely impairs LV contractility, indicating that the variability of maximal COLVAD under the LV ejecting condition depends on MI size. Third, we did not measure either the pressure-volume loop or echocardiogram. Although the EFe we used in the equation is different from standard EF calculated by echocardiogram as we addressed in the discussion, the standard EF as well as the direct measured EFe by pressure-volume loop in the same dog may help the interpretation of EFe obtained from the equation. Further detailed experiment might be needed to clarify the accuracy of our method in estimating EFe. Fourth, our proposed framework is a static mathematical model of circulation. Thus, we did not consider dynamic hemodynamic change during the cardiac cycle in LV under LVAD support. To improve the estimation accuracy of hemodynamics, we need to adopt the fluid dynamics and dynamic change in cardio-vascular properties into our framework. Lastly, we utilized the previously reported values as the slopes of the VR surface for simplicity (15). Needless to say, the slopes of the VR surface in humans have yet to be investigated. Therefore, all of them might affect the results, especially when we predict the effect of LVAD on hemodynamics in awake and closed-chest humans with intact reflexes.
The proposed framework is capable of quantitatively predicting the hemodynamic impact of partial LVAD support. Circulatory equilibrium is generalizable and essential for understanding the cardiovascular system, including LVAD. It would provide the physiological insight into hemodynamics on LVAD and contribute to the safe management of patients with LVAD.
The datasets generated for this study are available on request to the corresponding author.
The animal study was reviewed and approved by the Committee on Ethics of Animal Experiment, Kyushu University Graduate School of Medical Sciences.
TK, KSa, TN, and KSu conceived of the presented idea and designed the study. TK and KSa performed the data collection. TK, KSa, and TN performed the analysis and took the lead in writing the manuscript. TK, KSa, and KSu edited and revised manuscript. All authors discussed the results and contributed to the final manuscript. All authors approved the final version of the manuscript and agree to be accountable for the study.
This work was supported by Grant-in-Aid for Young Scientists (B) (18K15893 and 19K20690) from the Japan Society for the Promotion of Science, Medical-Engineering Collaboration project from Japan Agency for Medical Research and Development (20he1302033j0002), the Japan Foundation for Applied Enzymology (VBIC: Vascular Biology of Innovation), Intramural Research Fund for Cardiovascular Diseases of National Cerebral and Cardiovascular Center (31-6-4 and 20-6-1), and the research grant from Omron Healthcare Co.
KSa received research funding from Omron Healthcare Co., Abiomed Japan K.K., and Zeon Medical Inc., and honoraria from Abiomed Japan K.K. KSu received research funding from Omron Healthcare Co. and honoraria from Abiomed Japan K.K.
The remaining authors declare that the research was conducted in the absence of any commercial or financial relationships that could be construed as a potential conflict of interest.
The handling editor declared a past co-authorship with one of the authors KSu.
The authors thank Mr. Takuya Akashi for technical support.
The Supplementary Material for this article can be found online at: https://www.frontiersin.org/articles/10.3389/fcvm.2020.00163/full#supplementary-material
2. Christie JD, Edwards LB, Kucheryavaya AY, Benden C, Dobbels F, Kirk R, et al. The registry of the international society for heart and lung transplantation: twenty-eighth adult lung and heart-lung transplant report-2011. J Heart Lung Transplant. (2011) 30:1104–22. doi: 10.1016/j.healun.2011.08.004
3. Birks EJ, George RS, Firouzi A, Wright G, Bahrami T, Yacoub MH, et al. Long-term outcomes of patients bridged to recovery versus patients bridged to transplantation. J Thorac Cardiovasc Surg. (2012) 144:190–6. doi: 10.1016/j.jtcvs.2012.03.021
4. McMurray JJ, Adamopoulos S, Anker SD, Auricchio A, Böhm M, Dickstein K, et al. ESC guidelines for the diagnosis and treatment of acute and chronic heart failure 2012: the task force for the diagnosis and treatment of acute and chronic heart failure 2012 of the european society of cardiology. Developed in collaboration with the heart failure association (HFA) of the ESC. Eur Heart J. (2012) 33:1787–847. doi: 10.1093/eurjhf/hft016
5. Miyagawa S, Toda K, Nakamura T, Yoshikawa Y, Fukushima S, Saito S, et al. Building a bridge to recovery: the pathophysiology of LVAD-induced reverse modeling in heart failure. Surg Today. (2016) 46:149–54. doi: 10.1007/s00595-015-1149-8
6. Klotz S, Jan Danser AH, Burkhoff D. Impact of left ventricular assist device (LVAD) support on the cardiac reverse remodeling process. Prog Biophys Mol Biol. (2008) 97:479–96. doi: 10.1016/j.pbiomolbio.2008.02.002
7. Birks EJ, George RS, Hedger M, Bahrami T, Wilton P, Bowles CT, et al. Reversal of severe heart failure with a continuous-flow left ventricular assist device and pharmacological therapy: a prospective study. Circulation. (2011) 123:381–90. doi: 10.1161/CIRCULATIONAHA.109.933960
8. Meyns B, Stolinski J, Leunens V, Verbeken E, Flameng W. Left ventricular support by catheter-mounted axial flow pump reduces infarct size. J Am Coll Cardiol. (2003) 41:1087–95. doi: 10.1016/S0735-1097(03)00084-6
9. Saku K, Kakino T, Arimura T, Sunagawa G, Nishikawa T, Sakamoto T, et al. Left ventricular mechanical unloading by total support of impella in myocardial infarction reduces infarct size, preserves left ventricular function, and prevents subsequent heart failure in dogs. Circ Heart Fail. (2018) 11:e004397. doi: 10.1161/CIRCHEARTFAILURE.117.004397
10. Spillmann F, Van Linthout S, Schmidt G, Klein O, Hamdani N, Mairinger T, et al. Mode-of-action of the PROPELLA concept in fulminant myocarditis. Eur Heart J. (2019) 40:2164–9. doi: 10.1093/eurheartj/ehz124
11. Dandel M, Weng Y, Siniawski H, Potapov E, Lehmkuhl HB, Hetzer R. Long-term results in patients with idiopathic dilated cardiomyopathy after weaning from left ventricular assist devices. Circulation. (2005) 112:I37–45. doi: 10.1055/s-2005-861953
12. Kakino T, Saku K, Sakamoto T, Sakamoto K, Akashi T, Ikeda M, et al. Prediction of hemodynamics under left ventricular assist device. Am J Physiol Heart Circ Physiol. (2017) 312:H80–8. doi: 10.1152/ajpheart.00617.2016
13. Sunagawa K, Sagawa K, Maughan WL. Ventricular interaction with the loading system. Ann Biomed Eng. (1984) 12:163–89. doi: 10.1007/BF02584229
14. Guyton AC. Determination of cardiac output by equating venous return curves with cardiac response curves. Physiol Rev. (1955) 35:123–9. doi: 10.1152/physrev.1955.35.1.123
15. Uemura K, Sugimachi M, Kawada T, Kamiya A, Jin Y, Kashihara K, et al. A novel framework of circulatory equilibrium. Am J Physiol. (2004) 286:H2376–85. doi: 10.1152/ajpheart.00654.2003
16. Sakamoto T, Kakino T, Sakamoto K, Tobushi T, Tanaka A, Saku K, et al. Changes in vascular properties, not ventricular properties, predominantly contribute to baroreflex regulation of arterial pressure. Am J Physiol Heart Circ Physiol. (2015) 308:H49–58. doi: 10.1152/ajpheart.00552.2014
17. Saku K, Kakino T, Arimura T, Sakamoto T, Nishikawa T, Sakamoto K, et al. Total mechanical unloading minimizes metabolic demand of left ventricle and dramatically reduces infarct size in myocardial infarction. PLoS ONE. (2016) 11:e0152911. doi: 10.1371/journal.pone.0152911
18. Uemura K, Kawada T, Kamiya A, Aiba T, Hidaka I, Sunagawa K, et al. Prediction of circulatory equilibrium in response to changes in stressed blood volume. Am J Physiol. (2005) 289:H301–7. doi: 10.1152/ajpheart.01237.2004
19. Sagawa K, Maughan WL, Suga H, Sunagawa K. Cardiac Contraction and Pressure-Volume Relationship. Oxford: Oxford University Press (1988). 232–98p.
20. Sunagawa K, Maughan WL, Sagawa K. Effect of regional ischemia on the left ventricular end-systolic pressure-volume relationship of isolated canine hearts. Circ Res. (1983) 52:170–8. doi: 10.1161/01.RES.52.2.170
21. Sakamoto K, Saku K, Kishi T, Kakino T, Tanaka A, Sakamoto T, et al. Prediction of the impact of venoarterial extracorporeal membrane oxygenation on hemodynamics. Am J Physiol Heart Circ Physiol. (2015) 308:H921–30. doi: 10.1152/ajpheart.00603.2014
22. Glazier JJ, Kaki A. The impella device: historical background, clinical applications and future directions. Int J Angiol. (2019) 28:118–23. doi: 10.1055/s-0038-1676369
23. O'Neill BP, Cohen MG, Basir MB, Schreiber T, Kapur NK, Dixon S, et al. Outcomes among patients transferred for revascularization with impella for acute myocardial infarction with cardiogenic shock from the cVAD registry. Am J Cardiol. (2019) 123:1214–9. doi: 10.1016/j.amjcard.2019.01.029
Keywords: left ventricular assist device (LVAD), hemodymamics, circulatory equilibrium, prediction, pressure volume loop, impella
Citation: Kakino T, Saku K, Nishikawa T and Sunagawa K (2020) The Partial Support of the Left Ventricular Assist Device Shifts the Systemic Cardiac Output Curve Upward in Proportion to the Effective Left Ventricular Ejection Fraction in Pressure-Volume Loop. Front. Cardiovasc. Med. 7:163. doi: 10.3389/fcvm.2020.00163
Received: 13 May 2020; Accepted: 10 August 2020;
Published: 15 September 2020.
Edited by:
Kiyotake Ishikawa, Icahn School of Medicine at Mount Sinai, United StatesReviewed by:
Taro Kariya, Icahn School of Medicine at Mount Sinai, United StatesCopyright © 2020 Kakino, Saku, Nishikawa and Sunagawa. This is an open-access article distributed under the terms of the Creative Commons Attribution License (CC BY). The use, distribution or reproduction in other forums is permitted, provided the original author(s) and the copyright owner(s) are credited and that the original publication in this journal is cited, in accordance with accepted academic practice. No use, distribution or reproduction is permitted which does not comply with these terms.
*Correspondence: Keita Saku, c2FrdS5rZWl0YUBuY3ZjLmdvLmpw; c2FrdUBjYXJkaW9sLm1lZC5reXVzaHUtdS5hYy5qcA==
Disclaimer: All claims expressed in this article are solely those of the authors and do not necessarily represent those of their affiliated organizations, or those of the publisher, the editors and the reviewers. Any product that may be evaluated in this article or claim that may be made by its manufacturer is not guaranteed or endorsed by the publisher.
Research integrity at Frontiers

Learn more about the work of our research integrity team to safeguard the quality of each article we publish.