 Jacob Gerken
 Gear Thomas Vincent
 Demi Zapata
 Ileana G. Barron
 Isain Zapata
- 1Rocky Vista University College of Osteopathic Medicine, Englewood, CO, United States
- 2Eastern Virginia Medical School, Norfolk, VA, United States
- 3Research Operations, Office of Research, Denver Health, and Hospital Authority, Denver, CO, United States
- 4Department of Biomedical Sciences, Rocky Vista University College of Osteopathic Medicine, Englewood, CO, United States
Pesticides are an essential feature of modern-day agriculture that adds to the list of factors that increase cancer risk. Our study aims to comprehensively evaluate this relationship through a population-based approach that considers confounding variables such as county-specific rates of smoking, socioeconomic vulnerability, and agricultural land. We achieved our goal with the implementation of latent-class pesticide use patterns, which were further modeled among covariates to evaluate their associations with cancer risk. Our findings demonstrated an association between pesticide use and increased incidence of leukemia; non-Hodgkin's lymphoma; bladder, colon, lung, and pancreatic cancer; and all cancers combined that are comparable to smoking for some cancer types. Through our comprehensive analysis and unique approach, our study emphasizes the importance of a holistic assessment of the risks of pesticide use for communities, which may be used to impact future policies regarding pesticides.
Introduction
Pesticides are chemicals designed to eliminate and control animal and plant life that can adversely affect agriculture or domestic life (1). Few innovations are as significant in agriculture as the development and use of pesticides. Herbicides, fungicides, insecticides, and other types of pesticides have been shown to improve crop yields and food security (2). In contrast, organic farms that do not use pesticides often have 15%−50% lower yields compared to conventional farms (3–7). Pesticide use is ubiquitous in the United States, and it is essential for maintaining productivity, with herbicides applied to 96% of the 93.4 million acres of corn planted in 2021 alone (8). Without the use of pesticides, fruit, vegetable, and cereal production is estimated to decrease by 32%−78% (9, 10). Achieving food security is a priority for all countries; with a population prediction of 9.7 billion people by 2100 (11), pesticides will likely continue to play an important role in ensuring food security for a developing world. Despite the importance of pesticides in modern agriculture, exposure to pesticides has been associated with numerous harmful health effects, including neurological disorders such as Parkinson's disease (12), increased risk for various cancers (13), and altered immune function (14, 15).
One of the primary concerns about pesticides, and the focus of this study, is the link between pesticides and cancer incidence. Pesticides have been linked to colorectal cancer (16), lung cancer (17), childhood (17, 18) and adult leukemias (19), lymphomas (20, 21), and pancreatic cancer (22), among others. Glyphosate, marketed as Roundup®, is a common herbicide with an average of 280 million pounds applied to 298 crop acres yearly (23). Some studies have shown a correlation between exposure to glyphosate and an increased risk of lymphoma (24–26). The International Agency for Research on Cancer even classified glyphosate as a probable carcinogen in humans in 2015 (27). This has resulted in US$11 billion paid to plaintiffs in lawsuits due to its potential health risks (28) despite the Agricultural Health Study (AHS) of 89,000 farmers and their spouses (29) showing no increased risk between glyphosate and lymphoid malignancies. Many other pesticides, including parathion, malathion, diazinon, and tetrachlorvinphos, all have some evidence of carcinogenicity, especially in animal models (30). Overall, 12 of the 30 pesticides tracked in the AHS have been shown to be linked to prostate, lung, pancreas, and colon cancer; multiple myeloma; and leukemia (22).
While the link between pesticides and cancers has been extensively studied, many studies focus on subsets of a population with known exposures. For example, the AHS looked at 89,000 farmers and their spouses but not the community. One study evaluated the association between pesticide exposure and non-Hodgkin's lymphoma from a population point of view (21) but was limited to only one type of cancer. Another study (31) compared pesticide use across 11 western U.S. states on a county basis but only considered two cancer metrics (pediatric and total cancer). Overall, a comprehensive assessment of cancer risk from a public and a population health perspective in the United States is non-existent. Our study aims to fill in that gap. The study we present further elucidates the relationship between pesticides and cancer using a state-of-the-art approach that defines patterns of pesticide use through latent class analysis (LCA) and then models these patterns along additional confounder variables. Although this is a populational study using aggregated data that does not allow for causal inference and individual outcome assessments, it is the first comprehensive evaluation of cancer risk from a population-based perspective at the national level.
Methods
Strategy
The main strategy of our study was to use county-wide agricultural pesticide data, along with cancer incidence and covariate data [smoking, the Social Vulnerability Index (SVI), agricultural land use, and total population] to determine the effect of use pattern profiles on cancer incidence. To achieve this, we first matched all databases using county Federal Information Processing Standard (FIPS) codes. Then we developed agricultural pesticide use pattern profiles using an LCA approach to pesticide use alone. After that, we performed a comprehensive analysis to determine the effect of agricultural pesticide use patterns and covariates on cancer incidence. An outline of our study strategy is presented in Figure 1. As with any large-scale epidemiological analysis, not all confounders can be accounted for. To avoid an ecological fallacy, we emphasize that the models are designed to demonstrate regional trends between pesticide use patterns and the incidence of certain cancers; however, we do not go as far as to allocate direct risk values to individuals or make causal inferences. Our approach assumes that “more pesticide use leads to higher cancer incidence” as the opposite idea is not supported by evidence. However, one could argue that smaller amounts of pesticides applied to more densely populated regions allow each kilogram of pesticide to have a larger impact, as there is a greater likelihood that a person will encounter it.
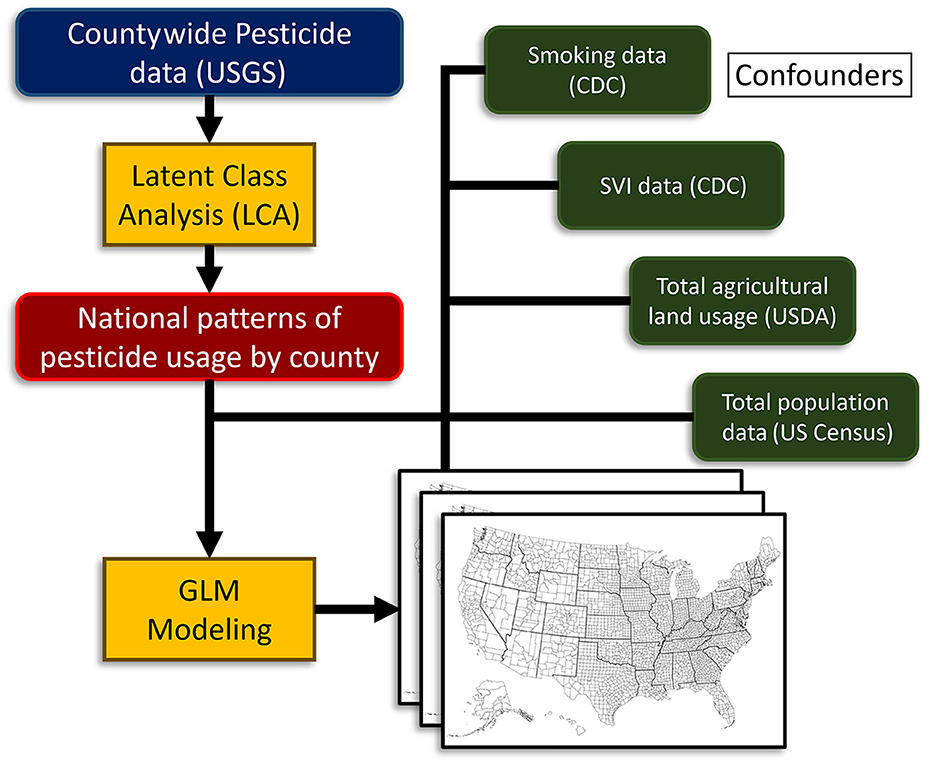
Figure 1. Study design and strategy flow chart. USGS, U.S. Geological Survey; NIH, National Institutes of Health; CDC, Centers for Disease Control; GLM, generalized linear model; USDA, U.S. Department of Agriculture.
Pesticide data
Agricultural pesticide use data and crop acres were obtained from the United States Geological Survey (USGS) (32). These data are the most extensive national pesticide data available. These files contained aggregated data by pesticides that were organized by compound, year, state FIPS code, county FIPS code, and amount in kilograms. The list has been adjusted through the years to record the chemicals determined to be of interest to the USGS, resulting in the 69 chemicals collected for 2019 and released in 2021. A list of the 63 pesticides used is presented in Table 1. The USGS generated these data from proprietary surveys of farm operations located within the U.S. Department of Agriculture Crop Reporting Districts composed of contiguous counties within each state. These surveys were used in conjunction with the U.S. Department of Agriculture and Censuses of Agriculture, the County Agricultural Production Survey, and the U.S. Department of Agriculture–National Agricultural Statistics Service to calculate use rates per harvested-crop acre, or an ‘estimated pesticide use' rate, for each crop by year. County-use estimates were then obtained by modeling analyses to generate low-bound and high-bound estimates. In this study, we used low bound estimates for being the most conservative estimate. The state of California presents only one estimate.

Table 1. List of the 69 pesticides of agricultural interest that are monitored by the U.S. Department of Agriculture and are reported by county that were included in this study.
Cancer incidence and sociodemographic confounder data
Cancer incidence rates per county were acquired from the National Institutes of Health (NIH) and Centers for Disease Control (CDC) State Cancer Profiles database over the 2015–2019 period. The data were pre-organized by county FIPS codes. Data points retrieved included cancer incidence, smoking rates, and SVI data. This NIH/CDC cancer incidence data is comprised of cancer registry data from the CDC's National Program of Cancer Registries and the National Cancer Institute's Surveillance, Epidemiology, and End Results Program. It also includes mortality data from CDC's National Center for Health Statistics. We collected incidences per 100,000 people for all cancers, bladder cancer, colon cancer, leukemia, lung cancer, non-Hodgkin's lymphoma, and pancreatic cancer. Missing cancer incidence data for one or more cancer types were observed in counties censored due to low counts. Censoring for low counts is a mandatory requirement under federal regulations to protect the identity of individuals. The SVI was used to address sociodemographic disparity differences among counties. The SVI was developed through a joint Department of Health and Human Services and CDC initiative to identify communities at risk for adverse health outcomes during health emergencies (33). Agricultural land use data were gathered from the U.S. Department of Agriculture. Total population data were gathered from the 2019 American Community Survey by the U.S. Census Bureau (8) to match our data. Total population was used as a proxy to define urban areas that can be associated with other types of risk not related to agricultural activities. The reporting data of these different populations may also diminish our results. Urban areas with modern medical infrastructure may disproportionately contribute to the cancer databases while rural cancer incidence may be underreported.
LCA agricultural pesticide pattern profiles
LCA modeling was used to define agricultural use patterns. This was done on the USGS agricultural pesticide data alone. For these models, we used low-bound estimated for being the most conservative use estimate. The LCA was performed using PROC LCA v.1.3.2 for SAS v.9.4 (SAS Institute Inc., Cary, NC); PROC LCA is a package developed and supported by The Methodology Center (34) at Penn State University published in 2015. We developed models using a 2-class through 8-class approach. To run these models, we converted the individual pesticide use data to quartiles on a national scale. Using these quartile data, we estimated individual pesticide profile estimates that when joined together defined each county's pattern profile. The most influential pesticides that differentiate the profiles can be determined from the estimated data. In addition, we collected model performance data to evaluate model fit, a summary of these metrics (log-likelihood, Akaike's information criterion, Bayesian information criterion, consistent Akaike's information criterion, and adjusted Bayesian information criterion) are presented in Table 2. Performance metrics did not bottom out for any of the evaluated criteria. Because defining the optimal number of agricultural profile patterns was not the goal of the study and given that the interpretation of individual patterns was for simplification of the narrative, the process was stopped at eight classes. This was also motivated when considering computing time as further addition of classes raises the time exponentially but provides little contextual benefit to the narrative presented. The LCA procedure defines profile patterns based on their correlation but does not rank these patterns in a particular way; defining the relevance of each pattern in the narrative was achieved with further modeling steps.
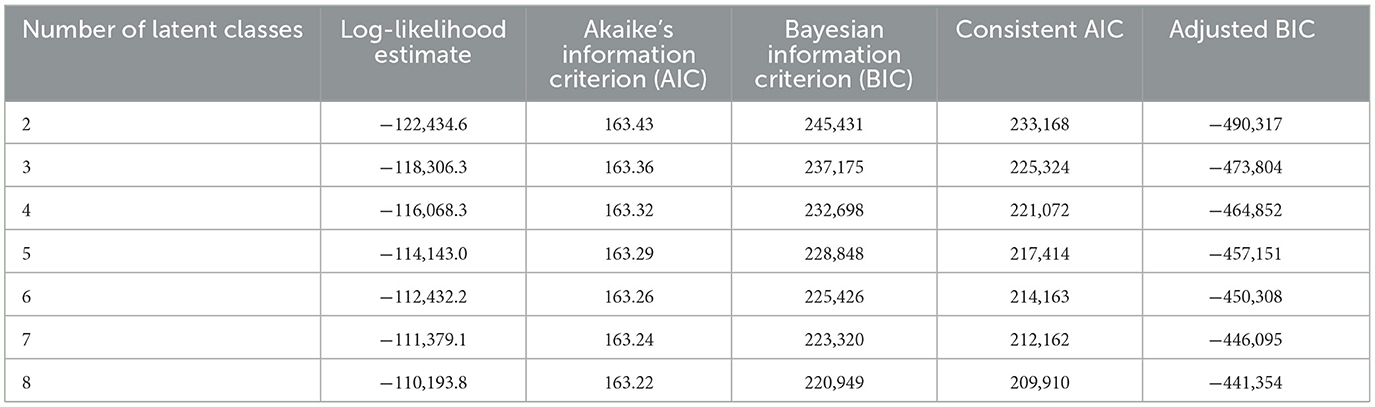
Table 2. Latent class analysis fit metrics for the pesticides of agricultural interests in this study.
Generalized linear model effect estimation of pesticide profile patterns and covariates
To determine the effect of the agricultural use profiles we used a generalized linear model approach. We developed individual models for each cancer incidence type (all cancers, bladder cancer, colon cancer, leukemia, lung cancer, non-Hodgkin's lymphoma, and pancreatic cancer). Incidence was defined as the dependent variable while SVI, smoking prevalence, agricultural land use, total county population, and the LCA-derived agricultural pesticide use patterns (categorical variable) were used as independent variables. Gaussian distributions for residuals were used and evaluated through graphical methods, where no deviations were seen for any instance. These models provided us with association estimates for each agricultural pesticide use pattern that allowed us to define the regions with the highest and lowest added risk for cancer. Within these comparisons of the highest and lowest, we calculated the number of added persons affected per year by these cancers that can be attributed to differences in agricultural pesticide use. Because cancer incidence use was recorded as the rate per 100,000 people, model estimates for the difference between the highest and lowest risk use patterns were adjusted by the total population of the United States (331,449,281 people at the end of 2019). Similarly, smoking-attributed additional cases were calculated using the national per-county percentiles of smoking rates; this allows for a fair comparison to pesticide use region. These values isolate the added effect of pesticides on cancer incidence in the context of smoking. All modeling was performed using PROC GLIMMIX in SAS v.9.4 (SAS Institute Inc., Cary, NC). In all our models, significant associations are declared on a Bonferroni multiple testing corrected p-value of 0.05.
Results
Countywide agricultural pesticide data, along with covariate data, were used to determine the comprehensive effect of national agricultural pesticide use pattern profiles on cancer incidence. This was done by defining agricultural pesticide use profile patterns using LCA followed by a comprehensive modeling analysis (Figure 1). Data from 3,143 counties was included in our analysis. The 69 USGS-monitored pesticides of agricultural interest included in the study are listed in Table 1. The pesticide use data are provided by the USGS as low-bound and high-bound estimates of use. Our studies used low-bound estimates to be on the most conservative side. County reporting for each chemical is variable, with some chemicals being reported in more than 3,000 counties while, for others, reported use is fewer than 100 counties. This discrepancy reflects differences in use patterns across the United States. For our approach, pesticide use data were converted to quartiles to accommodate the way data are reported and the demands of the LCA approach for categorical data. Our rationale assumes that “more pesticide use leads to higher cancer incidence” because no evidence has ever been reported of pesticides reducing cancer rates.
LCA agricultural pesticide use patterns and pesticides most associated
Our LCA approach grouped agricultural pesticide use by use patterns that are not necessarily tied to a specific geographical area. These patterns highly represent crop types and types of agricultural industry in the county (e.g., differencing corn production for ethanol biofuel from that for livestock and human consumption). Usage patterns are also influenced by local agricultural chemical usage regulations and product popularity, which can be different across states and regions of the United States. Therefore, these patterns are often a larger representation of community interests. We selected and based our findings on 8-class LCA model estimates. This was done for convenience as models showed trivial improvement in fit with an increased number of classes (see Table 2 for the fit metrics of 2-class through 8-class models) and demanded extensive computation time. The 8-class model provides enough resolution (as seen in the maps we present) to define the highest and lowest added-risk use patterns.
Based on LCA model estimates and under the assumption that higher pesticide exposure will lead to higher cancer incidence, we defined the top pesticides that are most representative of the counties that have use patterns associated with the highest cancer incidence. The comparison of the use pattern with the highest added risk of cancer vs. the use pattern with the lowest added risk of cancer is presented in Figure 2. These lists of top contributors show specific associations between specific pesticides and cancer types. These lists often display directional shifts in the list of heavier use, with some cases being the use pattern with the lowest added risk displaying a heavier use of a top pesticide. This phenomenon is directly associated with crop-type and agricultural industry–type differences that contrast regions. Overall, the list includes many different pesticides across the different cancer types, with some being at the top of the list across cancer types. Atrazine was consistently a top contributor in regions with high added risk for all cancers and colon cancers. Boscalid was a top contributor in not only high-added-risk regions for leukemia, non-Hodgkin's lymphoma, and pancreatic cancer but also for low-added-risk regions of lung cancer. Dimethomorph was representative of not only regions with a high added risk of leukemia and non-Hodgkin's lymphoma but also regions with a low added risk of colon cancer. Dicamba was consistently at the top of the list in regions with a high added risk of colon cancer and pancreatic cancer. Dimethenamid was seen in regions with a low added risk of bladder cancer, but in combination with dimethenamid-P, it was observed in regions with a high added risk of pancreatic cancer. Dinotefuran was at the top in regions with high leukemia and non-Hodgkin's lymphoma on the opposite end for colon cancer. Glyphosate was consistently seen at the top in regions with a high added risk of all cancers, colon cancer, and pancreatic cancer. Imazethapyr had a similar presence in all cancers, colon cancer, and lung cancer. Finally, metolachlor, metolachlor-S, and the combination of both were consistently top contributors for regions with higher added risk of all cancers, colon cancer, and pancreatic cancer. These findings suggest that added cancer risk is dependent on cancer type with common pesticides associated with several cancer types.
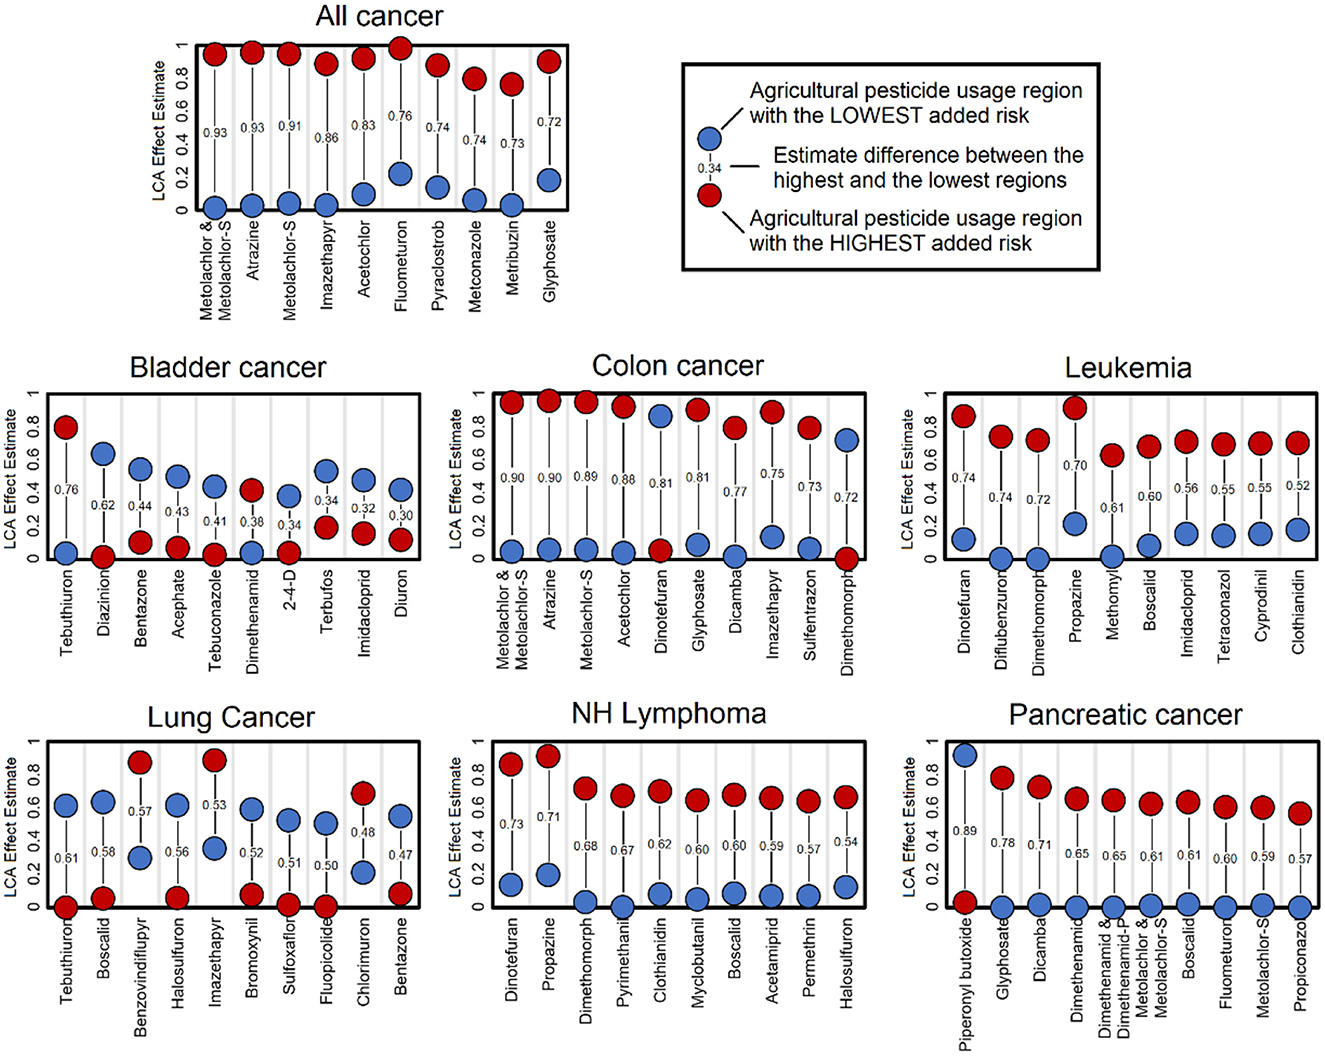
Figure 2. Top pesticides contributing to latent class analysis (LCA) use patterns. The list of pesticides presented includes those with the highest use difference between regions with the highest and lowest added risk of cancer. These largest differences highlight the most relevant pesticides that define these contrasting regions; however, these differences may not be the only causative element. These estimates are based on the 8-class LCA classification model.
Pesticides have a significant effect on increasing cancer risk for all the cancer types evaluated (Figure 3A), however, in a way that is only matched by smoking prevalence. Sociodemographic factors addressed using the SVI were only associated with bladder cancer, leukemia, and non-Hodgkin's lymphoma. Land use was only significant for all cancers and lung cancer. Total population was not associated with any cancer type. Our use pattern–specific estimates (Figure 3B) show that no single pattern consistently displays the highest or lowest added cancer risk. This highlights the specificity of use that is defined by crop type and agricultural industry type that will affect specific cancer types.
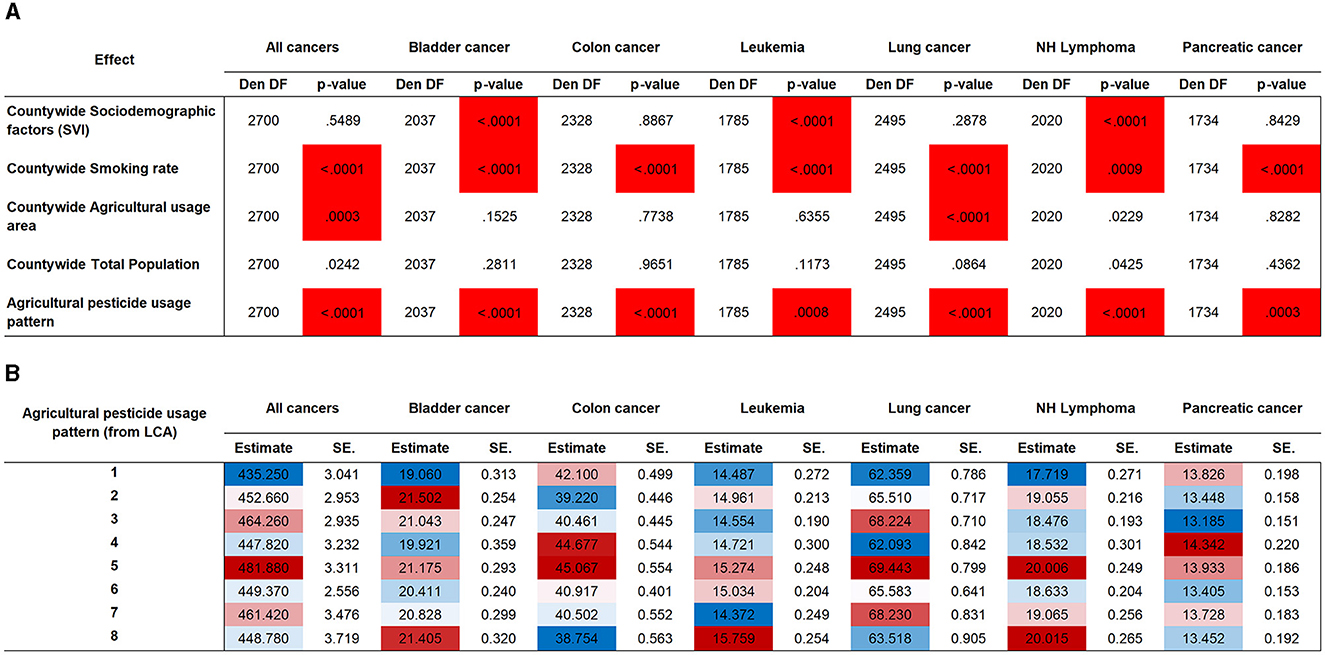
Figure 3. Association testing for pesticide use patterns and for covariates. (A) Association testing by cancer type. Highlighted cells indicate significance at a Bonferroni-adjusted threshold (35 tests). (B) Agricultural pesticide use pattern effect estimates by cancer type. Shading indicates the magnitude range from lowest added risk (blue) to highest added risk (red). Den DF, Denominator Degrees of Freedom; LCA, latent class analysis; NH Lymphoma, non-Hodgkin's lymphoma; SE, standard error.
Regional variation of agricultural effects on cancer incidence
Agricultural use patterns do not necessarily fit jurisdictionally defined geographical regions. These land-use commonalities are defined by crop types and agricultural industry types that are predominant in each county. To present how our patterns are distributed geographically, we produced national maps that represent the contrast of regions with the pesticide use associated with higher added cancer risk using the lowest region as a reference. In these maps, we highlight shocking estimates of additional cancer cases per year adjusted to the total population of the United States. For all cancers (Figure 4), we observe the regions most affected by pesticide use are concentrated primarily in the Midwest but are spread out through the country with few areas spared. For all cancers, the Great Plains in the center of the country is the region with the lowest added risk and was used as the reference; this is a region with less intense agricultural activity in terms of total production. The difference between the reference and the highest-added-risk region is 154,541 (95% confidence interval (CI) [154,529, 154,552]) additional cancer cases a year. As a reference, the median rate per 100,000 people reported by the CDC for 2013–2017 for all cancers was 442.4 (35), while the estimate from our data was 449.0 (95% CI [435.7, 462.3]).
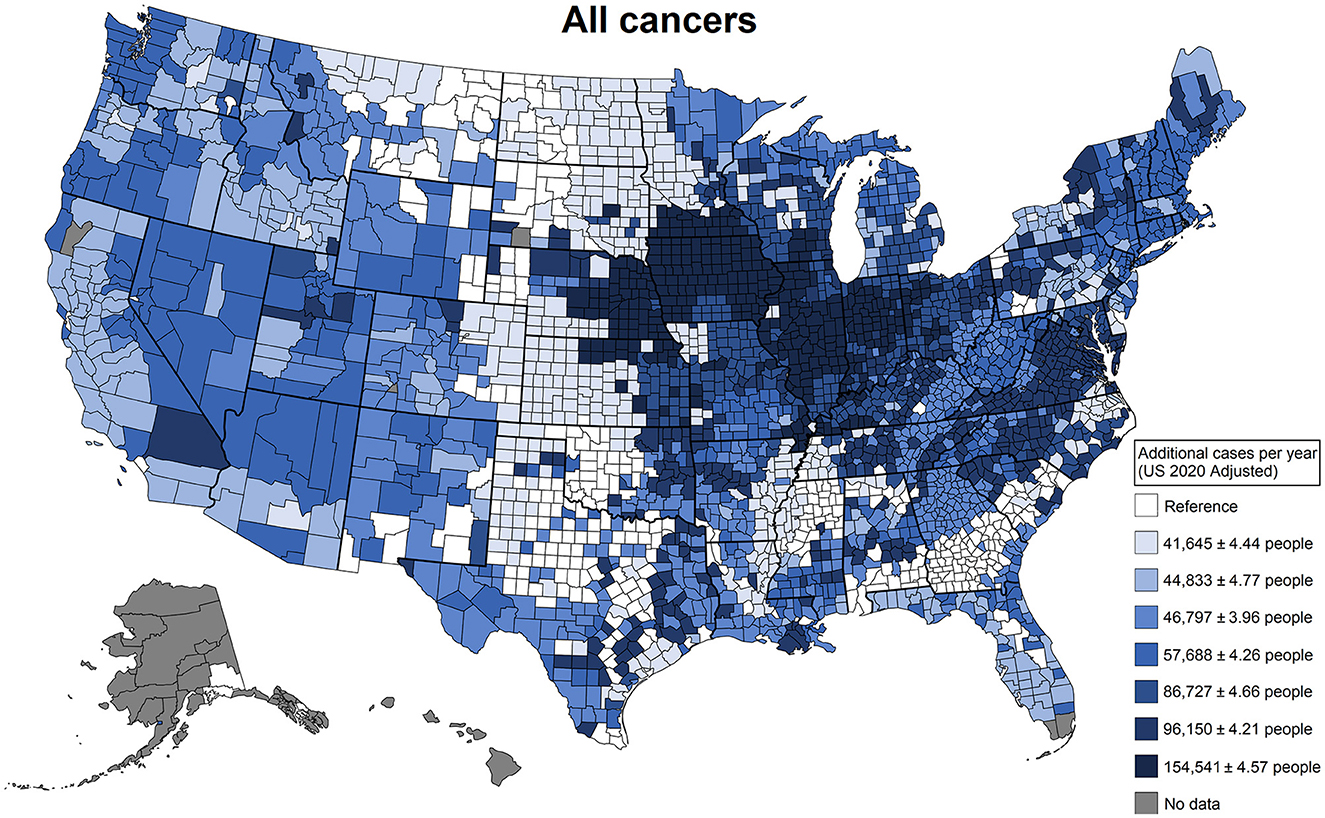
Figure 4. Additional cancer cases in a single year that can be attributed to differences in agricultural pesticide use patterns. These patterns of use were defined by latent class analysis; estimates were derived from generalized linear models adjusted for agricultural land use, total population, the Social Vulnerability Index, and smoking rates. This plot contrasts the counties that have the least risky use of agricultural pesticides with the counties that have the riskiest use of agricultural pesticides.
When looking at the same type of display for individual cancer types (Figure 5), we observe that colon and pancreatic cancers display similar patterns, with 20,927 (95% CI [20,925, 20,929]) and 3,835 (95% CI [3,834, 3,836]) additional cases per year, respectively. Being these cancers most associated with use patterns in the Great Plains, the Midwest, and the Mississippi River Basin regions. Hematopoietic cancers (leukemia and non-Hodgkin's lymphoma) display similar patterns, being most associated with use patterns in the Midwest and the West Coast with 4,595 (95% CI [4,594, 4,596]) and 7,608 (95% CI [7,607, 7,609]) additional cases per year, respectively, in the regions with the highest added risk. For cancers with increased cases related to smoking, pancreatic cancer had 3.4% more cases compared to pesticides, followed by colon cancer, with a 73% larger effect, and lung cancer, with a 324.8% increase in cases, with 8,095 (95% CI [8,093, 8,097]) additional cases per year. Lung cancer displayed a concentrated added risk in the Midwest region, with 24,362 (95% CI [24,359, 24,365]) additional cases. Consistently, the most affected region across all cancers and by individual cancer types is the Midwest, a region characterized by heavy corn production. States such as Iowa, Illinois, Nebraska, Missouri, Indiana, and Ohio consistently appear in regions with the highest added risk. Also, Florida, which is characterized by heavy agricultural production, unsurprisingly displays additional cancer risk. For context, the additional risk regarding smoking risk was estimated in the same models, and the percentage difference was calculated. The largest effect difference was for non-Hodgkin's lymphoma, with 154.1% more cases caused by pesticides compared to smoking; all cancers, bladder cancer, and leukemia displayed more modest increases of 18.7%, 19.3%, and 21.0%, respectively, in the case rates for pesticides. For cancers with a predominant association with smoking, pancreatic cancer displayed a modest 3.4% more cases compared to pesticides, followed by colon cancer with a 73% larger effect and lung cancer with the largest proportion of 324.8% more cases.
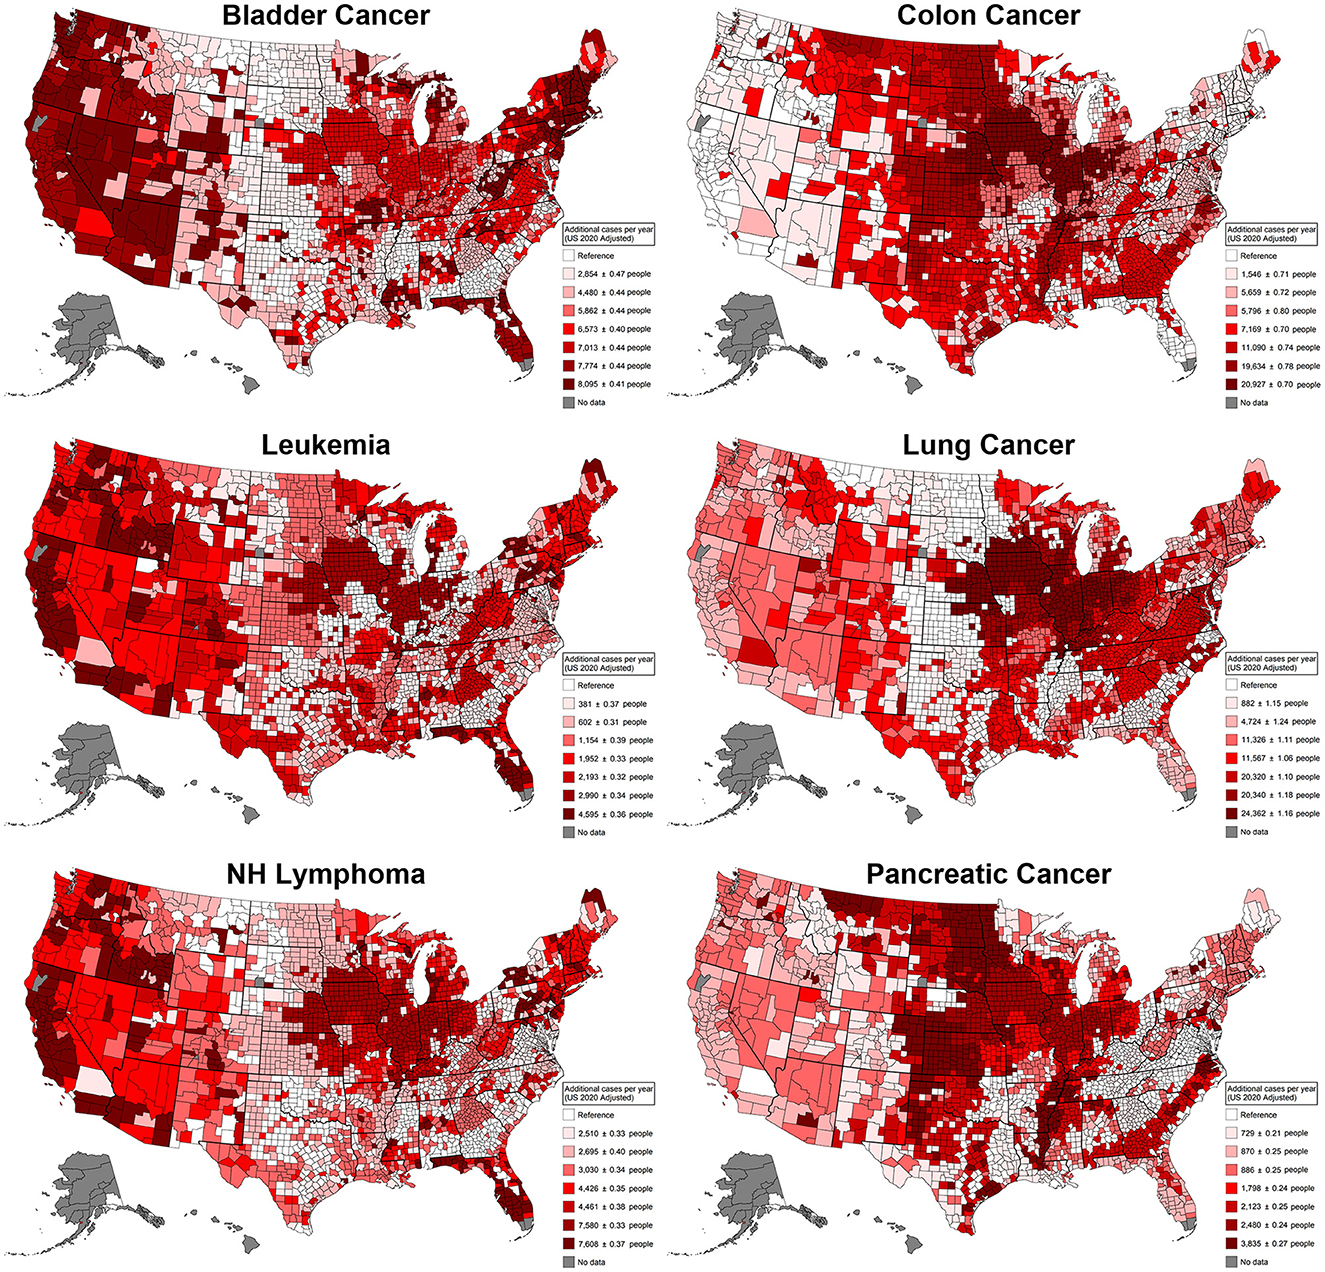
Figure 5. Additional cancer cases per cancer type in a single year that can be attributed to differences in agricultural pesticide pattern use. These patterns of use were defined by latent class analysis; estimates were derived from generalized linear models adjusted for agricultural land use, total population, the Social Vulnerability Index, and smoking rates. This plot contrasts the counties that have the least risky use of agricultural pesticides with the counties that have the riskiest use of agricultural pesticides. NH Lymphoma, Non-Hodgkin's lymphoma.
In summary, agricultural pesticide use has a significant impact on all the cancer types evaluated in this study (all cancers, bladder cancer, colon cancer, leukemia, lung cancer, non-Hodgkin's lymphoma, and pancreatic cancer), and these associations are more evident in regions with heavy agricultural productivity. Pesticide-associated cancers appear to be on par with several smoking-associated cancer types. This is the first study that presents comprehensive estimates for cases that are exclusively attributable to agricultural pesticide use.
Discussion
The focused view vs. the big picture
The main aim of our study was to comprehensively evaluate the effect of agricultural pesticide use and cancer incidence across the United States from a population-based perspective. While other studies focused on individual pesticides, our study evaluates simultaneously the pesticide use patterns across the entire United States. Outside of specific individual exposures, most individuals in these communities are not only exposed to a single pesticide but also a cocktail of chemicals specific to the land use and type of crop produced in their area of residence. Acute exposure cases have been linked to off-target pesticide drift exposures (36) that can cover whole communities (37). In comparison, communities affected by more covariates are also associated with cancer risk. These factors are often tied together and are difficult to impossible to isolate; therefore, developing analytical approaches that accommodate the complexity of a community is imperative for developing improved outcomes.
Our study provides one of the first comprehensive population-based analyses of pesticide use and cancer rates while controlling and adjusting for potentially confounding variables. Pesticide use effects were more persistent than the socioeconomic disparity factors addressed through the SVI in our study. The SVI accounts for many of the confounders that are associated with socioeconomic and racial status (33) and has been shown to be a reliable metric for addressing disparities (38–40). Accounting for these as potential confounders was essential to ensure the validity of our approach. For example, Black populations (41) in the United States have a significantly higher cancer mortality rate when compared to other ethnic groups, while White populations have a slightly higher rate of new cancer diagnosis (42), which suggests disparities in cancer screening. Our findings help us understand that overall exposures to pesticides are just as relevant as the effects of sociodemographic disparities and may aid in the development and prioritization of public health efforts, a narrative often missed in non-comprehensive approaches.
A curious effect in addition to known covariates is publication bias. This bias may also be playing a role in our big-picture assessment of the issue. The association of cancer risk with pesticides is a popular topic of research that often leads to headlines in the popular media (28). These headlines focused on specific pesticides that can cause a feedback effect on the extent of research efforts. A PubMed search for “Glyphosate” and “cancer” as keywords yields 238 hits, of which 171 are from the last 5 years: “Atrazine” and “cancer” yields 165, with 46 from the last 5 years. In contrast, metolachlor, a chemical detected in our study, yields 24 results, with 7 studies in the last 5 years. A comprehensive evaluation of agricultural pesticides such as the one we present can reveal targets despite publication bias. We cannot assume that less published associations for a particular pesticide and cancer imply these do not exist.
Cancer-type associations to agricultural pesticide use put in context against smoking
Overall, our study showed that elevated risk pesticide use is associated with an increased risk of all the cancers evaluated. It offers a different view for further investigation as the effects of pesticide use remained significant on par with smoking even when adjusting the models for agricultural land use, total population, and social vulnerability index. Non-Hodgkin's lymphoma and leukemia are potentially two of the most vigorously discussed cancers out of the cancers evaluated in this study. Evidence about the linkage between pesticide exposure and non-Hodgkin's lymphoma and bladder cancer has been mixed. Some studies show no consistent association (21, 43–47), w n a positive association (20, 48, 49). Our study showed the strongest association between certain patterns of pesticide use and non-Hodgkin's lymphoma, in which associations with bladder cancer and leukemia were more modest among all the cancers we evaluated. The effects of pesticides on these cancer types were more significant than the effects of smoking. Smoking is an important risk factor for pancreatic cancer, with cigarette smokers having an 80% increased risk (50). Our study not only detected the harmful effect of smoking but also put it in context against the effect of agricultural pesticide use. Previous reports have shown associations between pesticides and pancreatic cancer (22, 51), with other studies disputing those findings (52, 53). While the exact link between pancreatic cancer and pesticides is not yet fully understood, our study suggests that, from an epidemiological standpoint, pesticides could potentially hold a role remarkably similar to smoking. Colon cancer showed a similar pattern to pancreatic cancer, with smoking and pesticide exposure being the most significant associated factors. Pesticides have been linked to an increased risk of colon cancer (45, 54–56), which concurs with the results we present. Our findings demonstrate an effect of pesticides that is not on par with smoking but is not negligible either and provides epidemiological evidence for their relationship. Finally, lung cancer and pesticide exposure (17, 57) have previously been linked; our study agrees with the existing literature presenting a non-negligible effect but acknowledges that smoking is by far the primary concern.
Regional aspects must be considered when evaluating the big picture
The effects of agricultural pesticides are unsurprisingly seen most often in areas with increased agricultural activity like the Midwest, with states such as Iowa, Illinois, Ohio, Nebraska, and Missouri (58) leading in corn production (59). This finding suggests that specific cancer risk is likely to be associated with the types of crops grown in each region. Certain areas of the western states also had increased cancer risk for all cancers, bladder cancer, leukemia, and non-Hodgkin's lymphoma but with distinct agricultural use patterns. The western states have higher vegetable and fruit production compared to the Midwest. California, for example, is the top vegetable-producing state in the country with more than 1.2 million acres of vegetables harvested in 2017 (60). A similar pattern is seen in Florida, with several additional cases of bladder cancer, leukemia, and non-Hodgkin's lymphoma, as well. Many citrus fruits are grown in Florida each year as Florida ranks second to only California in orange production (61).
How can this big picture help us and what are its limitations
While significant use and a lack of understanding regarding the complex interactions of these chemicals is an obvious health and public safety risk, little has been done to illustrate the consequences on a broader scale. We identify several areas of investigation that our analysis provides a path for: First, areas of priority for screening and preventive care have been highlighted by illustrating how particular combinations of pesticides may have a higher association with cancer incidence rates. This should be an important directive of health and human services and public health departments to act on the side of caution in protecting public safety. Second, considering that property values are decided by many factors (access to health care, school quality, goods and services, and career opportunities, among others) related to health and overall well-being adding with more emphasis a scoring system for proximity to pesticide use is also worth consideration. If, when buying a new property, purchasers were notified that the land is in proximity to particularly elevated levels of pesticides or the use of certain pesticides that may be especially harmful, then public awareness of this issue would rise, garnering the attention that this issue calls for. Third, the safety of these chemicals needs to be approached with more skepticism. Healthcare officials in these regions should exercise a level of skepticism of the safety of the chemicals used. In regions such as the Midwest, scrutinizing the public health data in relation to cancer incidence in these areas may highlight potential overlooked exposures.
While our study provided many key findings further that expand on the impact of pesticide use and cancer rates in the United States, our study is not without limitations. Some of these limitations are data-wise; the availability and uniformity of the data bring some limitations, with some counties having data censored due to small populations and cancer rates. Exposure cannot be linked to individual outcomes as this is an aggregate dataset. Methodologically, the heterogeneity in county size and population is one of the limitations of the study that can shift the leverage of certain counties or affect their reporting. Conceptually, the transient nature of certain populations that might have high exposure to pesticides, such as seasonal and migrant farmworkers (62), is not considered in our study. Our study does not include melanoma, a truly relevant cancer type; this was because melanoma has associations with relatively unique factors, such as ultraviolet exposure (sun exposure) and skin pigmentation levels (63), that are more complicated to model. The findings presented lack validation from additional independent sources, and data to perform this task are not yet publicly available. We hope this study will motivate future applications that can further confirm our findings. Finally, our study proposes a new vision by using a strategy that is different from standard epidemiological methods, which can complicate interested groups' interpretations. All these limitations bring caveats to our findings but converge with earlier findings.
Conclusion
We performed a comprehensive analysis of the relationship between overall pesticide use and the incidence of cancer across the United States using a population and community-based approach. Our population-based approach provides a more holistic understanding of the community effects of the overall pesticide exposure. This comprehensive analysis accounted for potential confounders, such as socioeconomic status, smoking rates, and agricultural land use. Our findings show that the impact of pesticide use on cancer incidence may rival that of smoking. Geographic trends showed that counties with higher agricultural productivity, such as the leading corn-producing states of the Midwest, also have increased cancer risk due to pesticide exposure. Our results highlight the relevance of comprehensive assessments for the development of policy considerations and the implementation of preventive measures to mitigate the risks for vulnerable communities. Our study pioneers and lays a holistic vision foundation for future pesticide-related cancer risk assessments.
Data availability statement
Publicly available datasets were analyzed in this study. This data can be found at: U.S. Center for Disease Control, the U.S. Department of Agriculture, the U.S. Geological Survey and the U.S. Census Bureau. Curated datasets can be made available at a reasonable request to the corresponding author.
Author contributions
JG: Conceptualization, Data curation, Investigation, Writing – original draft. GV: Conceptualization, Data curation, Investigation, Writing – original draft. DZ: Conceptualization, Data curation, Investigation, Writing – original draft. IB: Data curation, Formal analysis, Investigation, Visualization, Writing – review & editing. IZ: Conceptualization, Formal analysis, Supervision, Visualization, Writing – review & editing.
Funding
The author(s) declare that no financial support was received for the research, authorship, and/or publication of this article.
Conflict of interest
The authors declare that the research was conducted in the absence of any commercial or financial relationships that could be construed as a potential conflict of interest.
Publisher's note
All claims expressed in this article are solely those of the authors and do not necessarily represent those of their affiliated organizations, or those of the publisher, the editors and the reviewers. Any product that may be evaluated in this article, or claim that may be made by its manufacturer, is not guaranteed or endorsed by the publisher.
References
1. U.S. National Institute of Environmental Health Sciences, Pesticides. (2023). Available online at: https://www.niehs.nih.gov/health/topics/agents/pesticides/index.cfm (accessed August 14, 2023).
2. Popp J, Peto K, Nagy J. Pesticide productivity and food security. A review. Agron Sustain Dev. (2013) 33:243–55. doi: 10.1007/s13593-012-0105-x
3. Halberg N, Sulser TB, Høgh-Jensen H, Rosegrant MW, Knudsen MT. The Impact of Organic Farming on Food Security in a Regional and Global Perspective. in Global Development of Organic Agriculture: Challenges and Prospects. London: CABI Publishing (2006), p. 277–322
4. Aune JB. Conventional, Organic and Conservation Agriculture: Production and Environmental Impact. in Agroecology and Strategies for Climate Change. Cham: Springer (2012), p. 149–65.
5. Seufert V, Ramankutty N, Foley JA. Comparing the yields of organic and conventional agriculture. Nature. (2012) 485:229–32. doi: 10.1038/nature11069
6. Ponisio LC, M'Gonigle LK, Mace KC, Palomino J, De Valpine P, Kremen C. Diversification practices reduce organic to conventional yield gap. Proc Royal Soc B Biol Sci. (2015) 282:20141396. doi: 10.1098/rspb.2014.1396
7. Rasche L. Estimating pesticide inputs and yield outputs of conventional and organic agricultural systems in europe under climate change. Agronomy. (2021) 11:1300. doi: 10.3390/agronomy11071300
8. U.S. Department of Agriculture, Agricultural Chemical Use Survey: Corn. NASS Highlights (2021). Available online at: https://www.nass.usda.gov/Charts_and_Maps/Crops_County/cr-pr.php (accessed August 26, 2023).
9. Lamichhane JR. Pesticide use and risk reduction in European farming systems with IPM: an introduction to the special issue. Crop Prot. (2017) 97:1–6. doi: 10.1016/j.cropro.2017.01.017
10. Tudi M, Daniel Ruan H, Wang L, Lyu J, Sadler R, Connell D, et al. Agriculture development, pesticide application and its impact on the environment. Int J Environ Res Pub Health. (2021) 18:1112. doi: 10.3390/ijerph18031112
11. United Nations Population. (2023). Available online at: https://www.un.org/en/global-issues/population#:~:text=The world population is projectedsurrounding these latest population projections (accessed August 14, 2023).
13. Lamure S, Carles C, Aquereburu Q, Quittet P, Tchernonog E, Paul F, et al. Association of occupational pesticide exposure with immunochemotherapy response and survival among patients with diffuse large b-cell lymphoma. JAMA Netw Open. (2019) 2:e192093. doi: 10.1001/jamanetworkopen.2019.2093
14. Lee GH, Choi KC. Adverse effects of pesticides on the functions of immune system. Comp Biochem Physiol Part C Toxicol Pharmacol. (2020) 235:108789. doi: 10.1016/j.cbpc.2020.108789
15. Cestonaro LV, Macedo SMD, Piton YV, Garcia SC, Arbo MD. Toxic effects of pesticides on cellular and humoral immunity: an overview. Immunopharmacol Immunotoxicol. (2022) 44:816–31. doi: 10.1080/08923973.2022.2096466
16. Matich EK, Laryea JA, Seely KA, Stahr S, Su LJ, Hsu PC, et al. Association between pesticide exposure and colorectal cancer risk and incidence: A systematic review. Ecotoxicol Environ Saf. (2021) 219:112327. doi: 10.1016/j.ecoenv.2021.112327
17. Kim B, Park EY, Kim J, Park E, Oh JK, Lim MK, et al. Occupational exposure to pesticides and lung cancer risk: a propensity score analyses. Cancer Res Treat. (2022) 54:130–9. doi: 10.4143/crt.2020.1106
18. Van Maele-Fabry G, Gamet-Payrastre L, Lison D. Household exposure to pesticides and risk of leukemia in children and adolescents: updated systematic review and meta-analysis. Int J Hyg Environ Health. (2019) 222:49–67. doi: 10.1016/j.ijheh.2018.08.004
19. Maryam Z, Sajad A, Maral N, Zahra L, Sima P, Zeinab A, et al. Relationship between exposure to pesticides and occurrence of acute leukemia in Iran. Asian Pacific J Cancer Prev. (2015) 16:239–44. doi: 10.7314/APJCP.2015.16.1.239
20. Luo D, Zhou T, Tao Y, Feng Y, Shen X, Mei S, et al. Exposure to organochlorine pesticides and non-Hodgkin lymphoma: a meta-analysis of observational studies. Sci Rep. (2016) 6:25768. doi: 10.1038/srep25768
21. Poh C, McPherson JD, Tuscano J, Li Q, Parikh-Patel A, Vogel CF, et al. Environmental pesticide exposure and non-Hodgkin lymphoma survival: a population-based study. BMC Med. (2022) 20:165. doi: 10.1186/s12916-022-02348-7
22. Andreotti G, Freeman LEB, Hou L, Coble J, Rusiecki J, Hoppin JA, et al. Agricultural pesticide use and pancreatic cancer risk in the agricultural health study cohort. Int J Cancer. (2009) 124:2495–500. doi: 10.1002/ijc.24185
23. Hawkins C, Hanson C. Glyphosate: Response to Comments, Usage, and Benefits (PC Codes: 103601, 103604.5, 103607.8, 103613, 417300). Office of Chemical Safety and Pollution Prevention (2019).
24. Cressey D. Widely used herbicide linked to cancer. Nature. (2015) 12:17181. doi: 10.1038/nature.2015.17181
25. Zhang L, Rana I, Shaffer RM, Taioli E, Sheppard L. Exposure to glyphosate-based herbicides and risk for non-Hodgkin lymphoma: a meta-analysis and supporting evidence. Mutation Res Rev Mut Res. (2019) 781:186–206. doi: 10.1016/j.mrrev.2019.02.001
26. Meloni F, Satta G, Padoan M, Montagna A, Pilia I, Argiolas A, et al. Occupational exposure to glyphosate and risk of lymphoma:results of an Italian multicenter case-control study. Environ Health. (2021) 20:49. doi: 10.1186/s12940-021-00729-8
28. Gaines MC, Cetera M. Roundup Lawsuit Update August 2023. Forbes Advisor (2023). Available online at: https://www.forbes.com/advisor/legal/product-liability/roundup-lawsuit-update/ (accessed August 22, 2023).
29. Andreotti G, Koutros S, Hofmann JN, Sandler DP, Lubin JH, Lynch CF, et al. Glyphosate use and cancer incidence in the agricultural health study. JNCI. (2018) 110:509–16. doi: 10.1093/jnci/djx233
30. Guyton KZ, Loomis D, Grosse Y, El Ghissassi F, Benbrahim-Tallaa L, Guha N, et al. Carcinogenicity of tetrachlorvinphos, parathion, malathion, diazinon, and glyphosate. Lancet Oncol. (2015) 16:490–1. doi: 10.1016/S1470-2045(15)70134-8
31. Joseph, N. (2022). Investigation of relationships between the geospatial distribution of cancer incidence and estimated pesticide use in the U.S. west. Geohealth 6:544. doi: 10.1029/2021GH000544
32. U.S. Geological Survey Data. Preliminary Estimated Annual Agricultural Pesticide Use for Counties of the Conterminous United States, 2019. U.S. Geological Survey – ScienceBase. (2021). Available online at: https://www.sciencebase.gov/catalog/item/6081a924d34e8564d68661a1 (accessed August 22, 2023).
33. U.S. Department of Health and Human Services, CDC/ATSDR SVI Fact Sheet. (2022). Available online at: https://www.atsdr.cdc.gov/placeandhealth/svi/fact_sheet/fact_sheet.html (accessed November 22, 2022).
34. The Methodology Center. SAS Procedures for Latent Class Analysis and Latent Transition Analysis (PROC LCA). (2015) Available online at: https://scholarsphere.psu.edu/resources/cddf9258-09f5-49fe-a313-4753e643b48a (accessed August 22, 2023).
35. U.S. National Cancer Institute, Cancer Statistics. (2020). Available online at: https://www.cancer.gov/about-cancer/understanding/statistics (accessed August 28, 2023).
36. Lee SJ, Mehler L, Beckman J, Diebolt-Brown B, Prado J, Lackovic M, et al. Acute pesticide illnesses associated with off-target pesticide drift from agricultural applications: 11 states, 1998–2006. Environ Health Perspect. (2011) 119:1162–9. doi: 10.1289/ehp.1002843
37. Rani L, Thapa K, Kanojia N, Sharma N, Singh S, Grewal AS, et al. An extensive review on the consequences of chemical pesticides on human health and environment. J Clean Prod. (2021) 283:124657. doi: 10.1016/j.jclepro.2020.124657
38. Flanagan BE, Gregory EW, Hallisey EJ, Heitgerd JL, Lewis B. A social vulnerability index for disaster management. J Homel Secur Emerg Manag. (2011) 8:0000102202154773551792. doi: 10.2202/1547-7355.1792
39. Carmichael H, Moore A, Steward L, Velopulos CG. Using the social vulnerability index to examine local disparities in emergent and elective cholecystectomy. J Surg Res. (2019) 243:160–4. doi: 10.1016/j.jss.2019.05.022
40. Gerken J, Huber N, Zapata D, Barron IG, Zapata I. Does altitude have an effect on stroke mortality and hospitalization risk? A comprehensive evaluation of United States data. Front Stroke. (2023) 2:1223255.. doi: 10.3389/fstro.2023.1223255
41. Lawrence WR, McGee-Avila JK, Vo JB, Luo Q, Chen Y, Inoue-Choi M, et al. Trends in cancer mortality among black individuals in the US From 1999 to 2019. JAMA Oncol. (2022) 8:1184. doi: 10.1001/jamaoncol.2022.1472
42. U.S. National Cancer Institute. Cancer Disparities - Cancer Stats Facts. Surveillance, Epidemiology and End Results Programs. (2022) Available online at: https://seer.cancer.gov/statfacts/html/disparities.html (accessed August 25, 2023).
43. Leon ME, Schinasi LH, Lebailly P, Beane Freeman LE, Nordby KC, Ferro G, et al. Pesticide use and risk of non-Hodgkin lymphoid malignancies in agricultural cohorts from France, Norway and the USA: a pooled analysis from the AGRICOH consortium. Int J Epidemiol. (2019) 48:1519–35. doi: 10.1093/ije/dyz017
44. De Roos D, Schinasi AJ, Miligi LH, Cerhan L, Bhatti JRP, ‘t Mannetje A, Cocco P. Occupational insecticide exposure and risk of non-hodgkin lymphoma: a pooled case-control study from the interlymph consortium. Int J Cancer. (2021) 149:1768–86. doi: 10.1002/ijc.33740
45. Botteri E, Borroni E, Sloan EK, Bagnardi V, Bosetti C, Peveri G, et al. Smoking and colorectal cancer risk, overall and by molecular subtypes: a meta-analysis. Am J Gastroenterol. (2020) 115:1940–9. doi: 10.14309/ajg.0000000000000803
46. De Roos D, Fritschi AJ, Ward L, Monnereau MH, Hofmann A, Bernstein J, et al. Herbicide use in farming and other jobs in relation to non-Hodgkin's lymphoma (NHL) risk. Occup Environ Med. (2022) 79:795–806. doi: 10.1136/oemed-2022-108371
47. U.S. Census Bureau (2019). American Community Survey 5-year Public Use Microdata Samples. Available online at: https://data.census.gov/cedsci/ (accessed March 11, 2021).
48. Hu L, Luo D, Zhou T, Tao Y, Feng J, Mei S, et al. The association between non-Hodgkin lymphoma and organophosphate pesticides exposure: a meta-analysis. Environ Pollut. (2017) 231:319–28. doi: 10.1016/j.envpol.2017.08.028
49. Mortazavi N, Asadikaram G, Ebadzadeh MR, Kamalati A, Pakmanesh H, Dadgar R, et al. Organochlorine and organophosphorus pesticides and bladder cancer: A case-control study. J Cell Biochem. (2019) 120:14847–59. doi: 10.1002/jcb.28746
50. Lynch SM, Vrieling A, Lubin JH, Kraft P, Mendelsohn JB, Hartge P, et al. Cigarette smoking and pancreatic cancer: a pooled analysis from the pancreatic cancer cohort consortium. Am J Epidemiol. (2009) 170:403–13. doi: 10.1093/aje/kwp134
51. Garabrant DH, Held J, Langholz B, Peters JM, Mack TM. DDT and related compounds and risk of pancreatic cancer. JNCI. (1992) 84:764–71. doi: 10.1093/jnci/84.10.764
52. Wei DH, Mao QQ. No association between pesticide exposure and pancreatic cancer risk: a meta-analysis. Int J Clin Exp Med. (2018) 11:12917–25. Available online at: https://www.ijcem.com/files/ijcem0074550.pdf
53. Porta M, Gasull M, Pumarega J, Kiviranta H, Rantakokko P, Raaschou-Nielsen O, et al. Plasma concentrations of persistent organic pollutants and pancreatic cancer risk. Int J Epidemiol. (2022) 51:479–90. doi: 10.1093/ije/dyab115
54. Lee WJ, Sandler DP, Blair A, Samanic C, Cross AJ, Alavanja MC, et al. Pesticide use and colorectal cancer risk in the agricultural health study. Int J Cancer. (2007) 121:339–46. doi: 10.1002/ijc.22635
55. Botteri E, Iodice S, Bagnardi V, Raimondi S, Lowenfels AB, Maisonneuve P, et al. Smoking and colorectal cancer. JAMA. (2008) 300:2765. doi: 10.1001/jama.2008.839
56. Tsoi KK, Pau CY, Wu WK, Chan FK, Griffiths S, Sung JJ, et al. Cigarette smoking and the risk of colorectal cancer: a meta-analysis of prospective cohort studies. Clin Gastroenterol Hepatol. (2009) 7:682–8. doi: 10.1016/j.cgh.2009.02.016
57. Bonner MR, Freeman LEB, Hoppin JA, Koutros S, Sandler DP, Lynch CF, et al. Occupational exposure to pesticides and the incidence of lung cancer in the agricultural health study. Environ Health Perspect. (2017) 125:544–51. doi: 10.1289/EHP456
58. U.S. Department of Agriculture. Farm Sector Financial Indicators, State Rankings. (2021) Available online at: https://data.ers.usda.gov/reports.aspx?ID=17839 (accessed August 25, 2023).
59. U.S. Department of Agriculture. Corn: Production Acreage by County. (2022) Available online at: https://www.nass.usda.gov/Charts_and_Maps/Crops_County/cr-pr.php (accessed August 25, 2023).
60. U.S. Department of Agriculture. 2017 Census of Agriculture Highlights: Vegetable Production. (2019) Available online at: https://www.nass.usda.gov/Publications/Highlights/2019/2017Census_Vegetable_Production.pdf (accessed August 25, 2023).
61. Florida Florida Department of Agriculture and Consumer Services Florida Agriculture Overview and Statistics. (2021). Available online at: https://www.fdacs.gov/Agriculture-Industry/Florida-Agriculture-Overview-and-Statistics (accessed August 25, 2023).
62. Mills PK, Dodge J, Yang R. Cancer in migrant and seasonal hired farm workers. J Agromed. (2009) 14:185–91. doi: 10.1080/10599240902824034
Keywords: herbicides, fungicides, insecticides, SVI, LCA
Citation: Gerken J, Vincent GT, Zapata D, Barron IG and Zapata I (2024) Comprehensive assessment of pesticide use patterns and increased cancer risk. Front. Cancer Control Soc. 2:1368086. doi: 10.3389/fcacs.2024.1368086
Received: 09 January 2024; Accepted: 05 June 2024;
Published: 25 July 2024.
Edited by:
Chitra Thakur, Stony Brook University, United StatesReviewed by:
Arjun Katailiha, University of Texas MD Anderson Cancer Center, United StatesAnurima Baidya, Johns Hopkins University, United States
Copyright © 2024 Gerken, Vincent, Zapata, Barron and Zapata. This is an open-access article distributed under the terms of the Creative Commons Attribution License (CC BY). The use, distribution or reproduction in other forums is permitted, provided the original author(s) and the copyright owner(s) are credited and that the original publication in this journal is cited, in accordance with accepted academic practice. No use, distribution or reproduction is permitted which does not comply with these terms.
*Correspondence: Isain Zapata, aXphcGF0YUBydnUuZWR1