 Sushmita Katuwal1*
 Eero Pukkala1,2
 Miia Artama1,3Satu Männistö3
 Jaakko Tuomilehto3,4,5
 Pekka Jousilahti3
- 1Health Sciences Unit, Faculty of Social Sciences, Tampere University, Tampere, Finland
- 2Finnish Cancer Registry, Institute for Statistical and Epidemiological Cancer Research, Helsinki, Finland
- 3Department of Public Health and Welfare, Finnish Institute for Health and Welfare, Helsinki, Finland
- 4Department of Public Health, University of Helsinki, Helsinki, Finland
- 5Saudi Diabetes Research Group, King Abdulaziz University, Jeddah, Saudi Arabia
Introduction: This study aimed to determine all-cause and cause-specific mortality and, their time trends among adults with cancer, particularly among those who survived at least 5 years after cancer diagnosis, in comparison with mortality in the general population of the same age and sex.
Methods: The data on people with cancer were obtained from Finnish Cancer Registry and their underlying causes of death was obtained from Statistics Finland. All-cause and cause-specific standardized mortality ratios (SMR) and their 95% confidence intervals (CIs) were calculated for 327,585 people with cancer diagnosed between 1971 and 2000 and followed up until December 2012, stratified by decade and age of cancer diagnosis, sex, and type of cancer.
Results: In the working age (25–64 years), 50% of men and 74% of women diagnosed during 1991–2000 were alive 5 years of diagnosis; the corresponding proportions during 1971–1980 were 29 and 54%. Among the elderly people (65–74 years), corresponding proportions were 40 and 49%, and 19 and 32% in men and women, respectively. During the follow-up of 5–12 years, the all-cause SMR among working age people with cancer diagnosed 1971–2000 was 2.5 (95% CI 2.4–2.5) in men and 3.6 (95% CI 3.5–3.6) in women. A 20% excess mortality due to cardiovascular diseases was observed among working-age people in both sexes. Highest all-cause SMRs were observed among working age people with lung cancer in 1991–2000 (men 5.1, 95% CI 4.5–5.8: women 8.1, 95% CI 6.5–11). People diagnosed with cancer at an adult age in Finland have higher SMR in the follow-up category of 5–11.9 years but the absolute excess mortality for all calendar periods 1971–2000 combined in the older age category (3,448 per 100,000) is higher than in the younger category (2,247 per 100,000).
Discussion: Although the primary cause of death among cancer patients is cancer itself, increased SMRs of other conditions such as infections could indicate possible effect of cancer treatments as well as presence of shared risk factors among these diseases.
Introduction
Globally, 1 in 10 women and 1 in 8 men are expected to get cancer during their life course (1). In Finland, 1 in 3 people are expected to get cancer during their lifetime with more than 30,000 new diagnoses each year in the population of 5.6 million (2). Even though cancer may be diagnosed at any age, the risk of most cancer types increases sharply with increasing age. Etiology of cancer is multifactorial and can be related to lifestyles, exposure to environmental and occupational hazards, clinical and sub-clinical infections, socioeconomic status, as well as obstetric history, and genetic factors (3–14).
Cancers comprise a heterogenic group of diseases causing a variety of symptoms and having different treatments. The prognosis depends on the histological type, anatomic location and the spread of the tumor, treatments and patient-related risk factors. Globally, the five most common types of cancer are cancers of the lung, breast, colorectum, prostate, and stomach (3). These cancers are responsible for more than half of the total of 19 million new cancer cases in the world annually (3). In most developed countries the age-adjusted cancer incidence has remained relatively stable and age-adjusted cancer mortality has decreased during the last decades whereas in low- and middle-income (LMI) countries both cancer incidence and mortality are increasing (1). Cancer profiles are different in LMI and developed countries: lung, liver and stomach cancers cause a major part of total cancer burden in LMI countries whereas, prostate, breast and colorectal cancers are the main cancer forms in developed countries (3).
Due to improvements in early diagnosis and treatment, and changes in cancer patterns, 5 year survival of cancer patients has continuously improved in developed countries; approximately two thirds of cancer patient are alive after 5 years of cancer diagnosis (15–23). In Finland, the 5 year age-standardized relative survival in 2020 was estimated to be 68% among male and 72% among female cancer patients, and similar survival estimates have been observed for other Nordic countries (16). However, less is known about the all-cause and cause-specific mortality of the cancer patients and how long-term mortality among cancer patients has changed over time and to what extent it may differ from mortality in the general population.
The aim of the present study was to determine all-cause and cause-specific standardized mortality ratios (SMR) and their time trends over three decades among the Finnish adults with cancer diagnosed between 1971 and 2000 at age of 25 to 74 years, with special focus on those who survived 5 years after the cancer diagnosis.
Materials and methods
The study cohort consists of 327,585 people with cancer diagnosed between 1971 and 2000 and registered in the national population-based Finnish Cancer Registry (FCR). Of them 189,521 were diagnosed at age 25 to 64 years, and 138,064 at the age of 65 to 74 years. The FCR was established in 1952 and since 1961 reporting of all new cancer cases to the Registry has been mandatory for all health care providers (24). The FCR collects data from three sources: from hospitals, pathological laboratories and from the national Causes of Death Register. The FCR has a continuous quality control, and all clinical reports and mortality data are systematically checked and, if needed, additional data are requested.
The mortality follow-up of the cohort was done by using computerized linkage with the national Causes of Death Register of Statistics Finland until the end of 2012. The underlying cause of death as given in death certificate was categorized into 54 categories based on the different versions of the International Classification of Diseases (ICD). ICD-8 was used in Finland from 1969 to 1986, national adaption of ICD-9 from 1987 to 1995 and ICD-10 from 1996 onwards. The linkage was done by using the unique personal identity code established in 1967 for all people living in Finland.
SMRs were calculated by the decade of cancer diagnosis (1971–1980, 1981–1990, 1991–2000), period of follow-up after the diagnosis (<1, 1–4.99, and 5–11.99 years), type of cancer and the underlying cause of death. The mortality in the follow-up of 5–11.99 years is referred as long-term mortality later in this document. The numbers of observed deaths and person-years at risk were counted, by 5 year age groups, separately for men and women, and for seven 6 year calendar periods during 1971 to 2012. For people who emigrated during the study period, the calculation of person-years ended on the date of emigration. The expected number of deaths (for specific causes and overall) was calculated by multiplying the number of person-years in each stratum by the corresponding mortality rate among the Finnish general population. To calculate the SMR for broader age ranges, the age-specific observed number of deaths were added up and divided by the sum of expected numbers of the respective age categories. The 95% confidence intervals (CI) for the SMR were based on the assumption that the number of observed deaths followed a Poisson distribution.
The analyses were done separately for men and women and stratified by age at diagnosis: working age people (25–64 years) and elderly people (65–74 years). The maximum follow-up time for the most recent cancer patients was 12 years and therefore the follow-up was ended at 12 years. For this study, the causes of death were analyzed in the following broad main categories: cancer (malignant neoplasms, ICD-10 codes C00-C97), cardiovascular diseases (I00-I99), infectious diseases (A00-B99), suicides (X60-X84, Y87.0) and all-cause mortality. The SMRs were calculated for all cancers combined, and separately for the five most common cancers in Finnish men (prostate, lung, colorectal, urinary bladder and urinary tract, and non-Hodgkin lymphoma) and women (breast, colorectal, uterus, lung, and central nervous system).
The study was conducted according to the Helsinki Declaration on Medical Research and the Finnish law on registry-based studies without access to individual patient data. The funding sources did not have any role in the planning of study design, data analysis, reporting or decision to submit the paper for publication.
Results
A total of 221,946 deaths were observed during the follow-up, of which 109,360 occurred among people diagnosed at age 25–64 years and 112,586 among people diagnosed at age 65–74 years. The proportion of people with cancer surviving 5 years after diagnosis increased markedly over the decades. Out of the working age people with cancer, 50% of men and 74% of women diagnosed during 1991 to 2000 were alive 5 years after diagnosis compared with 29 and 54% among those diagnosed during 1971 to 1980. Out of the elderly people with cancer 40% of men and 49% of women diagnosed during 1991 to 2000 were alive 5 years after diagnosis compared with 19 and 32%, respectively, among those diagnosed during 1971 to 1980 (Table 1).
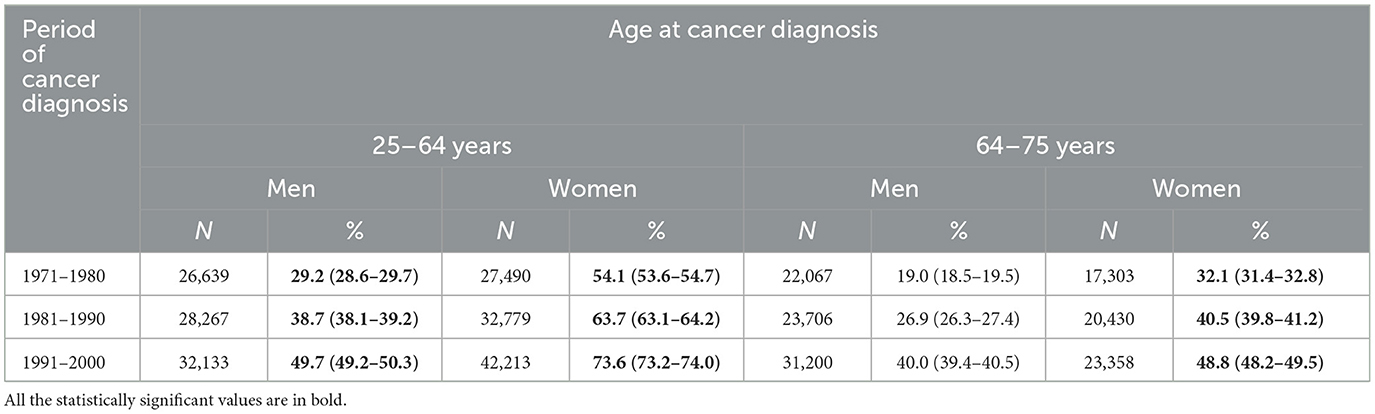
Table 1. Numbers and 5 year crude survival (%) (95% CI) of people diagnosed with cancer by the period of cancer diagnosis, sex, and age at diagnosis.
All-cause mortality trends by the period of follow-up
Among the working age men with cancer, the all-cause SMR during the first 5 years of follow-up did not practically change during the three decades of cancer diagnoses. The SMR was ~32 during the first year and 8.8 during the next 4 years of follow-up (Table 2). Among the working age women with cancer, the SMR during the first year of follow-up decreased from 48 in the 1970's to 34 in the 1990's, and during the second to fifth years of follow-up from 13 to 11, respectively. During the follow up of 5–11.99 years, the SMR was about 2.5 in men and 3.5 in women diagnosed with cancer at working age irrespective of decade of the cancer diagnosis.
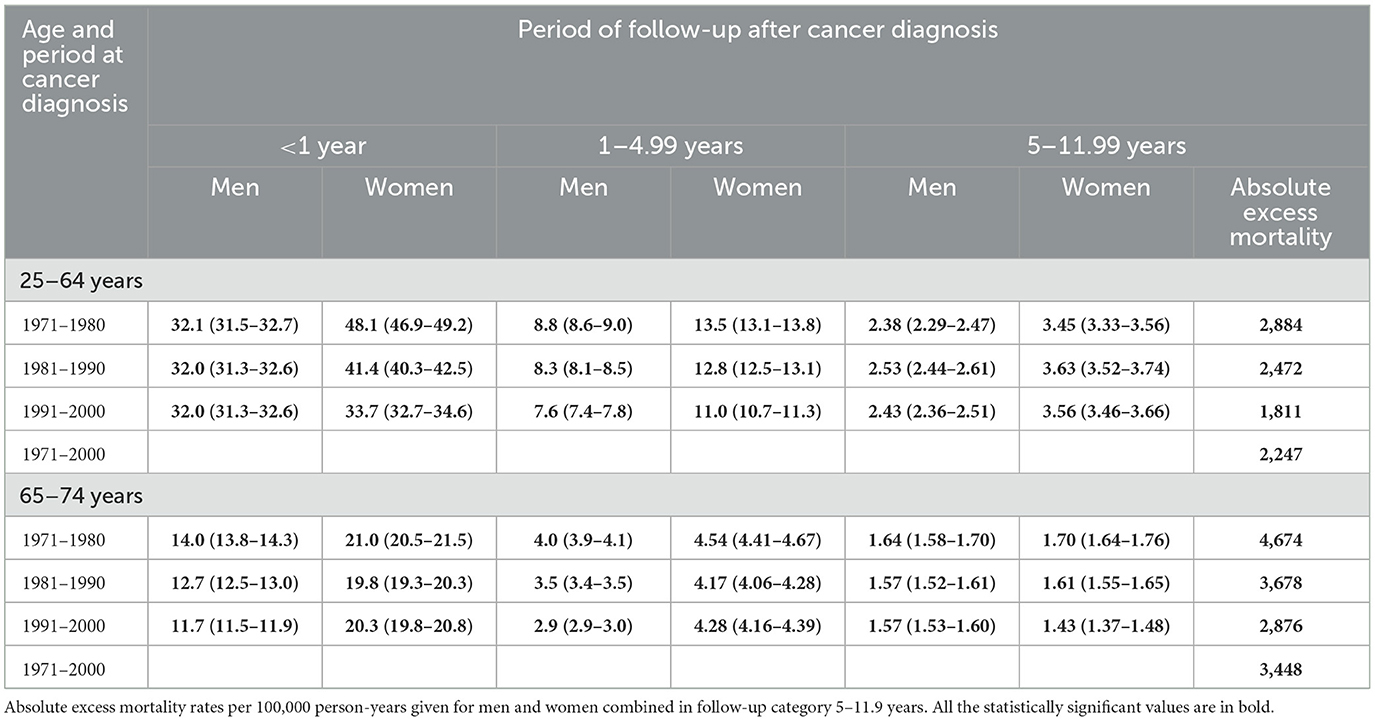
Table 2. Standardized all-cause mortality ratios (95% CI) of people diagnosed with cancer patients, by age at diagnosis, sex period of cancer diagnosis, and follow-up period after the diagnosis.
Among men diagnosed with cancer in ages of 65–74 years, the SMRs for the first year and subsequent 4 years of follow-up, decreased slightly over the decades, being 14 and 4.0 among the men diagnosed in the 1970's, and 12 and 2.9 among those diagnosed in the 1990's (Table 2). Among women diagnosed with cancer in the elderly the short-time SMRs did not change much over time. During the follow-up of 5–11.99 years, the SMR in elderly men with cancer was ~1.6 among cancer patients in each decade, while in the elderly women, the SMR decreased slightly from 1.7 in the first to 1.4 in the latest decade of cancer diagnosis. In the long-term follow-up (5–11.9 years), the absolute excess mortality for calendar period combined 1971–2000 in the older age category (3,448 per 100,000) is higher than in the younger category (2,247 per 100,000) (Table 2).
Trends in long-term all-cause mortality by the cancer type
The all-cause SMRs among men with prostate cancer and among women with breast and central nervous system cancer patients decreased to some extent over the three decades both among the working age and elderly cancer people (Table 3). Among people with lung cancer, in contrary, the SMRs increased over the three decades in both sexes and both age groups. An increasing trend in SMR over the three decades was also observed among the working age people for colorectal and uterus cancer.
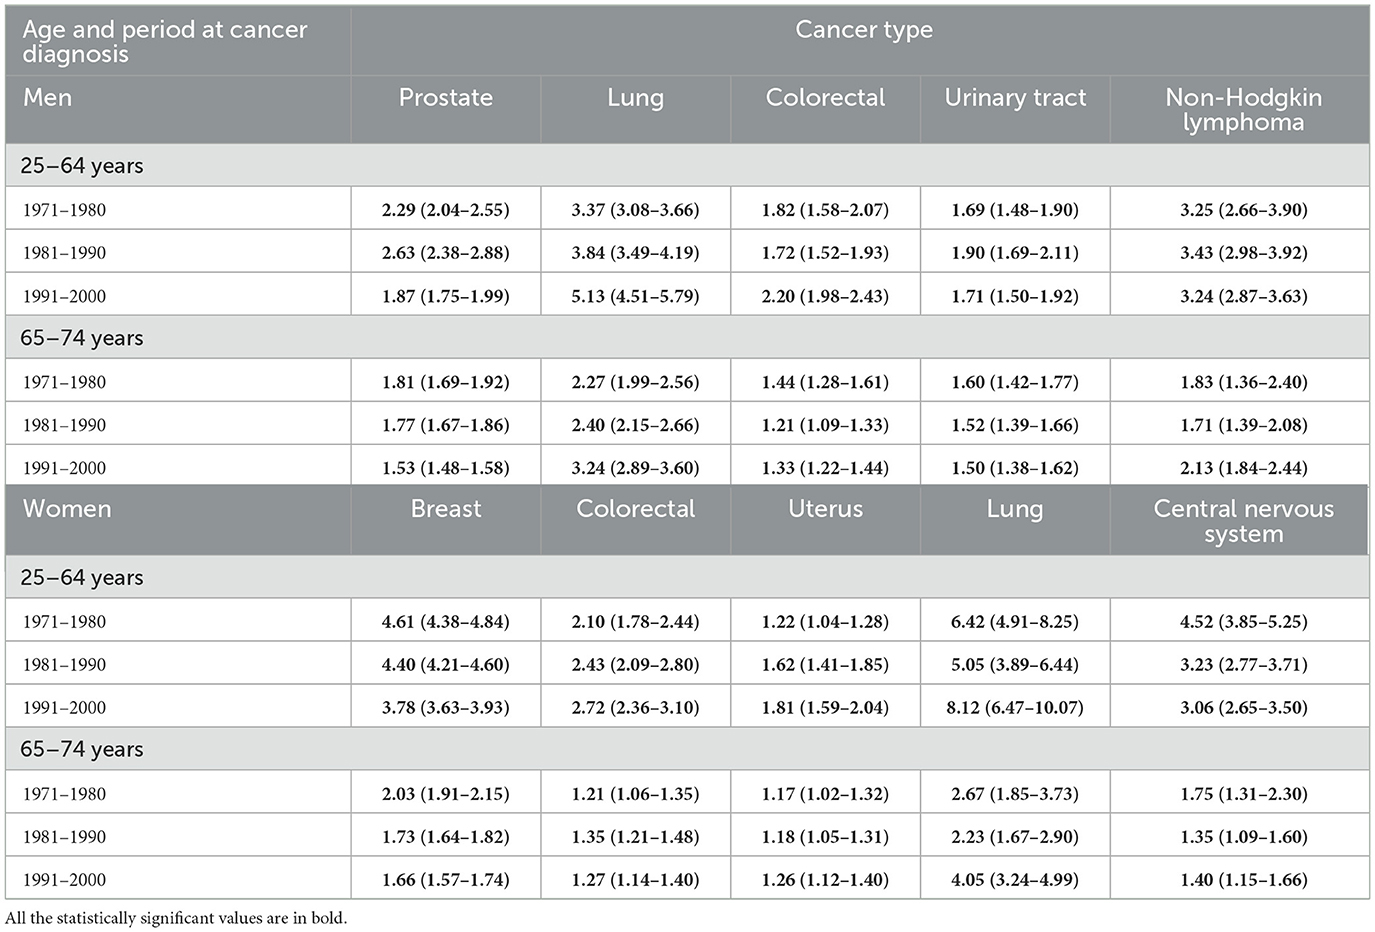
Table 3. Standardized all-cause mortality ratios (95% CI) of people diagnosed with cancer patients during the follow-up period of 5–11.99 years after the cancer diagnosis, by sex, age at diagnosis, period of cancer diagnosis, and type of cancer.
Cause-specific long-term mortality trends
After 5 years from cancer diagnosis, increased mortality was mainly due to cancer deaths among the people diagnosed with cancer at working age even though the SMR for cancer decreased from 6.0 to 5.4 among men, and from 8.9 to 6.9 among women diagnosed in the 1970's and 1990's, respectively (Table 4). The SMRs for cardiovascular diseases were similar (~1.2) for men and women with cancer diagnosed at working age in the 1970's and 1990's. Among the working age men with cancer, the SMR for infectious diseases mortality increased from 1.3 to 2.1 between the 1970's and 1990's. The SMR for suicide was 0.67 among women with cancer diagnosed at working age in the 1970's and increased to 1.7 among women diagnosed with cancer in the 1990's.
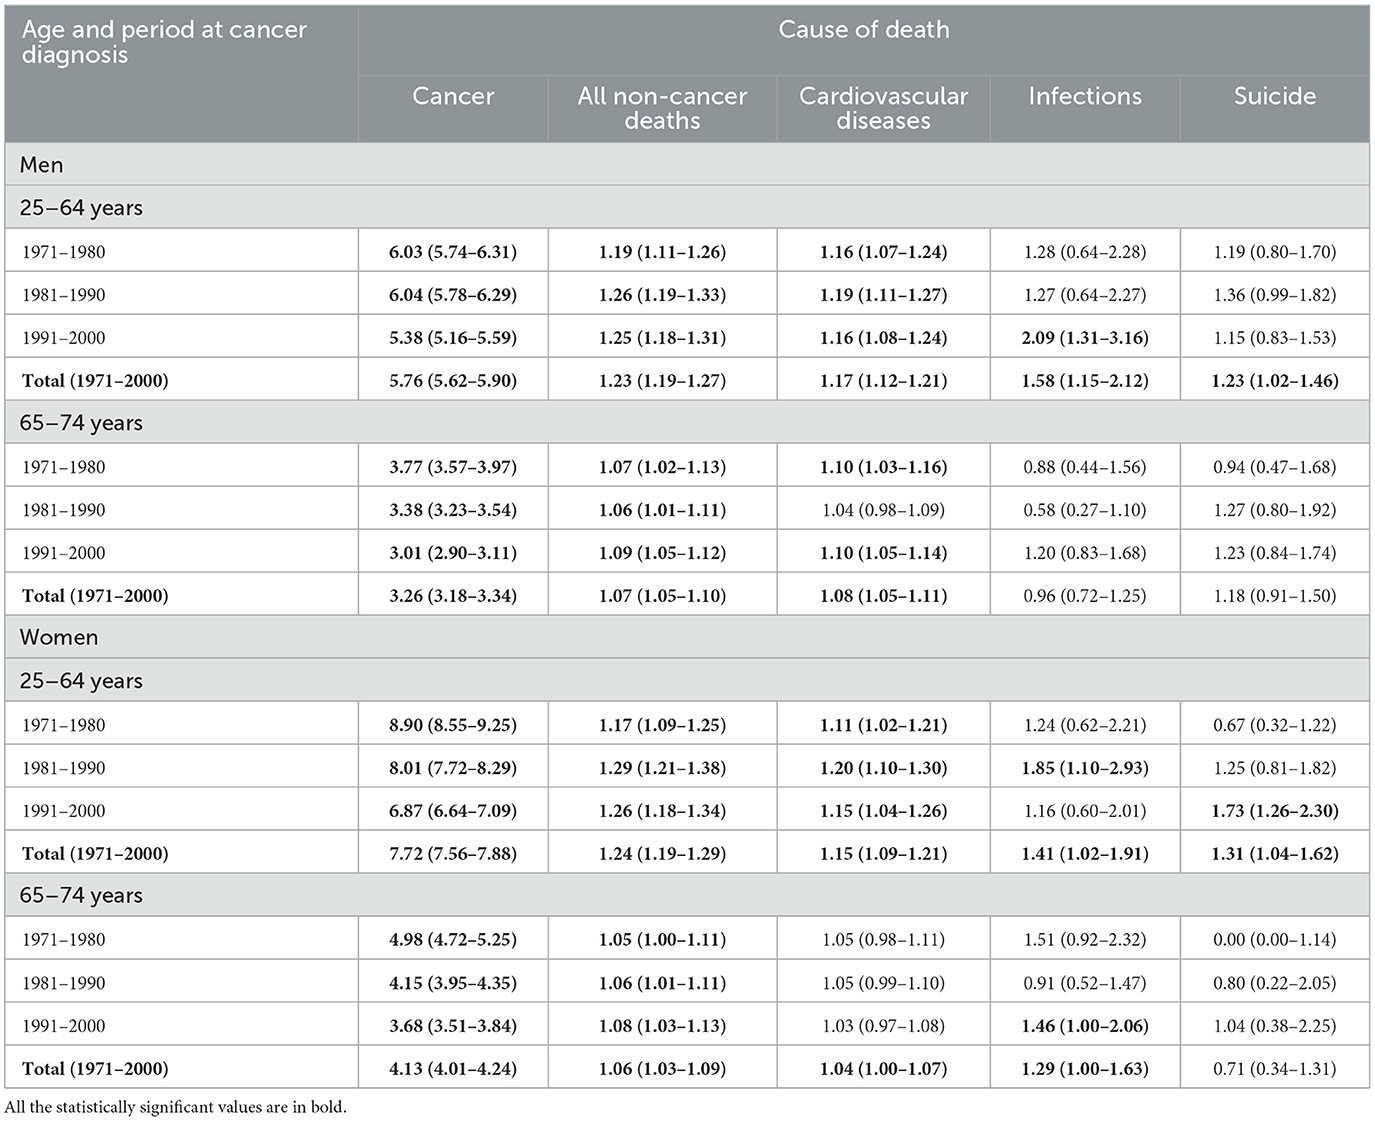
Table 4. Standardized cause specific mortality ratios (95% CI) of all cancer patients during the follow-up period of 5–11.99 years after the cancer diagnosis, by sex, age, and period of cancer diagnosis.
Among people diagnosed with cancer in ages of 65–74 years, excess mortality after 5 years from cancer diagnosis was mainly due to cancer deaths. The SMR for cancer mortality decreased by the decade of the cancer diagnosis; in men it was 3.8 in people diagnosed in the 1970's and fell to 3.0 among those diagnosed in the 1990's. In women with cancer the SMRs were 5.0 and 3.7, respectively (Table 4). The SMR for cardiovascular diseases was 1.0 to 1.1, respectively, among men and women diagnosed with cancer in the elderly, and there was no difference by the decade of cancer diagnosis. Mortality due to infectious diseases, accidents and violence or suicides among the elderly people with cancer did not differ markedly from the mortality among the general population by sex, age and period of cancer diagnosis.
Discussion
Despite of marked improvement in survival of people with cancer, they still have markedly higher long-term mortality than the general population of the same age and sex. All-cause SMRs in people suffering from prostate, breast, or central nervous system cancer improved from the 1970's to the 1990's whereas an opposite trend is observed among those with lung cancer and to some extent also among the working age people with colorectal or uterus cancer. Even after 5 years from the cancer diagnosis, a vast majority of excess mortality among people with cancer is due to cancer itself.
For some cancers, we know several factors associated with their risk, but their causal relationship is not clear. Even if the causality has been established, the known risk factors may explain only a small fraction of the development of cancer, or such risk factors are not modifiable. In these cancers, early diagnosis and screening, and efficient early treatment are the only tools to reduce disability and mortality due to the disease at the moment; cervical and breast cancers are two common examples where the gain of screening is very strong for these type of cancers (1, 10, 25, 26).
In our study, increased all-cause SMRs were observed among lung cancer patients in both sexes and all age groups. Although the overall prevalence of smoking has declined over time in Finland, the decline started much later and was slower among people in lower socio-economic groups as compared to higher socio-economic groups which caused higher overall all-cause SMR among lung cancer patients who more and more represent lowest socioeconomic groups (27, 28). The excess overall mortality also markedly increased in female lung cancer patients in the most recent period in our study. The recent increase in all-cause SMR among female lung cancer patients could also be associated with the increase of smoking in the lower socio-economic groups: the fraction of female lung cancer patients representing low socioeconomic groups with highest all-cause mortality has increased from the 1970's to the 1990's (27–30).
The number of new prostate cancer diagnoses has increased sharply in developed countries during the last 20 years due to the introduction of sensitive laboratory test, prostate specific antigen (PSA), and aging of the population (1, 31, 32). It is still debated, however, whether the real age-adjusted incidence of prostate cancer has changed and whether the PSA screening in the general population should be implemented (33). The SMR for all-cause mortality among men with prostate cancer in our study slightly decreased in the recent periods compared with the earlier periods. Along with strongly increased PSA testing since the 1990's the prostate cancer has changed to a disease with very high survival and prostate cancer patients have a more similar mortality pattern as the general male population (16). We also observed that all-cause SMR among women with breast cancer decreased toward the recent periods. The increased survival among women with breast cancer may be due to earlier diagnoses in mammographic screening and adjuvant treatments (31, 34). This may, however, be due to “lead-time bias;” i.e., survival time appears longer because diagnosis is done earlier (for instance, by screening), irrespective of whether the person actually lived longer. The organized mammographic screening in Finland started in late 1980's and it increased the number of localized breast cancers. This may have caused a similar effect in the SMR pattern of breast cancer patients as described for prostate cancer after increased PSA testing. Overall, we observed that the all-cause SMR of people with specific cancers changed over time period, but the overall SMR for all cancer sites combined have remained more or less unchanged.
It has been estimated that about one third of cases of 12 selected cancers combined are preventable by healthy diet, active lifestyle and maintaining normal weight (35). For instance, exposure to tobacco smoke causes 80–90% of lung cancer, and cervical cancer is rare without HPV infection (36–38). However, our findings suggest that in addition to the preventing the incidence of cancer, the changes in lifestyle such as reduced smoking and alcohol consumption, healthier diet, increased physical activity, and avoiding obesity could eliminate the excess death from other cancer and non-cancer causes among people with cancer (1, 39–41). Among people with cancer excess SMRs were seen for causes other than cancer such as cardiovascular disease and infections. The SMR due to infections increased in the recent periods compared with the previous periods in our study. Although the incidence of cancers caused by infectious agents such as HPV and Helicobacter pylori has decreased in recent period as compared to earlier periods in Finland, the increase in infection-related mortality could be a result of suppressed immune system due to cancer and its treatments. Earlier studies also suggested that the increased risk of infections among the cancer patients could be because of cancer itself as well the treatments that reduce immune factors (42, 43). Increased mortality due to cardiovascular disease and infections among cancer patients may also be due to shared risk factors between these diseases (44, 45). Reproductive history and lifestyle factors such as diet, smoking and physical inactivity are associated with several diseases including cardiovascular diseases and several cancer types. It was, however, noticeable in this study that the excess risk of cardiovascular mortality was modest in all groups and no excess was observed among postmenopausal women. One possible explanation for this might be that for women, lifestyle factors such as postmenopausal hormonal replacement therapy which increases the risk of a most common cancer, i.e., breast cancer might have been protective against the risk of cardiovascular diseases as indicated in previous studies (44, 46). Lifestyle factors such as consumption of heavy alcohol are important risk factors for viral infection such as hepatitis and alcohol consumptions is also important risk factors for cancers of colorectal, breast, liver and stomach. As a consequence, mortality patterns among people with cancer may provide indirect information on potential risk factors associated with causation of the cancer (46).
In clinical praxis, cancer is often considered as cured if the person does not have any signs of active disease after 5 years of diagnosis and start of the treatment, and clinical controls may be stopped (47). Even though the risk of cancer of remission is increased also after 5 years, our findings should not be directly interpreted as an indication for the need of longer clinical follow-up. The length of follow-up needs to be decided based on the type of cancer and individual factors such as age and occurrence of other diseases. A longer clinical follow-up may be justified if it can improve the prognosis, preferably measured as longer healthy survival time.
Based on international comparisons, treatment and survival of people with cancer in Finland is one of the best in the world (15–17). Therefore, our results most probably show one of the best scenarios on mortality among people with cancer. In countries where access to cancer treatment is limited, the LMI countries in particular, prevention of cancer is even more important.
The main strengths of our study are a large and comprehensive cancer registry database including practically all cases of cancer diagnosed in Finland over three decades, comprehensive mortality follow-up data over 42 years, and population-based cause-of-death data which made it possible to calculate accurate SMRs compared with the general population. The present article mainly reports findings related to all cancers combined. The results for specific cancer types are only presented briefly. Since cancers form a heterogenic group of diseases, a more detailed analysis for specific cancer types–also including their treatment in the analysis–needs to be done in the future.
Conclusions
Our study concludes that the long-term mortality among people with cancer is markedly higher compared to general population in Finland and has not changed in the last decades despite the improved survival of people with cancer. A clear increase in all-cause SMR was observed for lung cancer among both sexes in recent periods, and slight reduction was observed for breast and prostate cancer. While majority of cancer patients continue to die primarily from cancer itself, our results showed an increased SMR of infections which might indicate the possible effect of cancer treatments as well as shared risk factors between these diseases. In addition, increased suicide among young cancer patients, particularly among young women in recent decade indicate that these people might benefit from better counseling and support strategies after diagnosis.
Data availability statement
The datasets presented in this article are not readily available because this is the registry-based data from Finland and available only upon the data-permit application. Requests to access the datasets should be directed to National Institute of Health and Welfare, Finland.
Author contributions
PJ was the principal planner of the study. SK and PJ wrote the manuscript. EP did the statistical analyses and had a full access to all individual-level data. All authors participated in the planning of the study design and did a critical review of the manuscript.
Funding
The study was funded by the Finnish Institute for Health and Welfare (Finland), supported by a grant from the Finnish Cancer Research Foundation.
Conflict of interest
The authors declare that the research was conducted in the absence of any commercial or financial relationships that could be construed as a potential conflict of interest.
The author JT declared that they were an editorial board member of Frontiers at the time of submission. This had no impact on the peer review process and the final decision.
Publisher's note
All claims expressed in this article are solely those of the authors and do not necessarily represent those of their affiliated organizations, or those of the publisher, the editors and the reviewers. Any product that may be evaluated in this article, or claim that may be made by its manufacturer, is not guaranteed or endorsed by the publisher.
References
1. Wild PC, Weiderpass E, Stewart WB. World Cancer Report. Cancer Research for Cancer Prevention. (2020). Lyon: International Agency for Research on Cancer.
2. Pitkäniemi J, Malila N, Tanskanen T, Degerlund H, Heikkinen S, Seppä K. Cancer in Finland 2020. (2022). Helsinki: Cancer Society of Finland.
3. Sung H, Ferlay J, Siegel RL, Laversanne M, Soerjomataram I, Jemal A, et al. Global cancer statistics 2020: GLOBOCAN estimates of incidence and mortality worldwide for 36 cancers in 185 countries. CA Cancer J Clin. (2021) 71:209–49. doi: 10.3322/caac.21660
4. Crosbie EJ, Einstein MH, Franceschi S, Kitchener HC. Human papillomavirus and cervical cancer. Lancet. (2013) 382:889–99. doi: 10.1016/S0140-6736(13)60022-7
5. Vohlonen I, Pukkala E, Malila N, Härkönen M, Hakama M, Koistinen V, et al. Risk of gastric cancer in Helicobacter pylori infection in a 15-year follow-up. Scand J Gastroenterol. (2016) 51:1159–64. doi: 10.1080/00365521.2016.1183225
6. Ng M, Freeman MK, Fleming TD, Robinson M, Dwyer-Lindgren L, Thomson B, et al. Smoking prevalence and cigarette consumption in 187 countries, 1980-2012. JAMA. (2014) 311:183–92. doi: 10.1001/jama.2013.284692
7. Ng M, Fleming T, Robinson M, Thomson B, Graetz N, Margono C, et al. Global, regional, and national prevalence of overweight and obesity in children and adults during 1980-2013: a systematic analysis for the global burden of disease study 2013. Lancet. (2014) 384:766–81. doi: 10.1016/S0140-6736(14)60460-8
8. Di Cesare M, Khang YH, Asaria P, Blakely T, Cowan MJ, Farzadfar F, et al. Inequalities in non-communicable diseases and effective responses. Lancet. (2013) 381:585–97. doi: 10.1016/S0140-6736(12)61851-0
9. Weiderpass E. Lifestyle and cancer risk. J Prev Med Public Health. (2010) 43:459–71. doi: 10.3961/jpmph.2010.43.6.459
10. Weiderpass E, Meo M, Vainio H. Risk factors for breast cancer, including occupational exposures. Saf Health Work. (2011) 2:1–8. doi: 10.5491/SHAW.2011.2.1.1
11. World Cancer Research Fund and American Institute for Cancer Research. Diet, Nutrition, Physical Activity, and Cancer: A Global Perspective. Continuous Update Project Expert Report (2018).
12. Murray CJL, Aravkin AY, Zheng P, Abbafati C, Abbas KM, Abbasi-Kangevari M, et al. Global burden of 87 risk factors in 204 countries and territories, 1990–2019: a systematic analysis for the global burden of disease study 2019. Lancet. (2020) 396:1223–49. doi: 10.1016/S0140-6736(20)30752-2
13. Mucci LA, Hjelmborg JB, Harris JR, Czene K, Havelick DJ, Scheike T, et al. Nordic twin study of cancer (NorTwinCan) collaboration. familial risk and heritability of cancer among twins in Nordic countries. JAMA. (2016) 315:68–76. doi: 10.1001/jama.2015.17703
14. GBD 2013 Mortality and Causes of Death Collaborators. Global, regional, and national age-sex specific all-cause and cause-specific mortality for 240 causes of death, 1990–2013: a systematic analysis for the Global Burden of Disease Study 2013. Lancet. (2015) 385:117–71. doi: 10.1016/S0140-6736(14)61682-2
15. Allemani C, Weir HK, Carreira H, Harewood R, Spika D, Wang X, et al. Global surveillance of cancer survival 1995–2009: analysis of individual data for 25 676 887 patients from 279 population-based registries in 67 countries (CONCORD-2). Lancet. (2015) 385:977–1010. doi: 10.1016/S0140-6736(14)62038-9
16. Larønningen S, Ferlay J, Beydogan H, Bray F, Engholm G, Ervik M. NORDCAN: Cancer Incidence, Mortality, Prevalence Survival in the Nordic Countries, Version 9.2 (23.06.2022). Association of the Nordic Cancer Registries. Cancer Registry of Norway (2022). Available online at: https://nordcan.iarc.fr/ (accessed July 25, 2023).
17. Baili P, Di Salvo F, Marcos-Gragera R, Siesling S, Mallone S, Santaquilani M, et al. Age and case mix-standardised survival for all cancer patients in Europe 1999-2007: results of EUROCARE-5, a population-based study. Eur J Cancer. (2015) 51:2120–9. doi: 10.1016/S1470-2045(13)70548-5
18. Berrino F, Verdecchia A, Lutz JM, Lombardo C, Micheli A, Capocaccia R, et al. Comparative cancer survival information in Europe. Eur J Cancer. (2009) 45:901–8. doi: 10.1016/j.ejca.2009.01.018
19. Sant M, Chirlaque Lopez MD, Agresti R, Sánchez Pérez MJ, Holleczek B, Bielska-Lasota M, et al. Survival of women with cancers of breast and genital organs in Europe 1999-2007: results of the EUROCARE-5 study. Eur J Cancer. (2015) 51:2191–205. doi: 10.1016/j.ejca.2015.07.022
20. Trama A, Foschi R, Larrañaga N, Sant M, Fuentes-Raspall R, Serraino D, et al. Survival of male genital cancers (prostate, testis and penis) in Europe 1999-2007: results from the EUROCARE-5 study. Eur J Cancer. (2015) 51:2206–16. doi: 10.1016/j.ejca.2015.07.027
21. Holleczek B, Rossi S, Domenic A, Innos K, Minicozzi P, Francisci S, et al. On-going improvement and persistent differences in the survival for patients with colon and rectum cancer across Europe 1999-2007–results from the EUROCARE-5 study. Eur J Cancer. (2015) 51:2158–68. doi: 10.1016/j.ejca.2015.07.024
22. Francisci S, Minicozzi P, Pierannunzio D, Ardanaz E, Eberle A, Grimsrud TK, et al. Survival patterns in lung and pleural cancer in Europe 1999-2007: results from the EUROCARE-5 study. Eur J Cancer. (2015) 51:2242–53. doi: 10.1016/j.ejca.2015.07.033
23. Lundberg FE, Andersson TM, Lambe M, Engholm G, Mørch LS, Johannesen TB, et al. Trends in cancer survival in the Nordic countries 1990–2016: the NORDCAN survival studies. Acta Oncol. (2020) 59:1266–74. doi: 10.1080/0284186X.2020.1822544
24. Pukkala E, Engholm G, Højsgaard Schmidt LK, Storm H, Khan S, Lambe M, et al. Nordic cancer registries – an overview of their procedures and data comparability. Acta Oncol. (2018) 57:440–55. doi: 10.1080/0284186X.2017.1407039
25. Rodgers KM, Udesky JO, Rudel RA, Brody JG. Environmental chemicals and breast cancer: an updated review of epidemiological literature informed by biological mechanisms. Environ Res. (2018) 160:152–82. doi: 10.1016/j.envres.2017.08.045
26. Boyle P, Severi G, Giles GG. The epidemiology of prostate cancer. Urol Clin North Am. (2003) 30:209–17. doi: 10.1016/S0094-0143(02)00181-7
27. Pizzato M, Martinsen JI, Heikkinen S, Vignat J, Lynge E, Sparén P, et al. Socioeconomic status and risk of lung cancer by histological subtype in the Nordic countries. Cancer Med. (2022) 11:1850–9. doi: 10.1002/cam4.4548
28. Ruokolainen O, Heloma A, Jousilahti P, Lahti J, Pentala-Nikulainen O, Rahkonen O, et al. Thirty-eight-year trends of educational differences in smoking in Finland. Int J Public Health. (2019) 64:853–60. doi: 10.1007/s00038-019-01228-x
29. Bray FI, Weiderpass E. Lung cancer mortality trends in 36 European countries: secular trends and birth cohort patterns by sex and region 1970-2007. Int J Cancer. (2010) 126:1454–66. doi: 10.1002/ijc.24855
30. Fidler-Benaoudia MM, Torre LA, Bray F, Ferlay J, Jemal A. Lung cancer incidence in young women vs. young men: a systematic analysis in 40 countries. Int J Cancer. (2020) 147:811–9. doi: 10.1002/ijc.32809
31. Kvåle R, Myklebust TÅ, Engholm G, Heinävaara S, Wist E, Møller B. Prostate and breast cancer in four Nordic countries: a comparison of incidence and mortality trends across countries and age groups 1975-2013. Int J Cancer. (2017) 141:2228–42. doi: 10.1002/ijc.30924
32. Center MM, Jemal A, Lortet-Tieulent J, Ward E, Ferlay J, Brawley O, et al. International variation in prostate cancer incidence and mortality rates. Eur Urol. (2012) 61:1079–92. doi: 10.1016/j.eururo.2012.02.054
33. Kjosavik SR, Sørensen KD, Hotakainen K, Grönberg H. A Nordic initiative for a more personal and accurate diagnostic pathway for prostate cancer. Scand J Prim Health Care. (2020) 38:249–50. doi: 10.1080/02813432.2020.1801148
34. Katuwal S, Tapanainen JS, Pukkala E, Kauppila A. The effect of length of birth interval on the risk of breast cancer by subtype in grand multiparous women. BMC Cancer. (2019) 19:199. doi: 10.1186/s12885-019-5404-z
35. World Cancer Research Fund/American Institute for Cancer Research. Diet, Nutrition, Physical Activity and Cancer: A Global Perspective. (2018). Available online at https://www.wcrf.org/dietandcancer
36. Arnheim Dahlström L, Andersson K, Luostarinen T, Thoresen S, Ögmundsdottír H, Tryggvadottír L, et al. Prospective seroepidemiologic study of human papillomavirus and other risk factors in cervical cancer. Cancer Epidemiol Biomarkers Prev. (2011) 20:2541–50. doi: 10.1158/1055-9965.EPI-11-0761
37. Pedersen K, Fogelberg S, Thamsborg LH, Clements M, Nygård M, Kristiansen IS, et al. An overview of cervical cancer epidemiology and prevention in Scandinavia. Acta Obstet Gynecol Scand. (2018) 97:795–807. doi: 10.1111/aogs.13313
38. Andersson TML, Engholm G, Brink A, Pukkala E, Stenbeck M, Tryggvadottir L, et al. Tackling the tobacco epidemic in the Nordic countries and lower cancer incidence by 1/5 in a 30-year period—the effect of envisaged scenarios changing smoking prevalence. Eur J Cancer. (2018) 103:288–98. doi: 10.1016/j.ejca.2018.02.031
39. Andersson TML, Engholm G, Lund ASQ, Lourenço S, Matthiessen J, Pukkala E, et al. Avoidable cancers in the Nordic countries—the potential impact of increased physical activity on postmenopausal breast, colon and endometrial cancer. Eur J Cancer. (2019) 110:42–8. doi: 10.1016/j.ejca.2019.01.008
40. Andersson TML, Weiderpass E, Engholm G, Lund ASQ, Olafsdottir E, Pukkala E, et al. Avoidable cancer cases in the Nordic countries—the impact of overweight and obesity. Eur J Cancer. (2017) 79:106–18. doi: 10.1016/j.ejca.2017.03.028
41. Andersson TML, Engholm G, Pukkala E, Stenbeck M, Tryggvadottir L, Storm H, et al. Avoidable cancers in the Nordic countries—the impact of alcohol consumption. Eur J Cancer. (2018) 103:299–307. doi: 10.1016/j.ejca.2018.03.027
42. Kaplan HG, Malmgren JA, Atwood MK, Calip GS. Effect of treatment and mammography detection on breast cancer survival over time: 1990-2007. Cancer. (2015) 121:2553–61. doi: 10.1002/cncr.29371
43. Zaorsky NG, Churilla TM, Egleston BL, Fisher SG, Ridge JA, Horwitz EM, et al. Causes of death among cancer patients. Ann Oncol. (2017) 28:400–7. doi: 10.1093/annonc/mdw604
44. Katuwal S, Jousilahti P, Pukkala E. Causes of death among women with breast cancer: a follow-up study of 50 481 women with breast cancer in Finland. Int J Cancer. (2021) 149:839–45. doi: 10.1002/ijc.33607
45. Yang P, Zheng Y, Chen J, Ma H, Yu K, Chen Y, et al. Immediate risk of non-cancer deaths after a cancer diagnosis. BMC Cancer. (2021) 21:963. doi: 10.1186/s12885-021-08707-6
46. Iorga A, Cunningham CM, Moazeni S, Ruffenach G, Umar S, Eghbali M. The protective role of estrogen and estrogen receptors in cardiovascular disease and the controversial use of estrogen therapy. Biol Sex Differ. (2017) 8:33. doi: 10.1186/s13293-017-0152-8
47. European Society for Medical Oncology. Clinical Practice Guidelines. Available online at: https://www.esmo.org/guidelines (accessed November 1, 2022).
Keywords: cancer, mortality, standardized mortality ratios, etiology, causes of death
Citation: Katuwal S, Pukkala E, Artama M, Männistö S, Tuomilehto J and Jousilahti P (2023) Long-term mortality among adults diagnosed with cancer during three decades in Finland. Front. Cancer Control Soc. 1:1228174. doi: 10.3389/fcacs.2023.1228174
Received: 24 May 2023; Accepted: 14 September 2023;
Published: 20 October 2023.
Edited by:
Melanie Keats, Dalhousie University, CanadaReviewed by:
Vinit Nalawade, University of California, San Diego, United StatesMaria Hortlund, Link Medical, Norway
Prithwish De, Ontario Health, Canada
Copyright © 2023 Katuwal, Pukkala, Artama, Männistö, Tuomilehto and Jousilahti. This is an open-access article distributed under the terms of the Creative Commons Attribution License (CC BY). The use, distribution or reproduction in other forums is permitted, provided the original author(s) and the copyright owner(s) are credited and that the original publication in this journal is cited, in accordance with accepted academic practice. No use, distribution or reproduction is permitted which does not comply with these terms.
*Correspondence: Sushmita Katuwal, c3VzaG1pdGEua2F0dXdhbEB0dW5pLmZp