 Nguyen Ba Thuy1
 Pham Van Tien2
 Nguyen Kim Cuong3*
 Pham Khanh Ngoc1Vu Hai Dang4Le Dinh Quyet5
 Sooyoul Kim6
 Cecilie Wettre7
 Lars Robert Hole7
- 1National Hydrometeorological Forecasting Center, Ha Noi, Vietnam
- 2Vietnam Institute of Meteorology, Hydrology and Climate Change, Hanoi, Vietnam
- 3University of Science - Vietnam National University, Hanoi, Vietnam
- 4Institute of Marine Geology and Geophysics, Vietnam Academy of Science and Technology, Hanoi, Vietnam
- 5Southern Regional Hydrometeorological Center, Ho Chi Minh City, Vietnam
- 6Center for Water Cycle Marine Environment and Disaster Management, Kumamoto University, Kumamoto, Japan
- 7Norwegian Meteorological Institute, Bergen, Norway
The abnormal water level rise on the west coast of Ca Mau Peninsula, Vietnam, has dramatically increased as extreme events have intensified in recent decades. To forecast it, it is necessary to understand the mechanism. However, its mechanism has yet to be studied. Based on the numerical simulation results, this study discusses abnormal water level change in a case study during the afternoon of August 2–3, 2019, and 11 July 2022. A coupled model of surge wave and tide (called SuWAT) was applied to simulate the tide, surge, and wind wave. SuWAT’s simulations were validated with the observational data of total water level and significant wave height, and the model could sufficiently reproduce the tidal, wind-induced surge and wave. The findings indicate that the unusual water level fluctuations along the western coast of the Ca Mau Peninsula resulted from a combination of high astronomical tides, storm surges, and waves. Notably, long-period swells substantially contributed to the overall water level, with peak measurements reaching 0.52 m on 3 August 2019, and 0.53 m on 11 July 2022. These surges and swell effects are mainly attributed to the study area’s prolonged and intense southwest monsoon.
1 Introduction
The height of the water level at the coastal area depends on the astronomical tide and residual changes due to other factors, mainly typhoons and strong monsoons. Astronomical tides can be predicted with high confidence for a long time, while surges and waves are non-periodic factors and can only be reliably predicted for a short period of time (1–3 days), depending on the forecasting method. Generally, the surge caused by a monsoon is relatively low compared to that generated by a typhoon. However, surges occurring simultaneously with high tides can be very dangerous, causing flooding, sea dike erosion, strengthening saltwater intrusion, etc.
In Vietnam, storm surges have been of significant research interest, in particular along the north coast, where the frequency of typhoons is higher in comparison with other coastal areas (Thuy, 2003; Chien, 2015; Thai et al., 2017a; Thuy et al., 2017; Thuy et al., 2020). To evaluate storm surges, two traditional physics-based numerical models were used: a decoupled storm surge model (e.g., Thuy, 2003; Thuy et al., 2019) and a coupled model of surge, wave, and tide (Chien, 2015; Thai et al., 2017a; Thuy et al., 2017; Thuy et al., 2020). However, the surge caused by monsoons has not been extensively studied, particularly with regard to numerical modeling approaches. In the central region of Vietnam, such as Tuy Hoa–Phu Yen, in the late and early months of the year, there is an event where an abnormally high water level is accompanied by large waves (popularly known as spring tide) (Thai et al., 2017b). The abnormally high water level change phenomenon in Tuy Hoa, Phu Yen, was analyzed based on observation data of water level and numerical simulations. Results have found that in addition to the tide, the surge induced by the northeast monsoon and the Ekman effect (due to strong coastal currents along the central coast that occur during the northeast monsoon season) is the cause of the surge in the study area (Thai et al., 2017b; Thuy and Tien, 2018; Thuy, 2018; Thuy and Cuong, 2019). Meanwhile, along Vietnam’s Southeast Coast, monsoon-induced surges during high tides contributed up to 50 cm to the water level during the analyzed strong monsoon phase. This makes the region particularly vulnerable to elevated water levels during spring tides (Thanh, 2011; Thuy et al., 2019).
Compared to other coastal regions in Vietnam, the west coast (Figure 1) faces fewer impacts from storms and tropical low-pressure systems. However, abnormal surges accompanied by high waves occurring on a few days during the southwest monsoon season (July to October) cause overflowing of the dike (Figure 1b) and serious coastal erosion, particularly at high astronomical tides. This singular phenomenon has occurred more frequently and caused severe consequences in recent years. This phenomenon occurred in several coastal areas and was discussed, e.g.,: at five Pacific Island nationals (Hoeke et al., 2013); at Cartagena de Indias, Colombia (Andrade et al., 2013); at Roi-Namur Island in the Republic of the Marshall Islands (Cheriton et al., 2016); at Fiji’s Coral Coast (Wandres et al., 2020); at Poole Bay and Christchurch Bay in English Channel (Dhoop and Thompson, 2021); at the Ofu, American Samoa (Cheriton et al., 2024). Their studies confirmed that the arrival of heavy swell from far away has a significant contribution to the abnormal water level rise in the coastal area. Recently, at the West coast of Ca Mau province, the most notable events were on August 2–3, 2019 and 11 July 2022, which were reported by the media and the local authorities. The images capturing the events on 3 August 2019, are shown in Figure 2 (Quyet et al., 2023). The high tide on August 2–3, 2019, caused serious erosion along a length of about 356 m in an area (P2 in Figure 1) with little mangrove forest. According to people living close to the erosion site, around 15:00 on 3 August 2019, the water level rose rapidly, lasting about 30–40 min, crossing the height of a sea dike of 3 m, then fell quickly. In addition to the rising water level, a strong wind blew perpendicular to the sea dike line. In the afternoon of 2 August 2019, there was also an event of water level rise and high waves, but lower than on 3 August 2019. The water level was normal in the days before and after August 2–3, 2019, although the waves were still quite large. According to the local people, the abnormal water level rise occurred on the center coast of Ca Mau province. The coast south of Ca Mau and Kien Giang province (P1, P3, P4, and P5 in Figure 1) did not report any seawater rise. The high tide on 11 July 2022 (https://tuoitre.vn/song-bien-cao-1-7m-lam-sat-lo-nhieu-doan-de-bien-tay-va-ngap-nha-dan-20220711175728756.htm), showed a similar pattern to that of August 2–3, 2019, during which the Song Doc station also recorded notable water level changes (Figure 3b). The phenomenon of water level rise accompanied by large waves on the West coast of Ca Mau province during August 2–3, 2019, has been discussed by Quyet et al., 2023. In this study, the observation data of Phu Quoc, Tho Chu, and Song Doc stations (Figure 1), the ERA5 reanalysis data of wind and wave from the European Center for Medium-Range Weather Forecasts and sea surface height from HYCOM (Hybrid Coordinate Ocean Model) were used. They observed that at the Song Doc station, located approximately 1.5 km from the river mouth, water level changes were influenced by fluctuations from the sea (Figure 3a). During periods of rising water levels, there was a simultaneous occurrence of high astronomical tides and swell. However, in their study, the monsoon-induced surge was not discussed, and the data from ERA5 and HYCOM are too coarse (0.5° for ERA5, 0.08° for HYCOM) for quantifications of the complex coastal total water levels from tides, waves, and surges. Other studies have not considered three questions: (1) Why did the water level rise abnormally on August 2–3, 2019 and 11 July 2022? (2) How did the astronomical tidal, surge, and wave contribute to the abnormal water level change? (3) What were the surges and swell at the other locations?
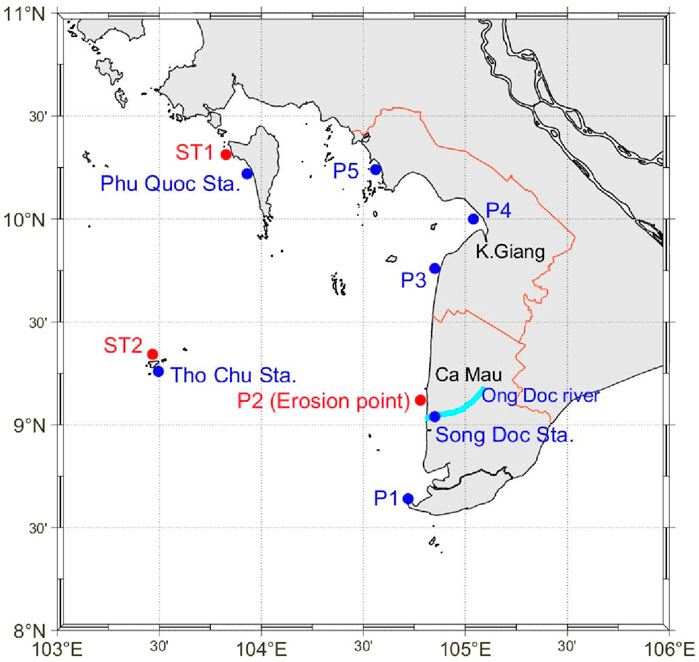
Figure 1. Study area, station locations, and data analysis points.

Figure 2. High tide caused the overflowing of the sea dike on the west coast of the Ca Mau Peninsula on the afternoon of 3 August 2019 (a) and 11 July 2022 (b) (Quyet et al., 2023).
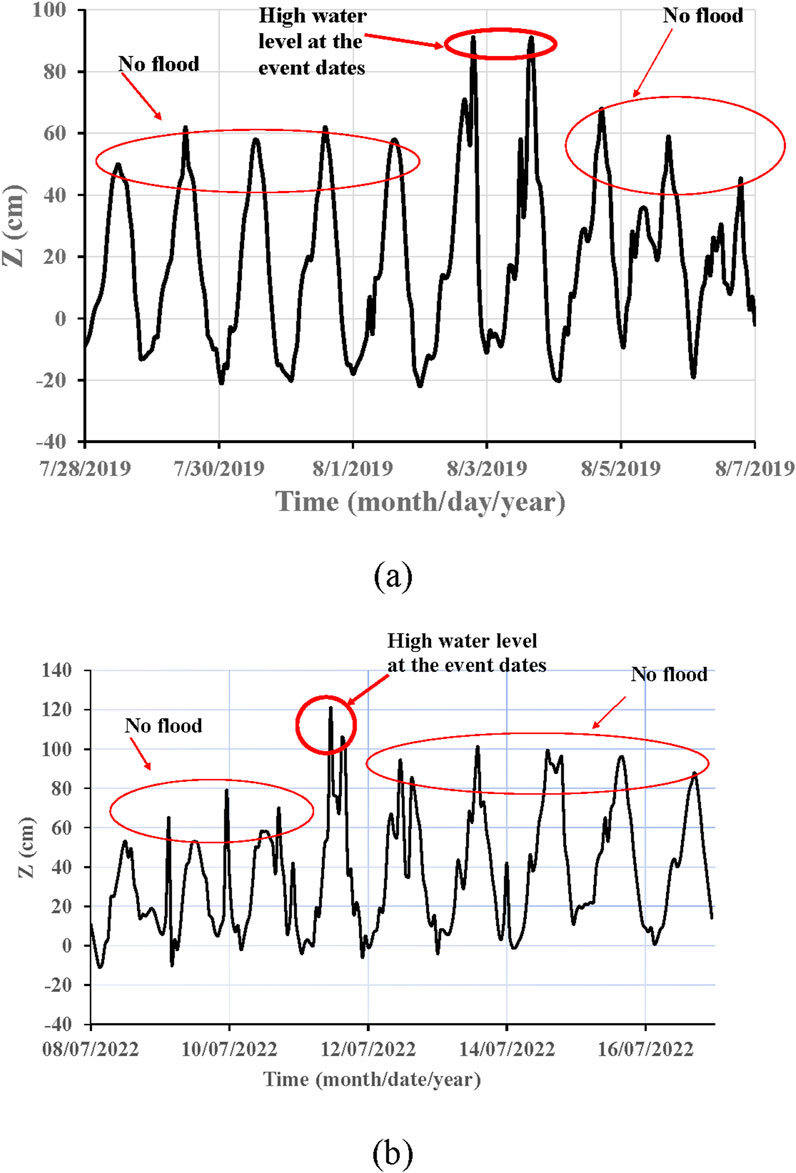
Figure 3. Variation of observed water level at Song Doc hydrological station during August 2–3, 2019 (revised from Quyet et al., 2023) (a), and during 11 July 2022 (b). The location of the Song Doc station is shown in Figure 1.
In this study, the causes of abnormal water level change in the west of Ca Mau Peninsula during the afternoon of August 2–3, 2019, and 11 July 2022, are analyzed based on numerical simulation results of tide, surge, and wave. The astronomical tides, surges, and swells at the eroded location (P2 in Figure 1) were discussed in detail. The SuWAT model was applied to simulate tides, monsoon-induced surges, and waves along the coast (e.g., Kim et al., 2008; Kim et al., 2010; Kim et al., 2015; Chien, 2015; Thai et al., 2017a; Thuy et al., 2017; Thuy et al., 2020). In fact, the effectiveness of the SuWAT model in predicting surges and waves for other coastal areas in Vietnam has been validated in several studies such as Chien, 2015; Thai et al., 2017a; Thuy et al., 2020 (on the northern coast); Thuy et al., 2017 (on the northern coast).
2 Materials and methods
2.1 Study area and data
2.1.1 Study area
The study area is shown in Figure 1, which shows the location of the abnormal surge-induced sea dike erosion on August 2–3, 2019, at point P2. The study area experiences minimal impact from tropical storms and depressions but is significantly influenced by two monsoon seasons: the northeast monsoon (from November to March) and the southwest monsoon (from May to September). Wind speeds during the Southwest Monsoon are higher, averaging 4.6–4.8 m/s at the Phu Quoc station, while offshore wind speeds range from 3.5 to 7.8 m/s (Quyet, 2023). There are about 10–12 southwest monsoon phases annually in the study area. Wind speeds during the southwest monsoon increase when tropical low-pressure systems are active in the East Sea of Vietnam. The coastal sea experiences semi-diurnal tides. Although the tidal range is not high with a maximum of about 1.0 m, the shallow water and low-lying coastal land make it vulnerable to rising water levels during spring tides, especially when strong monsoon winds occur. On the west coast of the Camau Peninsula, there are two provinces (Camau and Kien Giang) with a coastline of more than 340 km. These provinces play an important role in the economic development of the southern part of Vietnam through fisheries, aquaculture, and marine tourism. However, in recent years, coastal erosion in the Mekong Delta has become more severe and complex, particularly along the western coast of Cape Ca Mau (Duyen et al., 2024).
2.1.2 Data for research
There is no marine weather station on the west coast of the Ca Mau Peninsula. However, at Song Doc hydrological station, which is located about 1.5 km from the river mouth, the change in water level was recorded during the high tide (Quyet, 2023). In the ocean (called the southwestern Sea of Vietnam), there are two marine weather stations located at Phu Quoc and Tho Chu Islands. At the two stations, the wind data is observed at 1:00, 7:00, 13:00, and 19:00 (local time, GMT+7), the wave data is from 7:00, 13:00, and 19:00, while the tide is observed every hour at Phu Quoc station and four times (at 1:00, 7:00, 13:00 and 19:00) per day at Tho Chu station. However, since the wave data was estimated by eyes, these are not used for analysis due to the limitation in accuracy. Fortunately, there were two projects that conducted wave observations by an AWAC (Acoustic Wave and Current Profiler) sensor at the location near Phu Quoc (ST1 in Figure 1) and Tho Chu station (ST2 in Figure 1), and these observations will be used to validate the numerical results of wave simulation (Quyet, 2023). The points of P1, P2, P3, P4, and P5 are used to discuss the surge and swell heights. A reanalyzed dataset of wind and air pressure from the ERA5 at a resolution of 0.5° was used to assess the speed and direction of the wind and used as input for the simulation of wave and surge in the study area. All data was provided by the Viet Nam Meteorological and Hydrological Administration (VNMHA). The SuWAT model used the bathymetric data extracted from the General Bathymetry Chart of the Ocean (GEBCO) by the British Ocean Data Center, updated in 2024 with a resolution of 15 arc-seconds (https://www.gebco.net/data_and_products/gridded_bathymetry_data/) and the coastal topographic maps, scaled from 1:10,000 to 1:25,000 and published by the Department of Survey, Mapping and Geographic Information (DOSM) of Vietnam in 2023.
2.2 Research method
2.2.1 Surge and tide module
The SuWAT is an open-source code model - a coupled system for simulating surge, wave, and tide, developed by Kim et al. (2008), was employed to simulate storm surge, wave, and tidal conditions in the study area. SuWAT is capable of parallel processing across multiple domains using the Message Passing Interface (MPI). In this model, the astronomical tide is incorporated via the global ocean tide model by Matsumoto et al. (2000), which provides tidal predictions for 16 tidal constituents: M2, S2, K1, O1, N2, P1, K2, Q1, M1, J1, OO1, 2N2, Mu2, Nu2, L2, and T2. At each time step, the tidal level is applied to the open boundaries, limited to the outermost domain (Kim et al., 2008).
The surge module addresses the depth-averaged nonlinear shallow water equations by utilizing a staggered Arakawa C grid for spatial resolution and a leapfrog scheme for temporal integration. This approach employs an explicit finite difference scheme combined with the upwind method. The equations also incorporate wave forces as gradients of wave-induced radiation stress, which are calculated using the SWAN model. A standard quadratic drag law is applied for the sea surface and bottom boundary layers. In the wind stress, the conventional drag coefficient CD proposed by Honda and Mitsuyasu (1980) is employed:
where W is the wind speed (m/s) at 10 m height. In the decoupled run, Equation 1 is used. On the other hand, the wave-dependent CD (Janssen, 1989; 1991; Mastenbroek et al., 1993) is applied in the coupled run with SWAN model;
where ze is the effective roughness, z0 is the roughness length, z is the height, and
here, C and Cg represent the wave phase velocity and group velocity, respectively, while σ and θ denote the angular frequency and wave direction. E is the energy density spectrum. Additionally, a conventional quadratic drag law is applied to the bottom boundary layer. The current and the sea surface level in the coarse grid domain are transferred to the open boundaries in the nested fine grid domain at each time step of 4 s employed through the entire domain.
2.2.2 Wave module
In this study, SuWAT employs the Simulating WAves Nearshore (SWAN; Booij et al., 1999) model to solve the spectral action balance equation and estimate the wave spectrum, which is then integrated into SuWAT’s wave module (Kim et al., 2008; 2010). The wave module estimates waves based on time-varying currents and sea surface levels obtained from the surge module. Updated parameters, such as the wave-dependent drag coefficient and wave-induced radiation stress, are fed back to the surge module to recalculate currents and sea surface levels. The SWAN version 40.41 is specifically integrated as the wave module in SuWAT (Kim et al., 2008). The wave spectrum in the coarse grid domain is transferred to the open boundaries in the fine grid domain at each time step of 900 s. The time step is 900 s for the wave model. SuWAT’s accuracy has been validated in several studies, including Kim et al. (2015), Chien (2015), Thai et al. (2017a), Thuy et al. (2017), and Thuy et al. (2020).
SuWAT offers the flexibility to use either wind and sea level pressure (SLP) fields as a surface forcing boundary, generated by its internal parametric wind and pressure model or externally supplied fields from a numerical weather prediction model, such as the ECMWF (European Centre for Medium-Range Weather Forecasts) or WRF (Weather Research and Forecasting) models. In this study, a reanalysis of wind and pressure data from ERA5 was used to simulate the surge and wave conditions. For numerical simulations, wind and pressure inputs from ERA5 were linearly interpolated to the outermost domain (D1, as shown in Figure 4a). At open boundaries, the tidal predictions were imposed, and no-flux conditions were applied for a land boundary. This study did not consider the effect of river conditions on surges.
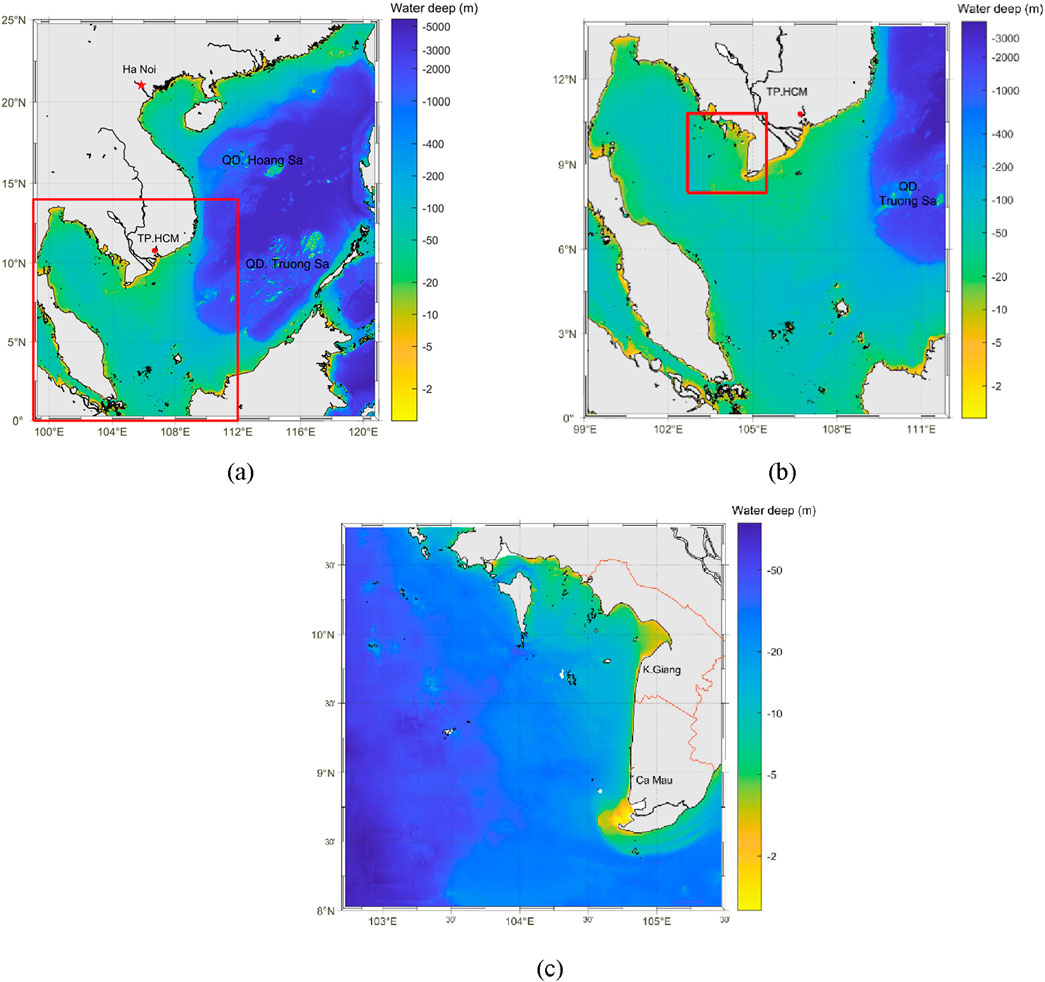
Figure 4. Geophysical domains with three levels for a coupled model of surge, wave, and tide (SuWAT): (a) The outermost domain, (b) The intermediate domain, and (c) The innermost domain.
In a series of numerical simulations, the three-level rectangular structured grid system, detailed in Table 1, incorporates the complexity of the region’s geophysical features. The outermost domain, D1 (Figure 4a), spans the entire East Vietnam Sea, while the intermediate domain, D2 (Figure 4b), focuses on the southern coast of Vietnam. The innermost domain, D3, covers the west coast of Ca Mau province (Figure 4c). The spatial resolutions for D1, D2, and D3 in the horizontal and vertical directions are 7400, 1850, and 925 m, respectively. Bathymetric data for D1 and D2 were extracted from the GEBCO. In contrast, coastal topographic maps from DOSM provided data for D3. SuWAT directly applies the wind and pressure fields at each grid node of D1, shown in Table 1, while for D2 and D3, it interpolates the hourly data from D1 into 10-min intervals for the nested domains.

Table 1. Information of computational domains.
3 Results and discussion
3.1 Validation of the numerical model for wave and total water level in the study area
First, the SuWAT model must be validated for the study area’s waves and total water levels. For the validation of waves, this study selected two periods of wave observations at the location near Phu Quoc and Tho Chu stations, with an observation period of February 27 to 5 March 2022 for Phu Quoc station and from 25 December 2013 to 1 January 2014 for Tho Chu station. The waves were observed by an AWAC. The comparisons in Figures 5, 6 show that the model simulates well both the height (H_Sig.) and the period (Tp) with mean errors (ME)/root mean square error (RMSE)/coefficient (R) of 0.04 m/0.08m/0.73 and 0.53 s/0.66 s/0.53, respectively, at Phu Quoc station, and of 0.02 m/0.09 m/0.66 and 0.12 s/0.24 s/0.63 at Tho Chu station.

Figure 5. Comparison of waves predicted by the SuWAT model with observation data at Phu Quoc station: (a) H_sig, and (b) wave period.

Figure 6. Comparison of waves predicted by the SuWAT model with observation data at Tho Chu station: (a) H_sig, and (b) wave period.
In general, the surge induced by monsoons on the island is not high compared to the case of a typhoon affecting the land. Therefore, this study used the observed total water level (tide and surge) to validate the SuWAT model. The observed water level data at Phu Quoc and Tho Chu stations in the period from July 20 to 18 August 2019, was selected for validation. The results in Figures 7a, b indicate that the model effectively simulates both the phases and amplitudes, with ME, RMSE, Nash-Sutcliffe Efficiency (NSE), and R of 0.0, 0.09, 0.80, and 0.91 m for Phu Quoc station and −0.03, 0.08, 0.71, and 0.86 m for Tho Chu station, respectively.
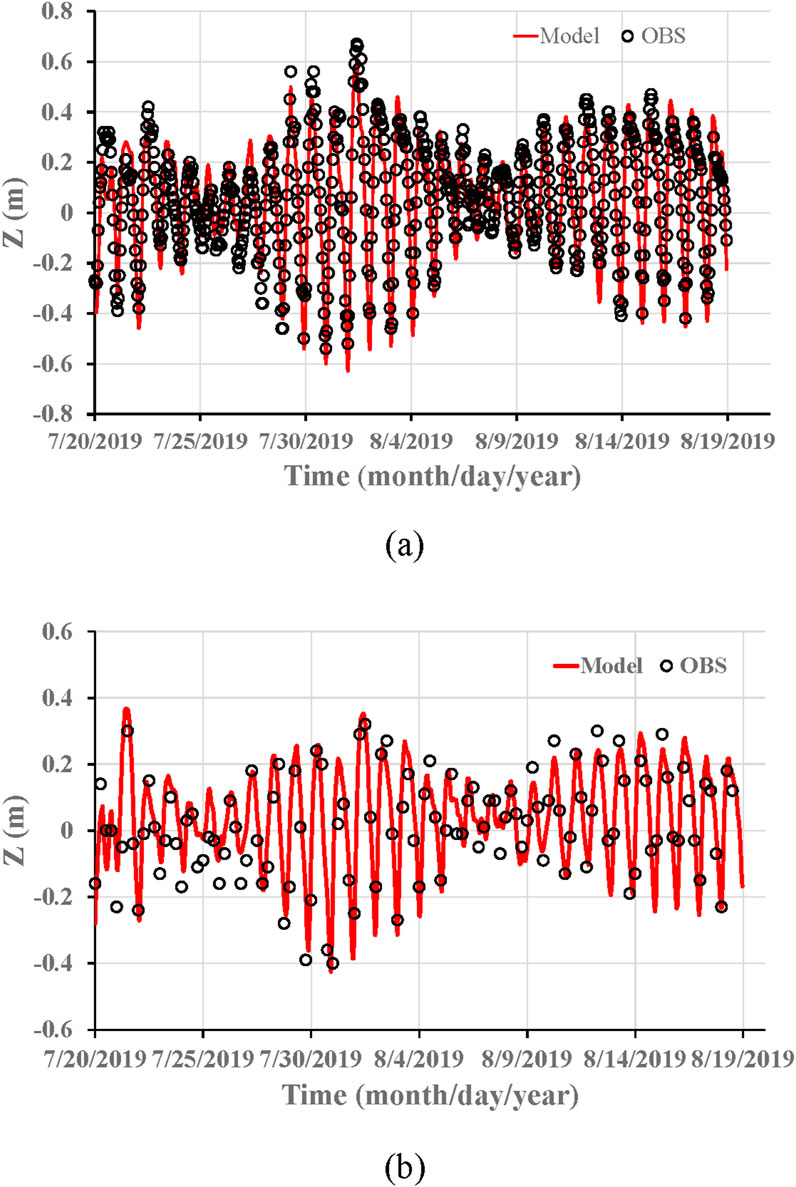
Figure 7. Comparison of total water level predicted by the SuWAT model with observation data at Phu Quoc (a), and Tho Chu (b) stations.
In the validation process, the coefficient of manning roughness of 0.023 is selected, and the other parameters are fixed as well referred to the model settings used in Thai et al., 2017a; Thuy et al., 2017; Thuy et al., 2020.
3.2 Abnormal high water level change on the west coast of Ca mau province on August 2–3, 2019
3.2.1 Astronomical tides
The tidal levels and surges induced by wind, air pressure, and waves affect the total rise of coastal water levels. Therefore, it is necessary to simultaneously analyze and evaluate the factors of tides, surges, and waves (including swells) in the study area.
Figure 8 shows the astronomical tidal variations at the erosion point (P2). This is the calculated data from the SuWAT model. On 02–03 August 2019, the coastal area of Ca Mau province was in the high tide period. The time of highest tide was from 14:00 to 17:00, which was the time when the abnormal water level rise occurred.
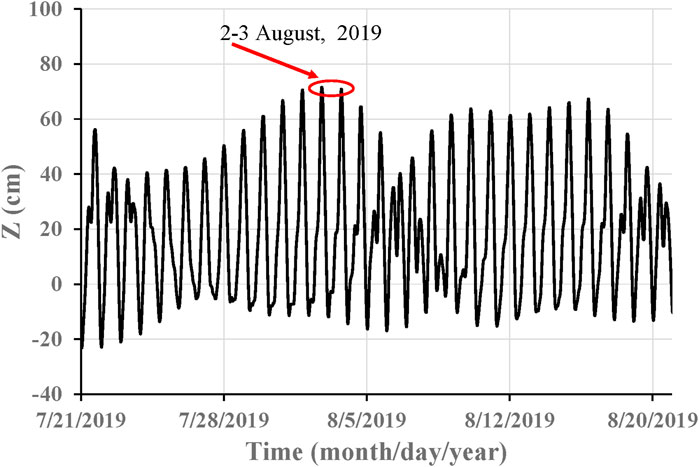
Figure 8. Astronomical tidal variations at P2 in July–August 2019. Calculated from the SuWAT model.
3.2.2 Surges in the southwest coast
The regional wind field distributions at 15:00 on the dates of 1–4 August 2019 are shown in Figure 9, which is derived from the ECMWF reanalysis data. It can be seen that the prevailing wind direction was west in the northern part and southwest in the southern part of the study area. In the coastal area of Ca Mau and K. Giang provinces, wind direction prevails from the west and southwest. The strongest winds were found in the northern part of the area, and weaker ones were found in the southern part of the study area. At Phu Quoc station, the wind speed was regularly sustained above 8,0–10,7 m/s (level 5 on the Beaufort scale) in the afternoon and evening of August 2 and 3, 2019, and the wind speed reached a maximum of 12 m/s (level 7) at 13:00 on 3 August 2019. These wind speed values are rarely observed at Phu Quoc station. Meanwhile, at Tho Chu station (in the Southwest Sea), the wind speed increased from 2 August 2019, with a maximum of up to 5 m/s (level 3) at 13:00 on 3 August 2019, lower than those at Phu Quoc station (Quyet et al., 2023). The combination of high wind speeds and prolonged duration resulted in significant and sustained increases in water levels and wave heights during this high tide period. During this period, the wind field was active in the area due to the interaction with typhoon WIPHA, occurring in the East Vietnam Sea and making landfall in north Vietnam on the morning of 3 August 2019 (Figure 10).
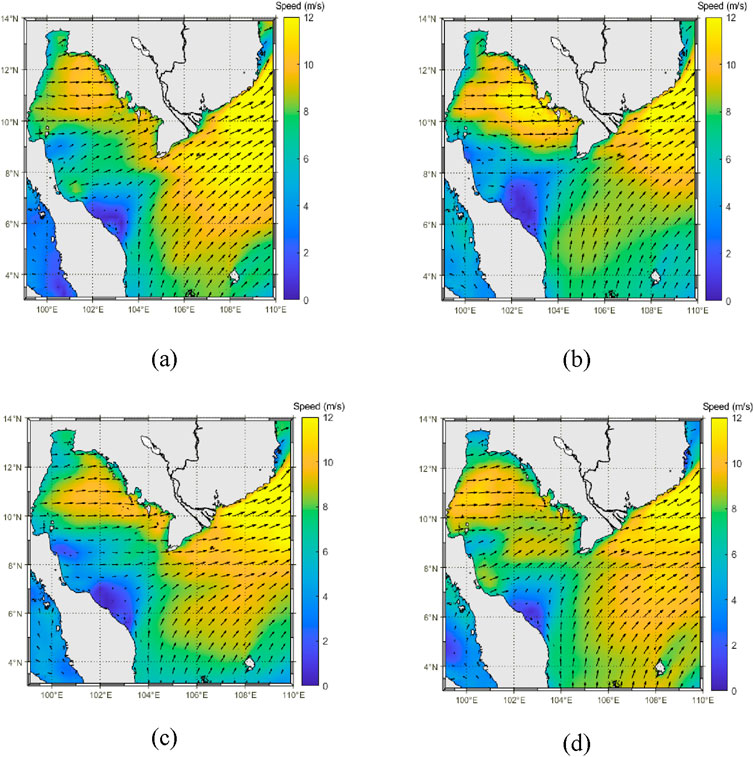
Figure 9. Wind field distributions at the time before, during, and after the occurrence of abnormal water level change accompanied by high waves at the west coast of Ca Mau province: (a) 15:00 on 1 August 2019; (b) 15:00 on 2 August 2019; (c) 15:00 on 3 August 2019; (d) 15:00 on 4 August 2019. Derived from ERA5.

Figure 10. Wind field in the East Vietnam Sea at 15:00 on 1 August 2019. Derived from ERA5.
The distribution of the maximum surge induced by wind stress and wave setup on the coastal area of Ca Mau and K. Giang provinces during the strong monsoon phase from August 1 to 5 August 2019, is shown in Figure 11. This result was calculated from the SuWAT model for the coupled surge with wave case. It can be seen that the highest surge is at point P4 (belonging to the coastal area of K. Giang Province), about 0.6m, and the surge height gradually decreases towards Ca Mau province. Thus, although coinciding with the high astronomical tide in the area, the surge at P4 is higher than at P2, but there was no report on the abnormal water level change at K. Giang province, such as recorded at point P2.
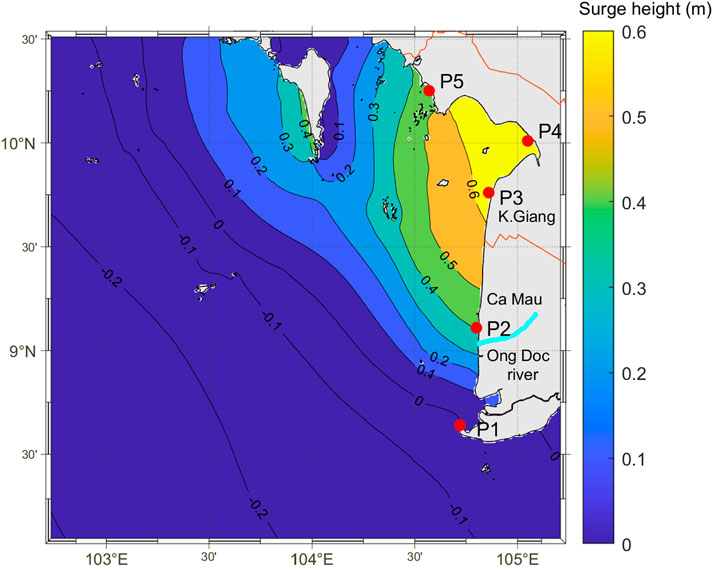
Figure 11. Distributions of maximum surge height on the coastal area of Ca Mau and K. Giang provinces during the period of 1–5 August 2019.
Figure 12 shows the time series of surge height at point P2 for two simulation cases, with and without considering the effect of wave setup (coupled and uncoupled model of surge and wave). The surge induced by wave setup (Zwave setup) was extracted as follows:
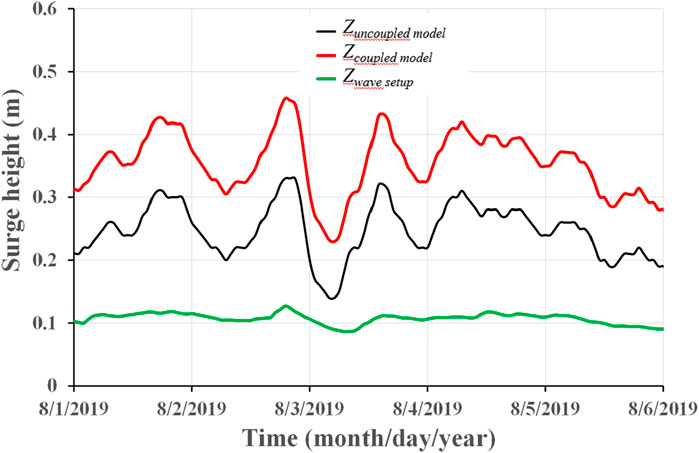
Figure 12. Time series of surge calculated by wind stress, wave setup, and total surge at point P2 during the period of 1–6 August 2019.
The results show that the surge due to wind stress (the uncoupled case- Zuncoupled model) is about 0.33m, while the highest combined surge induced by winds and wave setup (Zcoupled model) is about 0.46 m. Although the surge induced by wave setup is only about 0.13m, that contribution makes up about 25% of the total surge.
The calculated results of astronomical tide, surge, and total water levels (tide + surge) at P2 are shown in Figure 13. Although the surge peak was not at the same time as the highest of the astronomical tide (As. Tide), the surge contribution of about 0.42 m increased the total water level. It can be seen that the highest peak of total water level is at 15:00 on 2 and 3 August 2019, although the difference is not much in comparison to 31 July and 1 and 4 August 2019. However, the abnormal water level change occurred only on 2–3 August. Therefore, it is necessary to consider other factors, such as waves, in the following section.
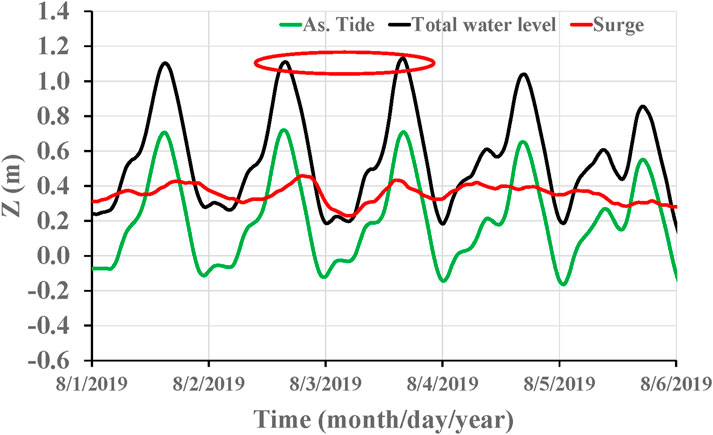
Figure 13. Time series of the astronomical tide (As. Tide), surge, and total water level at point P2 during the period of 1–6 August 2019.
3.2.3 Wave and swell on the southwest coast
In this study, swells were considered as long waves that propagated from the offshore of the southwestern Sea of Vietnam into the study area. The significant wave height was estimated from the incoming waves, taking into account the characteristics of both swell and local wind waves, with the estimation based on their respective heights (Holthuijsen, 2010). The distribution of the simulated significant wave height and swell height at 15:00 on 2 and 3 August 2019 are shown in Figures 14, 15, respectively. Note that in this case, the swell height was selected for the longer periods, i.e., higher than 10 s, while the period of significant waves was around 4–5 s. It can be seen from the figures that the prevailing wave direction is perpendicular to the shoreline. Compared to the south and the coast of K. Giang province, the height of significant waves and swells at the center of Ca Mau province is higher. It also can be confirmed by the extracted results of the swell height data at some representative locations (points P1–P5) along the southwest coast in Figure 16.

Figure 14. Distribution of significant wave height (H_Sig.) and direction at 15:00 on 2 August 2019 (a), and 3 August 2019 (b).
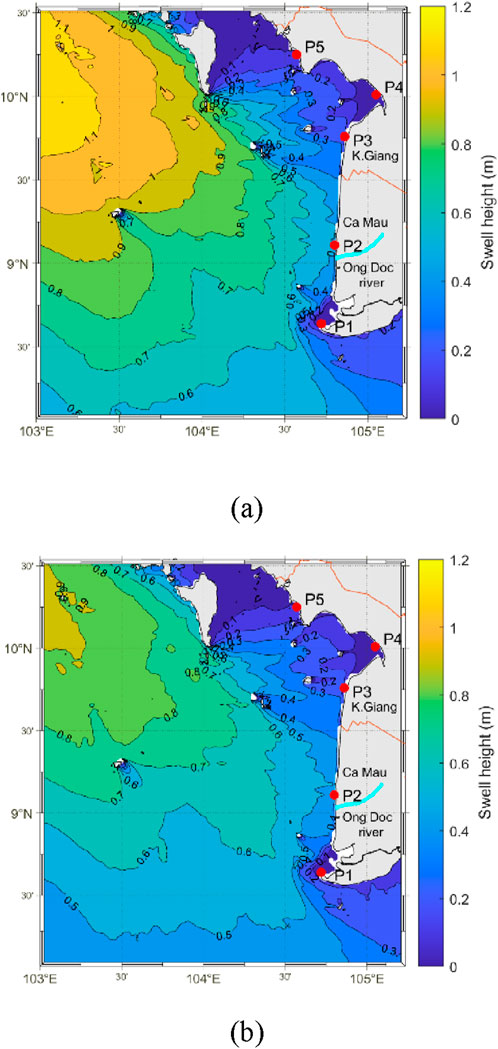
Figure 15. Distribution of swell height (H_Swell) at 15:00 on: 2 August 2019 (a), and 3 August 2019 (b).
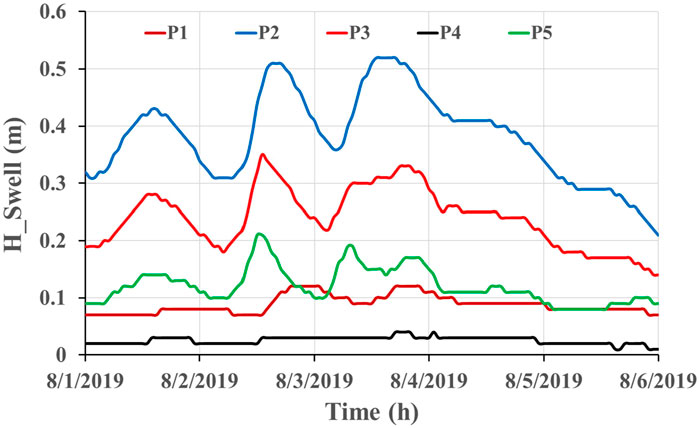
Figure 16. Time series of the swell height (H_Swell) at 5 locations along the Southwest coast of Ca Mau and K. Giang province from 1–6 August 2019.
Figure 17 presents a comparison of significant wave height and swell height at point 2 for the period from August 1 to 6 August 2019. It can be seen that the trend of significant wave height is not exactly the same as the swell height, although both decreased after August 4. However, the highest significant wave height, on 2 August 2019, is about 1.6m, not much higher than other days. Meanwhile, there were two peaks of swell height on the afternoon of August 2 and 3, 2019 are 0.51 m and 0.52 m, respectively. The reanalysis data from ERA5 also showed two swell peaks; however, they were not at the same time as the highest of the astronomical tide (Quyet et al., 2023). The swell height is smaller than the significant wind wave height, but the period is longer. The continuous accumulation of swells at the time when both swell and water level (“Total water level” in Figures 13, 18) are highest will increase the total water level in the coastal area, as shown in Figure 18. These results are in line with results reported by Hoeke et al. (2013), Andrade et al. (2013), Cheriton et al. (2016), Wandres et al. (2020), Dhoop and Thompson (2021), Cheriton et al. (2024). The numerical results showed that at P4, even though the surge height is higher than at P2 (0.6 m at P4 and 0.4 m at P2) while the swell height is lower, less than 0.1 m (0.52 m at P2 and 0.03 m at P4) due to the shallow effect (Figure 4c). The surge heights at peak astronomical tides are 0.57 m at P3 and 0.42 m at P2; however, the swell height is around 0.52 m at P2, higher than 0.33 m at P3 at the peak total water level. In addition, at P3, mangrove cover may be the reason for the lack of reports of abnormal rises in water levels.

Figure 17. Time series of the significant wave height (H_Sig) and swell height (H_Swell) at point P2 from 1–6 August 2019.
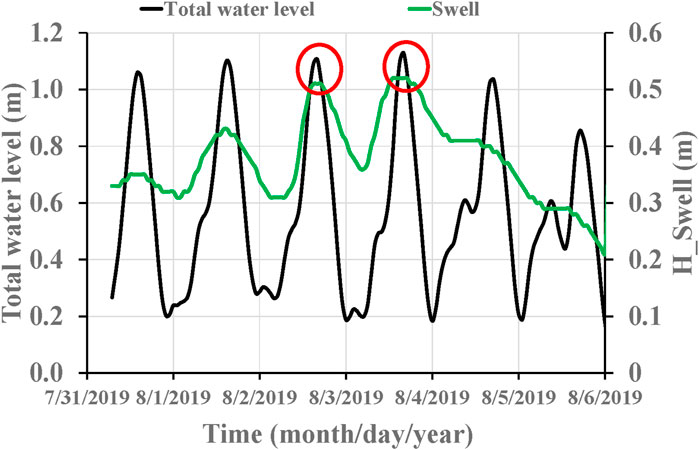
Figure 18. Time series of the total water level and swell height (H_Swell) at point P2 from 1–6 August 2019.
3.3 Abnormal high water level change on the west coast of Ca mau province on 11 July 2022
The second abnormal water level change used for simulation was on 11 July 2022. At that time, the southwest wind field was active in the study area (Figure 19a) due to the interaction of a low-pressure system in the East Sea of Vietnam, as shown in Figure 19b. At Phu Quoc station, wind speed was regularly sustained above 10.5–14.5 m/s on the afternoon and evening of July 11 and 12, 2022.

Figure 19. Wind field distributions at 14:00 on 11 July 2022: (a) The East Vietnam Sea, (b) The Southwestern Sea of Vietnam. Derived from ERA5.
Figures 20a–c illustrate the distribution of the simulated significant wave height, swell height, and surge height (from the coupled model) at 14:00 on 11 July 2022. Similar to the case of the abnormal water level change on August 2–3, 2019, the prevailing wave direction is perpendicular to the shoreline, and the heights of significant waves and swells at P2 are higher in comparison to the south and the coast of K. Giang province (P1, P3, P4, P5). The surge height gradually decreased towards Ca Mau province; the surge height at point P4 was 0.38 m when the abnormal rises in water levels occurred.
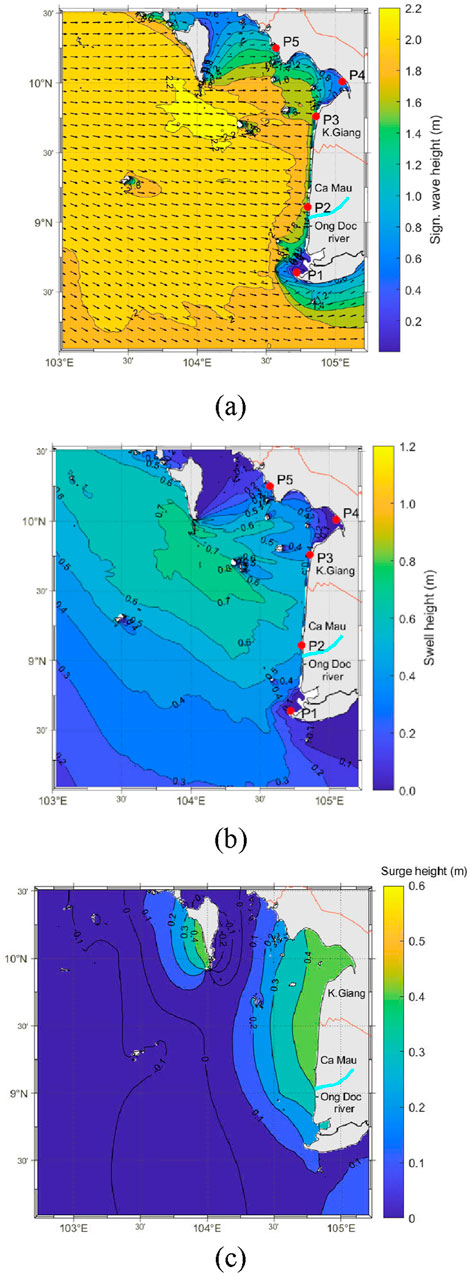
Figure 20. Distribution of significant wave height (H_Sig.) (a), swell height (H_Swell) (b), and surge height (c) at 14:00 on 11 July 2022.
The calculated results of the astronomical tide (As. Tide), surge height (Zcoupled model), total water level (tide + surge), and swell height at P2 are shown in Figure 21. It should be noted that on the dates from 10–16 July 2022, the time of peak astronomical tide is from 13:00 to 14:00, and the highest is on 14 July, not on 11 July 2022, as when the abnormal water level change occurred. The peak of the surges on the date 11 July 2022 is almost the same time as the highest of the astronomical tide, as a result, significantly increased the total water level compared to that of the following days. The highest peak of the total water level is at 14:00 on 12 July 2022, although the difference is not much compared to 11 and 13 July 2022. On the other hand, the swell heights increased from the morning of 11 July 2022, reaching a maximum of 0.56 m at 17:00 on 11 July 2022 before decreasing. At the peak of the total water level on 11 July 2022, the swell height was 0.52m, contributing to the increase in the total water level in the coastal area on the afternoon of 11 July 2022.

Figure 21. Time series of the astronomical tide (As. Tide), surge, total water level, and swell height (H_Swell) at point P2 from 10–16 July 2022.
In both cases, the distribution of significant wave height and swell height (Figures 14, 15, 20a) reflects the influence of local water depth. As indicated in Figure 4c, the water depth at point P2 is greater than that at points P1, P3, P4, and P5. Consequently, the significant wave height and swell height at P2 were higher than those at the other locations (P1, P3, P4, and P5). This difference is primarily attributed to bottom friction as ocean waves interact with shallower areas. In addition, it presents swell propagations into the west coast of Ca Mau province at Phu Quoc Island.
Although there is no observation data of wave and water level in the area, the simulation result can explain the reason why there was an abnormal surge on the afternoon of 2 and 3 August 2019 and 11 July 2022, namely, that this was due to a combination of high astronomical tide, surge, and swell. Therefore, the model can be used to forecast the tide, surge, and wave height during the monsoon seasons.
4 Conclusion
This study analyzes the mechanism of the abnormal rise in water levels during the afternoon of August 2–3, 2019, and 11 July 2022, based on the simulation results of tide, surge, and wave. The main results found are as follows.
- A coupled model of surge, wave, and tide (SuWAT) was utilized to simulate tides, monsoon-induced surge, wave setup, and swell along the coast, achieving a resolution of 925 m. The model’s applicability was validated by strongly agreeing with observational data on the study area’s waves and water levels.
- The numerical results indicated that the abnormal rise in water levels in the coastal area of Ca Mau province is attributable to a combination of factors, including high astronomical tides, wind-induced surges, wave setup, and swells. In particular, the swells are considered to be the main cause of the abnormal water level change during these periods. At the time of high astronomical tide, the surge and swell contributed up to 0.42 m and 0.52 m, respectively, on 3 August 2019, and 0.38 m and 0.53 m on 11 July 2022, respectively, to increase water levels.
- The strong, prolonged southwest monsoon over the Gulf of Thailand is the direct cause of high surges and waves in the area. In particular, high waves formed from strong winds in the Northwest region of the Gulf of Thailand are directed perpendicular to the coast. Therefore, during the activity period of the southwest monsoon, it is necessary to monitor and assess astronomical tides and the possibility of surges and swells in the coastal area of Ca Mau province.
From this study, some recommendations with implications for coastal protection of the area are as follows.
- Firstly, the study area is highly vulnerable to abnormal rising water levels accompanied by high waves; however, no observation stations lead to difficulties in monitoring and verifying the forecast results. As a result, it is necessary to set up a marine weather station in the area.
- Secondly, the study results are valid for forecasting and warning of abnormal water level rise in the study area, and the SuWAT model can be effectively applied for the operational forecasting of tides, monsoon-induced surges, and waves in this area.
In the present study, the relatively coarse grid size of 925 m on the innermost domain was used to examine the effect of the radiation stress on the surge in the aspect of forecasting in a warning system. Hence, further studies should be necessary on higher resolutions when planning and managing coastal facilities and structures. A very interesting subject to be considered for future research would be the use of a coupled river and ocean model to investigate the effect of river conditions on surges in addition to coastal and river site inundation.
Data availability statement
The original contributions presented in the study are included in the article/supplementary material, further inquiries can be directed to the corresponding author.
Author contributions
NT: Conceptualization, Funding acquisition, Methodology, Supervision, Writing–original draft, Writing–review and editing. PT: Data curation, Formal Analysis, Visualization, Writing–original draft, Writing–review and editing. NC: Conceptualization, Writing–original draft, Writing–review and editing. PN: Data curation, Validation, Visualization, Writing–review and editing. VD: Formal Analysis, Validation, Visualization, Writing–review and editing. LQ: Data curation, Resources, Writing–review and editing. SK: Investigation, Methodology, Supervision, Writing–review and editing. CW: Formal Analysis, Investigation, Resources, Visualization, Writing–review and editing. LH: Formal Analysis, Funding acquisition, Investigation, Supervision, Validation, Writing–review and editing.
Funding
The author(s) declare that financial support was received for the research, authorship, and/or publication of this article. This research is funded by the Ministry of Science and Technology of Vietnam under grant number ĐTĐL-CN-46/22, the Vietnam Ministry of Natural Resources and Environment (project code TNMT. 2024.06.03) and partially funded by the Norwegian Agency for Development Cooperation (NORAD; Hole).
Conflict of interest
The authors declare that the research was conducted in the absence of any commercial or financial relationships that could be construed as a potential conflict of interest.
Generative AI statement
The author(s) declare that no Generative AI was used in the creation of this manuscript.
Publisher’s note
All claims expressed in this article are solely those of the authors and do not necessarily represent those of their affiliated organizations, or those of the publisher, the editors and the reviewers. Any product that may be evaluated in this article, or claim that may be made by its manufacturer, is not guaranteed or endorsed by the publisher.
References
Andrade, C. A., Thomas, Y. F., Nicolae Lerma, A., Durand, P., and Anselme, B. (2013). Coastal flooding hazard related to swell events in Cartagena de Indias, Colombia. J. Coast. Res. 29 (5), 1126–1136. doi:10.2112/jcoastres-d-12-00028.1
Booij, N., Ris, R. C., and Holthuijsen, L. H. (1999). A third-generation wave model for coastal regions: 1. Model description and validation. J. Geophys. Res. 104 (C4), 7649–7666. doi:10.1029/98jc02622
Cheriton, O. M., Storlazzi, C. D., Oberle, F. K. J., Rosenberger, K. J., and Brown, E. K. (2024). Extreme low-frequency waves on the Ofu, American Samoa, reef flat. Coral Reefs 43, 185–191. doi:10.1007/s00338-023-02453-w
Cheriton, O. M., Storlazzi, C. D., and Rosenberger, K. J. (2016). Observations of wave transformation over a fringing coral reef and the importance of low-frequency waves and offshore water levels to runup, overwash, and coastal flooding. J. Geophys. Res. Oceans 121, 3121–3140. doi:10.1002/2015JC011231
Chien, D. D. (2015). Researching the scientific basis to assess the storm surge in the sea areas from Quang Binh to Quang Nam. Hanoi, Vietnam: University of Science - Vietnam National University, Ph.D. dissertation, 117p. (in Vietnamese).
Dhoop, T., and Thompson, C. (2021). Swell wave progression in the English Channel: implications for coastal monitoring. Anthr. Coasts 4, 281–305. doi:10.1139/anc-2021-0008
Duyen, N. M. C., Vy, D. T. H., and Long, B. T. (2024). The trend of erosion and accretion of the western coast of the Mekong Delta, the section from Ca Mau Cape to Kien Giang. Vietnam J. Hydrometeorol. 18, 66–78. doi:10.36335/VNJHM.2024(18).66-78
Hoeke, R. K., Mcinnes, K. L., Kruger, J. C., McNaught, R. J., Hunter, J. R., and Smithers, S. G. (2013). Widespread inundation of Pacific islands triggered by distant-source wind-waves. Glob. Planet. Change 108, 128–138. doi:10.1016/j.gloplacha.2013.06.006
Holthuijsen, L. H. (2010). Waves in oceanic and coastal waters. New York: Cambridge University Press.
Honda, T., and Mitsuyasu, H. (1980). Experimental study of wind stress in the sea surface. Annu. J. Coast. Eng. JSCE 27, 90–93. (in Japanese).
Janssen, P. A. E. M. (1989). Wave-induced stress and the drag of air flow over sea waves. J. Phys. Oceanogr. 19, 745–754. doi:10.1175/1520-0485(1989)019<0745:wisatd>2.0.co;2
Janssen, P. A. E. M. (1991). Quasi-linear theory of wind-wave generation applied to wave forecasting. J. Phys. Oceanogr. 21, 1631–1642. doi:10.1175/1520-0485(1991)021<1631:qltoww>2.0.co;2
Kim, S. Y., Mori, N., Mase, H., and Yasuda, T. (2015). The role of sea surface drag in a coupled surge and wave model for Typhoon Haiyan 2013. Ocean. Model 2015.
Kim, S. Y., Yasuda, T., and Mase, H. (2008). Numerical analysis of effects of tidal variations on storm surges and waves. Appl. Ocean. Res. 30 (4), 311–322. doi:10.1016/j.apor.2009.02.003
Kim, S. Y., Yasuda, T., and Mase, H. (2010). Wave set-up in the storm surge along open coasts during Typhoon Anita. Coast. Eng. (ASCE) 57, 631–642. doi:10.1016/j.coastaleng.2010.02.004
Mastenbroek, C., Burgers, G., and Janssen, P. A. E. M. (1983). The dynamical coupling of a wave model and a storm surge model through the atmospheric boundary layer. J. Phys. Oceanogr. 23, 1856–1866. doi:10.1175/1520-0485(1993)023<1856:tdcoaw>2.0.co;2
Matsumoto, K., Takanezawa, T., and Ooe, M. (2000). Ocean tide models developed by assimilating TOPEX/POSEIDON altimeter data into hydrodynamical model: a global model and a regional model around Japan. J. Oceanogr. 56, 567–581. doi:10.1023/a:1011157212596
Quyet, L. D. (2023). “Research on the development of technology for forecasting and warning of abnormally high sea levels for coastal areas of Vietnam,” in Final report of the project of the Vietnam Ministry of natural Resources and environment (project code TNMT.2024.06.01) (in Vietnamese).
Quyet, L. D., Hien, L. X., Huong, T. X., Tien, P. V., Ngoc, P. K., Ha, B. M., et al. (2023). Study the reason of high tides accompanied by big waves in the west coast of Ca Mau. Vietnam J. Hydrometeorol. 748, 1–13. (in Vietnamese, abstract in English).
Thai, T. H., Thuy, N. B., Dang, V. H., Kim, S., and Lars, R. H. (2017a). Impact of the interaction of surge, wave and tide on a storm surge on the north coast of Vietnam. IUTAM Symposium Storm Surge Model. Forecast. 25, 82–91. doi:10.1016/j.piutam.2017.09.013
Thai, T. H., Tien, T. Q., Thuy, N. B., and Hung, D. Q. (2017b). Anomalous sea level rise in Tuy Hoa– Phu yen. Vietnam J. Hydrometeorol. 676, 1–9. (in Vietnamese, abstract in English).
Thanh, H. T. (2011). “The variation of sea level in the coastal zone of Vietnam,”. Ph.D. Thesis (Hanoi, Vietnam: Institute of Meteorology, Hydrology and Environment).
Thuy, N. B. (2018). Simulation of anomalous sea level rise caused by barometric disturbances in the central coast. J. Mar. Sci. Technol. 18 (4), 475–483. (in Vietnamese, abstract in English). doi:10.15625/1859-3097/18/4/13664
Thuy, N. B., and Cuong, N. K. (2019). Initial study of rising water due to Ekman pumping effect in the central coast. Vietnam J. Hydrometeorol. 702 (06), 13–20. (in Vietnamese, abstract in English). doi:10.36335/VNJHM.2019(702).13-20
Thuy, N. B., Kim, S., Anh, T. N., Cuong, N. K., Thuc, P. T., and Lars, R. H. (2020). The influence of moving speeds, wind speeds, and sea level pressures on after-runner storm surges in the Gulf of Tonkin, Vietnam. Ocean. Eng. 212, 107613. doi:10.1016/j.oceaneng.2020.107613
Thuy, N. B., Sooyoul, K., Chien, D. D., Dang, V. H., Cuong, H. D., Wettre, C., et al. (2017). Assessment of storm surge along the coast of central Vietnam. Coast. Res. J. 33, 518–530. doi:10.2112/JCOASTRESD-15-00248.1
Thuy, N. B., and Tien, T. Q. (2018). Initially researched the relationship between anomalous sea level rise in Tuy Hoa – Phu Yen with weather patterns. Vietnam J. Hydrometeorol. 687, 15–22. (in Vietnamese, abstract in English).
Thuy, N. B., Tien, T. Q., Cecilie, W., and Lars, R. H. (2019). Monsoon-induced surge during high tides at the Southeast Coast of Vietnam: a numerical modeling study. Geosci 9, 72. doi:10.3390/geosciences9020072
Thuy, V. T. T. (2003). Storm surge modeling for Vietnam’s coast. Nederl. Delft Hydraul. Master’s thesis, 140p.
Keywords: abnormal water level rise, SuWAT, west coast of Ca Mau Peninsula, swell, Vietnam
Citation: Thuy NB, Tien PV, Cuong NK, Ngoc PK, Dang VH, Quyet LD, Kim S, Wettre C and Hole LR (2025) Numerical analysis of the abnormal water level rise phenomenon on the west coast of Ca Mau Peninsula, Vietnam. Front. Built Environ. 11:1536113. doi: 10.3389/fbuil.2025.1536113
Received: 28 November 2024; Accepted: 24 February 2025;
Published: 13 March 2025.
Edited by:
Xin Bao, Dalian University of Technology, ChinaReviewed by:
Manuel Gerardo Verduzco-Zapata, University of Colima, MexicoVu Duy Vinh, Vietnam Academy of Science and Technology, Vietnam
Copyright © 2025 Thuy, Tien, Cuong, Ngoc, Dang, Quyet, Kim, Wettre and Hole. This is an open-access article distributed under the terms of the Creative Commons Attribution License (CC BY). The use, distribution or reproduction in other forums is permitted, provided the original author(s) and the copyright owner(s) are credited and that the original publication in this journal is cited, in accordance with accepted academic practice. No use, distribution or reproduction is permitted which does not comply with these terms.
*Correspondence: Nguyen Kim Cuong, Y3Vvbmdua0BodXMuZWR1LnZu