 Kyle Abbott Smith
 Rubayet Bin Mostafiz
 Carol Friedland
 Isabelina Nahmens
94% of researchers rate our articles as excellent or good
Learn more about the work of our research integrity team to safeguard the quality of each article we publish.
Find out more
ORIGINAL RESEARCH article
Front. Built Environ., 03 March 2025
Sec. Urban Science
Volume 11 - 2025 | https://doi.org/10.3389/fbuil.2025.1528895
This research aims to leverage existing data sources to provide new insights into the usage of Multi-Criteria Decision Analysis (MCDA) in the built environment without creating a new data collection process. The study is focused upon built environment vocations, spanning the disciplines of architecture, construction management, urban planning, real estate, facilities management, and the numerous engineering domains that support capital projects. The method of the study utilized Google search engine data from Google Trends and academic literature metadata from Web of Science, which was analyzed using Bibliometrix via the Biblioshiny interface. These datasets were cross-referenced with original data collected from a Qualtrics delivered industry questionnaire to develop a more comprehensive understanding of MCDA adoption within the built environment. The research presents a ranked list of MCDA methods used within built environment vocations in order of level of adoption, with the top five being PROMETHEE, House of Quality, Monte Carlo Simulations, TOPSIS, and Utility Theory. The results include Biblioshiny visualizations for MCDA methods studied within built environment academic papers and findings related to tool associations via key clusters, such as GIS and drone based data collection tool usage, in concert with MCDA methods. The paper presents evidence that MCDAs are more frequently used in environmental science, geography, management, and sustainability studies within the built environment relative to other design or construction oriented use cases. By integrating diverse data sources—academic publications, search engine trends, and industry responses—the research explores a multi-faceted perspective on the current state of MCDA usage, highlighting the gaps between academic focus, industry practices, and public interest. The research notes that MCDAs are often considered on an individual basis instead of approached broadly as a set of mathematical tools, possibly serving as a barrier to a more expansive understanding of the means and methods practitioners might employ.
Research is actively being conducted to attempt to infer adoption of MCDA methods. An example of this is “Uptake and Dissemination of Multi-Criteria Decision Support Methods in Civil Engineering- Lessons from the Literature” (Michael, 2021) which leveraged the Bibliometrix platform to analyze bibliometric databases such as SCOPUS and Web of Science to determine the primary MCDAs in use among Civil Engineers and to analyze the most referenced software applications used within the academic literature. The research in this study is both a continuation of that methodology, albeit with a wider focus than Civil Engineering, to include Construction, Urban Planning, various forms of Engineering that support capital project execution, Architecture, and Real Estate which this paper generically refers to as the Built Environment. While support functions, such as Finance, Accounting, and Business roles, often support capital project decision making with means and methods such as Net Present Value (NPV) and Internal Rate of Return (IRR) calculations, this research has excluded those roles and methods from this analysis given their common susceptibility to failing to consider or appropriately model numerous facets in capital project decision-making.
MCDAs have long been used to guide engineering and design processes, often balancing competing interests related to material selection characteristics and asset design. Studies within academic literature note that there are non-financial elements that can greatly alter decision outcomes.
Multi-Criteria Decision Analysis, for the purposes of this research, will be used as a meta term to encompass inter-related or interchangeable terminology such as Multi-Criteria Optimization, Multi-Objective Decision Making (MODM) and Multi-Attribute Decision-Making (MADM). These methods may be further characterized in a number of ways, to include the role of the Decision-Maker, means of addressing vagueness or imprecision, single method versus hybrid MCDA methods, or the ability to arrive upon mathematical optimization models such as Pareto frontiers. While these distinctions are value-adding and informative, the focus of this research is at a meta level and so will summarize all of these methods within the MCDA umbrella term. Specific MCDA references will be constrained to those 25 methods considered within “A review of application of multi-criteria decision making methods in construction”. (Jato-Espino, Castillo-Lopez, Rodriguez-Hernandez and Canteras-Jordana, 2014) to focus the research upon core MCDA methods instead of the evolving field of hybrid MCDAs. This research favors an expansive interpretation of MCDA which is sometimes noted as “MCDA/M” to respect the differing branches of mathematical thought.
Bibliometric analysis is a form of research in which metadata from academic literature digital libraries is analyzed. This method has been broadly used within academia and research to include within medical research, e.g., Wei and Jiang (2023), Nigashiny et al. (2024), JingYi and Min (2023), Kyriaki (2023), Ali et al. (2022), Rong et al. (2024), Chen et al. (2024), Ji-Hua et al. (2024), as well as the built environment, e.g., Mutlu Avinç and Yıldız (2024). It relies on pattern sensing and clustering of key words and phrases using the keywords cited by authors and other identifying information such as country of origin, affiliated research institution, author, and number of citations. The intent of the analysis is to quickly distill vast quantities of information, particularly in fields of study such as MCDA where a high number of research articles have been published, to provide a quick understanding of where the research frontier is and where the opportunities for additional research may be. It is also time sensitive and so themes may be shown to have evolved over time and citations allow for a view of how academic literature is interacting with and influencing other research. This study, atop of the aforementioned benefits, seeks to use academic research activity as a market for inferring the level of MCDA adoption within Built Environment contexts. A method for scientific analysis using Bibliometrix was articulated in “Bibliometrix: An R-tool for comprehensive science mapping analysis” (Aria and Cuccurullo, 2017).
Google Trends generates data sets that indicate the relative search activity at any given time, subdivided by months of the year since its inception in 2004. Like Bibliometrix, Google Trends has long been used in academic research and also within medical research applications e.g., Nann et al. (2021), Qian et al. (2022), Wang D. et al. (2024), Wang Y. et al. (2024), Kai et al. (2021), Kashish and Punith (2023), Mikołaj et al. (2023), Naqash et al. (2024) and indeed, within the built environment, e.g., Fu and Miller (2022), though there are some instances of literature the notes problems with Google Trends based research (Liu, 2024). One of the arguable benefits of this data set is that it likely reduces the Hawthorne effect relative to other methods of study, given most search engine users interact with the search engine without conscious thought to how their search terms are being tracked and quantified and aggregated. Moreover, the benefit of Google Trends is the vast amount of data that flows into Google Search which has long been the dominant search engine of the world. The sample size of this data set is extraordinary and so confers those advantages on research based on its metrics.
Qualtrics is a web-based questionnaire platform and a particular questionnaire was formulated within the research paper titled “Multi-Criteria Decision Analysis Adoption Rates and Maturity Model “in which 30 industry professionals were asked about their level of MCDA adoption using 25 specific methods originally identified in “A review of application of multi-criteria decision making methods in construction” (Jato-Espino et al., 2014) and sought to relate those adoption rates to respondent characteristics and attributes of their employing company, such as market capitalization value, number of employees, Minority or Woman-Owned Business Entity structures, and span of time in operation, among other metrics. This data set is unique is that it forced respondents to consider a list of 25 unique MCDA types and rate their familiarity and level of use consideration, to include indicating if they simply were unaware of them. While the absence of data might lead researchers to infer lack of familiarity, this data set employed an MCDA use maturity spectrum that collected data of various levels of familiarity and use, nullifying the need to make inferences and instead use data to develop a picture of MCDA adoption rates in use during the span of this study.
The primary reason the questionnaire was limited to the 25 identified MCDAs is that this allowed the research to circumnavigate the complexities involved in running a Bibliometric analysis of hybrid MCDA methods. Hybrid MCDAs were created by blending methods in an attempt to minimize the disadvantages of an isolated MCDA method and/or enhance the benefits of a blended approach. The authors of this research focused strictly on MCDAs and, for this study, excluded hybrid MCDAs, which is a growing field of research. Including the hybrid methods would likely skew the Bibliometric metadata search given hybrid methods most commonly involve a naming convention comprised of their component MCDA parts. For example, the hybrid MCDA Fuzzy AHP-TOPSIS is observable within the academic literature and involves merging three of the selected 25 MCDAs. As such, conducting a bibliometric study for this and other hybrid methods would require searching for all permutations of the 25 identified MCDAs, which would be a vast number of combinations. This also assumes that no unique naming conventions might be employed for hybrid MCDA methods, which is likely untrue. For these reasons, focusing on non-hybrid MCDAs imposed a practical constraint on this research. While hybrid MCDAs represent an exciting avenue for future research, they have been excluded from this study.
The aim of this research is to assess whether data from search engine activity and academic literature can add insights into Multi-Criteria Decision Analysis (MCDA) adoption within Built Environment fields. This study cross-references data from these sources with a dataset gathered from a survey of industry professionals, aiming to establish a ranked list of MCDA methods by their levels of adoption. By integrating diverse datasets—search engine data, Web of Science metadata, and survey responses—this research seeks to leverage the strengths of each data source, resulting in a comprehensive assessment that bolsters evidence through a broad sampling of public, academic, and professional perspectives. The survey data collected through the MCDA Adoption, Obstacles, and Interventions questionnaire underscores a trend of low MCDA adoption within the Built Environment sector. As this data relies on the participation of a representative respondent sample, its results may vary in representativeness and completeness. This paper, therefore, aims to enhance this dataset by cross-referencing it with complementary sources, specifically Bibliometrix-generated analyses and Google Trends data, thereby offering a more robust perspective on the current usage and awareness of MCDA within the Built Environment.
The intended focus of this research is private sector entities that do not enjoy government funding but, instead, operate within the global competitive market. The reason for this focus is the assumption that competitive pressures in a pure market condition will greatly enhance the pressure of entities to optimize decision-making, thus leading to differing MCDA adoption profiles between private entities and public entities that enjoy subsidies from the government. An example of this may be comparing an Engineering, Procurement, Construction (EPC) firm a U.S. public university system. Both entities engage the built environment, the EPC firm by providing capital project execution services across multiple subject matter domains, and the public university system via the engagement in campus design development, often involving works of signature architecture and marquee design as a source of inspiration, and the curatorial maintenance of that constructed environment. Public universities always have in-house staff dedicated to design, construction, real estate, and facilities management. Given they enjoy public taxpayer funding, a myriad of transparency laws and processes must be observed to avoid fraud and protect the public interest in judicious use of public funds, greatly slowing capital project execution.
Figure 1 is a flow chart showing how Bibliometrix and its low-code user interface Biblioshiny was used to develop one of three related data sets that, within this research paper, are cross-referenced to arrive upon an inferred level of MCDA adoption ranking. Bibliometric analysis is a form of research in which metadata from academic literature digital libraries is analyzed. This method has been broadly used within academia and research to include within medical research, e.g., Wei and Jiang (2023), Nigashiny et al. (2024), JingYi and Min (2023), Ali et al. (2022), Rong et al. (2024), Chen et al. (2024), Ji-Hua et al. (2024), Fhaied (2024), Lamei et al. (2024), as well as the built environment, e.g., Mutlu Avinç and Yıldız (2024), Mutlu Avinç and Yıldız (2024). It relies on pattern sensing and clustering of key words and phrases using the keywords cited by authors, abstract text, and other identifying information such as country of origin, affiliated research institution, author(s), and number of citations. The intent of the analysis is to quickly distill vast quantities of information in this field of MCDA study where a high number of research articles have been published to make data-informed inferences related to likely levels of adoption. Bibliometrix analyzes the metadata of academic journal databases such as Web of Science and SCOPUS. It does so with a vast number of filters available to influence the data set, to include academic domain filters. The tool can create exportable Excel files for stand-alone analysis beyond the constraints of the Bibliometrix system, based in the programming language R.
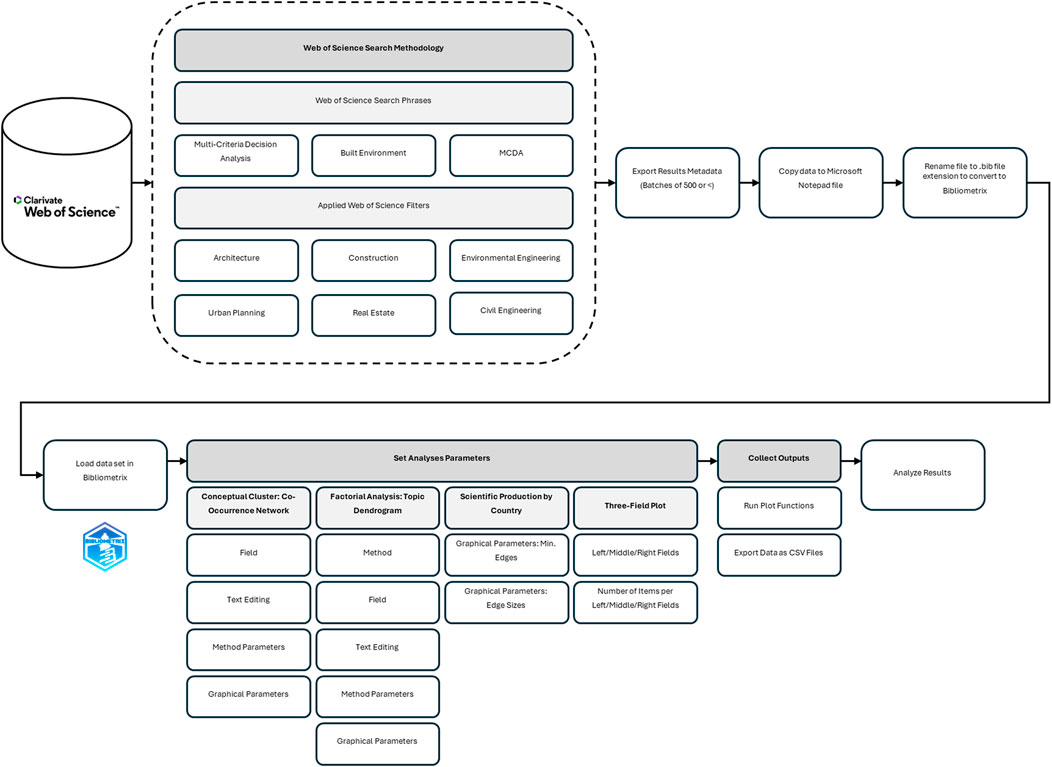
Figure 1. Bibliometrics methodology flow chart.
Figure 2 shows precisely what information was collected in deployed industry professional questionnaire, which was incorporated as one of three distinct data sets, for this analysis. The questionnaire was originally designed to test MCDA dependency on various entity and respondent characteristics, however, for the purposes of this research paper, the resulting count of each MCDA adopted was the relevant information used.
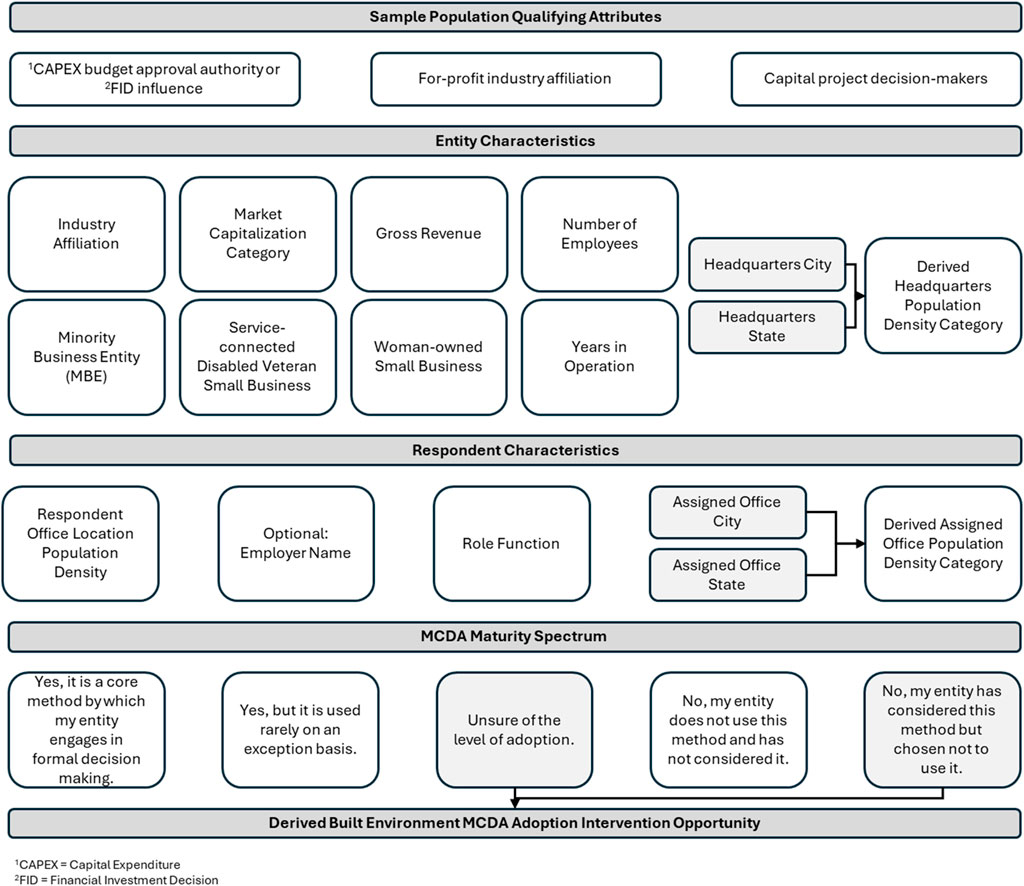
Figure 2. Qualtrics questionnaire design.
The research method will be to cross-reference the following datasets:
1. Qualtrics questionnaire data
2. Bibliometrix analysis output of Web of Science Academic Literature Data bases. Note that additional databases are available for Bibliometrix analysis, such as SCOPUS, Dimensions, OpenAlex, Lens, PubMed, and Cochrane Library, however, the metadata associated with each respective database is not structured in the same fashion and so cannot easily be blended within the Bibliometrix solution.
3. Google Trends key word/phrase outputs
By combining disparate data sources as visualized within Figure 3, additional evidence will be aggregated to revisit inferences made within the “Intervention Assessment” within “Multi-Criteria Decision Analysis Adoption Rates and Maturity Model”. The software market scan is intended to quantify which of the 25 MCDAs have established software applications which may be leveraged for use within industry.

Figure 3. Cross-referenced data sources used to create a ranked list of MCDA methods by most use within the built environment.
Mathematically, the cross-referencing will develop a z-score using the following formula:
The z-scores for all MCDA methods scores/counts from Google Trends, Bibliometrix, and the Qualtrics Questionnaire will be combined into a cumulative z-score value:
Excel was then used to develop an inferred rank of MCDA methods using the following formula:
The resulting list is a ranked order of MCDA methods from the studied set of 25 with an assumption of equal weighting between all data sets.
The case study entails Google Trends data spanning from January 2003 (when Google Trends data became available) to the time of data sourcing, October 2023. Each discrete MCDA name was typed into Google trends using a “Worldwide” quantification of search activity. Numerous permutations of the same MCDA method were entered into Google Trends using Boolean operators such as “+” (or) or “-” (not) to detect instances in which search users entered varying permutations of a given MCDA methodology. For example, the full name of a method might be searched and, separately, its acronym such as Technique for Order Preference by Similarity to Ideal Solution or (TOPSIS). In such instances, “TOPSIS” and “Technique for Order Preference by Similarity to Ideal Solution” would be searched to capture the Google Trends search interest values and using double quotations to ensure the exact phrase was searched instead of the individual words in any order, if unbounded by quotation marks. This research did not consider misspellings of MCDA names and acronyms, though these could be credibly included for consideration. The resulting data was aggregated into an Excel spreadsheet to create a view of search activity for these MCDA methods over time. The data was also leveraged to create a z-score and combine rankings in the manner described in the cross-referencing data sets section of this paper.
First, data was collected via Web of Science by searching the following terms:
• Topic: Multi-Criteria Decision Analysis
• Topic: Built Environment
• Topic: MCDA
These results yielded academic literature spanning over 3,000 unique results. This set was further refined by limiting the results to those that were catalogued under the following Web of Science subject matter domain filters: Environmental Engineering, Construction, Architecture, Urban Planning.
The exports of the 1,632 remaining articles had to be downloaded in groups of 500 and were stored as discrete text files using Microsoft Notepad. These were then combined into a singular file using the copy and paste function. The resulting aggregating text file was altered to a Bibliometric file by altering the file extension name to “.bib” rendering it readable to the Bibliometrix platform. The newly formed Bibliometrix file was uploaded to Bibliometrix for analysis, and used numerous tools to analyze the data, such as concept clustering, co-occurrence network density, topic dendrogram, word cloud, factorial analysis of a word map, scientific production by country, and a three-field plot. Some analytic and imaging functions of Bibliometrics were not used. Excel exported files were created from this bibliometric analysis yielding a complete listing of words/phrases and the corresponding number of counts of each as well as thematic clustering data. This Excel-based information was leveraged to cross-reference MCDA usage relative to the other data sources of Google Trends and Qualtrics Questionnaire data.
The Bibliometrix Web of Science data was conducted in September of 2024.
The Qualtrics questionnaire aggregated data from March 2022 through September 2024. This is information regarding (25) MCDA methods as originally studied in the article “Multi-Criteria Decision Analysis Adoption Rates and Maturity Model in the Built Environment” which based its MCDAs of interest on a set first presented by Jato-Espino et al. (2014). The intent of this data collection exercise was to conduct a broad study of MCDA methods to better understand which ones were being adopted within private sector capital project decisions based on professionals who worked within those domains. It is a highly specific and current data set, though the sample size of 30 is far smaller than that of the Google Trends and Web of Science samples and so benefits from the cross-referencing exercise in terms of enhancing the scale of sample data to arrive on a more holistic ranked list of MCDA use and adoption patterns.
The Qualtrics questionnaire, which the academic literature reveals to be a routine tool for scientific data collection, e.g., Bridge et al. (2021), Johnson (2021), Miller et al. (2020), and Chen et al. (2023), used a web-based interface to collect information directly from respondents who represent a population of convenience, not a true random sample. The platform allowed for an export of the results to Excel from which a list of the most used methods were aggregated. In particular, a numeric value was associated with the level of adoption following a range of 2 through −2 and each intervening integers, however, for the purpose of this exercise, the maturity spectrum was collapsed into three possible outcomes: yes (1), unsure (0), and no (−1), with only the yes values being tabulated and considered within the ranking metric and the degrees of non-use, whether unsure or no, not influence the related scores.
Table 1 presents a line graph illustrating Google Trends search data for various MCDA methods from January 2004 to September 2024. The data is subdivided by month and year, and the search interest is normalized based on Google’s standard methodology. Each data point represents relative popularity by comparing the number of searches for a term to the total searches within a geographic region and time frame, scaled from 0 to 100. This ensures that search volumes across different regions and time periods are comparable, even if their absolute volumes vary.
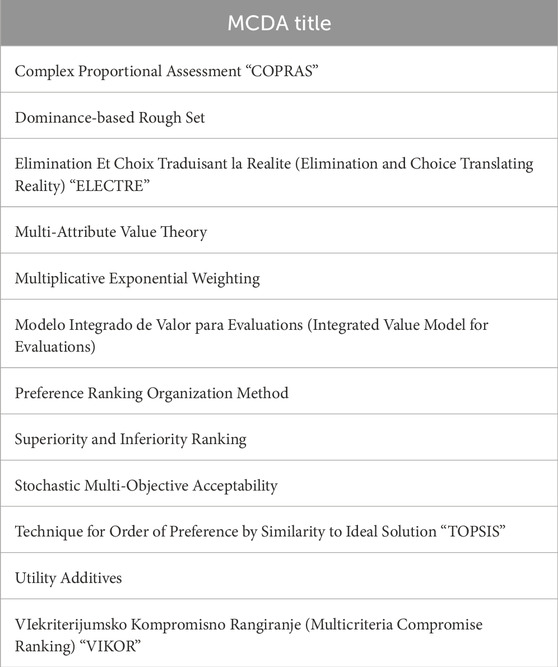
Table 1. MCDA methods that yielded No google trends output data.
Notably, low-volume search terms yield no results in Google Trends, which itself provides valuable insights into the relative obscurity of certain MCDA methods. For example, some MCDA methods like “Simple Additive Weighting” exhibited intermittent search interest with occasional spikes, while others like the “Analytic Hierarchy Process” (AHP) consistently showed higher search activity. The graph provides a longitudinal view of public interest in MCDA methods, offering a useful comparison of which methods have gained or sustained popularity over time, potentially indicating trends in the adoption and public interest in these decision-making tools.
Figure 4 is a line graph overlaying the Google Trends search data since the inception of Google’s search tracking in January of 2004 to Present (October of 2023). The data is subdivided by month and year and is expressed as normalized data leveraging the following rules, as per Google’s website:
• “Each data point is divided by the total searches of the geography and time range it represents to compare relative popularity. Otherwise, places with the most search volume would always be ranked highest.
• The resulting numbers are then scaled on a range of 0–100 based on a topic’s proportion to all searches on all topics.
• Different regions that show the same search interest for a term do not always have the same total search volumes.” (“FAQ about Google Trend Data,” 2024)
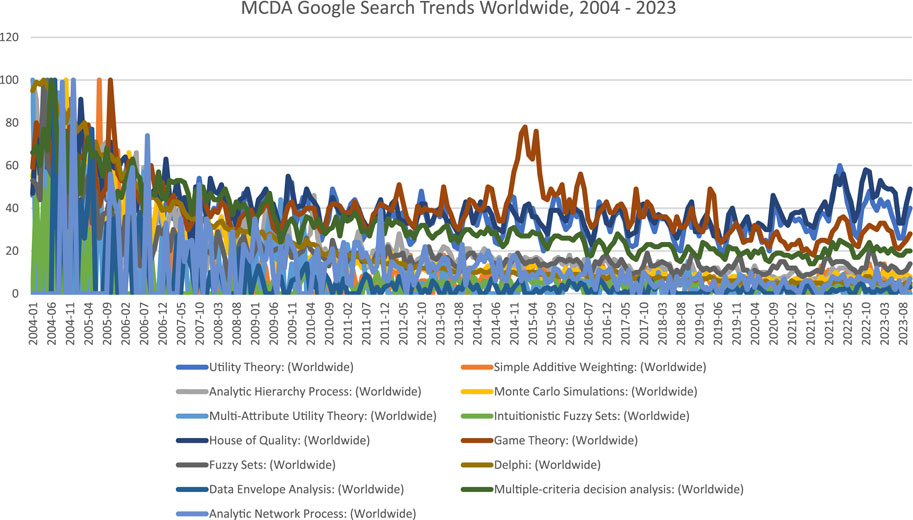
Figure 4. Google trends search volume per unique MCDA types, 2004–2023.
Low volume search terms and phrases do not yield results within Google Trends, which is a form of data in itself.
The Google Trends data provides additional evidence for what MCDA methods are of interest, both over time and (as it relates to this research) at the present moment. This data can be coupled with the MCDA Adoption Data for enhanced conclusions.
Google Trends does have the ability to filter by topics. There is a “Real Estate” category which may feasibly be construed as the closest filter representing the built environment sector, however, I have elected an unfiltered version of the results lacking better definition of what is included and excluded within the real estate results. The data is global and is based on web searches and so excluded YouTube search activity.
Of most interest to the research objectives is the search interest of these methods at the present time. As such, the Google Trends search data has been filtered to the current month such that it may be coupled to the MCDA Built Environment Questionnaire Data with the database linking relationship key being the title of the MCDA method. Table 2 presents this information using the ranked order of all data sets as raw scores which may be combined to arrive upon a cumulative ranked order, from greatest adoption to least adoption.
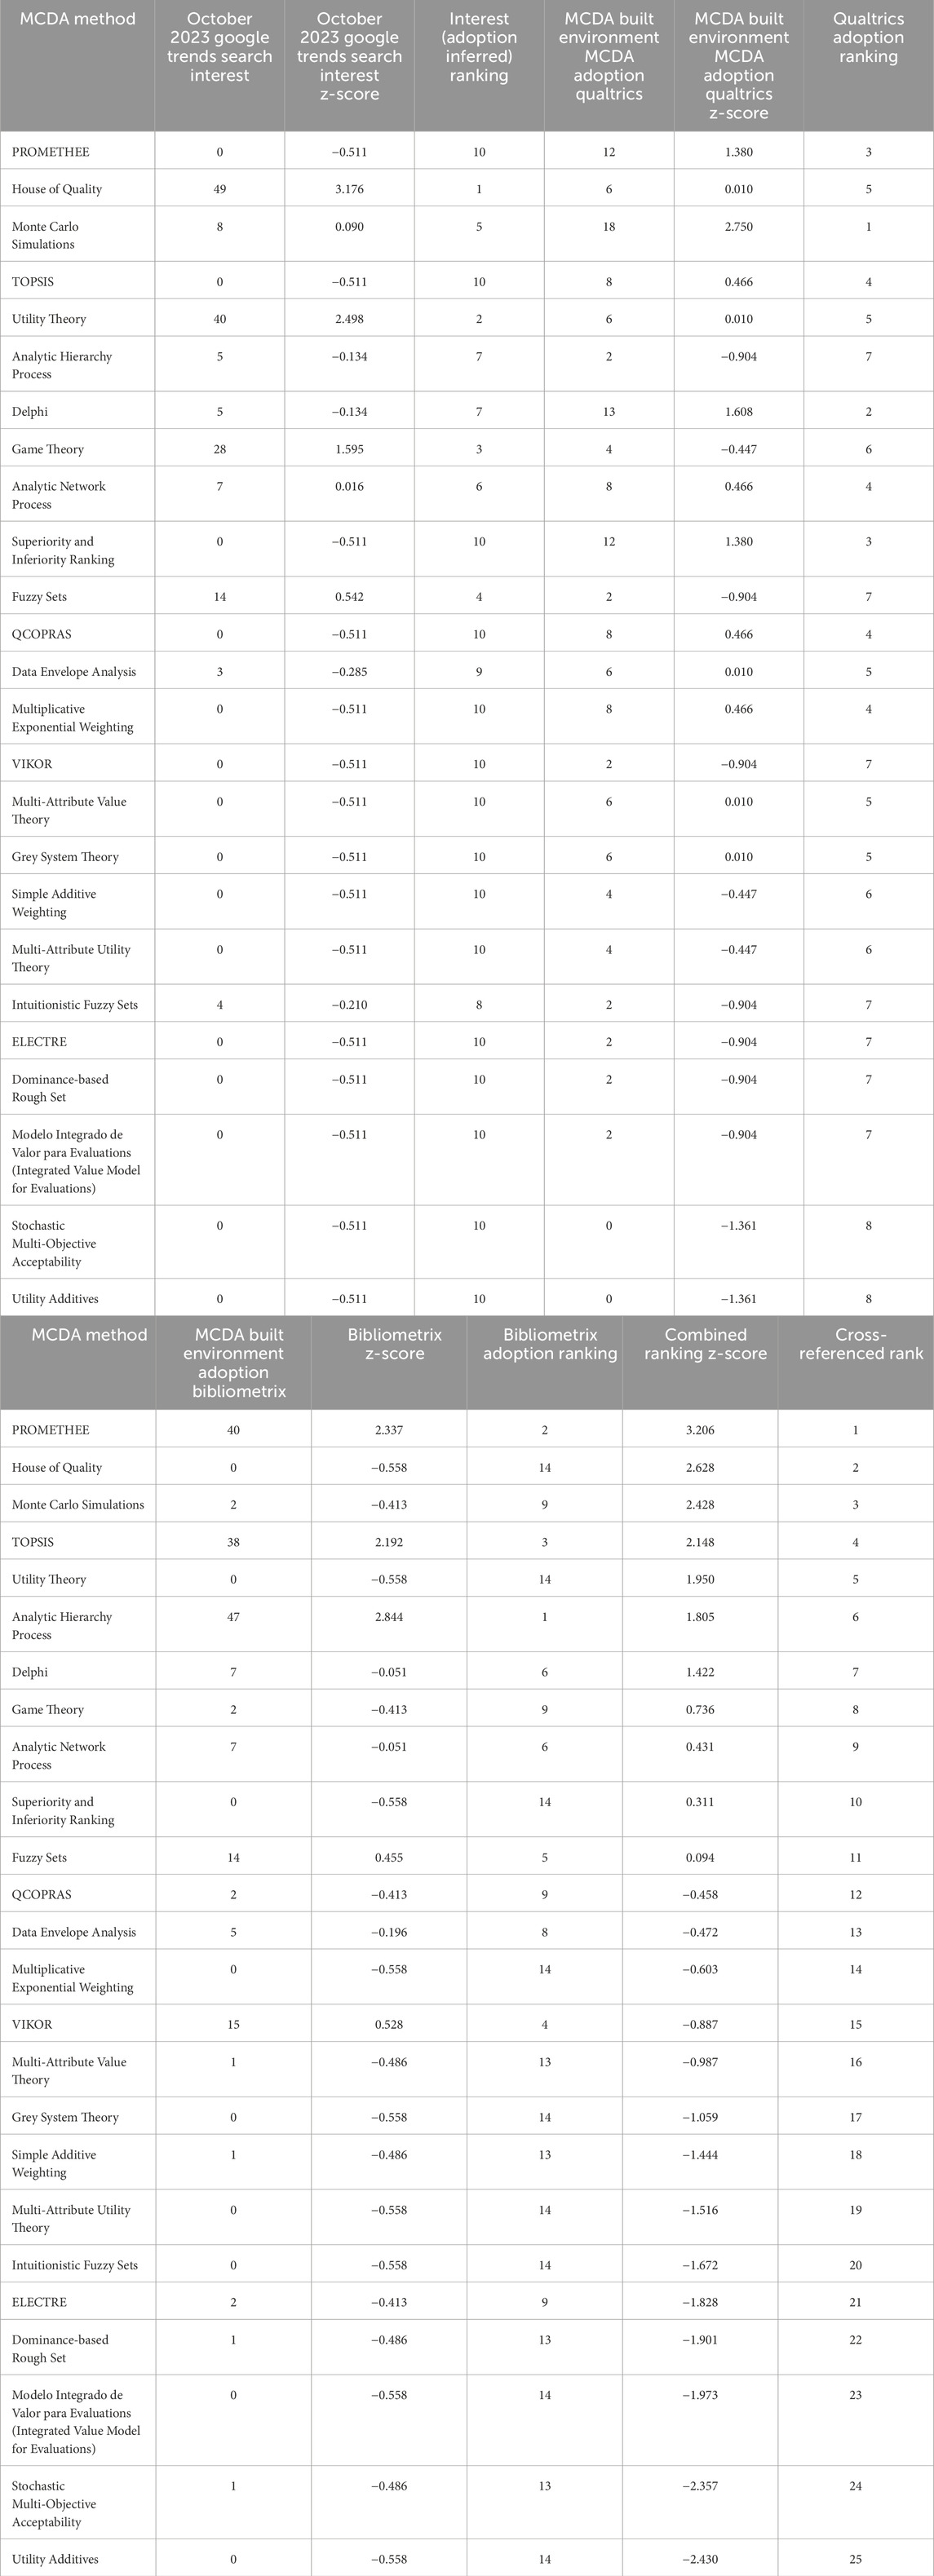
Table 2. Cross-referenced MCDA built environment and google trends MCDA search term prevalence ranking.
Table 2 reveals notable discrepancies across the various data sources in terms of the prevalence and adoption of specific MCDA methods. For instance, the Bibliometrix analysis shows the VIseKriterijumska Optimizacija I Kompromisno Resenje (VIKOR) method as the 4th most researched method in academic literature within the Web of Science for “MCDA” and “Built Environment,” whereas the Qualtrics questionnaire indicates a much lower familiarity and adoption of VIKOR within industry professionals. This contrast suggests a disconnect between academic research and private sector usage, where academia might focus on methods that are less frequently adopted in practice.
Another striking example is the Simple Additive Weighting (SAW) method, ranked as the 4th most adopted method in the questionnaire but entirely absent from Google Trends, and ranked last in the Bibliometrix analysis with no mentions among 1,500 ingested academic papers. Despite its simplicity and intuitive application, SAW’s absence in both public interest and academic focus is unexpected.
Similarly, the Stochastic Multi-Objective Acceptability method appears frequently in academic literature through Bibliometrix but barely registers in both the questionnaire responses and Google Trends data. This highlights significant differences in MCDA adoption patterns between academia, industry, and public interest, reflecting varied levels of awareness and usage across these spheres.
With the exception of Utility Theory appearing within the top 5 of the combined ranked list, the results were unsurprising. Our experience in construction management and built environment consulting would have suggested that the Delphi technique, Analytical Hierarchy Process (AHP), and Simple Additive Weighting (SAW), however, the evidence we have gathered has contradicted that hypothesis.
Figure 5 presents a keyword relationship cluster map, which visually represents the thematic connections between various research terms and concepts. These clusters are derived from a “Clusters by Sources Coupling” map, where three distinct clusters have been identified based on the co-occurrence of keywords used by authors in their scientific studies. The analysis operates under the assumption that keywords frequently appearing together are thematically linked, helping to define specific topics within the research field. Larger labels in the map indicate a higher frequency of appearance in the academic literature, signifying the prominence of these concepts in research.
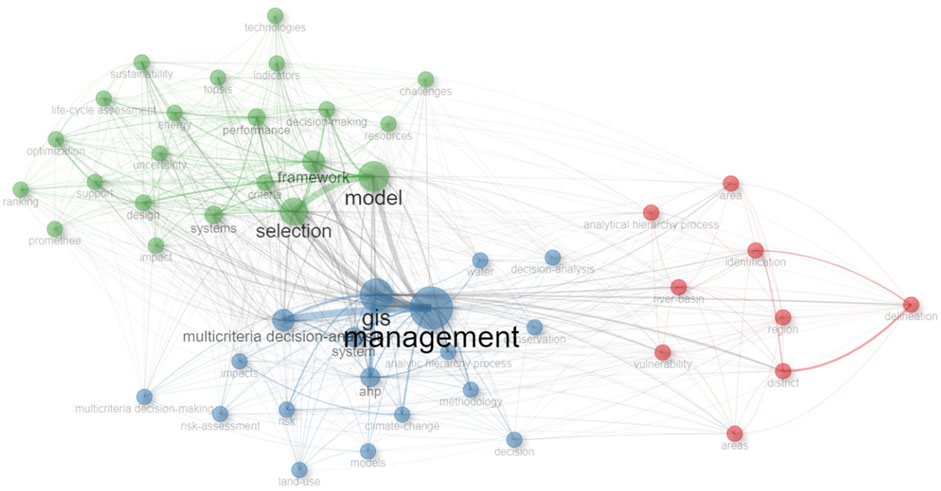
Figure 5. Network Approach: Conceptual Cluster: Co-occurrence Network for Web of Science Metadata Resulting from Search Terms “Multi-Criteria Decision Analysis”, “MCDA”, and “Built Environment” filtered by Built Environment Related Subjects.
The color-coding differentiates the clusters, providing a clear visual representation of how terms and topics are grouped. This clustering method allows researchers to quickly identify central themes and topics that are commonly studied together, offering insights into how MCDA and related methods are applied across various disciplines. By revealing these connections, the map helps to understand the broader landscape of MCDA research and its intersections with other fields, such as management, environmental sustainability, and spatial analysis (Cendana and Kuo, 2024).
Figure 6 presents a co-occurrence network density heat map, which highlights the strong association between “management” and Multi-Criteria Decision Analysis (MCDA) concepts, particularly emphasizing the Analytical Hierarchy Process (AHP) method. The central cluster, dominated by management-related terms, suggests that MCDA methods are frequently employed in decision-making processes. Surrounding this core are peripheral terms such as impacts, risk, models, and climate change, which indicate the broader context in which MCDA methods are applied, particularly in addressing environmental and risk-related challenges.
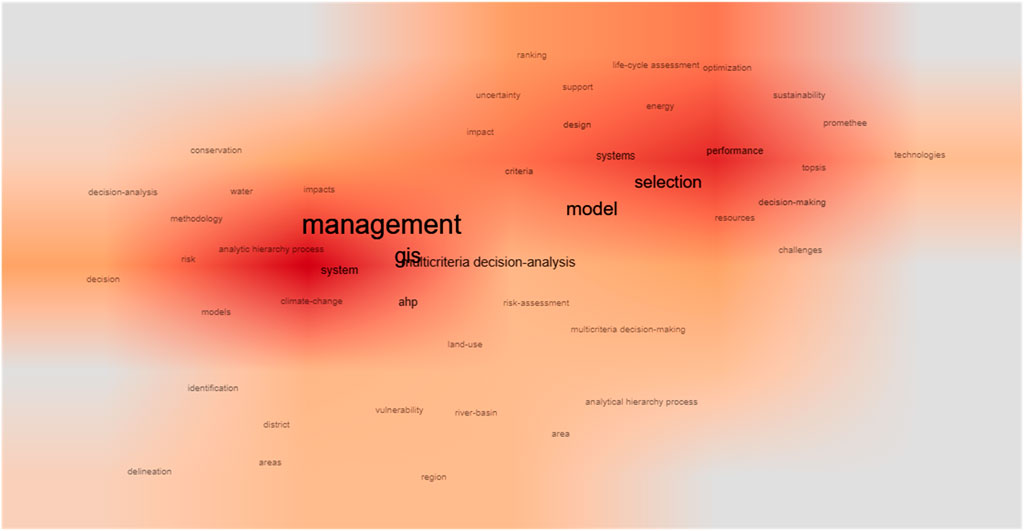
Figure 6. Co-occurrence Network Density for Web of Science Metadata Resulting from Search Terms “Multi-Criteria Decision Analysis”, “MCDA”, and “Built Environment” filtered by Built Environment Related Subjects.
Notably, Geographic Information System (GIS) appears prominently in the map, suggesting that MCDA methods are often used in conjunction with spatial analysis, where GIS serves as a platform for managing spatially sensitive input criteria. Land-use, another significant concept on the periphery, indicates that spatial and geographic factors—such as business climate, tax rates, incentives, soil conditions, and natural disaster risks—play a critical role in decision-making for capital projects. This map demonstrates how mathematical models and spatial tools like GIS are integrated into MCDA processes to enhance management decisions, particularly in scenarios where spatial, economic, and environmental considerations intersect.
Figure 7 presents a factorial analysis word map, highlighting key themes related to Multi-Criteria Decision Analysis (MCDA) in the built environment. The map illustrates the strong connection between management functions and decision-making, emphasizing the role of spatial and risk considerations in these processes. Risk appears as a central concept, encompassing terms like vulnerability and specific risks such as climate change, resource, and quality risks. Spatial terms such as region, area, district, and land-use also feature prominently, underscoring the geographic dimensions of decision-making in the built environment.
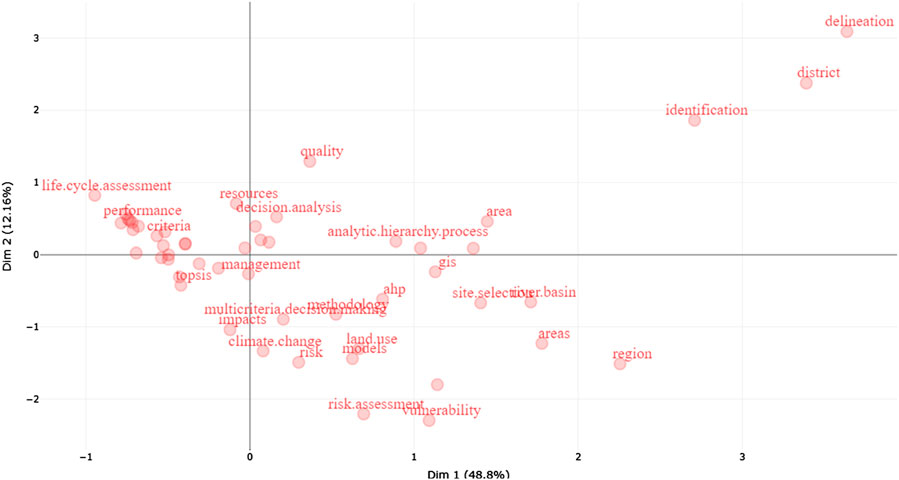
Figure 7. Factorial Analysis: Word Map for Web of Science Metadata Resulting from Search Terms “Multi-Criteria Decision Analysis”, “MCDA”, and “Built Environment” filtered by Built Environment Related Subjects.
The word map supports the study’s initial premise that MCDA methods should be integrated into built environment contexts, with a clear focus on their application in management and sustainability functions. This analysis highlights how risk and spatial considerations are essential components of decision-making within these domains, offering evidence that MCDA methods are particularly valuable in addressing complex, multi-faceted decisions related to resource management, environmental sustainability, and urban planning.
Figure 8 illustrates the Scientific Production by Country map, highlighting the global distribution of academic research on Multi-Criteria Decision Analysis (MCDA) within the built environment. This map reveals an expansive geographic reach, indicating that MCDA research is not concentrated in a single region but rather dispersed across multiple countries. If academic production is considered a proxy for the adoption of MCDA methods in industry, this figure suggests that MCDA concepts are being integrated into decision-making processes worldwide. Furthermore, the map identifies areas with significant research output, as well as regions where academic contributions to this field are limited or absent.
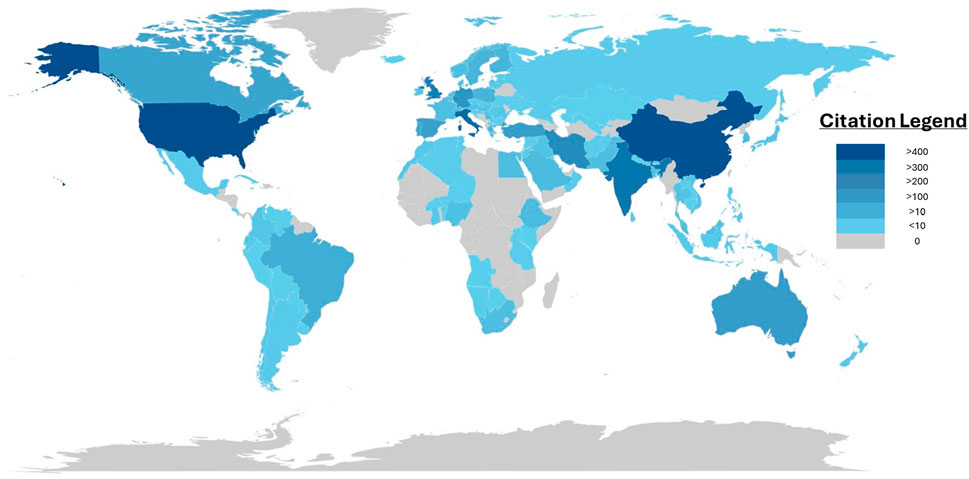
Figure 8. Scientific Production by Country for Web of Science Metadata Resulting from Search Terms “Multi-Criteria Decision Analysis”, “MCDA”, and “Built Environment” filtered by Built Environment Related Subjects.
The distribution shown in Figure 5 offers opportunities for future collaboration. By identifying countries with little or no academic activity in MCDA research, the map suggests where there might be potential to expand knowledge and application of these methods. Collaborating with researchers in these underrepresented regions could raise awareness and promote the use of MCDA in built environment decision-making, ultimately enhancing the rigor and effectiveness of capital expenditure decisions within those borders. This global view provides insight into both the current state of MCDA research and potential areas for growth and collaboration.
Figure 9 features a Three-Field Plot, represented as a Sankey Diagram, illustrating the flow of data from affiliated institutions to the authors of prevalent research, linking them to their host country of work and ultimately connecting them to key concepts and keywords in the field. This visualization provides a comprehensive view of where significant academic research is being conducted on an institutional basis and identifies patterns of conceptual interest across different institutions.
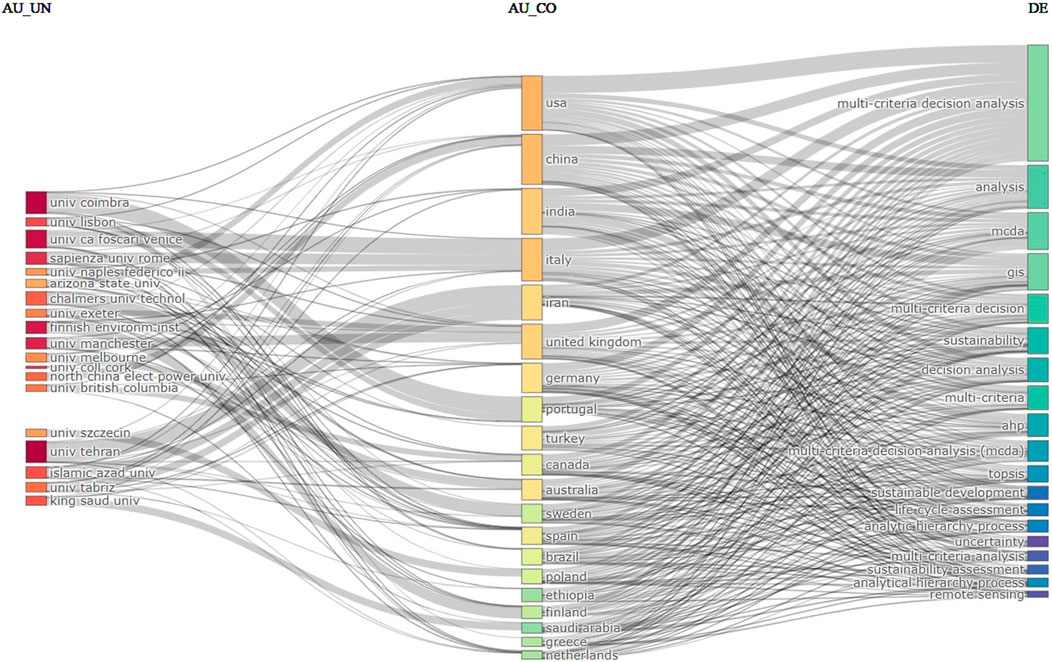
Figure 9. Three-Field Plot for Web of Science Metadata Resulting from Search Terms “Multi-Criteria Decision Analysis”, “MCDA”, and “Built Environment” filtered by Built Environment Related Subjects by Author Affiliated Institution, Country Affiliation, and Key Concepts.
A notable addition in this diagram is the presence of the term “uncertainty,” which aligns with the nature of MCDA methods, as they are particularly suited for decision-making in contexts characterized by uncertainty and vagueness. The inclusion of “remote sensing” as a frequently associated term is also significant. While geographic information systems (GIS) are commonly emphasized as tools in tandem with MCDA, remote sensing represents a complementary tool often used to supply input data for multiple criteria within MCDA models. This enhances the precision and decision-making capabilities in the built environment, demonstrating how advanced spatial analysis tools are integral to MCDA applications.
Table 3 presents a count of specific MCDA methods encountered within the Bibliometrix metadata by using author keywords related to the built environment. This analysis shows the prevalence of different MCDA methods in academic literature indexed within the Web of Science, filtered by subject categories relevant to the built environment. To ensure consistency in comparison, only the 25 MCDA methods examined in the Qualtrics questionnaire were included, while hybrid MCDAs (e.g., Fuzzy-TOPSIS) were excluded. The results indicate that the Analytic Hierarchy Process (AHP), PROMETHEE, and TOPSIS are the most frequently cited methods in academic literature. This ranking reflects the dominant use of these methods in the built environment domain, highlighting their widespread recognition and application in research. The exclusion of hybrid methods allows for a more direct comparison with industry data and public search trends, facilitating a clearer understanding of MCDA adoption within academic circles.
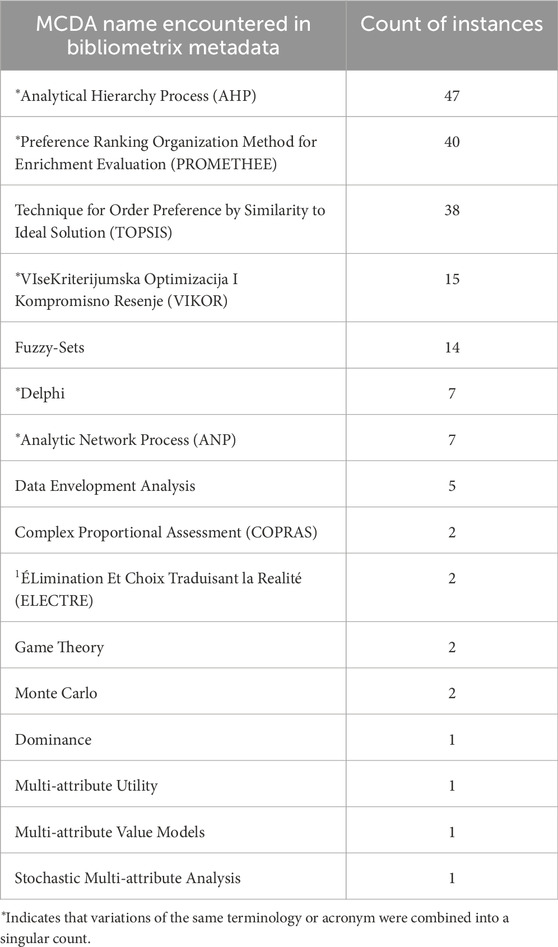
Table 3. Bibliometrix table of MCDA counts from the 25 methods selected for analysis.
While MCDA adoption has been positioned by academic literature as a valid mathematical approach to decision making, this does not imply that the cost to complete these means and methods has been determined to be a net value add to most businesses. That is, such methods may be a “nice to have” as opposed to a “need to have”. The academic literature does note one growing use case for the rise of MCDA methods, which relates to the need of licensed engineers and registered architects to leverage MCDAs as a means of recording their logic approach for their decisions in an auditable form which may later be introduced into evidence during litigation proceedings as evidence of their due diligence (Mohsen et al., 2017). This specific instance leverages MCDA adoption as a means of professional licensure protection. This suggests there may be further research potential as it relates to the insurance industry, as professional liability insurance covers these matters. The standardization of some MCDA means and methods within licensed/registered professionals subject to insurance requirements may provide an opportunity for insurance discounts and risk mitigation to insurers.
The resulting ranking list within Table 3 may serve as a de facto guide for future research opportunities. Lesser used, searched, or studied methods present an opportunity to make original contributions to various built environment disciplines. Given the rise of hybrid methods is the trend within academic research, this too presents a vast number of opportunities to create and study and seek use cases for hybrid MCDA methods.
It may well be the case that MCDA methods used within industry are covered by a veneer of technology with software based tools that employ MCDA methods designed in such a way as to mask their underlying means and methods to end users. Such efforts to hide calculation methods may have reduced public awareness of MCDA tools at their disposal, conflating the names of those methods perhaps with the names of commonly used industry software. It is unclear how much academic literature penetrates and permeates private industry practice as the pressures of competing in a dynamic, competitive environment may leave little room for absorbing trends from the applied sciences.
Google Search data does not necessarily relate to the Built Environment in isolation, and the quantity of applicability is subject to debate and research judgement. As such, cross-referencing efforts such as the one applied within this paper might feasibly weight that data set lower than the more filtered, on-topic data sets. It is, however, subject to debate given the massive scale of the data set may offset its other shortcomings.
Within the top 10 MCDA methods noted in the cross-referenced ranking in Table, the only surprise was Game Theory, as this most often suggests competitive pricing analysis. Competitive bidding within the Built Environment is prevalent, however, in private industry there is no requirement to release the values infilled within all the competitive bids. This is more often seen within the public sector. Given this, creating competitive bidding approaches to maximize profit while effectively competing for work on price likely only has sufficient available data within government (i.e., public) projects. To better understand the inclusion of Game Theory within the top 10, additional research would be required to parse-out if this relates only to public sector instances, which would fall out of the scope and bounds of this research which seeks private sector applications.
The differing metadata structure of various academic literature databases presents challenges to Bibliometric study. While the tool does accept data from differing sources, such as SCOPUS and others, it cannot pull the data in uniformly because of the structural inconsistency in how the data is stored from database to database. Some major databases are outright ignored by Bibliometrix, such as Google Scholar. Creating a unifying technology would greatly enhance the research by increasing sample sizes and enhancing pattern detection and concept cluster detection capabilities.
Beyond the public versus private sector delineation, it may well be that there is a further division to explore within private sector companies—those that are publicly traded and so must conform to the regulations of the chosen listing location and those that are run privately. The transparency requirements triggered through publicly listing the stock of an entity and disclosing financial statements and information to the market may well also have an impact on decision-making means and methods. Such considerations have been positioned as possible future research, within this study.
While the academic literature yields differing views on the pace of innovation within the construction sector, with disagreements on taxonomy, industry fragmentation, and non-uniform standards of measure such as the absence of R&D expenditure or patents issued, there is an acknowledgement that the sector is strongly reputed to resist innovation, whether true or not (Bygballe and Ingemansson, 2014; Davis et al., 2016). The questionnaire data set collected as per Figure 2 provides evidence that professionals in the built environment have been slow to adopt MCDAs, with approximately 76% of respondents indicating a lack of familiarity with the MCDA methods included in the study. With the advancement of technology and the growing availability of data, the potential to utilize these methods for improved decision-making has also expanded. However, the application of decision science methods within the built environment remains underexplored with some metadata studies of academic literature but little for profit industry data (Michael, 2021). A review of the academic literature reveals a lack of clarity regarding the use of Multi-Criteria Decision Analysis (MCDA) methods in shaping the built environment, as well as gaps in understanding where interventions could enhance familiarity and adoption among practitioners.
Failure to adopt MCDA mathematical methods at higher rates may deteriorate cost management, productivity, and schedule risk. Entities that continue to rely on gut feel, resist integrating Decision Support Systems (DSS), and eschew sophisticated mathematical modeling may see their market position eroded as entities and professionals more open to incorporating new means of analysis prove to have a more enduring operating model over the long term.
Multi-Criteria Decision Analysis is actively used within the Built Environment, with clusters of more routine use. There is robust academic literature related to concepts in Sustainability, e.g., Gohari et al. (2023), Klumbytė et al. (2021), Moghadam and Lombardi (2019). Energy consumption optimization, carbon reduction, and seemingly ubiquitous risk and schedule based Monte Carlo assessments seem to be the hallmark of this construction era, atop the ever-present profit and loss pressures that are intrinsic to private industry.
The built environment sector is marked by high pollution, high costs, high risk, unsafe conditions, and poor project management. All of this could be greatly improved via the transference and application of known mathematical means and methods derived from the field of Multi-Criteria Decision Analysis.
The academic literature does note one growing use case for the rise of MCDA methods, which relates to the need of licensed engineers and registered architects to leverage MCDAs as a means of recording their logic approach for their decisions in an auditable form which may later be introduced into evidence during litigation proceedings as evidence of their due diligence (Mohsen et al., 2017). This specific instance leverages MCDA adoption as a means of professional licensure protection. This suggests there may be further research potential as it relates to the insurance industry, as professional liability insurance addresses these considerations. The standardization of MCDA means and methods within licensed/registered professionals subject to insurance requirements may provide an opportunity for insurance discounts and risk mitigation to insurers.
This research presents several limitations that should be acknowledged. One significant challenge lies in the non-uniform structure of metadata across various academic literature databases, which limits the ability to perform a comprehensive bibliometric analysis using all available resources. Consequently, this study focuses on the Web of Science database, though future research could be expanded to include SCOPUS and other databases to provide a more holistic analysis.
The bibliometric analysis conducted allows for side-by-side comparisons of different data sets; however, it does not enable the creation of a single, unified data set. This distinction affects the ability to analyze the results in a more integrated manner, potentially limiting the depth of insight that could be gained from a combined analysis.
Additionally, there is a concern that the academic literature used in this study may not accurately reflect practices in the private sector. Caution should be exercised when extrapolating findings from this analysis to industry, as the adoption of Multi-Criteria Decision Analysis (MCDA) methods within the private sector may differ significantly from those observed in academia.
Another limitation stems from variations in nomenclature and taxonomy. Differences in terms such as MCDA and MCDM, along with other related terms, could have affected the inclusion of relevant studies, leading to potential omissions from the data set. This inconsistency in terminology introduces an additional layer of complexity to the analysis.
The study also encounters limitations with the use of Google Trends data. Google Trends does not provide precise search volume data but instead offers weighted search activity relative to total searches. This introduces uncertainty when attempting to interpret the absolute volume of searches. Furthermore, Google Trends data is not subdivided by geographic region or linked to user demographics such as age or gender, limiting the granularity of the insights that can be drawn from this data.
Moreover, the weighting applied to the different data sources, including the LSU Questionnaire, Google Trends, and Web of Science, is subjective in nature. In this study, equal weight was assigned to each data source, but alternative approaches could lead to different rankings. Researchers with varying levels of confidence in each data source might apply different weights, potentially influencing the conclusions drawn from the analysis.
Public sector (government) built environment search data and academic literature were not separate from private sector data, thereby reducing its applicability to the private sector focus of this paper. This methodological approach was undertaken for practical purposes as, in the case of Google Trends, there was no means to filter out this information, and in the instance of Bibliometrix, the 1,500 unique search results presented a challenge to cleanse the data to account for this consideration. This presents an opportunity for future research that can delineate between public and private built environment endeavors as it relates to MCDA adoption. Indeed, much of the data is silent as to whether the use case is public or private in nature, and there are other instances in which it is a moot point as the method or proposed use case is agnostic and could be applied to either public or private sector instances.
Finally, the results generated by Bibliometrix can vary based on the specific combination of search terms, operators, and filters used. As databases like Web of Science and SCOPUS continue to evolve, these differences may lead to variations in the results over time. This variability highlights the importance of consistency in search protocols to ensure comparability and reproducibility across different studies.
The bibliometric analysis reveals a notable shift in the academic literature, where sustainability-related research tends to diverge thematically from traditional built environment subjects, forming a distinct research field despite clear applications to the built environment. Management, geography, and sustainability/environmental science disciplines appear to dominate the discourse on MCDA usage in the built environment, suggesting a transfer of these methods from built environment programs to broader academic departments.
The analysis also shows that MCDA research often focuses on the application of specific methods rather than offering a comprehensive review of multiple methods. This singular focus may limit a holistic understanding of the broader field. Furthermore, the research highlights the disconnect between academia, private industry, and public interest as reflected in Google Trends data. Academic research may not fully recognize the challenges—such as complexity, tool access, and familiarity—faced by practitioners and the public. Moreover, the communication of academic findings to non-academic audiences appears insufficient, potentially limiting MCDA’s broader adoption.
Tools like Geographic Information Systems (GIS) and remote sensing frequently appear in conjunction with MCDA research, indicating a strong inclination towards integrating spatial decision-making criteria in built environment studies. This is logical, as the built environment is spatial in nature, and so capturing metadata and decision elements within the boundary of parcels or having them informed and estimated by the metadata of adjoining or nearby parcels is an industry sensitive way to explore numerous decision factors not just in isolation but in terms of spatial relationships, as well.
While this research has successfully ranked the top MCDA methods, several methodological choices, such as the selection of search terms, the application of filters, and the weighting of data sources, involve subjective judgment. These factors may influence the final rankings, suggesting that future research could benefit from expert input to enhance objectivity and consistency in such analyses. Furthermore, the distorting effects of comingled public/private sector built environment data could be further refined and filtered to unlock additional understanding of the differing MCDA use rates within those different domains.
The raw data supporting the conclusions of this article will be made available by the authors, without undue reservation.
KS: Conceptualization, Data curation, Formal Analysis, Investigation, Methodology, Project administration, Software, Visualization, Writing–original draft, Writing–review and editing. RM: Supervision, Validation, Writing–review and editing. CF: Conceptualization, Supervision, Writing–review and editing. IN: Supervision, Writing–review and editing.
The author(s) declare that no financial support was received for the research, authorship, and/or publication of this article.
The authors declare that the research was conducted in the absence of any commercial or financial relationships that could be construed as a potential conflict of interest.
The author(s) declare that no Generative AI was used in the creation of this manuscript.
All claims expressed in this article are solely those of the authors and do not necessarily represent those of their affiliated organizations, or those of the publisher, the editors and the reviewers. Any product that may be evaluated in this article, or claim that may be made by its manufacturer, is not guaranteed or endorsed by the publisher.
1French name translates to “Elimination and Choice Translating Reality”. Frequently abbreviated as ELECTRE.
Ali, J., Jusoh, A., Idris, N., Airij, A. G., and Chandio, R. (2022). Wearable devices in healthcare services. Bibliometrix analysis by using R package. Int. J. Online and Biomed. Eng. 18 (8), 61–86. doi:10.3991/ijoe.v18i08.31785
Aria, M., and Cuccurullo, C. (2017). bibliometrix: an R-tool for comprehensive science mapping analysis. J. Inf. 11 (4), 959–975. doi:10.1016/j.joi.2017.08.007
Bridge, G. A., Beth, R., Wang, C., Schmidt, X., Kause, A., Ffoulkes, C., et al. (2021). Engaging citizens in sustainability research: comparing survey recruitment and responses between Facebook, Twitter and qualtrics. Br. Food J. 123 (9), 3116–3132. doi:10.1108/BFJ-06-2020-0498
Bygballe, L. E., and Ingemansson, M. (2014). The logic of innovation in construction. Ind. Mark. Manag. 43 (3), 512–524. doi:10.1016/j.indmarman.2013.12.019
Cendana, M., and Kuo, R.-J. (2024). Categorical data clustering: a bibliometric analysis and taxonomy. Mach. Learn. Knowl. Extr. 6 (2), 1009–1054. doi:10.3390/make6020047
Chen, A. T., Komi, M., Bessler, S., Mikles, S. P., and Zhang, Y. (2023). Integrating statistical and visual analytic methods for bot identification of health-related survey data. J. Biomed. Inf. 144, 104439. doi:10.1016/j.jbi.2023.104439
Chen, W., Fu, B., Ma, F., He, Z., and Li, M. (2024). Hot spots and trends in microbial disease research on cultural heritage: a bibliometric analysis. Environ. Sci. Pollut. Res. 31 (24), 35908–35926. doi:10.1007/s11356-024-33559-5
Davis, P., Gajendran, T., Vaughan, J., and Owi, T. (2016). Assessing construction innovation: theoretical and practical perspectives. Constr. Econ. and Build. 16 (3), 104–115. doi:10.5130/AJCEB.v16i3.5178
Fhaied, A. (2024). Bibliometric analysis of global research in palliative care for cervical cancer. Front. Oncol. 14, 1432805. doi:10.3389/fonc.2024.1432805
Fu, C., and Miller, C. (2022). Using Google Trends as a proxy for occupant behavior to predict building energy consumption. Appl. Energy 310, 118343. doi:10.1016/j.apenergy.2021.118343
Gohari, A., Gohari, A., and Ahmad, A. B. (2023). Importance of green roof criteria for residential and governmental buildings: a multi-criteria decision analysis. Environ. Sci. Pollut. Res. 30 (2), 3707–3725. doi:10.1007/s11356-022-22472-4
Jato-Espino, D., Castillo-Lopez, E., Rodriguez-Hernandez, J., and Canteras-Jordana, J. C. (2014). A review of application of multi-criteria decision making methods in construction. Automation Constr. 45, 151–162. doi:10.1016/j.autcon.2014.05.013
Ji-Hua, H., Xin, Z., Hong-Mei, Y., Ya-Ling, X., Ming, Z., and Xuan, N. (2024). A bibliometric analysis of the relationship between traumatic brain injury and Alzheimer’s disease (1993-2023). Front. Aging Neurosci. 16, 1462132. doi:10.3389/fnagi.2024.1462132
JingYi, Z., and Min, L. (2023). Worldwide trends in prediabetes from 1985 to 2022: a bibliometric analysis using bibliometric R-tool. Front. Public Health 11, 1072521. doi:10.3389/fpubh.2023.1072521
Johnson, L. (2021). Exploring factors associated with pregnant women’s experiences of material hardship during COVID-19: a cross-sectional Qualtrics survey in the United States. BMC Pregnancy Childbirth 21 (1), 755. doi:10.1186/s12884-021-04234-1
Kai, Y., Guangrui, H., Lepeng, W., Ting, W., Wenbin, L., Haixu, J., et al. (2021). Predicting norovirus in the United States using google trends: infodemiology study. J. Med. Internet Res. 23 (9), e24554. doi:10.2196/24554
Kashish, M., and Punith, K. (2023). Increasing trends in online information-seeking and decreasing trends of funded research for polycystic ovary syndrome: an 18-year joinpoint analysis of Google Trends data from 2004 to 2022. Digit. Health 9, 20552076231220787. doi:10.1177/20552076231220787
Klumbytė, E., Bliūdžius, R., Medineckienė, M., and Fokaides, P. A. (2021). An MCDM model for sustainable decision-making in municipal residential buildings facilities management. Sustainability 13 (5), 2820. doi:10.3390/su13052820
Kyriaki, T. (2023). Exploring the contributions to mathematical economics: a bibliometric analysis using bibliometrix and VOSviewer. Mathematics 11 (22), 4703. doi:10.3390/math11224703
Lamei, S., Rong, Z., Yidan, G., Lei, H., and Chunhui, J. (2024). Application of Artificial Intelligence in the diagnosis and treatment of colorectal cancer: a bibliometric analysis, 2004–2023. Front. Oncol. 14, 1424044. doi:10.3389/fonc.2024.1424044
Liu, K. (2024). The measurement errors of google trends data. Discov. Data 2 (1), 7. doi:10.1007/s44248-024-00013-3
Michael, B. (2021). Uptake and dissemination of multi-criteria decision support methods in Civil engineering—lessons from the literature. Appl. Sci. 11 (7), 2940. doi:10.3390/app11072940
Mikołaj, K., Jakub, C., Piotr, S., Krzysztof, S., and Magdalena, R. (2023). The characteristics, uses, and biases of studies related to malignancies using google trends: systematic review. J. Med. Internet Res. 25, e47582. doi:10.2196/47582
Miller, C. A. G., Jeanine, P. D., Dahman, B., and Thomson, M. D. (2020). A tale of two diverse qualtrics samples: information for online survey researchers. Cancer Epidemiol Biomarkers and Prev. 29 (4), 731–735. doi:10.1158/1055-9965.EPI-19-0846
Moghadam, S. T., and Lombardi, P. (2019). An interactive multi-criteria spatial decision support system for energy retrofitting of building stocks using CommuntiyVIZ to support urban energy planning. Build. Environ. 163, 106233. doi:10.1016/j.buildenv.2019.106233
Mohsen, A., Kourosh, B., Abdollah, A., and Zoran, K. (2017). Comprehensive risk management using fuzzy FMEA and MCDA techniques in highway construction projects. J. Civ. Eng. Manag. 23 (2). doi:10.3846/13923730.2015.1068847
Mutlu Avinç, G., and Yıldız, A. (2024). A bibliometric and systematic review of scientific publications on metaverse research in architecture: web of science (WoS). Int. J. Technol. Des. Educ., 1–25. doi:10.1007/s10798-024-09918-1
Nann, D., Walker, M., Frauenfeld, L., Ferenci, T., and Sulyok, M. (2021). Forecasting the future number of pertussis cases using data from Google Trends. Heliyon 7 (11), e08386. doi:10.1016/j.heliyon.2021.e08386
Naqash, A., Linying, J., Ao, C., Honghao, R., Yu, F., Xinhua, D., et al. (2024). Global research trends on gut microbiota and metabolic dysfunction-associated steatohepatitis: insights from bibliometric and scientometric analysis. Front. Pharmacol. 15, 1390483. doi:10.3389/fphar.2024.1390483
Nigashiny, S., Jimmy, K., Matthew, N., Tong, Z., Massimo, A., Luca, D. A., et al. (2024). Evaluating global research trends in special needs dentistry: a systematic bibliometrix analysis. Clin. Exp. Dent. Res. 10 (3), e896. doi:10.1002/cre2.896
Qian, N., Junyu, L., Zixi, Z., Miyu, O., Asuka, K., Anuradhi, B., et al. (2022). Explanation of hand, foot, and mouth disease cases in Japan using Google Trends before and during the COVID-19: infodemiology study. BMC Infect. Dis. 22 (1), 1–12. doi:10.1186/s12879-022-07790-9
Rong, Y. f., Liang, X. Z., Jiang, K., Jia, H. F., Li, H. Z., Lu, B. W., et al. (2024). Global trends in research of programmed cell death in osteoporosis: a bibliometric and visualized analysis (2000–2023). Orthop. Surg. 16 (8), 1783–1800. doi:10.1111/os.14133
Wang, D., Lang, J. C., and Chen, Y.-H. (2024a). Assessment of using Google Trends for real-time monitoring of infectious disease outbreaks: a measles case study. Sci. Rep. 14 (1), 9470. doi:10.1038/s41598-024-60120-8
Wang, Y., Shi, W., Sun, Y., and Yeh, C. (2024b). A novel framework to forecast COVID-19 incidence based on google trends search data. IEEE Trans. Comput. Soc. Syst. Comput. Soc. Syst. IEEE Trans.11 (1), 1352–1361. doi:10.1109/TCSS.2023.3255256
Keywords: built environment, multi-criteria decision analysis, decision science, Bibliometrix, Biblioshiny, Google Trends, construction, architecture
Citation: Smith KA, Mostafiz RB, Friedland C and Nahmens I (2025) Bibliometric Web of Science and Google Trends analysis of multi-criteria decision analysis within the built environment. Front. Built Environ. 11:1528895. doi: 10.3389/fbuil.2025.1528895
Received: 15 November 2024; Accepted: 10 February 2025;
Published: 03 March 2025.
Edited by:
Tiago Miguel Ferreira, University of the West of England, United KingdomReviewed by:
Maria Rosa Trovato, University of Catania, ItalyCopyright © 2025 Smith, Mostafiz, Friedland and Nahmens. This is an open-access article distributed under the terms of the Creative Commons Attribution License (CC BY). The use, distribution or reproduction in other forums is permitted, provided the original author(s) and the copyright owner(s) are credited and that the original publication in this journal is cited, in accordance with accepted academic practice. No use, distribution or reproduction is permitted which does not comply with these terms.
*Correspondence: Kyle Abbott Smith, a3NtaTQ5MUBsc3UuZWR1
Disclaimer: All claims expressed in this article are solely those of the authors and do not necessarily represent those of their affiliated organizations, or those of the publisher, the editors and the reviewers. Any product that may be evaluated in this article or claim that may be made by its manufacturer is not guaranteed or endorsed by the publisher.
Research integrity at Frontiers
Learn more about the work of our research integrity team to safeguard the quality of each article we publish.