
94% of researchers rate our articles as excellent or good
Learn more about the work of our research integrity team to safeguard the quality of each article we publish.
Find out more
ORIGINAL RESEARCH article
Front. Built Environ., 26 February 2025
Sec. Indoor Environment
Volume 11 - 2025 | https://doi.org/10.3389/fbuil.2025.1528453
 Deborah Nibagwire1*
 Godson R. E. E. Ana2Egide Kalisa3
 Gratien Twagirayezu4,5
 Abdou Safari Kagabo6Jacques Nsengiyumva6,7
Indoor air pollution presents a significant global health risk, yet the influence of outdoor air pollution and meteorological factors on indoor air quality is not well understood. This study investigates these impacts in 88 naturally ventilated households across urban, suburban, and industrial areas, with no indoor smoking or cooking. Air quality measurements were continuously recorded for 24 h a day over six consecutive days during the wet season. The findings reveal that the outdoor PM2.5 levels consistently exceeded indoor levels, with weekday concentrations higher than on weekends. Specifically, urban PM2.5 levels averaged 34.8 μg/m³ outdoors and 31 μg/m³ indoors on weekdays, compared to 33.1 μg/m³ outdoors and 31.5 μg/m³ indoors on weekends. Indoor CO2 levels were notably higher, peaking at 525.7 ppm in urban areas on weekdays and 576.9 ppm on weekends, driven by increased occupancy and poor ventilation, particularly in suburban areas (880.4 ppm on weekdays and 807.5 ppm on weekends). The average indoor/outdoor (I/O) ratio for PM2.5 was 0.94, indicating that indoor concentrations are about 94% of outdoor levels, signifying significant infiltration of outdoor pollution. In contrast, the I/O ratio for CO2 was 1.47, suggesting indoor levels were 47% higher due to limited ventilation and indoor sources. This study concludes that outdoor air pollution and meteorological factors significantly affect indoor air quality in Kigali, Rwanda, highlighting the need for effective management of both outdoor pollution sources and indoor conditions.
Air pollution is one of the most significant environmental challenges posing severe risks to public health, contributing to climate change and accelerating ecosystem degradation (Singh and Singh, 2022; Akasha et al., 2023). The situation is critical in developing nations where poor outdoor air quality is responsible for nearly 3,000,000 deaths each year, with about 3,000 of these occurring in Rwanda (WHO, 2010). Indoor air pollution, on the other hand, contributes to an estimated 3.2 million fatalities each year, including over 237,000 deaths of children under five in 2020 (WHO, 2023). Globally, the cumulative impact of both outdoor and indoor air pollution is linked to 6.7 million premature deaths annually (WHO, 2023). Despite the implementation of air pollution control measures, 80% of the 7.3 billion individuals exposed to unsafe annual average PM2.5 concentrations reside in low- and middle-income countries, with sub-Sahara Africa notably experiencing a higher prevalence (Rentschler and Leonova, 2023).
Research indicates that people in urban areas spend about 85%–90% of their time indoors (Abhijeet et al., 2021). A previous study revealed that Californians spend 87% of their time indoors, 7% in enclosed transit, and 6% outdoors (Jenkins et al., 1992). For the most vulnerable groups, such as the elderly, pregnant women, individuals with lung or heart conditions, and children, this can reach up to 100% (Mannucci and Franchini, 2017). This extended indoor exposure can lead to various health issues, including respiratory problems, immune system-related allergies, cancer, reproductive effects, skin and mucous membrane issues in the eyes, nose, and throat, sensory and nervous system effects, cardiovascular problems, and systemic effects on the liver, kidneys, and gastrointestinal system (Liu et al., 2018; Van Tran et al., 2020).
Several factors significantly contribute to the air quality inside a building, including emission sources, building layouts, ventilation, and environmental conditions (Mendoza et al., 2021; Shehab et al., 2021). Additionally, physical parameters such as RH, temperature, and outdoor air pollution are essential factors that should not be ignored (Abdel-Salam, 2021a; Ferguson et al., 2020). A recent study conducted by Bekierski and Kostyrko. (2021) indicated that other factors, including the age of the building, type of housing, number of floors, number of windows, and use of air conditioning can influence ventilation patterns and infiltration factors in homes. For example, in a study investigating the interactions and contributions of factors influencing indoor PM2.5 in six office buildings in Beijing, Li et al. (2023) revealed that outdoor PM2.5 accounted for nearly 50% of indoor PM2.5 levels, with additional contributions from periodic factors (16.34%), meteorological factors (11.89%), and indoor environment conditions (16.26%). The study emphasized that while opening windows increased infiltration, it only slightly reduced indoor PM2.5 levels under certain conditions. Key factors influencing these interactions includes wind direction, temperature, and relative humidity. In a study examining the infiltration of various outdoor pollutants in 49 homes in Hong Kong, Hossain et al. (2021) found that PM2.5 has the highest infiltration factor (0.75) compared to NO2 (0.53) and O3 (0.47). Ventilation practices were found to account for 48% of PM2.5 infiltration variability, and air purifiers contributed to a reduction of 8%–9%. In a study examining the key factors influencing PM2.5 levels in rural Zimbabwe, the authors found that cooking indoors and using mixed biomass fuels were strongly associated with higher PM2.5 concentrations (Muteti-Fana et al., 2023). In the research conducted in Kampala, Uganda, natural ventilation was found to have a strong correlation with improved indoor air quality and health, particularly in low-income housing, suggesting its importance for health and sustainability (Kajjoba et al., 2024). The study assessing indoor air pollution in 246 homes in eThekwini municipality, South Africa, identified housing type, fuel use, and road proximity as key contributors to elevated pollution levels (Jafta et al., 2017).
Indoor carbon dioxide (CO2) concentrations are influenced by a range of factors, including human activity and environmental conditions. It is primarily generated by human respiration and combustion processes. Therefore, factors like occupant density and combustion-related indoor activities significantly influence indoor CO2 concentrations (Abdel-Salam, 2015). Increased air tightness, often employed to minimize energy consumption and shield against outdoor air pollution, can lead to higher indoor CO2 concentrations (Gall et al., 2016). However, poor ventilation coupled with high occupancy and activities such as smoking and cooking are responsible for elevated indoor CO2 levels exceeding 1000 ppm (Boor et al., 2017). Notably, exposure to CO2 concentrations has been associated with adverse health effects (Zhang et al., 2017).
The effects of outdoor air pollution on indoor air quality have been widely studied. Research has specifically focused on the impact of traffic-related air pollution on indoor air quality in naturally ventilated buildings (Nihar et al., 2023; Tong et al., 2016). Studies conducted in high-rise buildings in South Korea and China have explored this issue (Fu et al., 2022; Kang et al., 2021). Similarly, (Fu et al., 2022), examined the influence of PM2.5 levels on indoor air quality in a 12-story building, approximately 63 m tall. More recent studies on outdoor air pollution’s effects on indoor air quality have been conducted in multistory buildings in developed cities with advanced infrastructure and regulations, such as Shanghai, Shenyang (Fu et al., 2022; Huang et al., 2018; Kang et al., 2021). The results indicate a significant difference in indoor particle concentrations between higher and lower floors in high-rise buildings. These researches were conducted in multistory residential buildings, considering seasonal variations, air infiltration, and atmospheric meteorological conditions. However, the majority of this literature has focused on developed cities, and similar studies are scarce in developing countries, particularly in sub-Saharan Africa (Duan and Jiang, 2021; Odo et al., 2022).
This gap in research is significant given the region’s unique challenges, including relaxed air quality regulations, reliance on outdated polluting machinery and vehicles, subsidies for fossil fuels, and widespread use of solid fuels for indoor cooking. Additional factors such as congested urban transport systems, rapid industrialization, and slash-and-burn agricultural practices exacerbate air pollution levels (Agbo et al., 2021; Khan et al., 2024; Rentschler and Leonova, 2023). Furthermore, inadequate public awareness and limited access to clean energy alternatives leave vulnerable populations disproportionately exposed to high pollution levels. In Africa, PM2.5 primarily originates from traffic emissions, industrial activities, natural sources such as Saharan dust, biomass burning, poor waste management, and widespread use of diesel-powered vehicles, many of which lack particulate filters and are poorly maintained (Naidja et al., 2018; Safo-Adu et al., 2023). Additionally, substandard infrastructure and low-quality fuels intensify traffic-related pollution (Kumar et al., 2021). These factors create a significant public health concern, particularly for communities with limited access to cleaner alternatives.
Extensive research is needed to understand how outdoor air pollution and weather conditions affect indoor air quality in residential buildings in developing countries. This study examines the influence of outdoor air pollution on indoor air quality in single-family, low-density homes with a specific focus on sub-Saharan Africa, particularly Rwanda. It identifies key pollutants of concern, examines variations in indoor air quality across different residential settings, and evaluates the role of substandard building materials in worsening health risks. Furthermore, it analyzes how meteorological factors, such as temperature and relative humidity, interact with outdoor air pollution to affect indoor air quality, considering both daily and weekly fluctuations. Understanding these interactions is essential for designing effective interventions and policies to address indoor air quality concerns in developing countries like Rwanda.
The study was conducted in Kigali (Figure 1), Rwanda’s capital, at 1.9579°S and 30.1127°E. Kigali, with a population of 1,517,168, covers 730 km2, resulting in a population density of approximately 2,078 people/Km2. Most households in Rwanda (60%) use sun-dried bricks for wall construction. Charcoal is the primary cooking energy source for 58% of Kigali households, whereas gas is used by 20% (NISR, 2023). In the transportation sector, Kigali had over 30,000 vehicles in 2020 (Rwanda Utilities Regulatory Authority, 2022), and 81% of public transport bus fleets were 20 years old or less, with which the average age for buses was reported to be 13 years (REMA, 2018). Most secondary roads in Kigali are unpaved (City of Kigali, 2022). Typically, air pollution in the city is primarily due to emissions from road traffic, domestic sources, and industry (REMA, 2018).
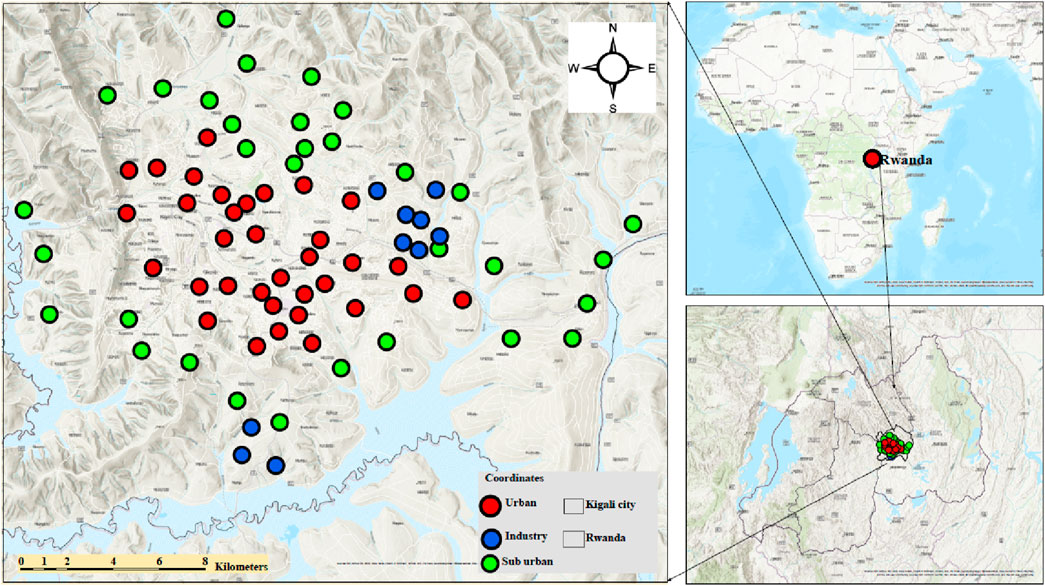
Figure 1. Locations of sampling sites (urban, suburban, and industrial zones) in Kigali, Rwanda.
Kigali receives 950 mm of rain annually, with stable temperatures ranging from 26°C–27°C during the day to 15°C–16°C at night (Rwanda Meteorology Agency). Population movement from the countryside to Kigali has been increasing. The city has tropical wet and dry seasons, with an annual average temperature of 20.50°C (Sirisena, 2018). The primary rainy season occurs from March to May, while dry spells happen from September to December and January to February. The long dry period runs from early June to August. Kigali features urban residential areas, suburban zones with rural characteristics, and industrial zones close to residential areas. Industries in these zones produce hazardous pollutants, particularly affecting nearby households. Due to this, this research was focused on PM2.5 and CO2 exposure in urban, industrial, and suburban zones.
As indicated in Figure 1 and Table 1, this study sampled 88 households in Kigali, distributed across urban (40), suburban (37), and industrial (11) areas. All homes were single-family, situated within 200 m of a road, with industrial zone homes less than 250 m from industrial facilities. Suburban homes were closest to the main road with moderate traffic. The homes varied by age: twelve were less than 5 years old, thirty-eight were 6 to 10 years old, twenty-nine were below 15 years, and nine were over 20 years old. All houses used natural ventilation through window openings.
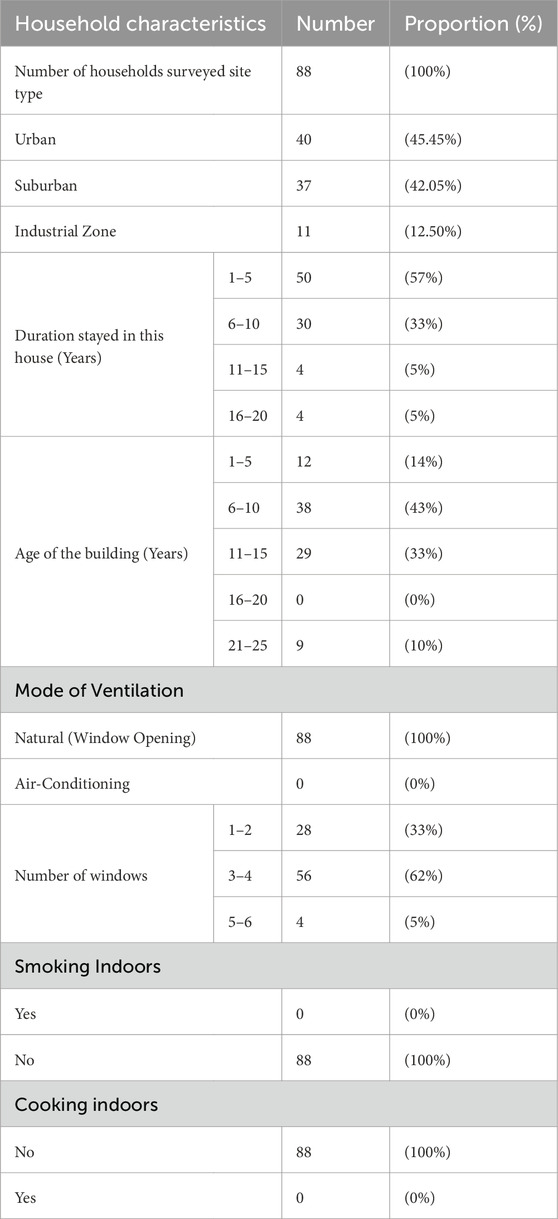
Table 1. Main characteristics of the buildings for the sampled households.
More than half of the households (45.45%) were in urban areas, 42.05% in suburban areas, and 12.50% in industrial zones, reflecting different environmental and pollution exposures. Most households (57%) had lived in their current homes for 1–5 years, indicating new occupancy. About a third (33%) stayed for 6–10 years, with fewer for longer durations. The buildings’ ages mainly were between 6–10 years (43%) and 11–15 years (33%). The smaller numbers were 1–5 (14%) or 21–25 years old (10%). All households use natural ventilation by opening windows, which is significant for indoor air quality as it influences pollutant levels. A majority of households had 3–4 windows (62%), with a smaller portion having 1–2 windows (33%) or 5–6 windows (5%). None reported indoor smoking or cooking, which helps maintain indoor air quality and reduces health risks.
During the sampling period, homes were occupied by non-smoking residents, and no indoor cooking occurred. Windows were open during the day but closed at night. Urban roads were congested, especially in the morning and evening, with heavy traffic and little greenery. Industrial areas had older homes on crowded streets with less outdoor activity, while suburban areas were less congested. The study ensured a neutral air pollution source by avoiding smoking and indoor cooking. Additional variables like wall and floor materials, the number of residents, light sources, and income were evaluated but excluded due to lack of variability.
Indoor and outdoor PM2.5, CO2, and meteorological parameters (RH and temperature) were measured using the QAir Air Visual Pro during the wet season from March to May 2024, over six consecutive days (Thursday to Tuesday) in selected houses, covering both weekdays and weekends. No data were collected on Wednesdays as this was the day allocated for relocating the monitoring instruments to different houses. All measurements were recorded continuously for 24 h with a 5-min resolution. 88 samples were collected from urban, suburban, and industrial zones, encompassing 40, 37, and 11 households, respectively. Indoor measurements were taken in rooms used less frequently whenever possible to capture indoor pollutants from outdoor sources rather than from an indoor personal cloud. Outdoor instruments were positioned at least 0.6 m above the ground and 3 m away from the nearest exterior wall of the houses.
The sensor was placed in an environment similar to that of an air quality monitoring station to validate its measurements. This setup prevents the effects of a changing environment that mobile sensors often experience. Consequently, a comparison with a reference instrument was conducted in the Nyarugenge District. Two sensors, with IP addresses 192.168.2.13 and 192.168.2.26, were studied. They were installed next to a reference instrument from the state air quality monitoring network at the meteorological station. This validation study occurred from mid-January 2024 to the end of February 2024. The sensors were placed adjacent to the reference station and were not covered to ensure they experienced the same climatic conditions and allowed for proper air circulation.
Two sensors were placed adjacent to a meteorological station, and measurements were taken over 1 week to compare the data quality of low-cost sensor readings to that of high-quality meteorological station observations. The goal was to develop outlier-aware pre-processing algorithms to improve data quality while maintaining extreme-value information.
Figure 2 illustrates the validation measurement campaign, showing the correlations between reference data and Air Visual Pro data for PM2.5, CO2, RH, and temperature. The scatter plot shows a strong positive linear relationship between the PM2.5 measurements from the Air Visual Pro sensor and the reference data. The high R-value (0.94) indicates that the Air Visual Pro sensor provides PM2.5 readings that closely match the reference data, demonstrating its reliability for PM2.5 measurements. The scatter plot for CO2 shows a moderate positive linear relationship between the Air Visual Pro sensor readings and the reference data. The correlation coefficient (0.70) suggests a reasonable but less robust agreement compared to PM2.5, indicating that while the sensor provides valuable data, it may not be as accurate for CO2 measurements.
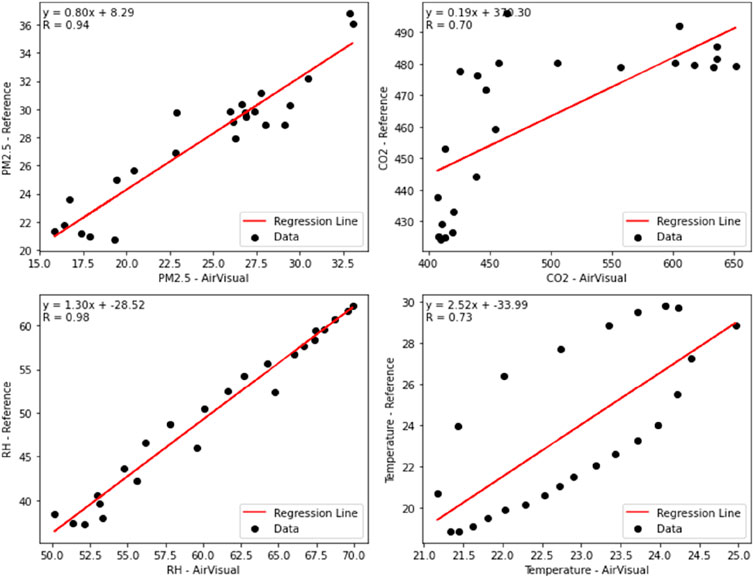
Figure 2. Correlations between reference and Air Visual Pro data for PM2.5, CO2, RH, and temperature.
The RH scatter plot demonstrates a solid positive linear relationship between the Air Visual Pro sensor readings and the reference data. The extremely high R-value (0.98) signifies that the sensor’s RH measurements are almost identical to the reference data, showcasing excellent performance in measuring RH. The scatter plot for temperature shows a moderate positive linear relationship between the Air Visual Pro sensor readings and the reference data. The correlation coefficient (0.73) indicates a good measurement, though it is not as strong as that for PM2.5 or RH. This suggests that the Air Visual Pro sensor provides reasonably accurate temperature readings but with room for improvement.
The experiment was repeated four times, and all statistical analyses were performed using IBM SPSS Statistics 27.0. Descriptive, time series and correlation analyses were conducted on real-time PM2.5 and CO2 concentrations recorded from three locations. Non-parametric statistical analyses were used to determine the relationships between indoor and outdoor air pollutant concentrations and also between PM2.5 and meteorological parameters. Python libraries were utilized to develop scripts for data evaluation and manipulation. Graphs were created using Origin 22.
As indicated in Figure 3A, during weekdays, higher concentrations of PM2.5 were observed between 06:00 and 08:00. Another significant increase in PM2.5 levels occurred between 18:00 and 20:00. The peaks in the morning and evening on weekdays can be attributed to rush hour traffic, increased industrial activities, and other human activities that contribute to higher PM2.5 emissions. The lowest PM2.5 concentration appeared between 14:00 and 16:00. Both indoor and outdoor environments showed similar patterns of PM2.5 variation, although the absolute values may differ.
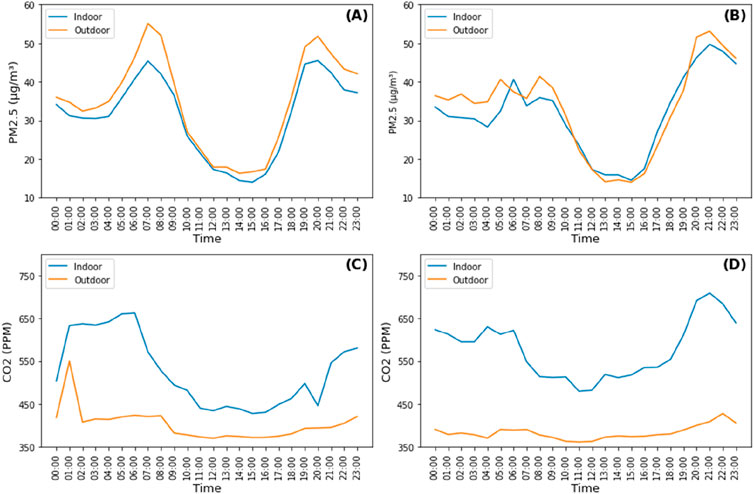
Figure 3. Diurnal variations of PM2.5 on weekdays (A), PM2.5 on weekends (B), CO2 on weekdays (C), and CO2 on weekends (D) in the urban zone.
During weekends (Figure 3B), unlike weekdays, there was a fluctuation between 06:00 and 08:00 in the morning peak. The absence of a morning peak was due to the reduced road traffic and industrial activities. PM2.5 levels were at a high peak between 19:00 and 21:00 due to various factors, such as atmospheric stability, as the temperature drops at night and the atmosphere traps car emissions, PM2.5, and other pollutants in the home and near the ground level. There was a continuous decrease from 21:00 to 23:00. Both indoor and outdoor environments showed similar trends, with variations in concentration levels. The drop in PM2.5 levels in the afternoon may be due to atmospheric dispersion and reduced human activities during this period. The evening peak and early morning rise in PM2.5 levels can be attributed to industrial activities and other contributing sources. These observations are consistent with the previous studies (Kumar et al., 2019; Nagendra et al., 2018). Weekdays exhibited higher PM2.5 concentrations than weekends due to increased human activities and road traffic, which are the primary contributors to daily PM2.5 levels in urban areas. In addition, the weekend reduction of all government institutions and many private businesses significantly reduces business activities and vehicle traffic, leading to fewer work-related operations and less road congestion than on weekdays.
Figure 3C shows that indoor CO2 levels rose between 02:00 and 06:00 during weekdays. There was another rise in CO2 levels between 18:00 and 22:00. Higher indoor CO2 levels in the morning and evening suggest increased occupancy and building activities during these times. Outdoor CO2 levels were consistently lower than indoors throughout the day. On weekends (Figure 3D), like weekdays, indoor CO2 levels rise between 02:00 and 06:00. CO2 levels also increased between 18:00 and 21:00. Minimal variation was observed in outdoor CO2 levels. Indoor CO2 concentrations on weekends were higher than on weekdays, possibly due to increased indoor activities and prolonged indoor stays (Gao et al., 2018). Notably, outdoor CO2 levels were minimal due to natural air circulation, dilution effect, photosynthesis, open space, and lower density of CO2 source.
As presented in Figure 4A, during weekdays, PM2.5 levels showed distinct diurnal variations with peaks and troughs at specific times. A slight increase in PM2.5 concentration is observed between 06:00 and 08:00, likely due to increased human activities such as commuting and industrial operations. There was a noticeable decrease in PM2.5 levels between 14:00 and 16:00. This can be attributed to higher wind speeds and solar radiation during the day, leading to the dispersion and photochemical breakdown of pollutants. A significant cumulative increase in PM2.5 concentration is seen between 21:00 and 22:00. This is due to the stabilization of the atmosphere at night and reduced dispersion, along with possible emissions from evening activities. In addition, the increases in PM2.5 concentrations during evening and night hours align with previous studies, indicating that atmospheric stability and inversion conditions lead to pollutant build-up. During weekends (Figure 4B), similar to weekdays, there were some variations in peak timings and levels of PM 2.5. A slight increase was seen in the early morning hours. A decrease was observed around midday. There was an increase in PM2.5 concentrations in the evening, peaking around 22:00. However, the levels were slightly lower than on weekdays. The findings align closely with the results of previous studies (Dahari et al., 2020; Ibe et al., 2020; Javed et al., 2021). This was caused by the build-up of particles under inversion conditions and the stability of the atmosphere at night. Additionally, the increase in PM2.5 in suburban areas may be attributed to transboundary pollution, which contributes to the concentration of PM2.5.
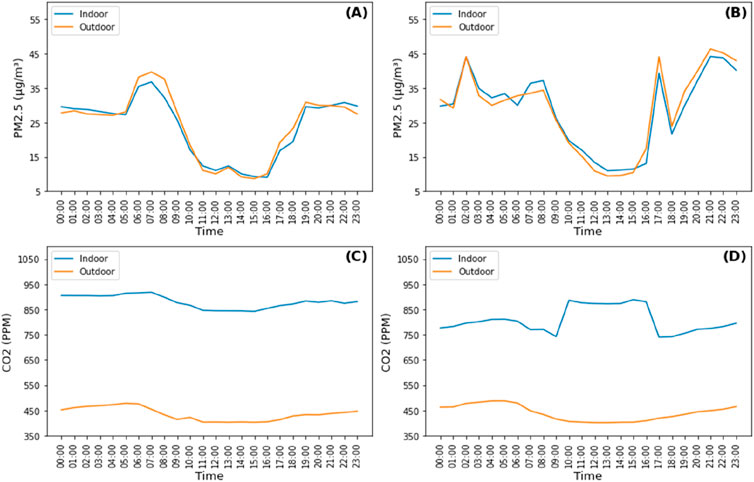
Figure 4. Diurnal variations of PM2.5 on weekdays (A), PM2.5 on weekends (B), CO2 on weekdays (C), and CO2 on weekends (D) in the suburban zone.
As indicated in Figure 4C, indoor CO2 levels remained consistently higher during weekdays than outdoor levels throughout the day. The indoor CO2 levels peaked at around 900 ppm early in the morning (04:00 to 06:00), coinciding with peak human activity indoors. The outdoor CO2 levels peaked at around 6:00 and 20:00. There was a general decrease in CO2 levels during the day due to ventilation and dispersion. As depicted in Figure 4D, during weekends, there was a similar trend to weekdays, but with slightly higher maximum levels, peaking at around 10:00 to 16:00. Outdoor CO2 levels lowered during this time but peaked at about 5:00 ppm. The higher indoor CO2 concentrations on weekends can be attributed to more extended periods of indoor activity and reduced ventilation compared to weekdays (Zhang et al., 2017).
As depicted in Figure 5A, the average PM2.5 concentration on weekdays showed a clear diurnal pattern. PM2.5 levels were relatively high in the morning (06:00 to 08:00), likely due to industrial activities and traffic. The concentration decreased and reached a minimum in the late afternoon (14:00 to 16:00). There was a significant increase in PM2.5 levels starting from 17:00, peaking at approximately 19:00. The peak PM2.5 concentration on weekdays was around 70 μg/m³ outdoors and 65.3 μg/m³ indoors. As shown in Figure 5B, similar diurnal patterns were observed during weekends with some variations. PM2.5 concentrations increased in the evening, peaking at around 20:00. The peak values were higher on weekends, with outdoor levels reaching approximately 90 μg/m³ and indoor levels around 83 μg/m³. The minimum concentrations were observed in the late afternoon (14:00 to 16:00), similar to weekdays. High evening and nighttime PM2.5 levels can be attributed to industrial processes, emissions, and reduced dispersion due to stable atmospheric conditions. During weekdays (Figure 5C), indoor CO2 peaks at 23:00, whereas outdoor CO2 levels peak at around 4:00 in the morning. The highest concentrations were generally observed in the late evening and early morning, likely due to reduced ventilation and human activity indoors. As shown in Figure 5D, during weekends, indoor CO2 concentrations were slightly higher than on weekdays, peaking at 00:00. Outdoor CO2 levels were lower on weekends, peaking at around 14:00. The overall pattern indicates higher CO2 levels indoors compared to outdoors, consistent with the presence of human activities and reduced ventilation (Palareti et al., 2016; Zhang et al., 2017).
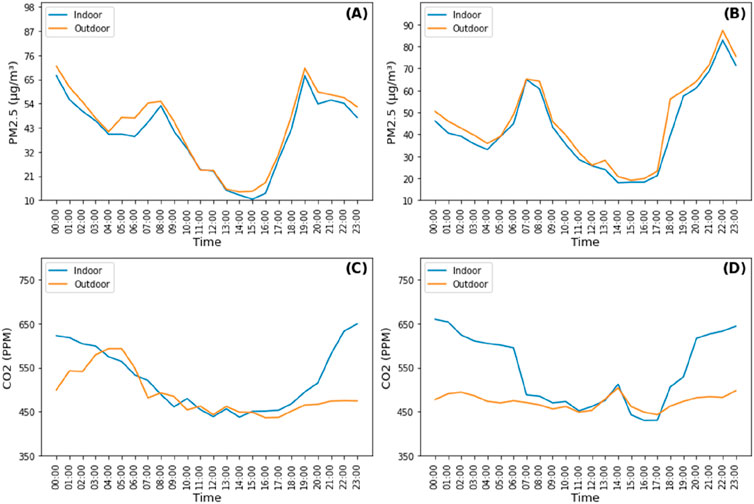
Figure 5. Diurnal variations of PM2.5 on weekdays (A), PM2.5 on weekends (B), CO2 on weekdays (C), and CO2 on weekends (D) in the industrial zone.
As seen in Figure 6A, the mean PM2.5 concentrations in urban sites were 34.8 μg/m³ and 31 μg/m³ on weekdays and were about 33.1 μg/m³ and 31.5 μg/m³ on the weekends in outdoor and indoors, respectively. The PM2.5 concentration on weekdays was higher than on weekends in urban areas. These observations support the findings for other major cities. For example, in prior research (DeGaetano and Doherty, 2004) in New York, PM2.5 levels were significantly lower on weekends and consistently high on weekdays due to human activity. The mean PM2.5 concentrations in suburban sites were around 24.2 μg/m³ and 23.7 μg/m³ on weekdays and were around 28.9 μg/m³ and 28.7 μg/m³ during weekend in outdoor and indoors, respectively. However, for suburban and industrial areas, the recorded weekend PM2.5 concentrations were higher than those on weekdays, consistent with previous studies (Heydari et al., 2019; Yao et al., 2015). This is because households in industrial sites are commonly exposed to industrial activities that emit pollutants, and trucks that typically operate around these sites can increase the fine particle levels. Both weekdays showed higher PM2.5 concentrations within industrial zones than urban and suburban sites. The outdoor concentrations were consistently higher than the indoor concentrations for each studied location, which is consistent with other studies in which indoor fine particle concentrations were significantly lower than outdoor concentrations (Kaewrat et al., 2021; Nadali et al., 2020).
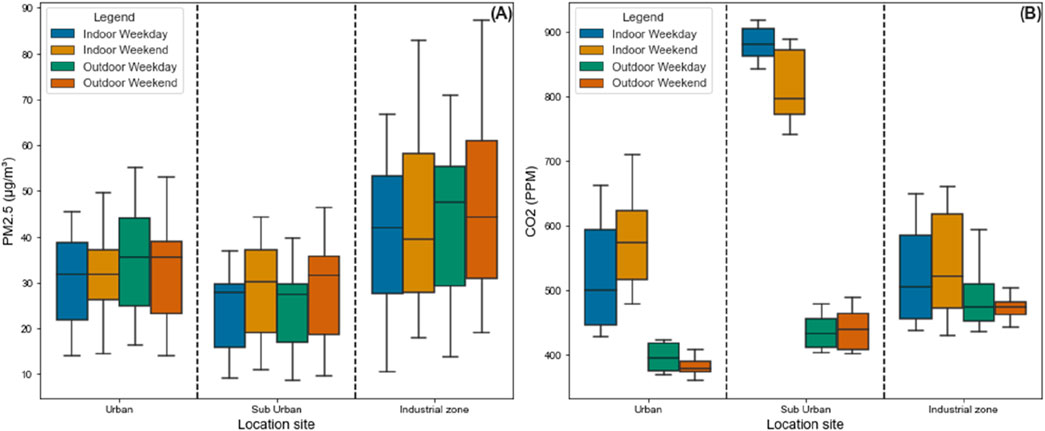
Figure 6. Variations in PM2.5 (A) and CO2 (B) on weekdays and weekends at the different sites.
As depicted in Figure 6B, the mean CO2 concentrations in urban sites were 402.0 ppm and 525.7 ppm during weekdays, and they were about 393.1 ppm and 576.9 ppm on the weekends within outdoor and indoor environments, respectively. The mean CO2 concentrations in sub-urban sites were around 435.7 ppm and 880.4 ppm during weekdays and were about 440.1 ppm and 807.5 ppm during weekends in outdoor and indoor environments, respectively. The mean CO2 concentrations in industrial zones were around 489.8 ppm and 522.9 ppm during weekdays and were about 472.4 ppm and 542.8 ppm during weekends. The highest CO2 concentrations, indoors and outdoors, compared to urban and industrial sites could be due to poor ventilation and increased human occupancy (Niu et al., 2024). This is similar to the study highlighting that indoor CO2 concentrations can significantly exceed outdoors due to inadequate ventilation and high occupancy (Chen and Hsiao, 2015).
Table 2 represents the indoor-to-outdoor (I/O) ratios of PM2.5 and CO2 concentrations in urban, suburban, and industrial zones during weekdays and weekends. The I/O ratio was calculated based on the average hourly concentrations. On weekdays, the ratios of PM2.5 levels in the urban, suburban, and industrial areas were 0.89, 0.97, and 0.91, respectively. On weekends, the average I/O ratios for PM2.5 in the urban, suburban, and industrial sites were 0.95, 0.99, and 0.92, respectively. These findings show that the PM2.5 I/O ratios below 1 across all areas indicate significant outdoor influence on indoor PM2.5 levels, which is consistent with the results of the previous study (Taushiba et al., 2023). Therefore, effective strategies to improve indoor air quality should prioritize the reduction of outdoor PM2.5 emissions, particularly in urban and industrial regions (Liu and Zhang, 2019).
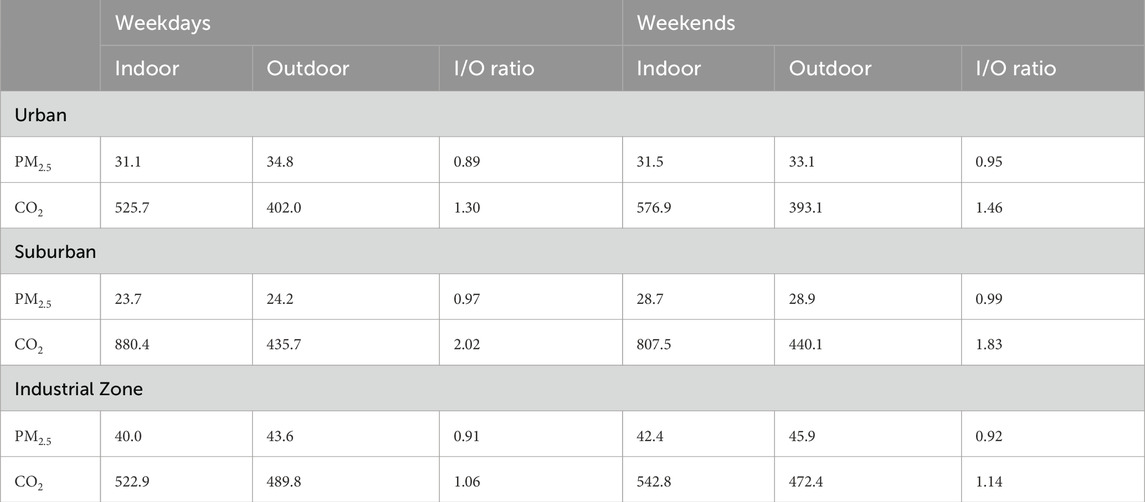
Table 2. Indoor/outdoor ratios on weekdays and weekends in the different locations.
On weekdays, CO2 ratios were 1.30 for the urban area, 2.02 for the suburban area, and 1.06 for the industrial area. On weekends, CO2 ratios at the urban, suburban, and industrial sites, the average I/O ratios were 1.46, 1.83, and 1.14, respectively. The slightly higher CO2 I/O ratios above 1 on weekends may indicate increased indoor activity or poorer ventilation compared to weekdays. The higher I/O ratios were typically observed during weekends due to increased indoor occupancy, when human activity is higher, or when ventilation is poorer (Stamp et al., 2022). This was particularly evident in residential settings where people spend more time indoors during weekends. This study suggests that effective ventilation systems are crucial for mitigating indoor CO2 levels and maintaining healthy indoor environments.
On weekdays, the ratios of PM2.5 levels in the urban, suburban, and industrial areas were 0.89, 0.97, and 0.91, respectively. For CO2, the ratios were 1.30 for the urban areas, 2.02 for suburban areas, and 1.06 for the industrial regions, respectively. On weekends, the average I/O ratios for PM2.5 for the urban, suburban, and industrial sites were 0.95, 0.99, and 0.92, respectively. For CO2 at the urban, suburban, and industrial sites, the average I/O ratios were 1.46, 1.83, and 1.14, respectively.
The I/O ratio for PM2.5 was below 1. The average I/O ratios for all sites were less than one on weekdays and weekends. This differs from the CO2 ratio, which exceeds 1 for all sites. I/O ratios less than 1 imply that outdoor air significantly influenced the households' PM2.5 indoor air quality. As a result, changes in outdoor PM2.5 concentrations may considerably impact indoor PM concentrations. The lower I/O ratios for PM2.5 indicate that outdoor air affects indoor concentration. PM2.5 is attributable to vehicle emissions from nearby congested roads, which enter the indoor environment of residences and increase concentration. These findings were consistent with those of a previous study (Oosterlee et al., 1996). Similar results were also observed (Sahu and Gurjar, 2019). They assessed indoor PM levels with an outdoor origin using empirical data and modeling. The findings revealed that the indoor proportion of outdoor particles could range from 0.05 to over 0.9 but not more than 1.
The I/O ratios for CO2 were above 1.0, which indicates higher sources of indoor CO2 and inadequate ventilation in homes (Abdel-Salam, 2021b; Kalimeri et al., 2016). These results suggest that proper heating, ventilation, and air conditioning are necessary to provide sufficient natural airflow for increased indoor CO2 concentrations. Indoor pollutant concentrations can be decreased, and indoor air quality (IAQ) can be improved by adequate ventilation (Diapouli et al., 2008; Villanueva et al., 2021; WHO, 2010). These findings suggest that indoor air quality is affected by indoor infiltration of outdoor pollutants (Kumar et al., 2019). Several factors, such as site type, day of the week, and pollution sources, can substantially impact the I/O ratio.
The I/O ratios show that the impact of indoor and outdoor sources on indoor air quality varies based on location and pollutants. PM2.5 I/O ratios were typically less than 1 in industrial and urban locations but near 1 in suburban areas, indicating that outdoor air had a higher impact on indoor air quality for PM2.5. However, the CO2 ratio was more significant than one, indicating that indoor sources contribute more to CO2 levels than outdoor air. These findings are critical for understanding indoor air quality, especially in environments with poor ventilation, where CO2 can accumulate and potentially affect occupants’ comfort and cognitive function (Huyen et al., 2024; Mendell et al., 2024).
As detailed in Table 3, a significant negative correlation exists between indoor PM2.5 concentrations and temperature across various locations, including urban, suburban, and industrial zones. The strongest negative correlation is observed in suburban areas during weekdays (−0.787**), indicating that indoor PM2.5 levels significantly increase as temperature decreases. This pattern persists during weekends, particularly in urban (−0.744**) and suburban (−0.679*) areas, suggesting that temperature consistently influences indoor PM2.5 concentrations regardless of the day or location. Similar findings were reported by Das et al. (2021) and Kliengchuay et al. (2021). The strong negative correlation between temperature and indoor PM2.5 suggests that lower temperatures, likely due to reduced ventilation and closed windows, can trap pollutants indoors.
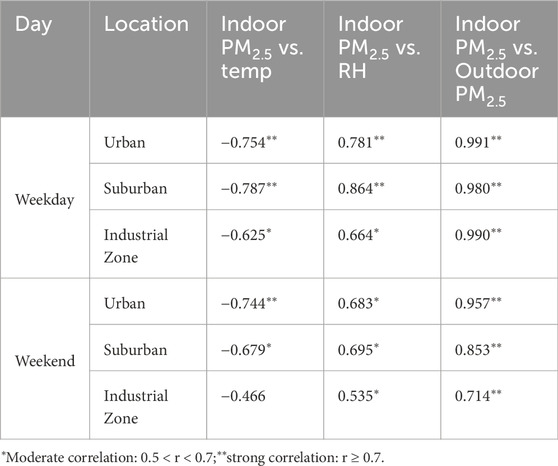
Table 3. The correlation between indoor PM2.5 and temperature, RH, and outdoor PM2.5 in three locations was analyzed.
A notable positive correlation was observed between indoor PM2.5 and RH, especially pronounced in suburban areas during weekdays (0.864**). Urban areas exhibit a positive correlation (0.683*) on weekends, though slightly weaker than weekdays. These findings indicate that higher RH levels are associated with increased indoor PM2.5 concentrations, suggesting that RH plays a significant role in exacerbating indoor air pollution, possibly due to the hygroscopic growth of particles. The results of this study correspond to those of (Gao et al., 2019; Guo et al., 2017; Wang et al., 2021).
The relationship between indoor and outdoor PM2.5 was strongly positive, with correlation coefficients nearing 1.000 in many cases, particularly in urban areas during weekdays (0.991**). This strong correlation implies that outdoor levels heavily influence indoor PM2.5 concentrations. Even in industrial zones during weekends, the correlation remained strong (0.714**), highlighting the pervasive impact of outdoor PM2.5 on indoor air quality across different environments and timeframes. These results are consistent with the results obtained from the study conducted by (Jeong et al., 2019; Meier et al., 2015)This indicates that outdoor air pollution is the main contributor to poor indoor air quality, suggesting that managing outdoor pollution sources and indoor conditions, especially meteorological factors, can improve indoor air quality.
As presented in Table 4, the age of the building shows varying correlations with other factors. It has a moderate positive correlation with site type (r = 0.615) and a robust correlation with the number of windows (r = 0.944), suggesting that older buildings may have more windows, which could impact ventilation. However, the correlation between building age and PM2.5 concentrations is moderate (r = 0.470), indicating that although there is a relationship, it may not be the primary factor influencing PM2.5 levels.
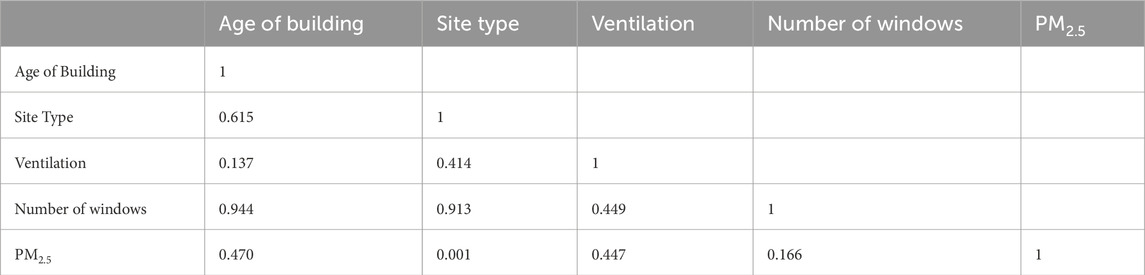
Table 4. Correlations between building characteristics and PM2.5 concentrations for the selected sites.
Next, the site type appears to have a negligible correlation with PM2.5 concentrations, as evidenced by a very low correlation coefficient (r = 0.001). This suggests that different site types (e.g., residential, industrial) do not significantly impact indoor PM2.5 concentrations. However, site type has moderate to strong correlations with other building characteristics, such as building age (r = 0.615) and the number of windows (r = 0.913). This indicates that the overall impact on PM2.5 concentrations depends more on these interconnected factors than the site type alone (Wan et al., 2022; Yu, 2023).
Ventilation, another critical factor, shows a moderate correlation with PM2.5 concentrations (r = 0.447) and has moderate correlations with other building characteristics, such as site type (r = 0.414) and the number of windows (r = 0.449). These moderate correlations suggest that while ventilation plays a role in indoor PM2.5 levels, other factors may also influence indoor air quality. The relationship between ventilation and building age (r = 0.137) is weak; this does not imply that newer buildings consistently offer better ventilation. The effectiveness of ventilation is more closely linked to specific design choices, regulatory compliance, and ongoing maintenance practices than to the building’s age alone (Aguilera Benito et al., 2021; Thirunagari et al., 2023).
The number of windows in a building, which is very strongly correlated with the age of the building (r = 0.944) and site type (r = 0.913), shows a weak correlation with PM2.5 concentrations (r = 0.166). This weak correlation suggests that simply having more windows does not significantly affect indoor particulate levels. This finding indicates that other factors, such as orientation, size, and glazing quality of windows, could contribute to the effectiveness of natural ventilation. These elements can be more critical than the age of the building itself in maintaining healthy indoor environments (Guo et al., 2022).
This study has several key limitations. Firstly, the process of monitoring exposure to household air pollution requires extensive and specific requirements, as a result, our study relied on portable monitors, with data collected from a small sample size during the rainy season and in a limited number of households. These limitations restrict the generalizability of the findings to the broader populations, other seasons, or areas with diverse socio-economic conditions or housing types. To enhance representativeness, future studies should include a larger, more diverse sample of households, with diverse lifestyles and detailed demographic, are necessary to improve representativeness and provide reliable pollution exposure data. Additionally, this study did not include mixed-effects or multivariate analyses, which would have helped account for variations across households and environments. Future research should address this gap by incorporating advanced analytical methods.
This research showcases the possibility of exploring how outdoor air pollution influences indoor air quality in naturally ventilated single-family and low-density residential buildings across different locations in Rwanda using affordable portable devices. The study monitored 88 households during the wet season, representing three distinct location types. The findings revealed that PM2.5 levels were notably higher during peak traffic hours and at night, with urban areas showing elevated PM2.5 levels on weekdays, while suburban and industrial sites had higher levels during weekends. The indoor/outdoor ratios for PM2.5 consistently remained below 1, highlighting the significant influence of outdoor air on indoor PM2.5 levels. Furthermore, CO2 concentrations were consistently higher indoors across all locations, with the highest levels observed in suburban areas during weekends, likely due to increased occupancy and reduced ventilation. The study also found that RH positively correlated with higher indoor PM2.5 concentrations, especially on weekdays in suburban areas, while temperature showed a negative correlation, particularly in suburban sites. The study’s strength lies in its comprehensive coverage of various locations and simultaneous measurements of indoor and outdoor air quality, but it is limited by its focus on a single season, suggesting the need for further research across multiple seasons to understand the variability in indoor air quality better. These findings are essential for developing strategies to effectively manage outdoor pollution sources and indoor conditions to improve air quality in Kigali. This study provides scientific evidence that can support in formulating source control policies and encourage changes in behavior to address environmental and health challenges. The following recommendations are essential for developing long-term solutions to tackle urbanization and environmental challenges, as well as mitigating health impacts:
1. The majority of industrial and commercial activities should be restricted to designated areas away from heavily populated residential zones to minimize pollution levels. In addition, measures like improving fuel quality, encouraging public transportation, and limiting the import of outdated vehicles should be implemented to decrease emissions and enhance air quality.
2. This study focuses only on Kigali, Rwanda. Its findings could have broader relevance for other parts of the country and similar regions in developing nations. Further studies are recommended in locations with distinct environmental, urban, and demographic conditions, as well as varying climates or levels of development. Additionally, research should also investigate how factors like precipitation and extreme temperature-humidity conditions interact and influence air quality.
The collected data will be made available from the corresponding author upon request.
DN: Investigation, Methodology, Resources, Validation, Visualization, Writing–original draft, Writing–review and editing. GA: Conceptualization, Supervision, Writing–review and editing, Visualization. EK: Resources, Writing–review and editing, Supervision, Visualization. GT: Writing–review and editing, Methodology. SA: Writing–review and editing, Validation. JN: Writing–review and editing.
The author(s) declare that financial support was received for the research, authorship, and/or publication of this article. The research was funded by African Union through the Pan African University scholarship and Rwanda environment management authority (REMA).
The authors declare that the research was conducted in the absence of any commercial or financial relationships that could be construed as a potential conflict of interest.
The author(s) declare that no Generative AI was used in the creation of this manuscript.
All claims expressed in this article are solely those of the authors and do not necessarily represent those of their affiliated organizations, or those of the publisher, the editors and the reviewers. Any product that may be evaluated in this article, or claim that may be made by its manufacturer, is not guaranteed or endorsed by the publisher.
Abdel-Salam, M. M. M. (2015). Investigation of PM2.5 and carbon dioxide levels in urban homes. J. Air Waste Manag. Assoc. 65, 930–936. doi:10.1080/10962247.2015.1040138
Abdel-Salam, M. M. M. (2021a). Seasonal variation in indoor concentrations of air pollutants in residential buildings. J. Air Waste Manag. Assoc. 71, 761–777. doi:10.1080/10962247.2021.1895367
Abdel-Salam, M. M. M. (2021b). Outdoor and indoor factors influencing particulate matter and carbon dioxide levels in naturally ventilated urban homes. J. Air Waste Manag. Assoc. 71, 60–69. doi:10.1080/10962247.2020.1834009
Abhijeet, G., Lata, S., Nath, T., and Dewangan, S. K. (2021). Investigation of indoor environment quality and factors affecting human comfort: a critical review. Build. Environ. 204, 108146. doi:10.1016/j.buildenv.2021.108146
Agbo, K. E., Walgraeve, C., Eze, J. I., Ugwoke, P. E., Ukoha, P. O., and Van Langenhove, H. (2021). Household indoor concentration levels of NO2, SO2 and O3 in Nsukka, Nigeria. Atmos. Environ. 244, 117978. doi:10.1016/j.atmosenv.2020.117978
Aguilera Benito, P., Piña Ramírez, C., Viccione, G., and Lepore, E. (2021). Ventilation for residential buildings: critical assessment of standard requirements in the COVID-19 pandemic context. Front. Built Environ. 7, 1–10. doi:10.3389/fbuil.2021.656718
Akasha, H., Ghaffarpasand, O., and Pope, F. D. (2023). Climate change, air pollution and the associated burden of disease in the arabian peninsula and neighbouring regions: a critical review of the literature. Sustain 15, 3766. doi:10.3390/su15043766
Bekierski, D., and Kostyrko, K. B. (2021). The influence of outdoor particulate matter PM 2. 5 on indoor air quality: the implementation of a new assessment method. Energies (Basel). 14, 6230. doi:10.3390/en14196230
Boor, B. E., Spilak, M. P., Laverge, J., Novoselac, A., and Xu, Y. (2017). Human exposure to indoor air pollutants in sleep microenvironments: a literature review. Build. Environ. 125, 528–555. doi:10.1016/j.buildenv.2017.08.050
Chen, Y. C., and Hsiao, T. C. (2015). Physiological responses to different CO2 levels in poor ventilation room. IFMBE Proc. 45, 423–426. doi:10.1007/978-3-319-11128-5_106
City of Kigali (2022). Traffic report, master plan 2050. Available at: https://bpmis.gov.rw/asset_uplds/kigali_master_plan/2_Kigali Master Plan_Main ReportLowRes.pdf.
Dahari, N., Latif, M. T., Muda, K., and Hussein, N. (2020). Influence of meteorological variables on suburban atmospheric PM 2.5. Southern Reg. Peninsul. Malaysia, 14–25. doi:10.4209/aaqr.2019.06.0313
Das, M., Das, A., Sarkar, R., Mandal, P., Saha, S., and Ghosh, S. (2021). Exploring short term spatio-temporal pattern of PM2.5 and PM10 and their relationship with meteorological parameters during COVID-19 in Delhi. Urban Clim. 39, 100944. doi:10.1016/j.uclim.2021.100944
DeGaetano, A. T., and Doherty, O. M. (2004). Temporal, spatial and meteorological variations in hourly PM2.5 concentration extremes in New York City. Atmos. Environ. 38, 1547–1558. doi:10.1016/j.atmosenv.2003.12.020
Diapouli, E., Chaloulakou, A., and Spyrellis, N. (2008). Indoor and outdoor PM concentrations at a residential environment, in the Athens area. Glob. Nest J. 10, 201–208. doi:10.30955/gnj.000553
Duan, Y., and Jiang, X. (2021). Pollution haven or pollution halo? A Re-evaluation on the role of multinational enterprises in global CO2 emissions. Energy Econ. 97, 105181. doi:10.1016/j.eneco.2021.105181
Ferguson, L., Taylor, J., Davies, M., Shrubsole, C., Symonds, P., and Dimitroulopoulou, S. (2020). Exposure to indoor air pollution across socio-economic groups in high-income countries: a scoping review of the literature and a modelling methodology. Environ. Int. 143, 105748. doi:10.1016/j.envint.2020.105748
Fu, N., Kim, M. K., Chen, B., and Sharples, S. (2022). Investigation of outdoor air pollutant, PM2.5 affecting the indoor air quality in a high-rise building. Indoor Built Environ. 31, 895–912. doi:10.1177/1420326X211038279
Gall, E. T., Cheung, T., Luhung, I., Schiavon, S., and Nazaroff, W. W. (2016). Real-time monitoring of personal exposures to carbon dioxide. Build. Environ. 104, 59–67. doi:10.1016/j.buildenv.2016.04.021
Gao, X., Colicino, E., Shen, J., Kioumourtzoglou, M., Just, A. C., Nwanaji-enwerem, J. C., et al. (2019). Impacts of air pollution, temperature, and relative humidity on leukocyte distribution: an epigenetic perspective. Environ. Int. 126, 395–405. doi:10.1016/j.envint.2019.02.053
Gao, Y., Lee, X., Liu, S., Hu, N., Wei, X., Hu, C., et al. (2018). Spatiotemporal variability of the near-surface CO2 concentration across an industrial-urban-rural transect, Nanjing, China. China. Sci. Total Environ. 631–632, 1192–1200. doi:10.1016/j.scitotenv.2018.03.126
Guo, H., Wang, Y., and Zhang, H. (2017). Characterization of criteria air pollutants in Beijing during 2014 – 2015. Environ. Res. 154, 334–344. doi:10.1016/j.envres.2017.01.029
Guo, X., Yan, S., Wang, C., Liu, S., and Wang, L. L. (2022). “The impact of window-opening behaviors on indoor air quality and human exposure during a wildfire,” in International conference on building energy and environment, 2299–2302.
Heydari, G., Taghizdeh, F., Fazlzadeh, M., Jafari, A. J., Asadgol, Z., Mehrizi, E. A., et al. (2019). Levels and health risk assessments of particulate matters (PM 2.5 and PM 10) in indoor/outdoor air of waterpipe cafés in Tehran, Iran. Environ. Sci. Pollut. Res. 26, 7205–7215. doi:10.1007/s11356-019-04202-5
Hossain, M. S., Che, W., Frey, H. C., and Lau, A. K. H. (2021). Factors affecting variability in infiltration of ambient particle and gaseous pollutants into home at urban environment. Build. Environ. 206, 108351. doi:10.1016/j.buildenv.2021.108351
Huang, K., Song, J., Feng, G., Chang, Q., Jiang, B., Wang, J., et al. (2018). Indoor air quality analysis of residential buildings in northeast China based on field measurements and longtime monitoring. Build. Environ. 144, 171–183. doi:10.1016/j.buildenv.2018.08.022
Huyen, T. T., Sekiguchi, K., Nghiem, T. D., and Ly, B. T. (2024). Effect of indoor and outdoor emission sources on the chemical compositions of PM2.5 and PM0.1 in residential and school buildings. Air Qual. Atmos. heal. 17, 1435–1450. doi:10.1007/s11869-024-01518-1
Ibe, F. C., Opara, A. I., Duru, C. E., Obinna, I. B., and Enedoh, M. C. (2020). Statistical analysis of atmospheric pollutant concentrations in parts of Imo State, Southeastern Nigeria. Sci. Afr. 7, e00237. doi:10.1016/j.sciaf.2019.e00237
Jafta, N., Barregard, L., Jeena, P. M., and Naidoo, R. N. (2017). Indoor air quality of low and middle income urban households in Durban, South Africa. Environ. Res. 156, 47–56. doi:10.1016/j.envres.2017.03.008
Javed, M., Bashir, M., and Zaineb, S. (2021). Analysis of daily and seasonal variation of fine particulate matter (PM2.5) for five cities of China. Environ. Dev. Sustain. 23, 12095–12123. doi:10.1007/s10668-020-01159-1
Jenkins, P. L., Phillips, T. J., Mulberg, E. J., and Hui, S. P. (1992). Activity patterns of Californians: use of and proximity to indoor pollutant sources. Atmos. Environ. Part A, Gen. Top. 26, 2141–2148. doi:10.1016/0960-1686(92)90402-7
Jeong, C. H., Salehi, S., Wu, J., North, M. L., Kim, J. S., Chow, C. W., et al. (2019). Indoor measurements of air pollutants in residential houses in urban and suburban areas: indoor versus ambient concentrations. Sci. Total Environ. 693, 133446. doi:10.1016/j.scitotenv.2019.07.252
Kaewrat, J., Janta, R., Sichum, S., and Kanabkaew, T. (2021). Indoor air quality and human health risk assessment in the open-air classroom. Sustain 13, 8302–8313. doi:10.3390/su13158302
Kajjoba, D., Kasedde, H., Kirabira, J. B., Wesonga, R., Mugwanya, R., Lwanyaga, J. D., et al. (2024). Impact of natural ventilation and outdoor environment on indoor air quality and occupant health in low-income tropical housing. Energy Rep. 12, 4184–4194. doi:10.1016/j.egyr.2024.10.004
Kalimeri, K. K., Saraga, D. E., Lazaridis, V. D., Legkas, N. A., Missia, D. A., Tolis, E. I., et al. (2016). Indoor air quality investigation of the school environment and estimated health risks: two-season measurements in primary schools in Kozani, Greece. Atmos. Pollut. Res. 7, 1128–1142. doi:10.1016/j.apr.2016.07.002
Kang, K., Kim, T., and Kim, H. (2021). Effect of indoor and outdoor sources on indoor particle concentrations in South Korean residential buildings. J. Hazard. Mater. 416, 125852. doi:10.1016/j.jhazmat.2021.125852
Khan, A. A., Kumar, P., Gulia, S., and Khare, M. (2024). A critical review of managing air pollution through airshed approach. Sustain. Horizons 9, 100090. doi:10.1016/j.horiz.2024.100090
Kliengchuay, W., Worakhunpiset, S., Limpanont, Y., Meeyai, A. C., and Tantrakarnapa, K. (2021). Influence of the meteorological conditions and some pollutants on PM 10 concentrations in Lamphun, Thailand. J. environ. health sci. eng. 19 (1), 237–49. doi:10.1007/s40201-020-00598-2
Kumar, P., Hama, S., Nogueira, T., Abbass, R. A., Brand, V. S., Andrade, M. de F., et al. (2021). In-car particulate matter exposure across ten global cities. Sci. Total Environ. 750, 141395. doi:10.1016/j.scitotenv.2020.141395
Kumar, S., Suresh, G., and Elumalai, P. (2019). Dependence of urban air pollutants on morning/evening peak hours and seasons. Arch. Environ. Contam. Toxicol. 2030. doi:10.1007/s00244-019-00616-x
Li, Z., Di, Z., Chang, M., Zheng, J., Tanaka, T., and Kuroi, K. (2023). Study on the influencing factors on indoor PM2.5 of office buildings in beijing based on statistical and machine learning methods. J. Build. Eng. 66, 105240. doi:10.1016/j.jobe.2022.105240
Liu, C., and Zhang, Y. (2019). Relations between indoor and outdoor PM2.5 and constituent concentrations. Front. Environ. Sci. Eng. 13, 5–20. doi:10.1007/s11783-019-1089-4
Liu, H. Y., Dunea, D., Iordache, S., and Pohoata, A. (2018). A review of airborne particulate matter effects on young children’s respiratory symptoms and diseases. Atmos. (Basel). 9, 150–218. doi:10.3390/atmos9040150
Mannucci, P. M., and Franchini, M. (2017). Health effects of ambient air pollution in developing countries. Int. J. Environ. Res. Public Health 14, 1048–8. doi:10.3390/ijerph14091048
Meier, R., Eeftens, M., Phuleria, H. C., Ineichen, A., Corradi, E., Davey, M., et al. (2015). Differences in indoor versus outdoor concentrations of ultrafine particles, PM2.5, PM absorbance and NO2 in Swiss homes. J. Expo. Sci. Environ. Epidemiol. 25, 499–505. doi:10.1038/jes.2015.3
Mendell, M. J., Chen, W., Ranasinghe, D. R., Castorina, R., and Kumagai, K. (2024). Carbon dioxide guidelines for indoor air quality: a review. J. Expo. Sci. & Environ. Epidemiol., 1–15. doi:10.1038/s41370-024-00694-7
Mendoza, D. L., Benney, T. M., and Boll, S. (2021). Long-term analysis of the relationships between indoor and outdoor fine particulate pollution: a case study using research grade sensors. Sci. Total Environ. 776, 145778. doi:10.1016/j.scitotenv.2021.145778
Muteti-Fana, S., Nkosana, J., and Naidoo, R. N. (2023). Kitchen characteristics and practices associated with increased PM2.5 concentration levels in Zimbabwean rural households. Int. J. Environ. Res. Public Health 20, 5811–5813. doi:10.3390/ijerph20105811
Nadali, A., Arfaeinia, H., Asadgol, Z., and Fahiminia, M. (2020). Indoor and outdoor concentration of PM 10, PM 2.5 and PM 1 in residential building and evaluation of negative air ions (NAIs) in indoor PM removal. Environ. Pollut. Bioavailab. 32, 47–55. doi:10.1080/26395940.2020.1728198
Nagendra, S. M. S., Yasa, P. R., Narayana, M. V., Khadirnaikar, S., and Rani, P. (2018). Sustainable cites and soceity. Supp. Open Acc., 1–828. doi:10.1016/j.scs.2018.10.006
Naidja, L., Ali-Khodja, H., and Khardi, S. (2018). Sources and levels of particulate matter in North African and Sub-Saharan cities: a literature review. Environ. Sci. Pollut. Res. 25, 12303–12328. doi:10.1007/s11356-018-1715-x
Nihar, K., Nutkiewicz, A., and Jain, R. K. (2023). Natural ventilation versus air pollution: assessing the impact of outdoor pollution on natural ventilation potential in informal settlements in India. Environ. Res. Infrastruct. Sustain. 3, 025002. doi:10.1088/2634-4505/acc88f
Niu, X., Yan, C., Tian, X., Chen, S., Dai, W., Mei, H., et al. (2024). Household air pollution in three urban function areas and related respiratory health effects. Aerosol Sci. Eng. 8, 347–356. doi:10.1007/s41810-024-00227-7
Odo, D. B., Yang, I. A., Dey, S., Hammer, M. S., van Donkelaar, A., Martin, R. V., et al. (2022). Ambient air pollution and acute respiratory infection in children aged under 5 years living in 35 developing countries. Environ. Int. 159, 107019. doi:10.1016/j.envint.2021.107019
Oosterlee, A., Drijver, M., Lebret, E., and Brunekreef, B. (1996). Chronic respiratory symptoms in children and adults living along streets with high traffic density. Occup. Environ. Med. 53, 241–247. doi:10.1136/oem.53.4.241
Palareti, G., Legnani, C., Cosmi, B., Antonucci, E., Erba, N., Poli, D., et al. (2016). Comparison between different D-Dimer cutoff values to assess the individual risk of recurrent venous thromboembolism: analysis of results obtained in the DULCIS study. Int. J. Lab. Hematol. 38, 42–49. doi:10.1111/ijlh.12426
REMA (2018). Inventory of sources of air pollution in Rwanda: determination of future trends and development of a national air quality control strategy. Available at: https://rema.gov.rw/fileadmin/templates/Documents/rema_doc/Air Quality/Inventory of Sources of Air Pollution in Rwanda Final Report.pdf.
Rentschler, J., and Leonova, N. (2023). Global air pollution exposure and poverty. Nat. Commun. 14, 4432–4511. doi:10.1038/s41467-023-39797-4
Rwanda Utilities Regulatory Authority (2022). Statistics in transport sector as of the second quarter.
Safo-Adu, G., Attiogbe, F., Emahi, I., and Ofosu, F. G. (2023). Outdoor and indoor particle air pollution and its health consequences in African cities: new evidence and an exhortation. Sustain. Environ. 9. doi:10.1080/27658511.2023.2265729
Sahu, V., and Gurjar, B. R. (2019). Spatio-temporal variations of indoor air quality in a university library. Int. J. Environ. Health Res. 00, 475–490. doi:10.1080/09603123.2019.1668916
Shehab, M., Pope, F. D., and Delgado-Saborit, J. M. (2021). The contribution of cooking appliances and residential traffic proximity to aerosol personal exposure. J. Environ. Heal. Sci. Eng. 19, 307–318. doi:10.1007/s40201-020-00604-7
Singh, A., and Singh, K. K. (2022). An overview of the environmental and health consequences of air pollution. Iran. J. Energy Environ. 13, 231–237. doi:10.5829/ijee.2022.13.03.03
Sirisena, J. (2018). “Analysis of long-term trends of climatological parameters in Kigali, analysis of long-term trends of climatological parameters in Kigali, Rwanda,” in Conference: 111th Annual Sessions of the Institution of Engineers Sri Lanka, Colombo, Sri Lanka.
Stamp, S., Burman, E., Chatzidiakou, L., Cooper, E., Wang, Y., and Mumovic, D. (2022). A critical evaluation of the dynamic nature of indoor-outdoor air quality ratios. Atmos. Environ. 273, 118955. doi:10.1016/j.atmosenv.2022.118955
Taushiba, A., Dwivedi, S., Zehra, F., Shukla, P. N., and Lawrence, A. J. (2023). Assessment of indoor air quality and their inter-association in hospitals of northern India—a cross-sectional study. Air Qual. Atmos. heal. 16, 1023–1036. doi:10.1007/s11869-023-01321-4
Thirunagari, B. K., Garaga, R., and Kota, S. H. (2023). Association of ventilation rates with building design in various built environments: a critical review. Curr. Pollut. Rep. 9, 569–589. doi:10.1007/s40726-023-00271-w
Tong, Z., Chen, Y., Malkawi, A., Adamkiewicz, G., and Spengler, J. D. (2016). Quantifying the impact of traffic-related air pollution on the indoor air quality of a naturally ventilated building. Environ. Int. 89–90, 138–146. doi:10.1016/j.envint.2016.01.016
Van Tran, V., Park, D., and Lee, Y. C. (2020). Indoor air pollution, related human diseases, and recent trends in the control and improvement of indoor air quality. Int. J. Environ. Res. Public Health 17, 2927. doi:10.3390/ijerph17082927
Villanueva, F., Notario, A., Cabañas, B., Martín, P., Salgado, S., and Gabriel, M. F. (2021). Assessment of CO2 and aerosol (PM2.5, PM10, UFP) concentrations during the reopening of schools in the COVID-19 pandemic: the case of a metropolitan area in Central-Southern Spain. Environ. Res. 197, 111092. doi:10.1016/j.envres.2021.111092
Wan, Y., Yuan, L., and Xu, X. (2022). Adopting urban morphological indicators to land use regression modeling of seasonal mean PM2.5 concentrations for a high-density city. Air Qual. Atmos. heal. 15, 559–573. doi:10.1007/s11869-021-01134-3
Wang, Z., Shi, X., Pan, C., and Wang, S. (2021). Spatial and temporal characteristics of environmental air quality and its relationship with seasonal climatic conditions in eastern China during 2015–2018. Int. J. Environ. Res. Public Health 18, 4524. doi:10.3390/ijerph18094524
WHO (2010). “Preventing disease through healthy environments,” in Exposure to air pollution: a major public health concern. Geneva, Switzerland: World Health Organization.
WHO (2023). Household air pollution. Available at: https://www.who.int/news-room/fact-sheets/detail/household-air-pollution-and-health.
Yao, L., Lu, N., Yue, X., Du, J., and Yang, C. (2015). Comparison of hourly PM2.5 observations between urban and suburban areas in Beijing, China. Int. J. Environ. Res. Public Health 12, 12264–12276. doi:10.3390/ijerph121012264
Yu, R. (2023). Correlation analysis of urban building form and PM2.5 pollution based on satellite and ground observations. Front. Environ. Sci. 10, 1–9. doi:10.3389/fenvs.2022.1111223
Keywords: indoor air quality, outdoor air pollution, meteorological influence, PM2.5 infiltration, exogenous factors
Citation: Nibagwire D, Ana GREE, Kalisa E, Twagirayezu G, Safari Kagabo A and Nsengiyumva J (2025) Analysis of the influence of exogenous factors on indoor air quality in residential buildings. Front. Built Environ. 11:1528453. doi: 10.3389/fbuil.2025.1528453
Received: 23 November 2024; Accepted: 31 January 2025;
Published: 26 February 2025.
Edited by:
Hasim Altan, Prince Mohammad bin Fahd University, Saudi ArabiaReviewed by:
Simona Mancini, University of Salerno, ItalyCopyright © 2025 Nibagwire, Ana, Kalisa, Twagirayezu, Safari Kagabo and Nsengiyumva. This is an open-access article distributed under the terms of the Creative Commons Attribution License (CC BY). The use, distribution or reproduction in other forums is permitted, provided the original author(s) and the copyright owner(s) are credited and that the original publication in this journal is cited, in accordance with accepted academic practice. No use, distribution or reproduction is permitted which does not comply with these terms.
*Correspondence: Deborah Nibagwire, ZGVib3JhaG5pYmFnd2lyZUB5YWhvby5jb20=
Disclaimer: All claims expressed in this article are solely those of the authors and do not necessarily represent those of their affiliated organizations, or those of the publisher, the editors and the reviewers. Any product that may be evaluated in this article or claim that may be made by its manufacturer is not guaranteed or endorsed by the publisher.
Research integrity at Frontiers
Learn more about the work of our research integrity team to safeguard the quality of each article we publish.