 Rupendra Subedi
 Hom B. Rijal
 Supriya Khadka
 Naja Aqilah
 Prativa Lamsal2
- 1Graduate School of Environmental and Information Studies, Tokyo City University, Yokohama, Japan
- 2Institute of Engineering, Tribhuvan University, Lalitpur, Nepal
Global warming has caused an increase in extreme heatwaves. Research on outdoor thermal comfort in urban parks has been carried out in different countries under various climatic conditions. However, there is lack of information on outdoor thermal comfort in Nepal. The main objectives of this study are to show the thermal sensations of park visitors, estimate the comfort temperature, compare the results of thermal indices with those from previous studies, and develop an adaptive thermal comfort model for the outdoor environment based on a thermal comfort survey and literature review. The study was conducted using digital instruments, and we gathered a total of 147 responses. The results showed that 78% and 81% of visitors voted in favor of “4. Neutral” thermal sensations during summer and autumn, respectively, indicating that they were highly satisfied with the thermal environment of the park. Linear regression analysis was used to estimate the comfortable physiological equivalent temperature (PET) and comfortable universal thermal climate index (UTCI) of the park, which were determined as 30.0°C and 28.5°C, respectively. These indices are correlated with the outdoor temperature, so an adaptive thermal comfort model was proposed based on literature review. The results obtained from the field survey were validated through extensive literature review. The comfortable PET, comfortable UTCI, and adaptive model were compared with several studies from different parts of the world reported to have various climatic conditions. We expect that landscape architects and urban planners can use these models to maximize outdoor thermal comfort and create more comfortable as well as healthy living environments for city dwellers.
1 Introduction
Climatic variables are altered by global warming and ultimately affect the ecosystem. Scientific data show that the impacts of global warming are extremely high (Meinshausen et al., 2009). As per the 6th assessment report of the International Panel on Climate Change (IPCC) of 2021, the global surface temperature increased by 1.09°C between 2011 and 2020 compared to that over 1850–1900. This increase was higher over land (1.59°C) than over the ocean (0.88°C) (IPCC, 2021). Wang et al. (2019) showed that living in a hot environment could cause fatigue and increased heart rate; this finding is also supported by the work by Robine et al. (2003), who reported more than 70,000 excess deaths during the 2003 European heatwave.
Urban greenery is especially helpful in warmer climates as it reduces heat islands and increases comfort (Givoni, 1989). Thermal comfort is defined as the “condition of mind that expresses satisfaction with the thermal environment and is assessed by subjective evaluation” (ASHRAE, 2004). Urban parks have attracted a lot of attention from researchers nowadays. They help to filter air pollution, thereby enhancing the quality of air and outdoor comfort. These parks play vital roles in creating unique experiences and a standard of living for both locals and tourists. The social, environmental, and health aspects of citizens are improved by open spaces (Woolley, 2003). Spending more time in outdoor spaces can reduce the need for cooling energy via air conditioning within buildings and increase the liability of cities when their outdoor environments are designed optimally. For example, Tsitoura et al. (2017) found that the vegetation strategy in Greece reduces the energy consumed by buildings by almost 3.35 kWh. This is attributed to the addition of more greenery to an outdoor space, which in turn reduces the ambient temperature by providing shade and enhancing natural cooling. Thus, people move to public spaces that directly help to minimize the energy consumed in buildings.
Liu et al. (2023) examined the methods by which thermal comfort is measured in urban outdoor areas by emphasizing the impacts of surface materials, vegetation, and urban geometry. They emphasized that outdoor comfort is shaped by microclimates and offered methods for enhancement through urban planning. Ren et al. (2023) also examined the effects of urban heat islands and methods to mitigate them, such as material innovations, vegetation, water features, and urban planning. The physiological equivalent temperature (PET) and universal thermal climate index (UTCI) are important and commonly used thermal indices for assessing outdoor thermal comfort. Since both indices combine various environmental factors, including air temperature, humidity, wind speed, and solar radiation, into single values representing human thermal perception, they are frequently used in current biometeorological research (Matzarakis et al., 2007; Jendritzky et al., 2012). PET is especially well-suited to assess thermal comfort in outdoor settings since it considers the dynamic reactions of the human body as well as the physiological effects of ambient variables (Matzarakis et al., 2007). The UTCI has become well-known for its all-encompassing methodology, which considers both reactions to heat and cold stresses, allowing its use in a wider variety of climates (Jendritzky et al., 2012). In contrast, other indices like the wet bulb globe temperature (WBGT) are intended for occupational heat stress assessments and focus on extreme conditions rather than general outdoor comfort, while indices like the standard effective temperature (SET) are better suited to indoor conditions (Sánchez Jiménez and Ruiz de Adana, 2024).
Manavvi and Rajasekar (2020) collected 353 samples to examine the outdoor thermal comfort in a square with a composite climate in India and found that the comfortable PET was 24.7°C. Similarly, Kumar and Sharma (2022) conducted a field study in Haryana, India, where the outdoor temperature was 30.3°C, and found that the comfortable PET was 30.8°C. Chen et al. (2018) investigated the adaptability and outdoor thermal comfort in the extremely cold regions of China, and thermal adaptation was present during the study. The significance of vegetation and shaded semi-open areas in improving thermal comfort was highlighted by Karimi and Mohammad (2022), who found that the PET values were 28.4–30.9°C in Sevilla and 24.5–29.8°C in Madrid. The impacts of plant communities in Tabriz were highlighted by Mohammadzadeh et al. (2023), who showed the relationship between outdoor thermal comfort and acoustic comfort in urban parks using PET. Bröde et al. (2018) examined the effects of climate change using UTCI and different heat stress assessments in the outdoor context. Kong et al. (2019) studied the effects of climate change on outdoor thermal comfort in various regions of China during summer using UTCI as the major indicators for tourist activities. These studies indicate that PET and UTCI are widely used in different countries and climates to evaluate outdoor thermal comfort. However, there is lack of information about the outdoor thermal comfort in Nepal.
The temperature increase in Nepal is similar to those of developing and developed countries. Nepal showed a 1–2°C increase in the mean annual maximum temperature between 1977 and 1994 (Shrestha et al., 1999). It has been found that the average temperature in Kathmandu valley has increased by 1.6°C over the last 20 years (Rising Nepal, 2022). Because of this, people may find the outdoor environment to be less comfortable. Adaptive thermal comfort is important in Nepal because of the lack of country’s standards. The person–environment systems approach is the foundation of the adaptive model (de Dear, 2004). This approach has been supported by field research conducted in everyday environments with all of the psychobehavioral, environmental, and clothing adjustments of individuals (Nicol, 2003). The adaptive model is described as a linear regression model that relates the outdoor meteorological or climatological parameters to design temperatures or acceptable temperature ranges (de Dear and Brager, 1998). Rijal et al. (2010) studied the thermal comfort in semi-outdoor spaces of traditional Nepalese dwellings. Nikolopoulou et al. (2001) studied the outdoor thermal comfort in an urban park in Cambridge, United Kingdom, and developed an adaptive thermal model between comfort temperature and outdoor air temperature. Similarly, Rijal (2012) proposed an adaptive thermal comfort model based on literature review. However, adaptive models based on comfortable PET or UTCI are not available in literature to evaluate and design urban parks. Thus, available research from other countries or climates may not be applicable to Nepal because of variations in geography and landscape morphology. To address these research gaps, the present study combines an extensive literature review with a field study conducted in Nepal to evaluate the outdoor thermal sensation and comfort temperature as well as develop an adaptive thermal comfort model based on PET and UTCI.
2 Materials and methods
2.1 Investigated area
Nepal is a small, hilly, and landlocked nation with an area of 147,181 km2; it is located between 26°22′N to 30°27′N and 80°04′E to 88°12′E. As seen in Figure 1 (Yatranepalko, 2011; Mesta et al., 2023), the research area spans 0.022 km2 and is situated in Kathmandu Valley. Kathmandu is situated in the lesser Himalayan range of central Nepal and has a surface area of 340 km2. It is surrounded by mountains and has an elevation of approximately 1,400 m above sea level. The Koppen climate classification of Kathmandu is mild and moderate (Cwb) (Climate-Data, 2024). The rate of urbanization in the valley is increasing daily; urban built-up areas in this region developed slowly in the 1960s and 1970s but has increased rapidly since the 1980s. People have migrated from the rural to urban areas, so the population density of Kathmandu Valley has increased. Such rapid urbanization of the valley has threatened the ecosystem, increased deforestation, exacerbated air pollution, and caused discomfort to the urban residents owing to the unavailability of open spaces. The need for parks in Kathmandu seems to be more evident in the face of such urban developments. Figure 2 (Weather underground, 2023) shows the monthly mean air temperature and relative humidity of Kathmandu for the entire year. In this region, the lowest mean air temperature of 11.2°C was recorded in January and highest temperature of 24.7°C was noted in June, with April having the lowest (53%) and August showing the highest (86%) relative humidities.
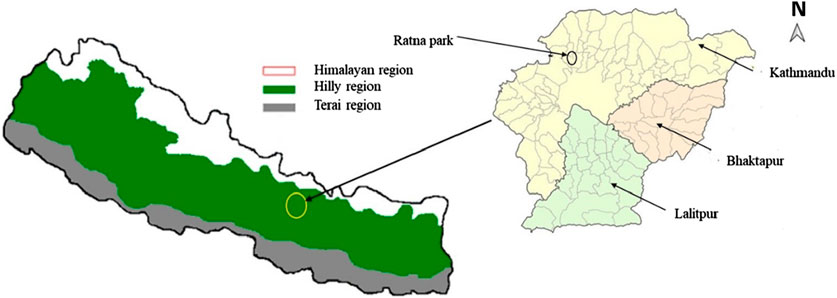
Figure 1. Location of the study area.
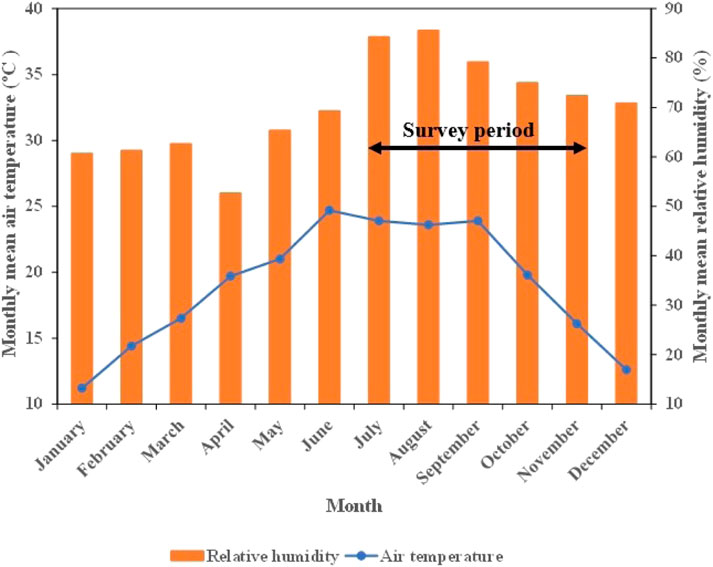
Figure 2. Monthly mean air temperature and relative humidity of Kathmandu over the survey period.
2.2 Thermal measurements
Ratna park was selected as the ideal location for the field study for its outdoor activities (Figure 3) (Google, 2024). This park is centrally located in Katmandu Valley and attracts a diverse range of visitors with its varied microclimatic conditions, different species of trees and vegetation, as well as social and cultural events. The thermal measurements for the present study were conducted over 9 days (Table 1) from 11:00 to 15:00 between 8 July and 4 November 2023. During the daytime, the numbers of visitors using this park for outdoor activities were maximum; hence, the study hours were selected so as to collect responses from the majority of park visitors during the peak attendance hours. The air temperature, globe temperature, relative humidity, and wind speed were also measured (Table 2). For thermal comfort surveys, globe thermometers with diameters of 0.075 m and 0.040 m are commonly used rather than 0.150 m (Nicol et al., 1994; Humphreys and Nicol, 2007; Rijal et al., 2019). The time constant for a globe thermometer with a diameter of 0.150 m is approximately 20 min (Spagnolo and de Dear, 2003; Rijal et al., 2003). However, it is shorter for a globe thermometer with a diameter of 0.075 m, which may be sufficient for stabilization. The instrument was setup at a height of 1.1 m above ground level so as to avoid direct solar radiation. The data were recorded after 15 min of setting the instrument to ensure stability of the values. The monitoring equipment were moved close to the visitors responding to the survey. The measurements were conducted in shaded areas under different weather conditions on sunny and cloudy days.
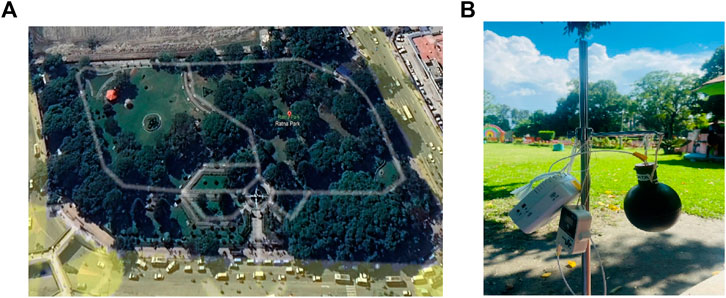
Figure 3. Field survey conducted in Ratna park. (A) Map of Ratna park and (B) Instruments.

Table 1. Details of the study for the survey period.
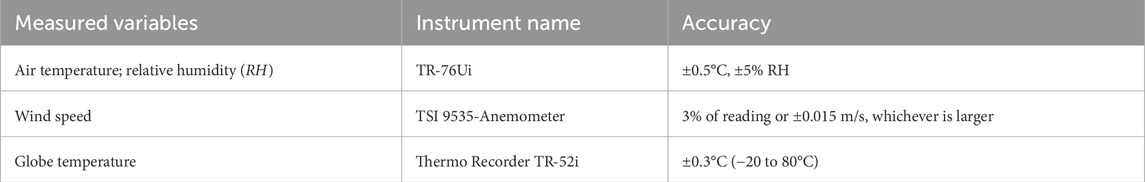
Table 2. Details of the instruments used during the study.
2.3 Thermal comfort surveys
The choice of Ratna park as the study area ensured a wide range of participants in the survey, leading to more representative results for the city, as there is plenty of space for public events. This park is the best location for research on outdoor thermal comfort. Survey participants were chosen randomly among the park visitors who had been at the location for more than 15 min to ensure that they had adjusted to the thermal environment before responding to the questionnaire. The survey was conducted in shaded areas of the park as these locations are utilized the most by visitors. The questionnaire consisted of background on the respondents, like their name, age, gender, and thermal perceptions of visitors. The thermal sensations of the park visitors (local community as well as domestic and international tourists) were recorded on a modified 7-point thermal sensation scale varying from very cold to very hot, as shown in Table 3. The ASHRAE scale is frequently used to evaluate the thermal sensation vote (TSV) but since the words warm and cool imply comfort in Nepalese (Rijal et al., 2010), the modified thermal sensation vote was used to evaluate the thermal sensations, similar to that in Rijal et al. (2010). A total of 147 votes were gathered from 65 male and 82 female respondents with average ages ± standard deviations of 35 ± 20.5 and 27 ± 12.4 years, respectively. Each of the clothing items worn by the park visitors was also recorded, and the clothing insulation values provided by ASHRAE (2004) were used to sum up the clo values. Thus, the average clothing insulation values for the female and male respondents were 0.41 clo and 0.42 clo, respectively.

Table 3. Modified thermal sensation scale.
2.4 Thermal indices
2.4.1 PET
In this study, the outdoor thermal comfort of the park was evaluated using PET, which was first introduced by Höppe and Mayer (1987). PET is the air temperature at which the heat budget of the human body is balanced with the same core and skin temperatures as that under the outdoor conditions being assessed (Höppe and Mayer, 1987). According to the German Engineering Society Guidelines (VDI, 1998), PET can be estimated using Rayman software, which was developed at the Meteorological Institute of the University of Freiburg, Germany. The PET was deemed suitable for evaluating the outdoor thermal comfort because it was created using the effects of shortwave and longwave radiation fluxes. It shows an accurate impact of the climate on humans and is measured in terms of degrees Celsius along with the ability for application under both hot and cold environments (Deb and Alur, 2010). Deevi and Chundeli (2020) estimated the PET in an outdoor street canyon in the warm and humid climate of India using Rayman pro. Shawesh and Mohamed (2021) used Rayman software to predict the PET in an outdoor space at Effat Campus, Saudi Arabia. Different studies have used Rayman software to calculate PET, and the present study also uses this method to predict PET using field data. The air temperature, relative humidity, wind speed, mean radiant temperature, and clothing insulation data were input into Rayman software to calculate the PET values (Matzarakis et al., 2007). The PET value corresponds to the stress level on a 9-point scale, as shown in Table 4 (Nikolopoulou et al., 2001); this scale is used to classify the PET values in this study.
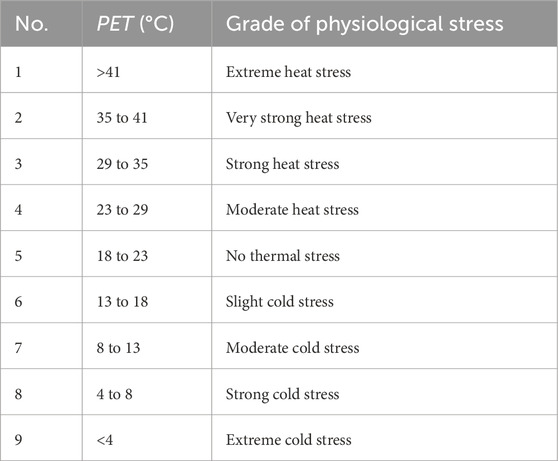
Table 4. Stress classification based on the physiological equivalent temperature (PET).
2.4.2 UTCI
The International Society of Biometeorology developed the UTCI using the concept of equivalent temperature and human thermal response model, namely Fiala multimodal and thermal comfort models (Jendritzky et al., 2012). The UTCI was first introduced in 1994 and is recognized as the reference environmental temperature that causes strain. It considers variables such as wind speed, solar radiation, relative humidity, and dry bulb temperature (Baaghideh et al., 2016). This index is one of the most widely used metrics to assess the thermal state of a person in the outdoor environment and is independent of personal characteristics (age, gender, clothing, and activity). Provencal et al. (2016) conducted a sensitivity analysis based on the UTCI in Quebec City, Canada; they obtained the UTCI values using the official website (www.utci.org). Lucena et al. (2016) studied human thermal comfort through the UTCI in the semi-arid regions of Brazil using same method. Since then, many authors have used this method to predict the UTCI; thus, we also use this method for the UTCI calculations. The air temperature, relative humidity, wind speed, and mean radiant temperature were used as the input variables to calculate the UTCI. The UTCI model operates under the assumption of a fixed metabolic rate of 2.2 MET, which corresponds to physical activities such as light walking. In this study, the investigation samples consisted of the park visitors engaged in typical activities such as light walking. The observations during the field measurements indicate that this assumption reasonably reflects the average activity level of the sample population.
The mean radiant temperature for both PET and UTCI was calculated according to ISO (1998) as shown in the Equation 1:
where Tmrt is the mean radiant temperature (°C), Tg is the globe temperature (°C), V is the wind velocity (m/s), Ta is the air temperature (°C), ϵ is the emissivity of the globe (0.95), and D is the diameter of the globe (0.075 m).
The UTCI value corresponds to stress level on the 10-point scale, as shown in Table 5 (Bröde et al., 2011); this scale is used to classify the UTCI values in this study.
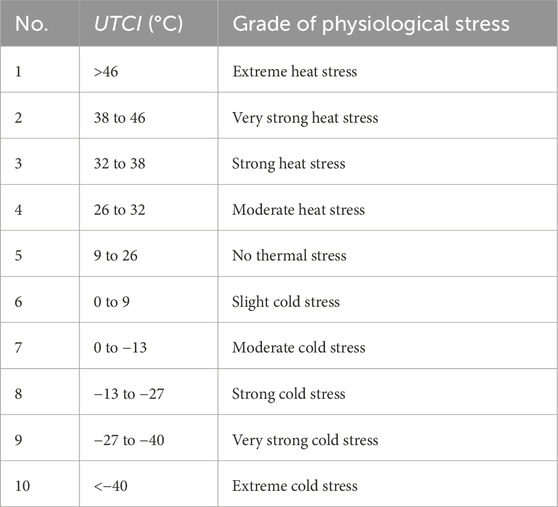
Table 5. Stress classification based on the universal thermal climate index (UTCI).
2.5 Literature review
Various keywords (comfortable PET, comfortable UTCI, adaptive thermal comfort) were used to conduct a systematic review to compare and validate our findings as well as propose the adaptive model combining the present study with other studies. A total of 147 published papers were obtained from a literature search of the Scopus database. Upon screening the title and abstract, 114 published papers were excluded based on several criteria. The inclusion criteria for a paper are as follows: should predict the comfortable temperature of the outdoors and provide information on the adaptive thermal comfort. The search was specifically limited to journal papers and conference proceedings to ensure inclusion of high-quality and relevant literature.
3 Evaluation of comfortable PET and UTCI based on field survey
3.1 Climatic conditions during voting
The air temperature, globe temperature, relative humidity, and wind velocity during voting were measured at least 15 min after instrument setup, as shown in Table 6. The observed air temperature ranged from 22.3 to 31.8°C, with mean values of 28.4°C during summer and 23.5°C during autumn. The mean globe temperatures were 29.4°C and 25.2°C during summer and autumn, respectively, and range over 23.1–32.7°C. The relative humidity ranged from 39% to 72% on average. These numbers imply fluctuations in the moisture content, which may be impacted by the vegetation and weather patterns of the park. The average wind speeds were 0.62 m/s and 0.52 m/s in summer and autumn, respectively, with a maximum value of up to 1 m/s.
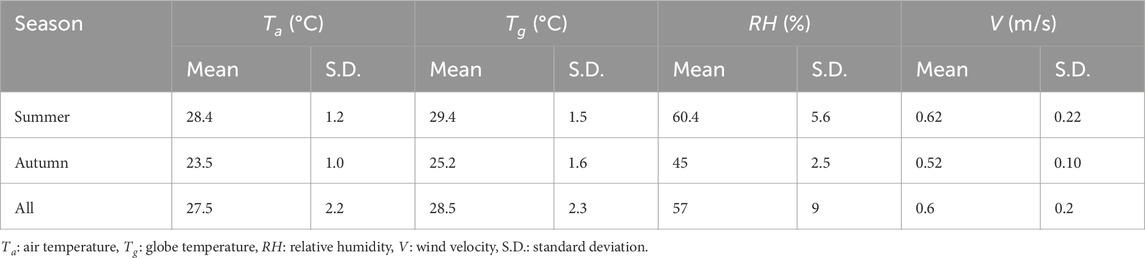
Table 6. Physical parameters during voting.
3.2 TSV
The subjective perceptions of visitors were gathered using the TSV, and its distributions for summer and autumn are shown in Figure 4. Approximately 78% of the respondents voted for “4. Neutral” during summer; similarly, 16% voted that the thermal environment was “5. Slightly hot,” 5% of the respondents considered the thermal environment to be “3. Slightly cold,” and 1% of the subjects considered the thermal environment as “6. Hot.” For autumn, 81% of the respondents voted for “4. Neutral,” while 15% voted for “3. Slightly cold” and 4% considered the thermal environment to be “2. Cold.” These results were obtained from the respondent votes during the field survey. The results of TSVs in the park during the investigation period demonstrate that most of the park visitors feel comfortable during their stay period.
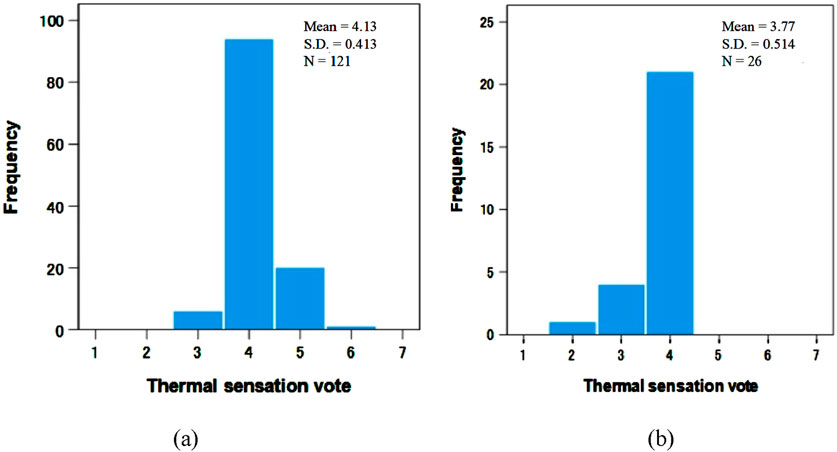
Figure 4. Distribution of the thermal sensation votes for (A) summer and (B) autumn.
3.3 Analysis of outdoor thermal comfort
3.3.1 Comfortable PET
The PET data were divided based on stress levels, as shown in Table 7, according to the classifications in Table 4. On July 22nd, a strong heatwave occurred in the park, reaching a maximum PET of 37.2°C. Similarly, the lowest PET of 22.9°C was recorded on November 4th, indicating low thermal stress. The PET data showed that 2% of respondents experienced “2. Very strong heat stress,” 56% experienced “3. Strong heat stress,” 41% experienced “4. Moderate heat stress,” and 1% reported “5. No heat stress.”
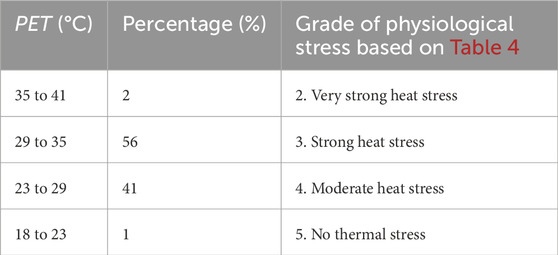
Table 7. Percentage of PET data belonging to different physiological stress levels.
The linear regression analyses of the TSVs and PETs for the raw and binned data were conducted, whose results are shown in Figure 5. The raw data were directly derived from participant responses and field observations. To facilitate analysis and identify trends, the data were binned by grouping into intervals of 1°C of PET. There was a positive correlation between PET and thermal sensation. Weighted linear regression was used to binned data similar to prior research (Rijal, 2012; Khadka et al., 2024; Aqilah et al., 2023). The regression line indicated that the TSVs of the park were related to the PET, and the following regression Equations 2, 3 were obtained:

Figure 5. Relationship between thermal sensation vote and PET based on (A) raw and (B) binned data.
where N is the sample size, R2 is the coefficient of determination, S.E. is the standard error of the regression coefficient, and p is the significance value of the regression coefficient. The equations for the raw and binned data were similar. However, the coefficient of determination of the binned data was much higher than that of the raw data. The slopes of both the raw and binned data are 0.05; thus, a 20°C PET is required to shift one TSV (=1/0.05). When the TSV = 4 in Equation 2, the comfortable PET is 30.0°C.
3.3.2 Comfortable UTCI
Taking into consideration a variety of climatic factors and their effects on human health, the UTCI is a comprehensive index for analyzing thermal comfort. The UTCI values are categorized into stress levels in Table 8 based on Table 5. Strong heat stress occurred in the park on July 22nd, which produced the highest UTCI of 34°C, and the lowest UTCI obtained was 23.5°C on November 4th. Similarly, upon calculating the individual UTCI values, we found that 14%, 80%, and 6% of the obtained UTCI values belonged to the “3. Strong heat stress,” “4. Moderate heat stress,” and “5. No thermal stress” categories, respectively (Table 8). These results indicate that a high percentage of visitors experience moderate heat stress in the investigated park and that they might be reducing this heat stress through various behavioral adaptations. Figure 6 illustrates the results of the linear regression analyses of the TSVs and UTCIs for both raw and binned data. There is a positive correlation between UTCI and the TSVs; the data were binned in intervals of 1°C of UTCI by applying weighted linear regression. The following regression Equations 4, 5 were obtained:
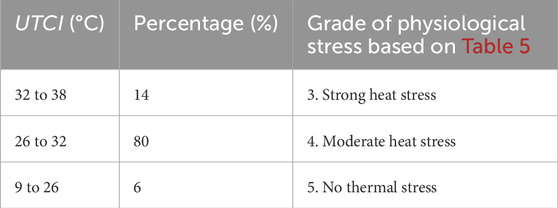
Table 8. Percentage of UTCI data belonging to different physiological stress levels.
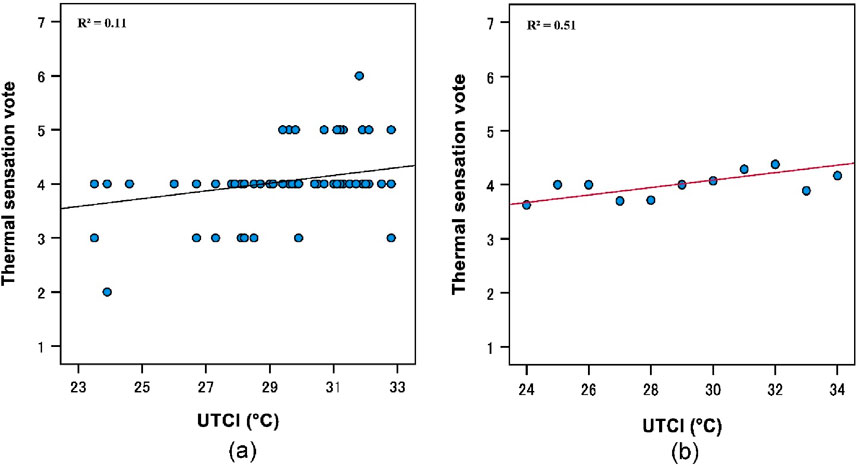
Figure 6. Relationship between thermal sensation vote and UTCI based on (A) raw and (B) binned data.
The raw and binned data equations are noted to be almost similar. The coefficient of determination of the binned data was greater than that of the raw data. The slopes of the raw and binned data are 0.07; thus, a UTCI of 14.3°C is required to shift one TSV (= 1/0.07). By substituting “4. Neutral” in Equation 4, we obtained a comfortable UTCI of 28.5°C.
4 Development of adaptive model based on literature review
In the previous section, the comfortable PET and UTCI values in the park were clarified. To validate these as well as compare and develop the adaptive model, we conducted a literature review. Adaptive models for outdoor conditions were also proposed by Rijal (2012) and Nikolopoulou et al. (2001). Herein, we also include our field data to propose an adaptive model based on the comfortable PET and UTCI for outdoor spaces.
4.1 PET
4.1.1 Relationship between TSV and PET
Table 9 presents a comparison of the regression equations developed herein with those of previous studies. Figure 7 is a visual representation of Table 9. The R2 value obtained in this study is 0.10 (Figure 5A), whereas the values obtained in previous studies have been between 0.57 and 0.98 (Table 9). The regression coefficient in the present study (0.05) is comparatively lower than those of previous studies. Yang et al. (2013a) found regression coefficients of 0.234 and 0.168 for Singapore and China, respectively. Comparably, the regression coefficient obtained by Cheng et al. (2012) for Hong Kong and Elnabawi et al. (2016) for Egypt are 0.1372 and 0.0998, respectively, which are higher than that obtained in this study. Zhang et al. (2020) found a slope of 0.106 in their study, which is higher than that obtained herein. The higher slope value may be because of the high temperature in summer and differences in the demographics of the respondents. The previously reported studies are also based on different locations and environmental conditions, which could have resulted in higher values of the regression coefficients than in this study. However, the overall trend is similar to that shown in Figure 7.
The required temperature (Treq) for shifting one TSV in this study based on PET is 20.0°C (=1/0.05), which is significantly higher than the Treq values reported by Yang et al. (2013a) and Mahmoud (2011) (Table 9). Yang et al. (2013a) and Mahmoud (2011) reported Treq values less than 5°C; however, Treq values greater than 5°C may not be appropriate for predicting the thermal comfort zone based on the PET.
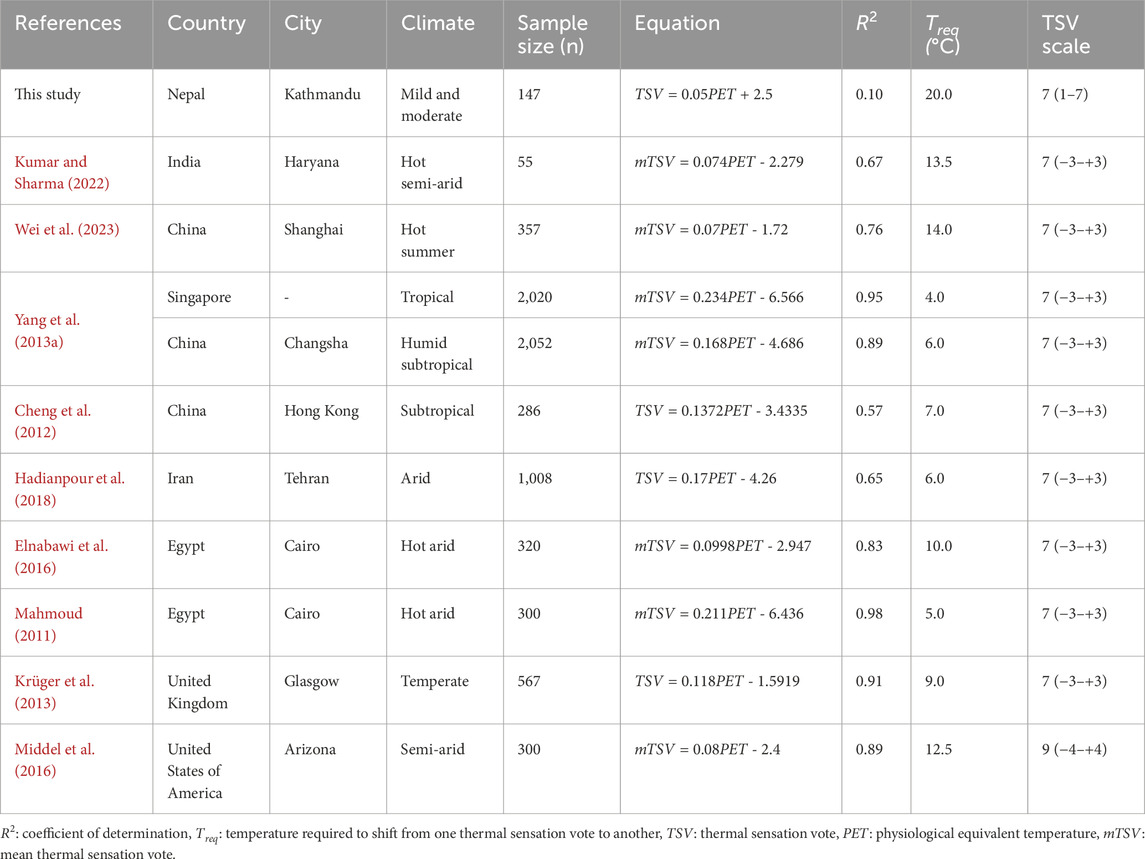
Table 9. Comparison of regression equations with previous studies.
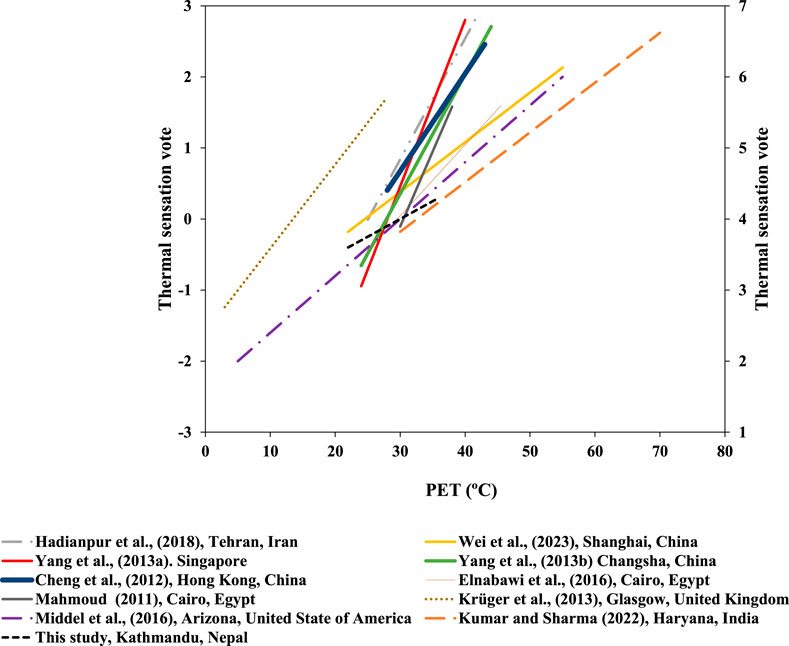
Figure 7. Relationship between thermal sensation vote and PET.
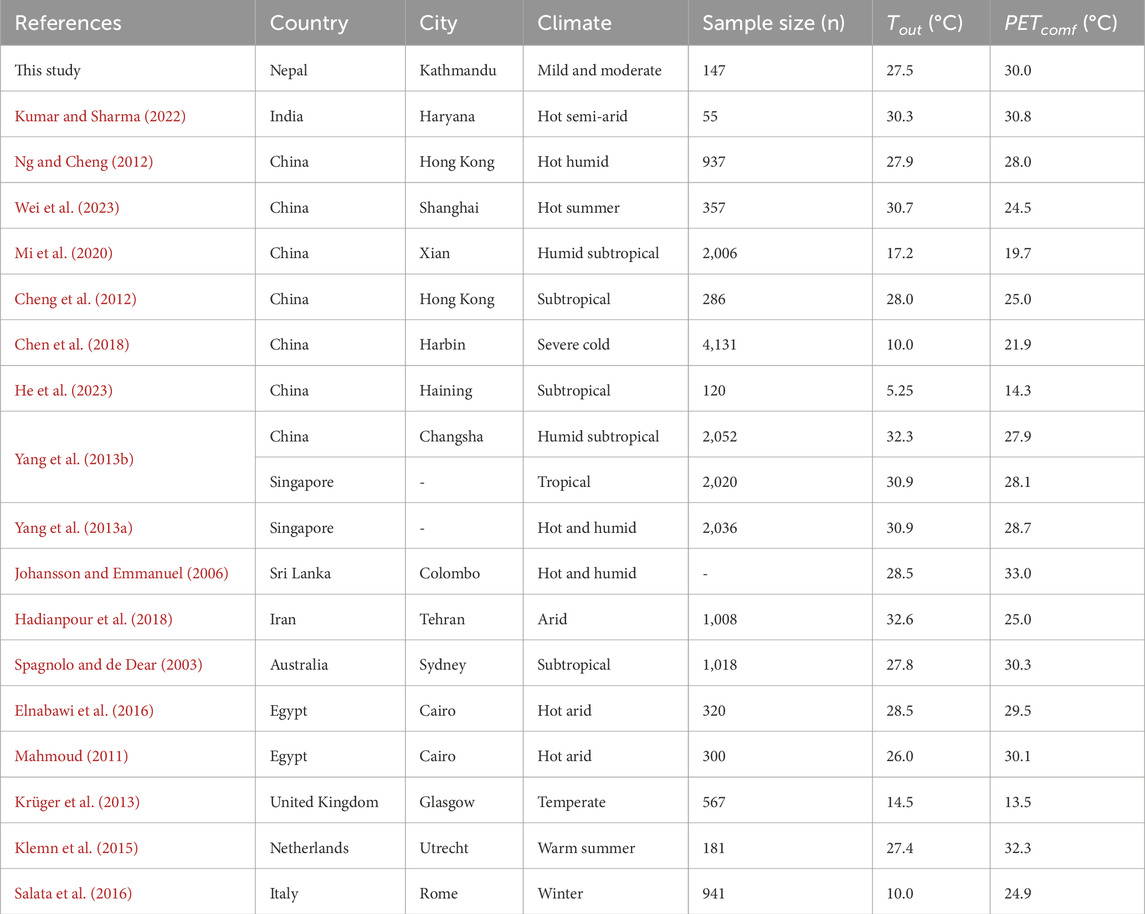
Table 10. Comparison of comfortable PET values with previous studies.
4.1.2 Development of the adaptive model based on PET
The comfortable PET in this study was compared with those of previous studies, as shown in Table 10. The comfortable PET of 30.0°C in this study is comparable to values found for other climates. For example, a comfortable PET of 30.8°C was found in India for its hot and semi-arid climate (Kumar and Sharma, 2022). Moreover, comfortable PET values of 28.1°C in Singapore and 27.9°C in China were obtained by Yang et al. (2013a); Givoni et al. (2003) found a comfortable PET of 29.7°C in Israel, which is similar to the value in this study. The average maximum temperature during the survey period was 37°C. Similarly, Lin and Matzarakis (2008) reported a comfortable PET of 27.2°C in Taiwan by collecting 1,644 samples, and this value is lower than that reported in our present study.
The relationship between the comfortable PET and outdoor air temperature is depicted in Figure 8, which is visually representative of the data in Table 10. The following Equation 6 was also obtained from the regression analysis:
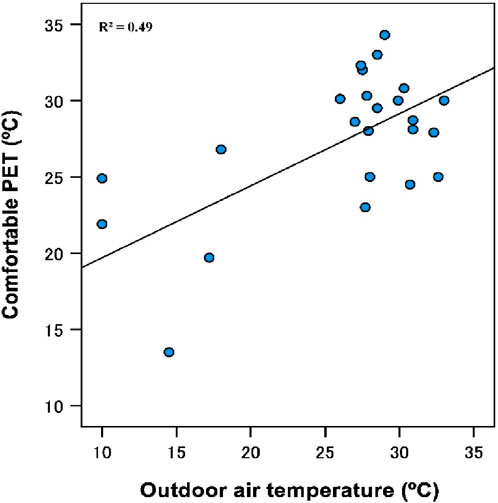
Figure 8. Relationship between comfortable PET and outdoor air temperature.
where PETcomf is the comfortable PET and Tout is the outdoor air temperature. The comfortable PET is related to the outdoor air temperature, and its regression coefficient is 0.47, which is lower than the value of 0.624 reported by Nikolopoulou et al. (2001). Thus, the proposed adaptive model can be used to predict the comfortable PET value from the outdoor air temperature for park design and management.
4.2 UTCI
4.2.1 Relationship between TSV and UTCI
Table 11 shows a comparison of our regression equations with those of previous studies, and these equations are shown in Figure 9. The general pattern across all research efforts indicates positive correlation between the TSV and UTCI, implying that thermal sensation increases with increasing UTCI value. The R2 value found in this study is 0.11 (Figure 6A), whereas previous studies have reported values between 0.65 and 0.98 (Table 11). The regression coefficient (0.07) found in the present work is lower than those of previous studies. For example, Xu et al. (2019) and Li et al. (2018) reported regression coefficients of 0.13 and 0.10, respectively.

Table 11. Comparison of regression equations with previous studies.
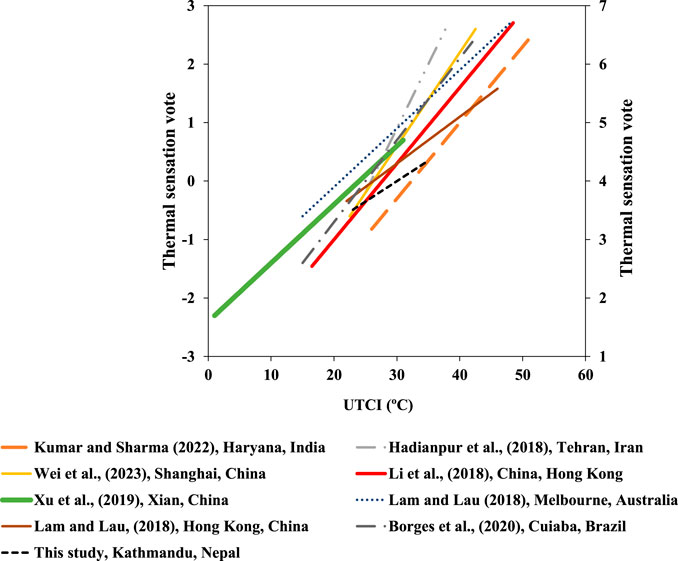
Figure 9. Relationship between thermal sensation vote and UTCI.
The Treq for shifting one TSV in this study based on the UTCI is 14.3°C (=1/0.07), which is significantly higher than the values reported by Wei et al. (2023) and Hadianpour et al. (2018) (Table 11). For example, Lam and Lau (2018) found a Treq value of 12.5°C for Australia, which is quite similar to that of our study. Lam and Lau (2018) also noted a slope of 0.10°C and a Treq of 10°C to shift from one thermal sensation to another for China, which is lower than our value found in this study. This lower value may be because the average air temperature is 24.2°C and people may have fully adapted to the thermal environment of the study area. The lower slope can be used to calculate the neutral/comfort temperature but is not suitable for calculating the comfort zone because we need to add or subtract 10°C from the thermal neutrality point, which is not suitable for the comfort zone. Hadianpour et al. (2018) reported a Treq of less than 5°C, while all other studies have reported values higher than 5°C (Table 11); however, Treq values greater than 5°C may not be appropriate for predicting the thermal comfort zone based on the UTCI. This was supported by Fanger (1970), who demonstrated that a shift of one TSV typically corresponds to a change of 3°C in the operative temperature in a climate chamber. By analyzing field data, Humphreys and Nicol (2007) and Rijal et al. (2017) found a shift of approximately 2°C for one TSV. Many studies have also assumed 2°C as the shift for calculating the comfort temperature based on the Griffiths method (Rijal et al., 2017; Humphreys et al., 2007, 2013).
4.2.2 Development of adaptive model based on UTCI
Table 12 presents a comparison of the comfortable UTCI in the present work with those from previous studies. The comfortable UTCI values of 31.8°C reported by Kumar and Sharma (2022) and 33.5°C noted by Lam and Lau (2018) are 3.8–5.5°C higher than that in this study. Sharifi and Boland (2018) found the comfortable UTCI of Australian public spaces to be 28.8°C, which is similar to the value of our study. This shows that improving the microclimate through greenery and ponds can make park visitors feel more comfortable. Hadianpour et al. (2018) found the comfortable UTCI of open spaces in an Iranian university to be 26.0°C during summer, which is lower than the value in this study. Such lower values of the UTCI may be related to abundant shading in the outdoor environment, whereas higher values may be due to higher outdoor air temperatures. All other studies in the comparison have lower values than our study (Table 12).
The comfortable UTCI of the present study is comparatively similar to results from tropical and subtropical areas like Barbados, China, and India (Table 12).
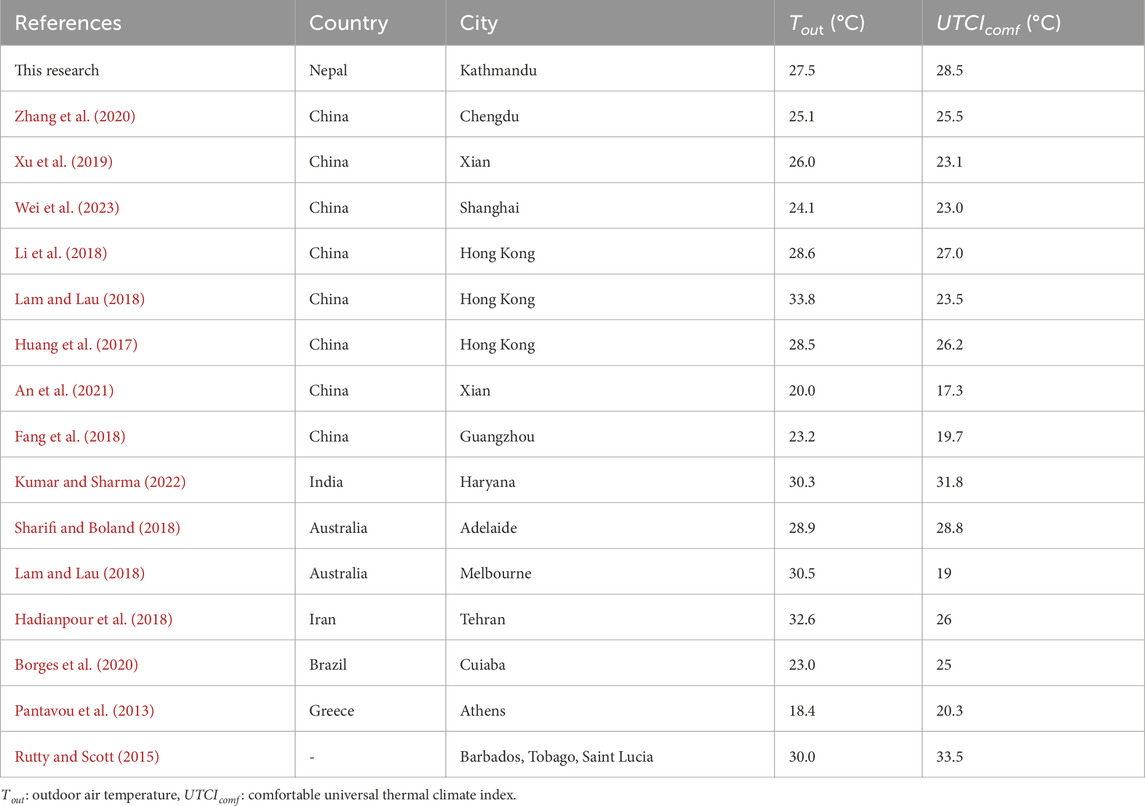
Table 12. Comparison of comfortable UTCI values with previous studies.
The relationship between comfortable UTCI and outdoor air temperature is shown in Figure 10, which visually represents the data of Table 12. The following Equation 7 is also obtained from regression analysis.
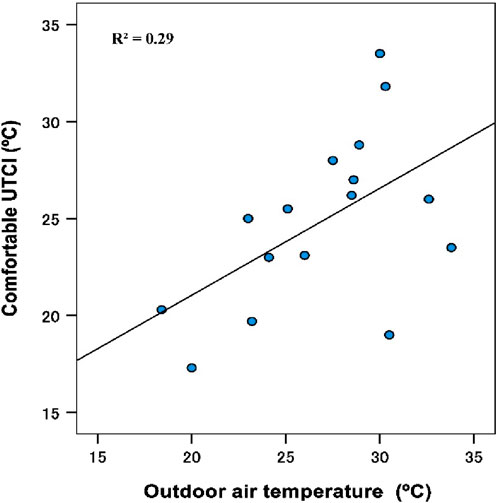
Figure 10. Relationship between comfortable UTCI and outdoor air temperature.
where UTCIcomf is the comfortable UTCI value and Tout is the outdoor air temperature. The regression coefficient of this study is 0.55, which is similar to those reported in literature (Nikolopoulou et al., 2001; Rijal, 2012; Nicol et al., 2006). The comfortable UTCI can be estimated from the outdoor temperature and can be used for urban park designs including the outdoor environment.
5 Discussion
The present study focuses on a survey of outdoor thermal comfort in an urban park in Kathmandu, Nepal. In the survey, 78% and 81% of the respondents voted for “Neutral” thermal sensation during summer and autumn, respectively. This implies that the visitors feel comfortable in the thermal environment of the park and emphasizes that the park has a thermally comfortable environment essential for the wellbeing and enjoyment of the visitors. These findings are similar to those of previous studies (Yang et al., 2013b; Ng and Cheng, 2012). Zhang et al. (2020) conducted a field survey in Chengdu Park in China during summer by collecting 220 sample responses and found that 60% of the respondents voted for “Neutral” thermal sensation, similar to the present study, when the air temperature was 25.1°C. Yang et al. (2013a) collected 2,036 sample responses for their study and found that 27% of the respondents voted for “Neutral” thermal sensation in an outdoor open space in Singapore, which is lower than that of our study. They also used the 7-point thermal sensation scale and determined that the mean air temperature was 30.9°C. The higher percentage of neutral responses in our study may be attributed to the temperate climatic conditions of the study area. The results of the TSVs in this study do not align with the thermal stress classifications of the PET and UTCI. This could be because the PET and UTCI classifications were developed in the European context. Hence, they may not be suitable in the Nepalese context. On the other hand, the TSVs may be affected by physiological, behavioral, and environmental factors, and the TSV cannot account for all the environmental factors.
From the relationship between TSV and comfortable PET or UTCI, the temperature required to shift one TSV was found to be 20.0°C for PET and 14.3°C for UTCI, which are comparable to the values obtained in previous studies (Tables 9, 11). There are several reasons why the temperature thresholds for switching between different thermal sensations vary for outdoor thermal comfort. Thermal sensation is significantly influenced by individual physiological characteristics, including age, gender, and metabolic rate. It is also influenced by varying climatic conditions across different places. For example, individuals in cold regions may find comfort in lower temperatures than those in hot regions. People’s perceptions of thermal sensation may also fluctuate depending on daily and seasonal acclimatization, so that the time of day and season of the survey may also affect the results.
A regression analysis was conducted between the TSV and PET/UTCI. Upon comparing the raw data through binning, we found that the binned data had a greater coefficient of determination than the raw data. Hence, most researchers appear to have used binned data in their studies. However, the slopes of the raw and binned data were similar. Thus, we analyzed our results based on raw data because it is suitable to show the actual conditions of the respondents in everyday life. The lower slope value could be because the occupants adapted more to the outdoor temperatures that they experienced in the park. The comfortable PET of 30.0°C and comfortable UTCI of 28.5°C found in this study are similar to those reported in previous studies (Cheng et al., 2019; Krüger et al., 2013). The PET and UTCI values are different for various studies owing to variations in the environmental conditions, participant acclimatization, and methodologies underlying each index. PET assumes a steady-state heat balance, whereas UTCI incorporates a dynamic heat balance model, which can lead to differences in the derived comfort thresholds (Fiala et al., 2012). Similarly, the UTCI is more sensitive to wind speeds (Provencal et al., 2016). However, the findings of this study can be helpful in designing urban environments in a manner similar to that reported by Liu et al. (2023) and Givoni (1989).
Based on the findings of this study, the adaptive thermal comfort model was proposed and compared in Figures 9, 11. The results indicate that there is a positive correlation between the comfortable PET or comfortable UTCI value and outdoor air temperature. The regression slope in this study is comparable with those of other studies, although the parameters of the previous works differ from those of this study (Table 13). In our adaptive model, we tried to show the overall trend that is similar to those reported by Humphreys (1978) and the ASHRAE standard (ASHRAE, 2004). These adaptive models can be used to predict the comfortable PET or comfortable UTCI from outdoor air temperature, which is important to urban planning, especially when designing thermally comfortable outdoor environments.

Figure 11. Relationship between comfort temperature and outdoor air temperature.

Table 13. Comparison of the adaptive model with those of previous studies.
Although the results from Ratna Park offer insightful information on outdoor thermal comfort, their applicability to other parks or areas in Nepal may differ because of variations in the microclimates, vegetation, urban density, and local acclimatization. To improve the adaptive thermal comfort model presented herein, more research is required on the various climates of Nepal. The presence of trees and green spaces can provide cooling effects through shade and evapotranspiration, which may not be fully captured in the PET and UTCI calculations, as the present study was conducted in a shaded area. However, future research may examine the effects of other microclimatic conditions, including open spaces, to gain a better understanding of how exposure differences could affect thermal comfort. We also intend to increase the sample size and conduct analysis for humidity or wind speed to improve the predictive accuracy through surveys conducted over the entire year. Future studies could also include a sensitivity analysis and statistical tests to find similarities and differences among the different variables. Additionally, the present study did not account for variables that could have substantial impacts on participant sensations in the thermal comfort survey, such as acclimatization, age, gender, and activity levels. To propose a robust adaptive model for the outdoor environment, we need to conduct more research in different parts of the world. Thus, further studies should consider the above factors in the future during further investigations.
6 Conclusion
Based on a field survey and literature review, the thermal comfort of an urban park was analyzed and discussed. The following conclusions were obtained from this study.
1. From a field survey in a public outdoor park in Kathmandu, we found that 78% and 81% of the visitors voted experiencing “Neutral” thermal sensations during summer and autumn, respectively, indicating that a large proportion of the visitors felt comfortable in the park’s environment.
2. A positive correlation was obtained between the TSV and PET or UTCI, suggesting that higher PET or UTCI values are associated with higher TSVs, which in turn reflect higher levels of subjective thermal discomfort. The regression equations obtained herein are comparable with those of previous studies. A comfortable PET of 30.0°C and comfortable UTCI of 28.5°C were found in this study. Urban planners can use these values to guide future designs of the outdoor environment.
3. Adaptive models for thermal comfort were proposed from the field survey and literature review. These models can be used to predict the comfortable PET or comfortable UTCI from given outdoor air temperature values to design thermally comfortable urban parks.
Data availability statement
The raw data supporting the conclusions of this article will be made available by the authors on request.
Ethics statement
Ethical approval was not required for the studies involving humans because the Ethical Review Board guidelines of our institution state that approval is not necessary based on the nature of the survey/study described in this manuscript. The studies were conducted in accordance with all local legislation and institutional requirements. Written informed consent for participation was not required from the participants or their legal guardians/next of kin in accordance with the national legislation and institutional requirements because we have conducted that the field study was in full compliance with the institutional guidelines.
Author contributions
RS: conceptualization, data curation, formal analysis, investigation, methodology, software, visualization, and writing–original draft. HR: conceptualization, funding acquisition, methodology, project administration, resources, supervision, validation, and writing–review and editing. SK: methodology, resources, and writing–review and editing. NA: methodology, resources, and writing–review and editing. PL: data curation, investigation, methodology, resources, and writing–review and editing.
Funding
The authors declare that financial support was received for the research, authorship, and/or publication of this article. We would like to thank to Tokyo City University for providing funding for the data collection and the Article Processing Charge.
Acknowledgments
We would like to express our deep gratitude to the park visitors who cooperated with us during the field survey.
Conflict of interest
The authors declare that the research was conducted in the absence of any commercial or financial relationships that could be construed as a potential conflict of interest.
The author(s) declared that they were an editorial board member of Frontiers at the time of submission. This had no impact on the peer review process and final decision.
Generative AI statement
The authors declare that no Generative AI was used in the creation of this manuscript.
Publisher’s note
All claims expressed in this article are solely those of the authors and do not necessarily represent those of their affiliated organizations, or those of the publisher, the editors and the reviewers. Any product that may be evaluated in this article, or claim that may be made by its manufacturer, is not guaranteed or endorsed by the publisher.
References
An, L., Hong, B., Cui, X., Geng, Y., and Ma, X. (2021). Outdoor thermal comfort during winter in China's cold regions: a comparative study. Sci. Total Environ. 768, 144464. doi:10.1016/j.scitotenv.2020.144464
Aqilah, N., Rijal, H. B., and Yoshida, K. (2023). Gender difference regarding thermal comfort in Japanese residential building during free running mode. Build. Environ. 245, 110891. doi:10.1016/j.buildenv.2023.110891
ASHRAE (2004). ASHRAE standard 55 thermal environmental conditions for human occupancy. Atlanta, GA: ANSI/ASHRAE Standard. Available at: https://escholarship.org/uc/item/2m34683k (Accessed on October 4, 2024).
Baaghideh, M., Mayvaneh, F., Badi, A. S., and Shojaee, T. (2016). Evaluation of human thermal comfort using UTCI index: case study Khorasan Razavi, Iran. Nat. Environ. Change 2, 165–175.
Borges, V. C. A., Callejas, I. J. A., and Durante, L. C. (2020). Thermal sensation in outdoor urban spaces: a study in a tropical Savannah climate, Brazil. Int. J. Biometeorol. 64, 533–545. doi:10.1007/s00484-019-01830-x
Bröde, P., Fiala, D., Blazejczyk, K., Holmér, I., Jendritzky, G., Kampmann, B., et al. (2011). Deriving the operational procedure for the universal thermal climate index (UTCI). Int. J. Biometeorol. 56, 481–494. doi:10.1007/s00484-011-0454-1
Bröde, P., Fiala, D., Lemke, B., and Kjellstrom, T. (2018). Estimated work ability in warm outdoor environments depends on the chosen heat stress assessment metric. Int. J. Biometeorol. 62 (3), 331–345. doi:10.1007/s00484-017-1346-9
Chen, X., Xue, P., Liu, L., Gaoa, L., and Liua, J. (2018). Outdoor thermal comfort and adaptation in severe cold area: a longitudinal survey in Harbin, China. Build. Environ. 143, 548–560. doi:10.1016/j.buildenv.2018.07.041
Cheng, B., Gou, Z., Zhang, F., Feng, Q., and Huang, Z. (2019). Thermal comfort in urban mountain parks in the hot summer and cold winter climate. Sustain. Cities Soc. 51, 101756. doi:10.1016/j.scs.2019.101756
Cheng, V., Ng, E., Chan, C., and Givoni, B. (2012). Outdoor thermal comfort study in a sub-tropical climate: a longitudinal study based in Hong Kong. Int. J. Biometeorol. 56, 43–56. doi:10.1007/s00484-010-0396-z
Climate-Data (2024). Data and graphs for weather and climate in Kathmandu. Available at: https://en.climate-data.org/asia/nepal/central-development-region/kathmandu-1137/(accessed on December 1, 2024).
Deb, C., and Alur, R. (2010). The significance of Physiological Equivalent Temperature (PET) in outdoor thermal comfort studies. Int. J. Eng. Sci. Tech. 2 (7), 2825–2828. ISSN: 0975-5462.
de Dear, R. J. (2004). Thermal comfort in practice. Indoor Air 14 (7), 32–39. doi:10.1111/j.1600-0668.2004.00270.x
de Dear, R. J., and Brager, G. S. (1998). Developing an adaptive model of thermal comfort and preference. ASHRAE Trans. 104 (Part 1), 1–19.
Deevi, B., and Chundeli, F. A. (2020). Quantitative outdoor thermal comfort assessment of street: a case in a warm and humid climate of India. Urban Clim. 34, 100718. doi:10.1016/j.uclim.2020.100718
Elnabawi, M. H., Hamza, N., and Dudek, S. (2016). Thermal perception of outdoor urban spaces in the hot arid region of Cairo, Egypt. Sustain. Cities Soc. 22, 136–145. doi:10.1016/j.scs.2016.02.005
Fang, Z., Lin, Z., Mak, C. M., Niu, J., and Tse, K. T. (2018). Investigation into sensitivities of factors in outdoor thermal comfort indices. Build. Environ. 128, 129–142. doi:10.1016/j.buildenv.2017.11.028
Fanger, P. O. (1970). Thermal comfort: analysis and applications in environmental engineering. Copenhagen, Denmark: Danish technical press.
Fiala, D., Havenith, G., Brode, P., Kampmann, B., and Jendritzky, G. (2012). UTCI-Fiala multinode model of human heat transfer and temperature regulation. Int. J. Biometeorol. 56, 429–441. doi:10.1007/s00484-011-0424-7
Givoni, B. (1989). Urban design for different climates. Report WMO-TD, No 346. Switzerland: World Meteorological Organization.
Givoni, B., Noguchi, M., Saaroni, H., Pochter, O., Yaacov, Y., Feller, N., et al. (2003). Outdoor comfort research issues. Energy Build. 35, 77–86. doi:10.1016/S0378-7788(02)00082-8
Google (2024). Google earth pro. Available at: https://sites.google.com/earthoutreach.org/imw-australia/agenda/google-earth-pro (accessed on December 3, 2024).
Hadianpour, M., Mahdavinejad, M., Bemanian, M., and Nasrollahi, F. (2018). Seasonal differences of subjective thermal sensation and neutral temperature in an outdoor shaded space in Tehran, Iran. Sustain. Cities Soc. 39, 751–764. doi:10.1016/j.scs.2018.03.003
He, X., Gao, W., Wang, R., and Yan, D. (2023). Study on outdoor thermal comfort of factory areas during winter in hot summer and cold winter zone of China. Build Environ 228, 109883. doi:10.1016/j.buildenv.2022.109883
Höppe, P. R., and Mayer, H. (1987). Thermal comfort of man in different urban environments. Theor. Appl. Climatol. 38, 43–49. doi:10.1007/bf00866252
Huang, T., Li, J., Xie, Y., Niu, J., and Mak, C. M. (2017). Simultaneous environmental parameter monitoring and human subject survey regarding outdoor thermal comfort and its modelling. Build. Environ. 125, 502–514. doi:10.1016/j.buildenv.2017.09.015
Humphreys, M. (1978). Outdoor temperatures and comfort indoors. Batiment Int. Build. Res. Pract. 6 (2), 92. doi:10.1080/09613217808550656
Humphreys, M. A., and Nicol, J. F. (2007). Self-assessed productivity and the office environment: monthly surveys in five European countries. ASHRAE Transac 113 (1), 606–616.
Humphreys, M. A., Nicol, J. F., and Raja, I. A. (2007). Field studies of indoor thermal comfort and the progress of the adaptive approach. Adv. Build. Energy Res. 1, 55–88. doi:10.1080/17512549.2007.9687269
Humphreys, M. A., Rijal, H. B., and Nicol, J. F. (2013). Updating the adaptive relation between climate and comfort indoors; new insights and an extended database relation between climate and comfort indoors; new insights and an extended database. Build Environ. 63 (May), 40–55. doi:10.1016/j.buildenv.2013.01.024
IPCC (2021). Climate change 2021 the physical science basis. Available at: https://www.ipcc.ch/report/ar6/wg1/downloads/report/IPCC_AR6_WGI_SummaryVolume.pdf (accessed on October 6, 2024).
ISO (1998). ISO 7726:1998 ergonomics of the thermal environment instruments of measuring physical quantities. Switzerland: ISO.
Jendritzky, G., de Dear, R., and Havenith, G. (2012). UTCI-why another thermal index? Int. J. Biometeorol. 56, 421–428. doi:10.1007/s00484-011-0513-7
Johansson, E., and Emmanuel, R. (2006). The influence of urban design on outdoor thermal comfort in the hot, humid city of Colombo, Sri Lanka. Int. J. Biometeorol. 51, 119–133. doi:10.1007/s00484-006-0047-6
Karimi, A., and Mohammad, P. (2022). Effect of outdoor thermal comfort condition on visit of tourists in historical urban plazas of Sevilla and Madrid. Environ. Sci. Pollut. Res. 29, 60641–60661. doi:10.1007/s11356-022-20058-8
Khadka, S., Rijal, H. B., Amano, K., Saito, T., Imagawa, H., Uno, T., et al. (2024). Development of adaptive behavior models for thermal comfort: longitudinal investigation in Japanese office buildings and literature review. J. Build. Eng. 109220. doi:10.1016/j.jobe.2024.109220
Klemn, W., Heusinkveld, B. G., Lenzholzer, S., Jacobs, M. H., and Hove, B. V. (2015). Psychological and physical impact of urban green spaces on outdoor thermal comfort during summertime in The Netherlands. Build. Environ. 83, 120–128. doi:10.1016/j.buildenv.2014.05.013
Kong, Q., Zheng, J., Fowler, H. J., Ge, Q., and Xi, J. (2019). Climate change and summer thermal comfort in China. Theor. Appl. Climatol. 137 (1–2), 1077–1088. doi:10.1007/s00704-018-2648-5
Krüger, E., Drach, P., Emmanuel, R., and Corbella, O. (2013). Urban heat island and differences in outdoor comfort levels in Glasgow, UK. Theor. Appl. Climatol. 112, 127–141. doi:10.1007/s00704-012-0724-9
Kumar, P., and Sharma, A. (2022). Assessing outdoor thermal comfort conditions at an urban park during summer in the hot semi-arid region of India. Mater. Today Proc. 61, 356–369. doi:10.1016/j.matpr.2021.10.085
Lam, C. K. C., and Lau, K. K. L. (2018). Effect of long-term acclimatization on summer thermal comfort in outdoor spaces: a comparative study between Melbourne and Hong Kong. Int. J. Biometeorol. 62, 1311–1324. doi:10.1007/s00484-018-1535-1
Li, J., Niu, J., Miak, C. M., Huang, T., and Xie, Y. (2018). Assessment of outdoor thermal comfort in Hong Kong based on the individual desirability and acceptability of sun and wind conditions. Build. Environ. 145, 50–61. doi:10.1016/j.buildenv.2018.08.059
Liu, Z., Li, J., and Xi, T. (2023). A review of thermal comfort evaluation and improvement in urban outdoor spaces. Build 13 (12), 3050. doi:10.3390/buildings13123050
Lin, T. P., and Matzarakis, A. (2008). Tourism climate and thermal comfort in Sun Moon Lake, Taiwan. Intl. J. Biometeorol. 52, 281–290. doi:10.1007/s00484-007-0122-7
Lucena, R. L., Santos, T. H., Ferreira, A. M., and Steinke, E. T. (2016). Heat and human comfort in a town in Brazil’s semi-arid region. Int. J. Clim. Chang. 8, 15–30. doi:10.18848/1835-7156/CGP
Mahmoud, A. H. A. (2011). Analysis of the microclimatic and human comfort conditions in an urban park in hot and arid regions. Build. Environ. 46, 2641–2656. doi:10.1016/j.buildenv.2011.06.025
Manavvi, S., and Rajasekar, E. (2020). Semantics of outdoor thermal comfort in religious squares of composite climate: New Delhi, India. India. Int. J. Biometeorol. 64, 253–264. doi:10.1007/s00484-019-01708-y
Matzarakis, A., Rutz, F., and Mayer, H. (2007). Modelling radiation fluxes in simple and complex environments - application of the RayMan model. Int. J. Biometeorol. 51, 323–334. doi:10.1007/s00484-006-0061-8
Meinshausen, M., Meinshausen, N., Hare, W., Raper, S. C., Frieler, K., Knutti, R., et al. (2009). Greenhouse gas emission targets for limiting global warming to 2 °C. Nature 458, 1158–1162. doi:10.1038/nature08017
Mesta, C., Kerschbaum, D., Cremen, G., and Galasso, C. (2023). Quantifying the potential benefits of risk-mitigation strategies on present and future seismic losses in Kathmandu Valley, Nepal. Earthquake Spectra 39(1), 377–401. doi:10.1177/87552930221134950
Mi, J., Hong, B., Zhang, T., Huang, B., and Niu, J. (2020). Outdoor thermal benchmarks and their application to climate‒responsive designs of residential open spaces in a cold region of China. Build. Environ. 169, 106592. doi:10.1016/j.buildenv.2019.106592
Middel, A., Selover, N., Hagen, B., and Chhetri, N. (2016). Impact of shade on outdoor thermal comfort– A seasonal field study in Tempe, Arizona. Int. J. Biometeorol. 60, 1849–1861. doi:10.1007/s00484-016-1172-5
Mohammadzadeh, N., Karimi, A., and Brown, R. D. (2023). The influence of outdoor thermal comfort on acoustic comfort of urban parks based on plant communities. Build Environ 228, 109884. doi:10.1016/j.buildenv.2022.109884
Ng, E., and Cheng, V. (2012). Urban human thermal comfort in hot and humid Hong Kong. Energy Build. 55, 51–65. doi:10.1016/j.enbuild.2011.09.025
Nicol, F., Jamy, G. N., Sykes, O., Humphreys, M., Roaf, S., and Hancock, M. (1994). A survey of thermal comfort in Pakistan toward new indoor temperature standards. Oxford, United Kingdom: Oxford Brookes University, School of Architecture.
Nicol, F., Wilson, E., Ueberjahn-Tritta, A., Nanayakkara, L., and Kessler, M. (2006). “Comfort in outdoor spaces in manchester and lewes, UK,” in Proceeding of international conference on comfort and energy use in buildings: getting them right (windsor), organised by the network for comfort and energy use in buildings.
Nicol, J. (2003). The dialectic of thermal comfort. Inaugural lecture, Windsor Conference. United Kingdom: NCEUB.
Nikolopoulou, M., Baker, N., and Steemers, K. (2001). Thermal comfort in outdoor urban spaces: understanding the human parameter. Sol. Energy. 70, 227–235. doi:10.1016/S0038-092X(00)00093-1
Nikolopoulou, M., and Lykoudis, S. (2006). Thermal comfort in outdoor urban spaces: analysis across different European countries. Build. Environ. 41, 1455–1470. doi:10.1016/j.buildenv.2005.05.031
Pantavou, K., Theoharatos, G., Santamouris, M., and Asimakopoulos, D. (2013). Outdoor thermal sensation of pedestrians in a Medi-terranean climate and a comparison with UTCI. Build. Environ. 66, 82–95. doi:10.1016/j.buildenv.2013.02.014
Provencal, S., Bergeron, O., Leduc, R., and Barrette, N. (2016). Thermal comfort in Quebec City, Canada: sensitivity analysis of the UTCI and other popular thermal comfort indices in a mid-latitude continental city. Int. J. Biometeorol. 60, 591–603. doi:10.1007/s00484-015-1054-2
Ren, J., Shi, K., Li, Z., Kong, X., and Zhou, H. (2023). A review on the impacts of urban heat islands on outdoor thermal comfort. Build 13 (6), 1368. doi:10.3390/buildings13061368
Rijal, H. B. (2012). “Chapter 3: thermal adaptation outdoors and the effect of wind on thermal comfort,” in Ventilating cities – air flow criteria for healthy and comfortable urban living. Editors S. Kato, and K. Hiyama (Springer), 33–58. doi:10.1007/978-94-007-2771-7_3
Rijal, H. B., Humphreys, M. A., and Nicol, J. F. (2017). Towards an adaptive model for thermal comfort in Japanese offices. Build. Res. and Inf. 45 (7), 717–729. doi:10.1080/09613218.2017.1288450
Rijal, H. B., Humphreys, M. A., and Nicol, J. F. (2019). Adaptive model and the adaptive mechanisms for thermal comfort in Japanese dwellings. Energy and Build 202, 109371. doi:10.1016/j.enbuild.2019.109371
Rijal, H. B., Yoshida, H., and Umemiya, N. (2003). Summer and winter thermal comfort of Nepalese in houses. J. Arc, Plan Environ. Eng. 565, 17–24. (in Japanese with English abstract). doi:10.3130/aija.68.17_3
Rijal, H. B., Yoshida, H., and Umemiya, N. (2010). Seasonal and regional differences in neutral temperatures in Nepalese traditional vernacular houses. Build. Environ. 45, 2743–2753. doi:10.1016/j.buildenv.2010.06.002
Rising Nepal (2022). The annual average maximum temperature, 2020 was 26.1 degrees Celsius. Available at: https://risingnepaldaily.com/news/10597#:∼:text=The%20annual%20average%20maximum%20temperature,2020%20was%2026.1%20degrees%20Celsius (accessed on July 4, 2024).
Robine, J. M., Cheung, S. K., Roy, S. L., Oyen, H. V., Griffiths, C., Michel, J. P., et al. (2003). Death toll exceeded 70,000 in Europe during the summer of 2003. Comptes Rendus Biol. 331, 171–178. doi:10.1016/j.crvi.2007.12.001
Rutty, M., and Scott, D. (2015). Bioclimatic comfort and the thermal perceptions and preferences of beach tourists. Int. J. Biometeorol. 59, 37–45. doi:10.1007/s00484-014-0820-x
Salata, F., Golasi, I., de Lieto Vollaro, R., and de Lieto Vollaro, A. (2016). Outdoor thermal comfort in the Mediterranean area. A transversal study in Rome, Italy. Build. Environ. 96, 46–61. doi:10.1016/j.buildenv.2015.11.023
Sánchez Jiménez, J. L., and Ruiz de Adana, M. (2024). Assessment of outdoor thermal comfort in a hot summer region of europe. Atmosphere 15 (2), 214. doi:10.3390/atmos15020214
Sharifi, E., and Boland, J. (2018). Limits of thermal adaptation in cities: outdoor heat-activity dynamics in Sydney, Melbourne and Adelaide. Archiectural Sci. Rev. 61 (4), 191–201. doi:10.1080/00038628.2018.1482824
Shawesh, R., and Mohamed, M. (2021). Post-occupancy evaluation of outdoor thermal comfort in hot arid zone. Int. J. Low-Carbon Tech. 16, 50–60. doi:10.1093/ijlct/ctaa035
Shrestha, A. B., Wake, C. P., Mayewski, P. A., and Dibb, J. E. (1999). Maximum temperature trends in the himalaya and its vicinity: an analysis based on temperature records from Nepal for the period 1971–94. J. Clim. 12, 2775–2786. doi:10.1175/1520-0442(1999)012<2775:MTTITH>2.0.CO;2
Spagnolo, J., and de Dear, R. (2003). A field study of thermal comfort in outdoor and semi-outdoor environments in subtropical Sydney Australia. Build. Environ. 38, 721–738. doi:10.1016/S0360-1323(02)00209-3
Tsitoura, M., Michailidou, M., and Tsoutsos, T. (2017). A bioclimatic outdoor design tool in urban open space design. Energy Build. 153, 368–381. doi:10.1016/j.enbuild.2017.07.079
VDI (1998). Part I: environmental meteorology, methods for the human biometeorological evaluation of climate and air quality for the urban and regional planning at regional level. Berlin: Beuth. Part I: Climate. VDI guideline 3787.
Wang, Y., Wang, A., Zhai, J., Tao, H., Jiang, T., Su, B., et al. (2019). Tens of thousands additional deaths annually in cities of China between 1.5 °C and 2.0 °C warming. Nat. Commun. 10, 3376–3377. doi:10.1038/s41467-019-11283-w
Weather underground (2023). Kathmandu. Available at: https://www.wunderground.com/history/daily/np/kathmandu/VNKT/date/2023-8-4 (accessed on July 24, 2024).
Wei, R., Yan, J., Cui, Y., Song, D., Yin, X., and Sun, N. (2023). Studies on the specificity of outdoor thermal comfort during the warm season in high-density urban areas. Build 13, 2473. doi:10.3390/buildings13102473
Xu, M., Hong, B., Jiang, R., An, L., and Zhang, T. (2019). Outdoor thermal comfort of shaded spaces in an urban park in the cold region of China. Build. Environ. 155, 408–420. doi:10.1016/j.buildenv.2019.03.049
Yang, W., Wong, N. H., and Jusuf, S. K. (2013a). Thermal comfort in outdoor urban spaces in Singapore. Build. Environ. 59, 426–435. doi:10.1016/j.buildenv.2012.09.008
Yang, W., Wong, N. H., and Zhang, G. (2013b). A comparative analysis of human thermal conditions in outdoor urban spaces in the summer season in Singapore and Changsha, China. Int. J. Biometeorol. 57, 895–907. doi:10.1007/s00484-012-0616-9
Yatranepalko (2011). Nepal-geography. Available at: https://yatranepalko.blogspot.com/2011/02/nepal-geography.html# (accessed on July 1, 2024).
Keywords: outdoor thermal comfort, physiological equivalent temperature, universal thermal climate index, comfort temperature, adaptive model
Citation: Subedi R, Rijal HB, Khadka S, Aqilah N and Lamsal P (2025) Development of adaptive thermal comfort model for urban park based on field survey and literature review. Front. Built Environ. 10:1526919. doi: 10.3389/fbuil.2024.1526919
Received: 12 November 2024; Accepted: 30 December 2024;
Published: 06 March 2025.
Edited by:
Hasim Altan, Prince Mohammad bin Fahd University, Saudi ArabiaReviewed by:
Ilaria Pigliautile, University of eCampus, ItalyAlireza Karimi, Sevilla University, Spain
Copyright © 2025 Subedi, Rijal, Khadka, Aqilah and Lamsal. This is an open-access article distributed under the terms of the Creative Commons Attribution License (CC BY). The use, distribution or reproduction in other forums is permitted, provided the original author(s) and the copyright owner(s) are credited and that the original publication in this journal is cited, in accordance with accepted academic practice. No use, distribution or reproduction is permitted which does not comply with these terms.
*Correspondence: Hom B. Rijal, cmlqYWxAdGN1LmFjLmpw