- 1Architecture Program, School of Environment and Design, De La Salle – College of Saint Benilde, Manila, Philippines
- 2Microbiological Research and Services Laboratory, Natural Sciences Research Institute, University of the Philippines Diliman, Quezon City, Philippines
- 3Infrastructure, Ove Arup and Partners Hong Kong Ltd. – Philippine Branch, Mandaluyong, Philippines
- 4Department of Civil Engineering, De La Salle University, Manila, Philippines
- 5We Design Lab LLUID Builders INC., Antipolo, Philippines
- 6Fundamental Design Experts, Makati, Philippines
In this work, a conceptual framework is proposed for translating microbial research into usable design tools in an urban built environment. This study on Microbiomes of the Built Environment (MoBE), specifically the cultivable microbial count, incorporates building code and built environment design factors applied in the Philippine setting. The National Building Code of the Philippines with focus on minimum habitable room specifications was used to provide basis for the framework process. Human presence and ventilation were used as parameters to produce data that can be used as design tools. Using passive air sampling, the three experiments were conducted within Metro Manila according to the proposed framework. The first experiment using settle plates of culture media in the morning and afternoon seeks to understand how bacterial and fungal counts are affected in a naturally ventilated and in a non-ventilated room. The second and third experiments were done to test the effects of different window sizes and the number of humans on bacterial count, respectively. Results showed higher bacterial count in the room with natural ventilation compared to the room with no ventilation. The use of different window sizes did not show significant difference in counts with the number replicates used but as the number of humans in the area increased, the bacterial counts also increased. Data produced in the preliminary experiments were used to conceptually design a space in this paper. The authors suggest that this building-code inspired framework be used as a guide for MoBE studies as a starting point and be further developed to understand and eventually produce healthier built environments.
1 Introduction
Within the built environment (BE) are microbial communities shaped by the living that use the space. These microbial communities in that built environment, in turn, also affect other living organisms. There is an intricate relationship between the built environment, humans, and microorganisms, and that in the future, it is possible to manage microbiomes for the benefit of human health and wellbeing through our built environment (National Academies of Sciences, Engineering, and Medicine, 2017).
Humans spend a lot of time indoors. According to research done in the United States of America, and similarly in Canada, around 87% is usually spent indoors and 6% inside vehicles. There has been no significant change to this percentage over the decades (Klepeis et al., 2001). A similar study was done in England, UK, although only limited to office and laboratory workers. Results of the study have also shown that the majority of the people here also spend most of their time indoors, especially on weekdays (Baczynska et al., 2018).
Since humans spend most of their time indoors, it can be said that the indoor microbiome can affect the body’s microbiota, and thus affect health. Research has shown that environmental microbial ecosystems affect the microbiota and health of various species, and this includes humans (Flandroy et al., 2018). It is further discussed in their paper that there is a need to look at the bigger picture of how microbes in our whole ecosystem, including the human microbial ecosystem, are all interconnected. As humans, our choices and our behavior have a huge impact in the composition of the different microbial ecosystems.
While humans spend most of their time indoors, how indoor air is affected by exposure to outdoor air pollutants is also a concern in urban settings. They not only potentially carry pathogens that are connected to illnesses, they also lack microbial diversity that increases susceptibility to asthma and allergies as compared to rural areas that have a diverse microbiome (Franchitti et al., 2022). Research suggests that lack of exposure to diverse microorganisms is correlated to a variety of health problems (Thomas et al., 2017). As early as 1989, research results have shown that cleaner environments and better personal hygiene have resulted in a decline in cross infection among families, which in turn may have led to more people being more prone to allergies (Strachan, 1989). Two decades later, a review article was also published supporting this study (Okada et al., 2010). There were studies mentioned in this paper that suggest that exposure to microbes does indeed help with regulating diseases and disorders. One of the studies talked about here had results that show that increased number of siblings resulted in lesser risk of multiple sclerosis (Ponsonby et al., 2005). And another talks about how there were lesser cases of diabetes in children who had more siblings and those who changed locations often (Cardwell et al., 2008).
While it is still not yet known what a healthy and unhealthy microbiome is, what is known is that absolute sterility does not completely equate to good health (Bosch et al., 2024). But in the case of, for example, hospital settings, there is a need for hygiene and sterile environments to reduce the risk of spreading contagious diseases, and compromising the immunocompromised (Vandegrift et al., 2017). Residential spaces tend to collect bioaerosols which are particles in the air that consist of living and non-living things. Prolonged exposure to these can result in certain sicknesses (Chen et al., 2024). In these cases, mitigation of microbial load to prevent pathogens to spread is imperative (Brown et al., 2016).
It is too simplistic to state that too few microbial exposure is not healthy, nor it can be said that too much exposure is healthier. The study of microbes is too complex to box them in either A or B. The old adage in hygiene as ‘microbes being all bad and that we should get rid of them’ is outdated. Hygiene should be about the reduction of the spreading of pathogens and the recognition of the importance of a diverse microbiome for there are good microbes as well (Vandegrift et al., 2017). Exposure to a right range and composition of microorganisms may be more advantageous for health (Stephens, 2016).
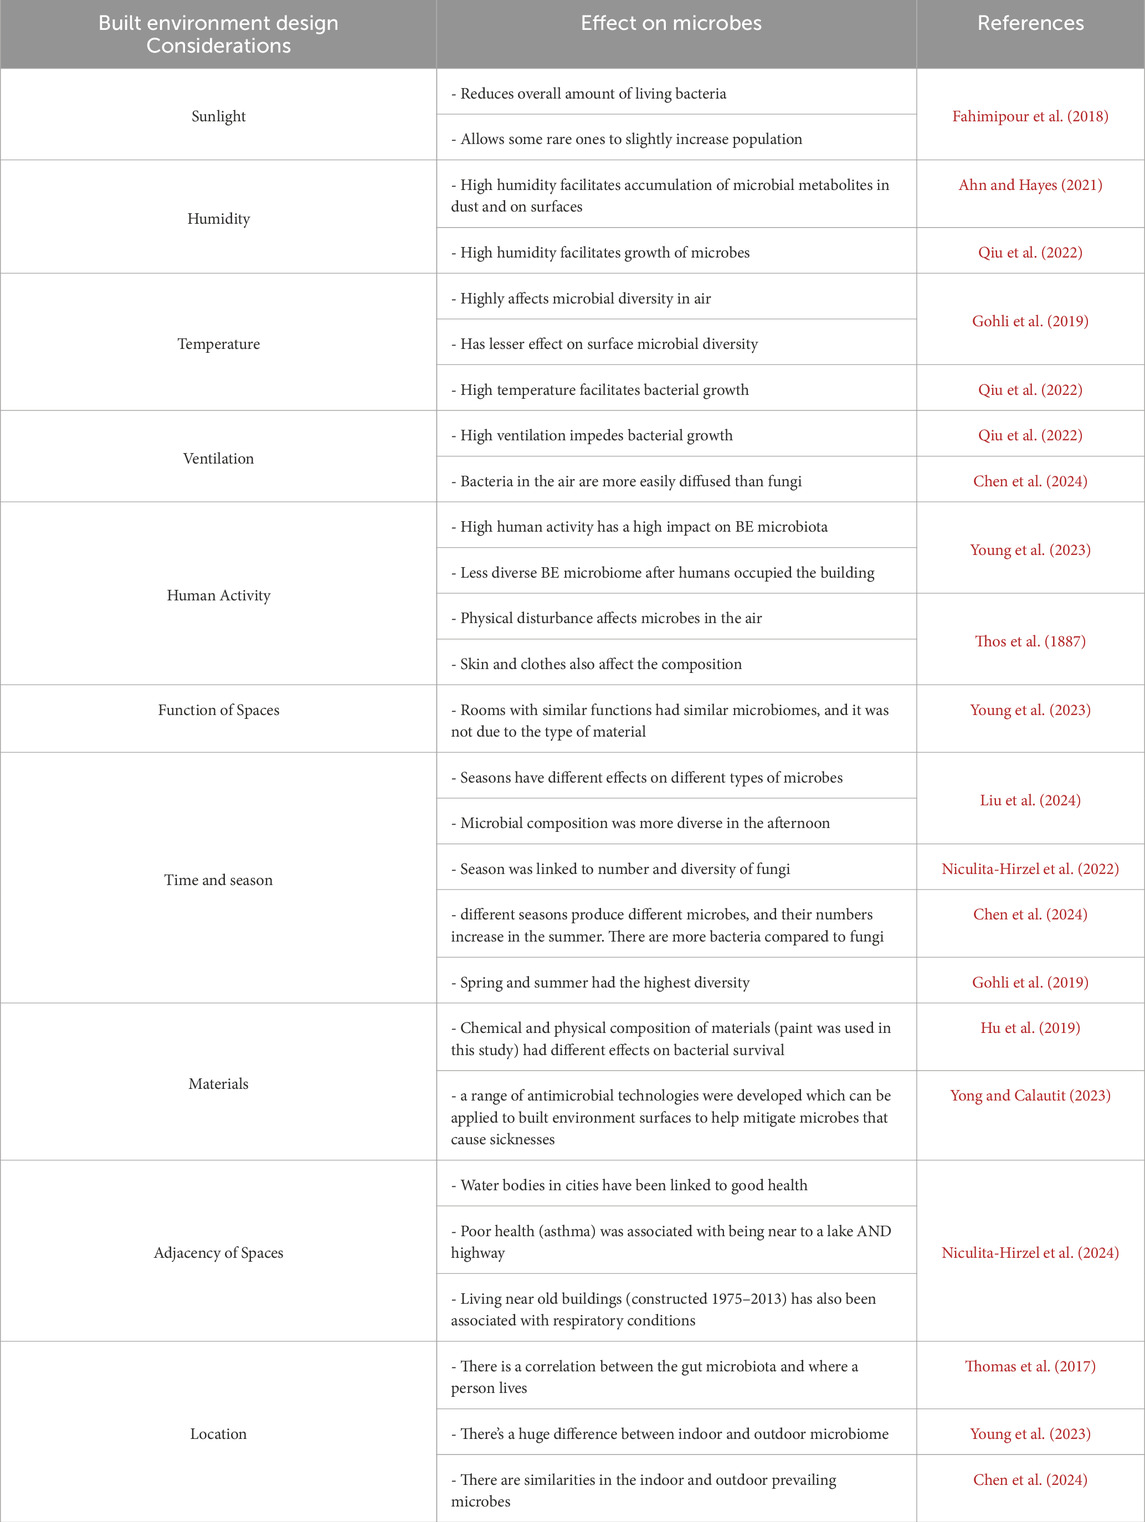
Humans design the BE not knowing how much it influences the microbiome. While there are emerging studies that posit the connection between microbiomes and design, information related to this field of study typically only reaches those familiar in the field of scientific research. These studies fail to reach design practitioners. For instance, the architecture profession, where practitioners typically lack exposure to or training in reading peer-reviewed journals or attending scientific conferences, may find the scientific research irrelevant or challenging to translate into design guidelines (Brown et al., 2016). It is important that information about this field of study reach design practitioners, for they decide on the design and how spaces and buildings operate, which in turn affects the microbial composition of the space (Stephens, 2016). Some BE design considerations that are known to affect the Microbiomes of the Built Environment are sunlight, humidity, temperature, ventilation, human activity, season, time, materials, function of spaces, adjacency of spaces, and location. Refer to Table 1 for some research results linking the mentioned BE design considerations to microbial composition.
As humans, we each have our own preferences and intentions. Every human has their own take on what material to use, how much sunlight gets in, what room should be beside another room, what building typology should be built in the next block, and even what the zoning of cities should be. As evidenced in a study (Hormigos-Jimenez et al., 2019), as simple as determining the placement of furniture can affect air flow for improved Indoor Air Quality (IAQ). Through these (Table 1), the microbial composition of the built environment is influenced. It is influenced through design choices, and through how humans use space. By understanding how design shapes the BE microbiome, it is possible to design spaces that promote a healthy microbial composition which in turn affects human health (Kembel et al., 2014).
Since it is now known that humans, microbes, and the built environment are interconnected and that there is an influence to one another, and that the notion of “complete cleanliness is the best approach for good health” is not always true, humans should be more informed and conscious of the ways the built environment is designed. Learning how to modify the built environment to allow for a diverse and healthy microbiome is a must. The only problem is the concept of a healthy or ideal microbial environment remains unknown (Bosch et al., 2024).
According to an article (Matthews et al., 2024), incorporating green spaces to cities, including incorporation to building design, would help with the immune system. The green spaces would increase exposure to diverse microbes which would be good for health. It was also mentioned that while there are already existing efforts of this, data on how to optimize microbiomes in the BE is still lacking. In a study, outdoor air was found to be a primary source of bioaerosols in enclosed spaces, but even if this is the case, human-related microbes and potential pathogens still tend to gather more indoors. It was also discovered that the effects of natural ventilation on affecting the composition and abundance inside the space is low (Núñez and García, 2022).
As mentioned by Brown et al. (2016) and Stephens (2016), microbial studies fail to reach design practitioners and that there is difficulty translating these studies into design tools or guidelines. It is important to look at what design practitioners typically use as a guide when they plan or design the BE. One thing design practitioners consistently use as a guide is the building code.
By definition, a building code contains minimum standards for construction that “protect public health, safety and general welfare” (Penn State University, 2024). Given how this is a guidebook for how spaces are designed and constructed, to date, there are not much studies that directly incorporate the building code to microbial studies.
Since a building code can be unique to a country, this study incorporated a part of the National Building Code of the Philippines (NBCP) which is the Minimum Habitable Room (MHR). As the name implies, MHR contains the minimum standards for a habitable room in the Philippines.
To date, there are only a few studies that can be related to MoBE in the Philippines. Microbial composition of spaces in the Philippines that relates to human usage patterns are still under-studied (Laxamana et al., 2024). In this paper by Laxamana, they have found that human occupancy had effects on air and surface microbes. And while there have been efforts of Indoor Air Quality (IAQ) studies in the Philippines, they were more about chemical contaminants than microbes (Anastacio et al., 2011). It was also mentioned in this paper that the IAQ studies that were done were mostly conducted by mechanical engineers who have little to no background on microbiology, which leads us to the importance of promoting interdisciplinary studies and collaboration.
Due to the country’s susceptibility to environmental risk factors, especially to ones concerning diseases, understanding the impact of microbes to health is of utmost importance. Given how the Philippines is a developing country (United States Agency International Development, 2012; United Nations Department of Economic and Social Affairs, 2014; Australian Government Department of Foreign Affairs and Trade, 2022), it is difficult for a typical Filipino family to afford good living conditions that would be good for their health.
In an article by the World Health Organization in 2016, environmental risk factors (pollution, chemical exposure, climate change, UV radiation) have accounted for hundreds of diseases and injuries in the world. In their data in 2006 about the Philippines, 22% of diseases and 6% deaths were connected to environmental risk factors. While already being a country prone to disasters, communicable and non-communicable diseases are also rampant (World Health Organization, 2016). With the rampancy of these diseases, the Philippines had been hit extra hard by the COVID-19 pandemic. And with lockdowns being the prevailing means to mitigate the virus, it had one of the worst outbreaks in Southeast Asia (National Library of Medicine, 2021).
To give an overview of the existing standards for minimum standard of living in the country, Table 2 compares the contents of two building codes relating to space and ventilation.

Table 2. Comparison of two of the building regulations in the Philippines relating to the minimum standards of living.
According to the Philippine Statistics Authority (2022), the typical Filipino household size is 4.1 persons (Philippine Statistics Authority, 2022). If we were to follow the minimum air space required for a person, a Filipino household would need about 56 m3 of air space which translates to at least 28 m2 for socialized/economic housing or around 21 m2 for MHR. To give a perspective on current conditions, in 2023, 28 m2 socialized housing in subdivisions costs Php 850k. In condominium socialized housing units, it costs Php 933k for 22 m2 units, and Php 1.06m for 25 m2, and Php 1.145m for 27 m2 (Philippine Daily Inquirer, 2023b; Philippine Daily Inquirer, 2023a). To give more perspective, an average Filipino family has an average annual income of Php 353,230 with an annual expense of Php 258,050 (Philippines Statistics Authority, 2024). Converting this to monthly, income would fall short of Php 30k and expenses would roughly be Php 21k. It is worth noting that this is for an average household and there are still minimum wage earners or combined family income that get a monthly income of Php 25k (Philippine Daily Inquirer, 2023b). In 2021, there was also news that wages were as low as Php 10k and lower pre pandemic which went further down to Php 6k during the pandemic (Philippine Daily Inquirer, 2021). There is a potential need to revise the current standards to make the space healthy and livable for a typical household.
This study proposes a framework for MoBE studies using microbial experiments with building code and BE design considerations using ventilation and human presence as parameters, being major drivers of microbes in a space (Meadow et al., 2014).
It is also important to note the scope and limitations of this paper, namely,.
• Design microbial experiments relevant to BE design. MHR from the NBCP and household size from PSA were used for Ventilation Sizes and the Number of Humans studies.
• Passive air sampling technique was used with results expressed as the number of cultivable bacteria and fungi. The funding limited the experiments’ samples size, and Experiment 2’s controlled setup. The preliminary data is used as proof of concept that can be translated into tools/guides for design practitioners.
• Develop an understanding on how much bacteria and fungi are affected by outdoor air in a naturally-ventilated and in a non-ventilated room (Experiment 1)
• Develop an understanding on the effects of ventilation sizes on bacterial count (Experiment 2).
• Develop an understanding on the effects of the number of humans on bacterial count (Experiment 3).
2 Microbial experiments methodology
2.1 General methodology
Passive air sampling was used to collect microbial samples from the air for all the experiments. Petri dishes (65 cm2) were pre-poured and air-dried. The Petri dishes made of Plate Count Agar (PCA) and Yeast Extract Glucose Chloramphenicol (YEGCA) (for Experiment 1 only) were used to collect and count bacteria and fungi, respectively. Plate Count Agar is a non-selective medium for the growth of bacteria (Rice and Bridgewater, 2012) and YEGCA is selective medium used to enumerate mold and yeasts in samples (Neogen, 2021). To avoid contamination, gloves were worn in the setting up and collection of exposed plates/samples on sanitized surfaces with plastic covering. Duplicate plates were placed at the center of the room of each set-up (Experiment 1 and 3). For Experiment 2, a box was built for a scaled set-up of an MHR for base value consistency. The experiments were conducted in single-detached residential houses located in the highly urbanized Metro Manila.
After collection of the exposed plates at measured exposure times, the plates were sealed and brought to the Natural Sciences Research Institute (NSRI) for incubation (2–3 days) and for counting. The microbial count per plate is reported as colony forming units (CFU). To convert CFU to CFU/m3, the equation by Omeliansky below was used (Hayleeyesus and Manaye, 2014; Andualem et al., 2019):
Where N = microbial CFU/m3 of indoor air.
a = number of colonies per Petri dish
b = dish surface (cm2)
t = exposure time in minutes.
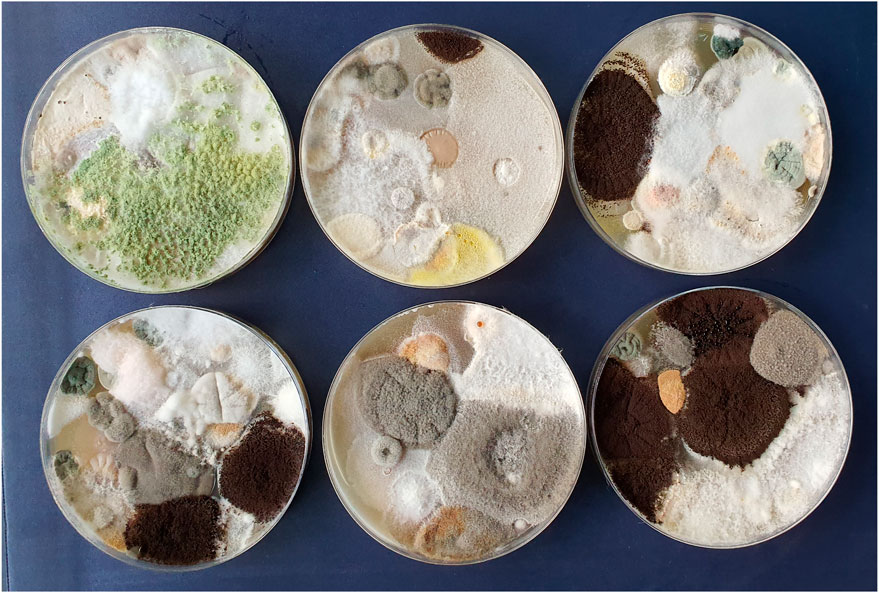
After the CFU/m3 values were calculated, the values were averaged to get the percent differences. The plates with spreader results (Figure 1) were not included in the average. Values presented in the Results section are already averaged and adjusted for comparison and analysis.
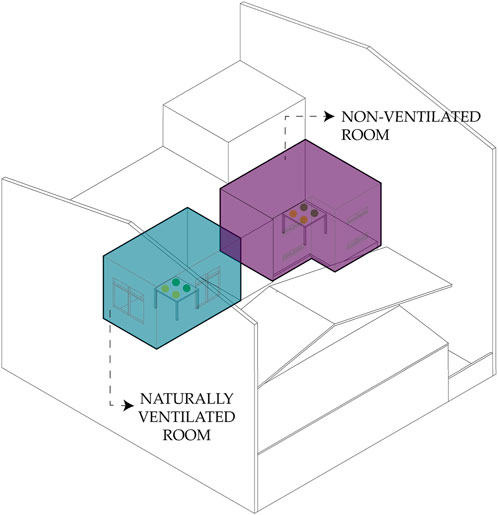
The typical experiment setup can be seen in Figure 2. Variations in methodology or computation adjustments are included in each experiment’s section.
2.2 Experiment 1 – bacteria and fungi dispersion in a naturally ventilated room and non-ventilated room
To understand the sampling method of collecting bacteria and fungi in a built environment, exposures of duplicate plates of PCA and YEGCA were done for 3 days, twice a day per pair (morning and afternoon) with 5 h exposure time each. The bedrooms used in the experiment all belonged to the same house and are adjacent to one another. The temperature and humidity were not taken into account. The rooms were not disinfected prior. Figure 3 shows the setup for this experiment. Results from this initial experiment influenced the conduct of Experiments 2 and 3.
2.3 Experiment 2 – bacterial count in scaled room setup using different window sizes
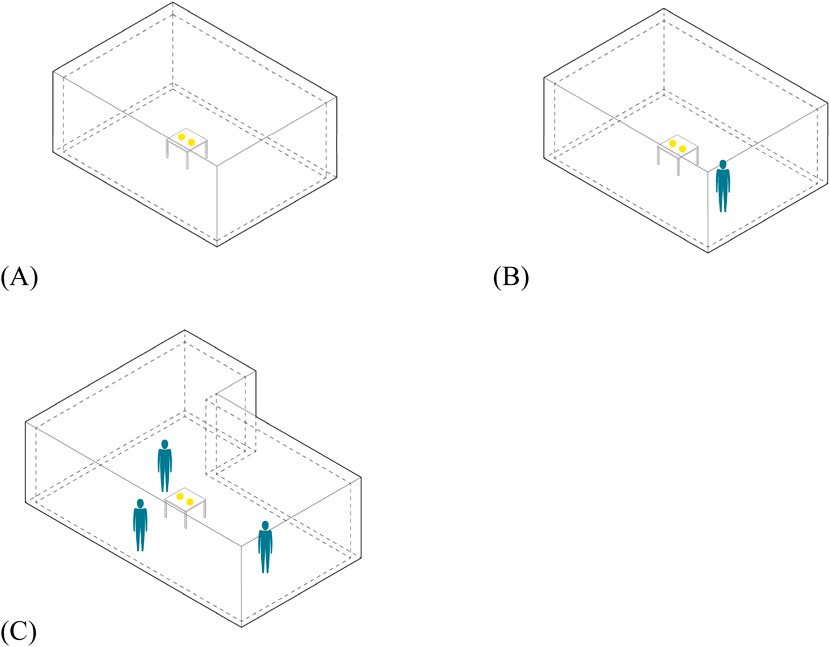
To determine the effect of different ventilation conditions on bacterial count, a 1:2 scaled room of an MHR (actual size dimensions: 3 m × 2 m × 2.7m; scaled room dimensions: 1.5 m × 1 m × 1.3m) based on the NBCP (refer to Table 2) was built to simulate an actual room with different window sizes. In an experiment done by Qiu et al. (2022), they built a clear test chamber to be able to determine how humidity and ventilation impact bacterial growth. In the case of our paper, given the limited funding, the team only managed to build a single setup using boards with the openings covered/uncovered to create the different window sizes to test ventilation effects on bacterial counts. The temperature and humidity were not taken into account. The data were collected under the following ventilation conditions: 1) Baseline (no opening), 2) Small Ventilation (SV) - minimum window size is 10% of floor area, 3) Medium Ventilation (MV) – window size is 20% of floor area, and 4) Large Ventilation (LV) window size is 30% of floor area. Two PCA agar plates were exposed for 1 h under each of these conditions. The experiment was done only for bacteria with a shorter exposure time to manage cost and time. The setup was not disinfected before and after each modification. Figure 4 shows the setup of this experiment.
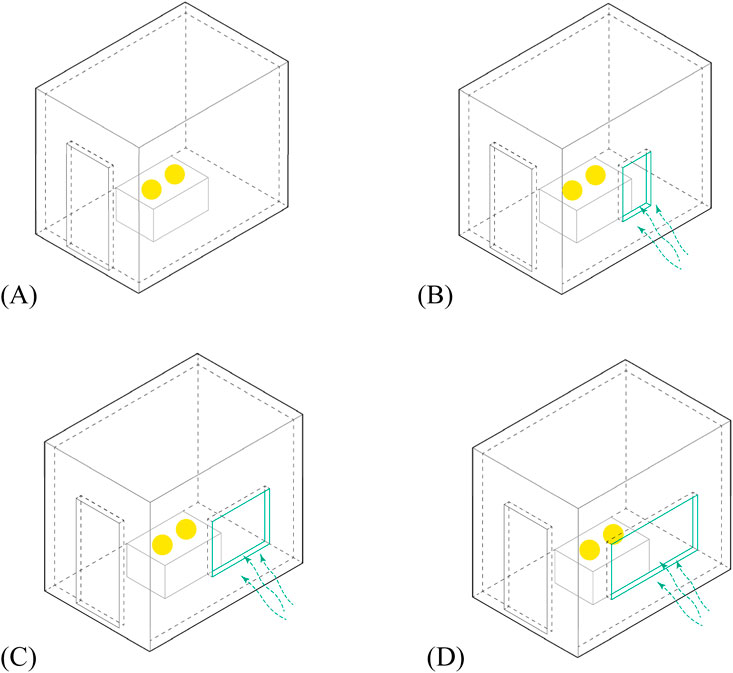
Figure 4. Diagrams showing the setups for experiment 2. (A) Baseline/no opening; (B) small ventilation (SV); (C) medium ventilation (MV); (D) large ventilation (LV).
2.4 Experiment 3 – bacterial dispersion based on the number of humans
To determine the effect of the number of humans on bacterial count, semi-controlled setups (3 bedrooms of close dimensions) were used. The bedrooms all belonged to the same house and are adjacent to one another. The rooms were not disinfected prior, but they are all mechanically ventilated (air-conditioning unit). The data were collected under the following conditions: 1) 0 Human (0H) in a 15.83 m3 room, 2) 1 Human (1H) being one male (age 17) in a 15.83 m3 room, and 3) 3 Human (3H) comprised of two males (both 24) and one female (age 26) in a 21.85 m3 room. Two PCA agar plates for each setup were exposed for 1 h. The activities done by the humans in their respective rooms as well as the temperature and humidity were not accounted for. You may refer to Figure 5 for the setup of this experiment.
3 Microbial experiments results
3.1 Experiment 1 – bacteria and fungi dispersion in a naturally ventilated room and non-ventilated room
Figure 6 shows the bar graph of daily average counts of cultivable bacteria and fungi for 3 days in a Naturally Ventilated Room and in a Non-Ventilated Room.
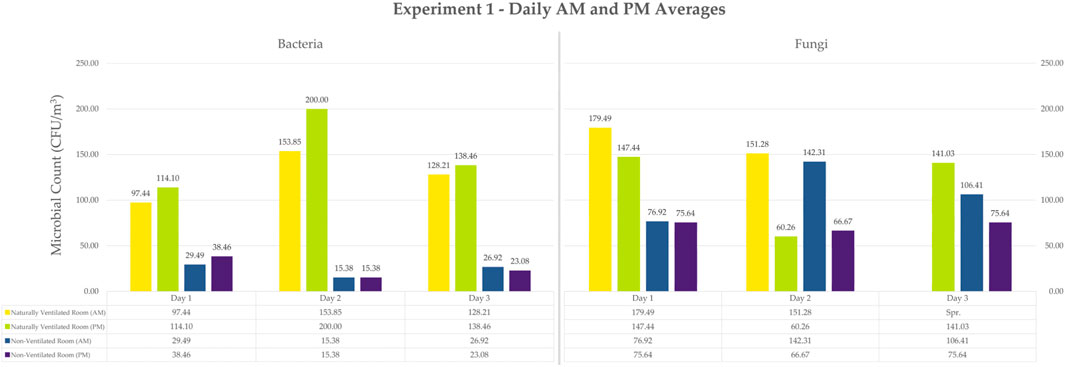
Figure 6. Bar Graph of Daily Average Counts for Experiment 1 Bacteria and Fungi. Values are already converted to CFU/m3. Note that the samples with spreaders were not included in the average. They are not inherently 0, so it was instead not included.
Bacterial counts of plates exposed under natural ventilation ranged from 97.44 to 200 CFU/m3, while the plates exposed under the condition of no ventilation ranged from 15.38 to 38.46 CFU/m3. Additionally, fungal colony counts under natural ventilation ranged from 60.26 to 179.49 CFU/m3, while counts under the condition of no ventilation ranged from 66.67 to 142.31 CFU/m3.
The 3-day average (Figure 7) for bacterial counts under natural ventilation is 138.68 CFU/m3 while the average count under no ventilation is 24.79 CFU/m3. For fungal counts, 140.81 CFU/m3 was obtained under natural ventilation and 90.60 CFU/m3 under the condition of no ventilation.
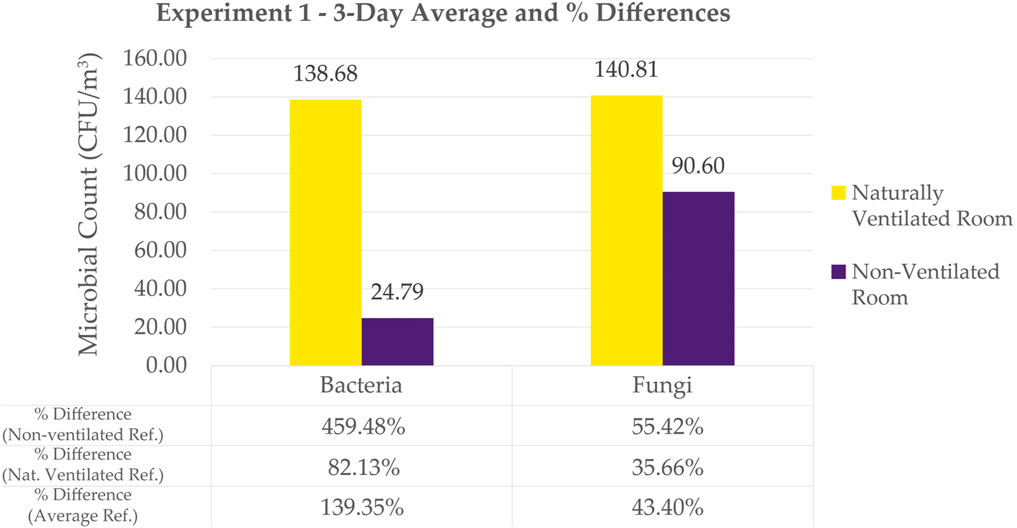
Figure 7. Bar Graph of 3-day Average Counts for Experiment 1 Bacteria and Fungi. Also tabulates Naturally Ventilated Room vs. Non-Ventilated Room Percentage Differences. Note that the samples with spreaders were not included in the average. They are not inherently 0, so it was instead not included.
For bacteria, the naturally ventilated room showed significantly higher bacterial count compared to the non-ventilated room. The non-ventilated room showed more consistent and lower bacterial counts over the 3-day period for plates exposed in the morning and afternoon (Figure 6). In the naturally ventilated room, afternoon exposure showed higher counts compared to morning exposure.
Like the bacterial count results, the naturally ventilated room produced higher fungal counts in general (Figure 6). However, for Day 2, morning sampling under the condition of no ventilation, the counts obtained were almost as high as its ventilated counterpart. Fungal counts from both the morning and afternoon samplings in both room setups expressed high variability in their numbers with a lot of spreader colonies observed especially on Day 3. Morning samples from both naturally ventilated and non-ventilated rooms showed higher fungal counts compared to afternoon samples–a different behavior from the bacteria counts under the same conditions.
Figure 7 shows the bar graph of the 3-day average counts of cultivable bacteria and fungi in a Naturally Ventilated Room and in a Non-Ventilated Room.
In this study, the percent difference was computed between the counts of bacteria in natural ventilation compared to no ventilation. It was similarly computed for fungi. These results show how natural ventilation impacts the microbial count in a room.
Adding natural ventilation showed a percentage difference of 459.48% for bacterial count. t-test shows a significant difference in bacterial count between naturally ventilated and non-ventilated room (refer to Supplementary Appendix). On the other hand, the increase in fungal count was only 55.42% with the addition of natural ventilation. Even with a lower percentage compared to that of bacteria, t-test shows a significant difference on fungal count between naturally ventilated and non-ventilated room (refer to Supplementary Appendix). Even with the lack of ventilation, the fungal count remained high compared to bacterial counts that remained low.
Fungal samples were no longer collected for the next set of experiments to lessen the scope. Since results of Experiment 1 showed that natural ventilation played a significant role in microbial dispersion, Experiment 2 was designed to test the effect of natural ventilation using different window sizes on bacterial count.
3.2 Experiment 2 – bacterial count in scaled room setup using different window sizes
Figure 8 shows a bar graph of average bacterial counts with different ventilation sizes.
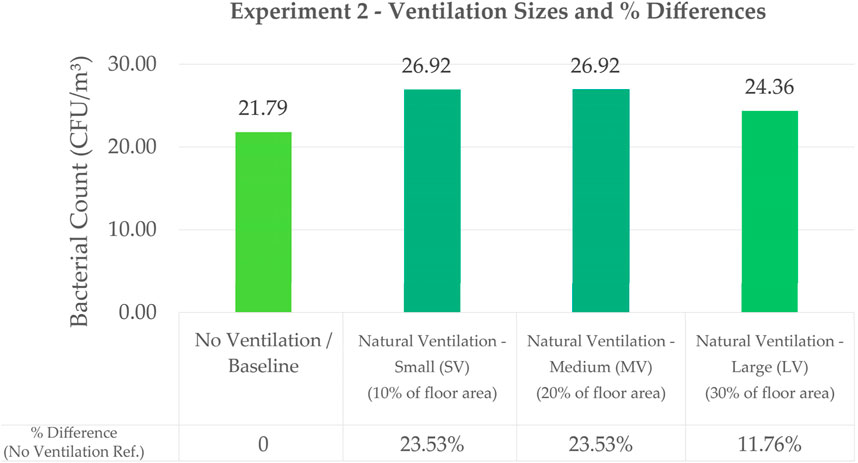
Figure 8. Bar Graph Comparing the Effect of Different Ventilation Sizes on Bacterial Count with their Corresponding Percentage Differences Using Exp 2 No Ventilation as Baseline Value.
Bacterial counts for Large Ventilation (LV), Medium Ventilation (MV), and Small Ventilation (SV) at 24.36 CFU/m3, 26.92 CFU/m3 and 26.92 CFU/m3, respectively, did not show significant difference in counts. Statistical analysis using t-test shows that there is no significant difference between the bacterial counts of the three window sizes (refer to Supplementary Appendix). LV had the lowest count which may be attributed to LV having better air flow, thus reducing the concentration of bacteria. However, the results could also be attributed to air disturbance caused by smaller openings (Fu, 2018), thus SV and MV having higher counts than LV. In a study to understand air flow in operating rooms (Vonci et al., 2019), results show that turbulent flow ventilation produced more microbial counts as compared to laminar air flow which produced lower counts. In the case of this paper, the smaller opening may have caused turbulent air flow. More setups with greater difference in window sizes should be studied for this experiment to obtain more conclusive results. However, the results of this experiment, mainly the percent differences, can be applied to the Conceptual Application in the next section of this paper.
3.3 Experiment 3 – bacterial dispersion based on the number of humans
Figure 9 shows a bar graph of the average bacterial count in relation to the number of humans in a room.
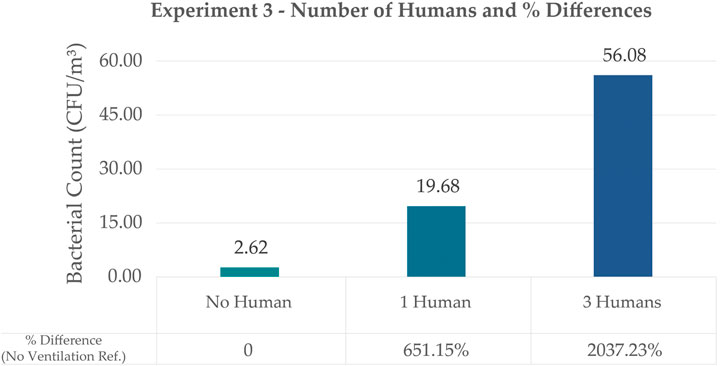
Figure 9. Bar Graph Comparing the Effect of the Number of Humans on Bacterial Count with their Corresponding Percentage Differences using Exp. 2’s No Ventilation as baseline value. The values shown are the adjusted values to account for the differences in room dimensions.
Results showed that humans have a huge impact on bacterial count inside a space which is also supported by t-Test Analysis (refer to Supplementary Appendix). Although this experiment did not consider whether the source of the bacteria came from the humans or from air disturbance due to human movement, it was observed that as the number of humans increased, the bacterial count also significantly increased. No (0) humans showed a bacterial count of 2.62 CFU/m3 and this value is used as reference for % difference for the setups with one human and three humans. Bacterial counts of the room with one human had a value of 19.68 CFU/m3 which is 651.15% difference. Bacterial counts of a room with three humans had a value of 56.08 CFU/m3 which is 2037.23% difference from the reference.
Given these results, it is also interesting to observe that Experiment 3’s 3-human setup with a plate exposure time of 1 h still resulted in higher counts as compared to Experiment 1’s naturally ventilated room with plate exposure at 5 h. In this study’s experiments, it would seem that human exposure resulted in the highest counts compared to ventilation and even exposure time. It would be helpful to also identify the species in these different setups to see how much these variables affect the composition of microbes in a space. In a study by Oberauner et al. (2013), they were able to get data that a good number of the bacteria they sampled in a space (ICU) is composed of human pathogens.
Similar to Experiment 2, the results of this experiment, mainly the percent differences, can be applied to the Conceptual Application in the next section of this paper.
4 Conceptual application of results
Data from Experiments 2 and 3 were used for the Conceptual Application in this paper.
4.1 Methodology of conceptual application
1. Get baseline microbial count (CFU/m3) of an enclosed MHR.
2. Incorporate Number of Humans Parameter.
3. Incorporate Ventilation Size Parameter -to control the amount of bacteria in the space.
Figure 10 shows a visual diagram of these steps.
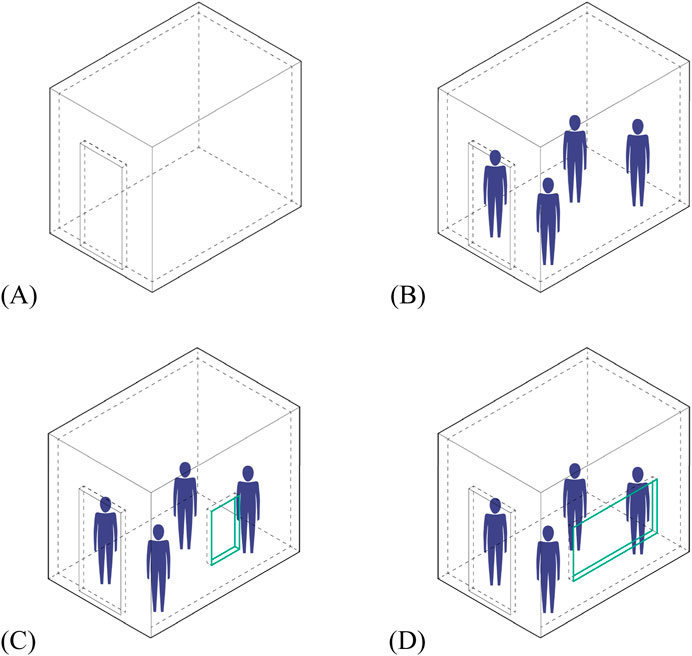
Figure 10. Conceptual Application Visual Diagram. (A) Step 1 - Baseline Microbial Count (CFU/m3) of an MHR; (B) Step 2 - Incorporate Number of Humans Parameter; (C) Step 3A- Incorporate Ventilation Size Parameter–small ventilation; (D) Step 3B- Incorporate Ventilation Size Parameter–large ventilation.
4.1.1 Step 1 – get baseline microbial count (CFU/m3) of an MHR
The baseline data from Experiment 3 was used.
4.1.2 Step 2 - incorporate number of humans parameter
Using data from Step 1, the computation of bacterial counts based on presence of four humans was computed for using exponential regression below (full computation details can be found in the Supplementary Appendix). This was done to align with the average number of persons in a typical household in the Philippines, according to PSA (2022).
Where y = dependent variable; microbial load.
x = independent variable; number of persons
a and b = constants calculated by the data; a = 4.0136, b = 0.9501
e = base of the natural logarithm; 2.718281828
Exponential regression analysis was conducted to produce a good starting point for conceptual application. It is a statistical method to generate the best-fitting exponential curve using a set of data (LePine, 2022). Similarly, Rohim et al. (2020) used this type of regression analysis in their study. Despite the small sample size, the result calculated in this analysis will serve as a guide for future experiments. More comprehensive data collection is recommended for a more accurate model.
4.1.3 Step 3 - incorporate ventilation size parameter
Combine the result of Step 2 with values from Experiment 2.
Since the amount of healthy microbial load in a typical room setting is unknown, the following computation was used to apply different ventilation sizes to affect the microbial load in a room. Only SV and LV were used since the value for MV is almost similar to SV. The calculation is summarized as follows:
Where MHR4pax = microbial load of a ventilated MHR with four persons.
MHRNV = microbial load of the non-ventilated MHR with four persons.
%Difference = value of ventilated and non-ventilated in percent value.
Results:
Refer to Table 3 for a tabulation of the computation results for each step.
5 Discussion
5.1 Designing microbial experiments
The specific details on humidity, temperature, and other climate factors were not recorded during the studies conducted, but the following basic data are gathered from the (Philippine Atmospheric, Geophysical and Astronomical Services Administration, 2024) for the Philippine climate.
• Temperature: mean annual temperature is 26.6 Celsius.
• Humidity: relative humidity that ranges from 71% to 85%.
• Rainfall: mean annual rainfall ranges from 965 mm to 4,064 mm.
• Seasons: two major seasons: rainy season and dry season.
Experiments 1 and 2 provide understanding on how outdoor air (external factor) affects microbial count. Experiment 3, on the other hand, provides understanding on how humans (internal factor) affect microbial count inside a space. Experimental results have shown that ventilation and human presence play a role in microbial dispersion, with human presence having a much more significant effect, either through contributing to microbial load or disturbance. This is also similar to the conclusion of Nuñez and team (2022) that natural ventilation had negligible impact as compared to human impact.
The nature of how microbial experiments are designed plays a key role in gathering usable data. As discussed by Nice (2020), BE factors are not usually included in microbiological studies which limits a holistic understanding of indoor microbiomes. The performance of Experiment 1 produced an understanding on the behavior of bacteria and fungi in a naturally ventilated and non-ventilated room, but difficult to be directly translated into BE design. Experiments 2 and 3 were planned to produce data results that can be translated into design tools. Experiments 2 and 3 gave us understanding on microbial count which can also be applied to BE design. The data produced by Experiments 2 and 3 can potentially be used to come up with the optimal size and number of windows to improve microbial diversity in a space. As mentioned by Brown et al. (2016), it is important to bridge the gap between scientific research and its practical application in design to make it understandable and usable by design and construction practitioners if we want to purposely make healthier BE.
5.2 Conceptual application of results
The results of the experiments were translated into BE design in terms of what ventilation size to use in relation to the number of humans in a certain space. Since humans play a huge role in the dispersion of microbes, it is worth considering building a database of microbes relating to the function of a space. For example, in an operating room a ≤10 CFU/m3 is required to prevent contamination during operations (Cao et al., 2022). This paper also highlights the effects of human activity in influencing the microbial count in a room.
The conceptual application in this paper may be improved with the incorporation of more design considerations and BE factors. Figure 11 proposes a simple conceptual framework on how future MoBE studies can be conducted. Step 1 is done to develop understanding of the relationship between microbes in the built environment. This step produces data for Step 2 and Step 3. Step two is the beginning of the design application and serves as the foundation. Since humans can be one of the main driving factors of a microbiome, development of baselines and patterns based on a space or a room’s function, and studies on the effect of the number of users on the baseline are recommended. Once space patterns are established, Step 3 is performed such that design adjustments can be applied to control the microbes in the given space. Step 3 requires data on ventilation types and sizes, interconnectedness of spaces, materials used, and many more. Steps 2 and 3 could, in turn, inform experiment iterations in Step 1. This proposed framework, therefore, could serve as a starting point to guide future MoBE studies.
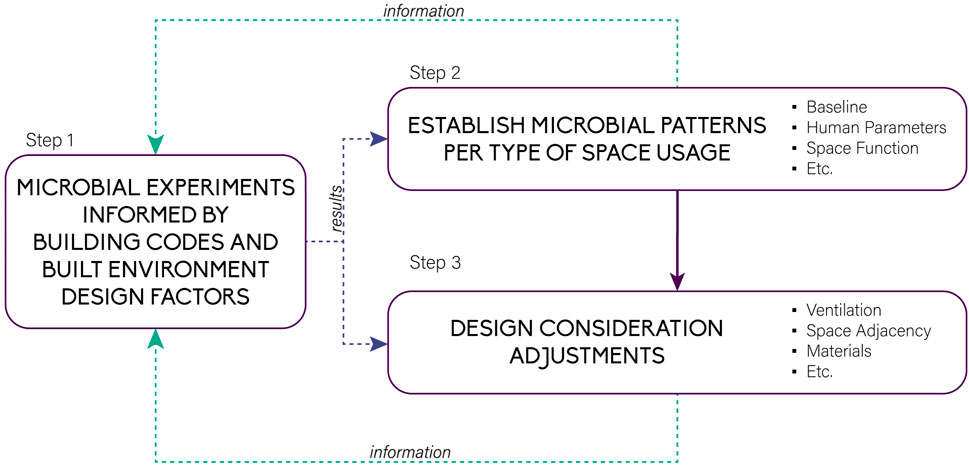
Figure 11. Proposed conceptual framework for translating microbial research into usable design tools.
5.3 Recommendations for future studies
1. Use more controlled setups to be able to isolate data of different variables and design considerations (ex. temperature, humidity, sterility).
2. Conduct experiments on actual human size spaces and do comparative studies if done on different scales.
3. Increase the sample size for accuracy of results.
4. More in-depth studies on ventilation (ex. placement, types of windows, type of ventilation, etc.).
5. Include fungi samples in ventilation and human parameter studies or in any other studies to be conducted, since they seem to have a different behavior from bacteria.
6. Incorporate more built environment design considerations and study how each affect one another.
7. If passive air sampling is used, use the standard of Index of Microbial Air contamination (IMA) - 1h; 1m height; 1m away from obstacles (Napoli et al., 2012; Pasquarella et al., 2000; Viani et al., 2020).
8. If passive air sampling is used with culture media, it is recommended to use Tryptic Soy Agar (TSA) instead of PCA for bacteria, and Sabouraud Chloramphenicol Dextrose Agar (SabC) instead of YEGCA for fungi, similar to the media used by Napoli et al. (2012) for comparison since they have also used IMA.
9. Incorporate ASHRAE 62.1 and 62.2 that contains standards for ventilation and indoor air quality (ASHRAE, 2022).
10. Incorporate more aspects of the NBCP and other local codes and guidelines.
11. Incorporate codes and other design guidelines of other countries.
12. Update the proposed conceptual framework (Figure 11).
6 Conclusion
Even though humans spend most of their time indoors, exposure to bioaerosols from the outdoors still contribute largely to indoor microorganisms (Osunmakinde et al., 2020). Understanding the effects of different BE design considerations by quantifying and establishing patterns of microbial count and dispersion between spaces in the urban built environment is of vital importance.
This study showed that ventilation and the number of humans greatly affected the cultivable bacterial count in the built environment. While the experiments in this study were performed only in small spaces, they may still provide insights to studies in larger spaces.
The design of the BE may not be considered to have direct or immediate implications to health, but studies on how BE design considerations affect microbiomes that impact health long-term need to be understood more. The creation of a simple model in this study of how microbial count impacts BE design with the collaboration of architects, microbiologists, and engineers is a step towards this direction.
While it is still unknown what a completely healthy space is, because much is still unknown in the microbial world, it is imperative to start studying how to consciously manipulate their dispersion in the BE–not just indoors, but also outdoors.
Data availability statement
The original contributions presented in the study are included in the article/Supplementary Material, further inquiries can be directed to the corresponding authors.
Author contributions
MV: Conceptualization, Data curation, Formal Analysis, Funding acquisition, Investigation, Methodology, Project administration, Resources, Supervision, Validation, Visualization, Writing–original draft, Writing–review and editing. VA: Investigation, Supervision, Validation, Writing–original draft, Writing–review and editing. AR: Data curation, Formal Analysis, Validation, Writing–original draft, Writing–review and editing. DV: Validation, Writing–original draft, Funding acquisition, Writing–review and editing. CL: Validation, Writing–original draft, Supervision. MT: Validation, Writing–review and editing.
Funding
The author(s) declare that no financial support was received for the research, authorship, and/or publication of this article.
Acknowledgments
This study would not have been possible without the guidance of Engr. Roneh Glenn D. Libre, Jr, Pauline Rose J. Quiatchon, Ar. Maria Cynthia Y. Funk, Ar. Erika Dia, and Ar. Harry Serrano.
Conflict of interest
Author AR was employed by Infrastructure, Ove Arup and Partners Hong Kong Ltd. – Philippine Branch. Author CL was the owner of We Design Lab LLUID Builders INC. Author MT was the managing director of Fundamental Design Experts.
The remaining authors declare that the research was conducted in the absence of any commercial or financial relationships that could be construed as a potential conflict of interest.
Generative AI statement
The author(s) declare that no Generative AI was used in the creation of this manuscript.
Publisher’s note
All claims expressed in this article are solely those of the authors and do not necessarily represent those of their affiliated organizations, or those of the publisher, the editors and the reviewers. Any product that may be evaluated in this article, or claim that may be made by its manufacturer, is not guaranteed or endorsed by the publisher.
Supplementary material
The Supplementary Material for this article can be found online at: https://www.frontiersin.org/articles/10.3389/fbuil.2024.1517638/full#supplementary-material
References
Ahn, J., and Hayes, R. B. (2021). Environmental influences on the human microbiome and implications for noncommunicable disease. Annu. Rev. Public Health 42, 277–292. doi:10.1146/annurev-publhealth-012420-105020
Anastacio, J., Belino, M., Bosshard, H. F., and Dela Cruz, E. (2011). “A survey of indoor air quality studies in the Philippines,” in The 7th Conference on Retroviruses and Opportunistic Infections, Science and Technology Congress. doi:10.5281/ZENODO.1235921
Andualem, Z., Gizaw, Z., Bogale, L., and Dagne, H. (2019). Indoor bacterial load and its correlation to physical indoor air quality parameters in public primary schools. Multidiscip. Respir. Med. 14, 2. doi:10.1186/s40248-018-0167-y
ASHRAE (2022). Standards 62.1 and 62.2 – the standards for ventilation and indoor air quality. Available at: https://www.ashrae.org/technical-resources/bookstore/standards-62-1-62-2 (Accessed August 26, 2024).
Australian Government Department of Foreign Affairs and Trade (2022). List of developing countries as declared by the minister for Foreign Affairs. Available at: https://www.dfat.gov.au/sites/default/files/list-developing-countries.pdf (Accessed December 08, 2024).
Baczynska, K. A., Khazova, M., and O’Hagan, J. B. (2018). Sun exposure of indoor workers in the UK – survey on the time spent outdoors. Photochem. and Photobiological Sci. 18, 120–128. doi:10.1039/c8pp00425k
Bosch, T. C. G., Wigley, M., Colomina, B., Bohannan, B., Meggers, F., Amato, K. R., et al. (2024). The potential importance of the built-environment microbiome and its impact on human health. Proc. Natl. Acad. Sci. U. S. A. 121, e2313971121. doi:10.1073/pnas.2313971121
Brown, G. Z., Kline, J., Mhuireach, G., Northcutt, D., and Stenson, J. (2016). Making microbiology of the built environment relevant to design. Microbiome 4, 6. doi:10.1186/s40168-016-0152-7
Cao, G., Pedersen, C., Zhang, Y., Drangsholt, F., Radtke, A., Langyatn, H., et al. (2022). Can clothing systems and human activity in operating rooms with mixed flow ventilation systems help achieve the ultraclean air requirement (≤10 CFU/m3) during orthopaedic surgeries? J. Hosp. Infect. 120, 110–116. doi:10.1016/j.jhin.2021.11.005
Cardwell, C. R., Carson, D. J., Yarnell, J., Shields, M. D., and Patterson, C. C. (2008). Atopy, home environment and the risk of childhood-onset type 1 diabetes: a population-based case–control study. Pediatr. Diabetes 9 (Part I), 191–196. doi:10.1111/j.1399-5448.2007.00366.x
Chen, Y., Liang, Z., Li, G., and An, T. (2024). Indoor/outdoor airborne microbiome characteristics in residential areas across four seasons and its indoor purification. Environ. Int. 190, 108857. doi:10.1016/j.envint.2024.108857
Fahimipour, A. K., Hartmann, E. M., Siemens, A., Kline, J., Levin, D. A., Wilson, H., et al. (2018). Daylight exposure modulates bacterial communities associated with household dust. Microbiome 6, 175. doi:10.1186/s40168-018-0559-4
Flandroy, L., Poutahidis, T., Berg, G., Clarke, G., Dao, M.-C., Decaestecker, E., et al. (2018). The impact of human activities and lifestyles on the interlinked microbiota and health of humans and of ecosystems. Sci. Total Environ. 627, 1018–1038. doi:10.1016/j.scitotenv.2018.01.288
Foz, V. (2016). in National building code of the Philippines. 2018 edition (Quezon City: Philippine Law Gazette).
Franchitti, E., Caredda, C., Anedda, E., and Traversi, D. (2022). Urban aerobiome and effects on human health: a systematic review and missing evidence. Atmosphere 13 (7), 1148. doi:10.3390/atmos13071148
Fu, F. (2018). “Fundamentals of tall building design,” in Design and analysis of tall and complex structures (Elsevier), 5–80. doi:10.1016/B978-0-08-101018-1.00002-2
Gohli, J., Bøifot, K. O., Moen, L. V., Pastuszek, P., Skogan, G., Udekwu, K. I., et al. (2019). The subway microbiome: seasonal dynamics and direct comparison of air and surface bacterial communities. Microbiome 7, 160. doi:10.1186/s40168-019-0772-9
Hayleeyesus, S. F., and Manaye, A. M. (2014). Microbiological quality of indoor air in university libraries. Asian Pac. J. Trop. Biomed. 4, S312–S317. doi:10.12980/apjtb.4.2014c807
Hormigos-Jimenez, S., Padilla-Marcos, M. Á., Meiss, A., Gonzalez-Lezcano, R. A., and Feijó-Muñoz, J. (2019). Assessment of the ventilation efficiency in the breathing zone during sleep through computational fluid dynamics techniques. J. Build. Phys. 42 (4), 458–483. doi:10.1177/1744259118771314
Housing and Land Use Regulatory Board (2008). Revised implementing rules and Regulations for BP 220. Quezon City, Philippines: Housing and Urban Development Coordinating Council.
Hu, J., Ben Maamar, S., Glawe, A. J., Gottel, N., Gilbert, J. A., and Hartmann, E. M. (2019). Impacts of indoor surface finishes on bacterial viability. Indoor Air 29, 551–562. doi:10.1111/ina.12558
Kembel, S. W., Meadow, J. F., O’Connor, T. K., Mhuireach, G., Northcutt, D., Kline, J., et al. (2014). Architectural design drives the biogeography of indoor bacterial communities. PLoS ONE 9 (1), e87093. doi:10.1371/journal.pone.0087093
Klepeis, N. E., Nelson, W. C., Ott, W. R., Robinson, J. P., Tsang, A. M., Switzer, P., et al. (2001). The national human activity pattern survey (nhaps): a resource for assessing exposure to environmental pollutants. J. Expo. Sci. and Environ. Epidemiol. 11, 231–252. doi:10.1038/sj.jea.7500165
Laxamana, J. R. I., Reyes, D. M. K. T., Santos, R. L., and Paraoan, C. E. M. (2024). Temporal variation and phylogeny of air and surface microflora in relation to occupancy patterns in a higher education institution (HEI). Philipp. J. Sci. 153 (3). doi:10.56899/153.03.15
LePine, M. (2022). Pre-calculus chapter 9.9: fitting exponential models to data. St. Clair Coll. Available at: https://ecampusontario.pressbooks.pub/sccmathtechmath1/chapter/fitting-exponential-models-to-data/(Accessed August 26, 2024).
Liu, Y., Zhang, L., Wang, D., Shi, Y., Tong, L., Chen, F., et al. (2024). Characterization of microbial communities in urban subway: connotation for indoor environment quality and public health. Air Qual. Atmos. and Health 17, 1401–1413. doi:10.1007/s11869-024-01515-4
Matthews, K., Cavagnaro, T., Weinstein, P., and Stanhope, J. (2024). Health by design; optimising our urban environmental microbiomes for human health. Environ. Res. 257, 119226. doi:10.1016/j.envres.2024.119226
Meadow, J. F., Altrichter, A. E., Kembel, S. W., Kline, J., Mhuireach, G., Moriyama, M., et al. (2014). Indoor airborne bacterial communities are influenced by ventilation, occupancy, and outdoor air source. Indoor Air 24 (1), 41–48. doi:10.1111/ina.12047
Napoli, C., Marcotrigiano, V., and Montagna, M. T. (2012). Air sampling procedures to evaluate microbial contamination: a comparison between active and passive methods in operating theatres. BMC Public Health 12, 594. doi:10.1186/1471-2458-12-594
National Academies of Sciences, Engineering, and Medicine (2017). Microbiomes of the built environment: a research agenda for indoor microbiology, human health, and buildings. Washington, DC: The National Academies Press. doi:10.17226/23647
National Library of Medicine (2021). COVID-19: an ongoing public health crisis in the Philippines. Lancet Regional Health - West. Pac. 9, 100160. doi:10.1016/j.lanwpc.2021.100160
Neogen (2021). Technical specification sheet: yeast Extract Dextrose Chloramphenicol agar (NCM0187). Available at: https://www.neogen.com/4abc17/globalassets/pim/assets/original/10022/official_ncm0187_yeast-extract-dextrose-chloramphenicol-agar_technical-specifications.pdf (Accessed December 11, 2024).
Nice, J. A. (2020). “Microbiology of the Built Environment (MoBE) for architects, a review of applied spatial metrics for application in healthy building design,” in The 16th conference of the international society of indoor air quality and climate. Seoul, Korea: Indoor Air 2020 COEX. Available at: http://hdl.handle.net/10204/11822.
Niculita-Hirzel, H., Hirzel, A. H., and Wild, P. (2024). A GIS-based approach to assess the influence of the urban built environment on cardiac and respiratory outcomes in older adults. Build. Environ. 253, 111362. doi:10.1016/j.buildenv.2024.111362
Niculita-Hirzel, H., Wild, P., and Hirzel, A. H. (2022). Season, vegetation proximity and building age shape the indoor fungal communities’ composition at city-scale. J. Fungi 8, 1045. doi:10.3390/jof8101045
Núñez, A., and García, A. M. (2022). Effect of the passive natural ventilation on the bioaerosol in a small room. Build. Environ. 207, 108438. doi:10.1016/j.buildenv.2021.108438
Oberauner, L., Zachow, C., Lackner, S., Högenauer, C., Smolle, K.-H., and Berg, G. (2013). The ignored diversity: complex bacterial communities in intensive care units revealed by 16S pyrosequencing. Sci. Rep. 3, 1413. doi:10.1038/srep01413
Okada, H., Kuhn, C., Feillet, H., and Bach, J.-F. (2010). The ‘hygiene hypothesis’ for autoimmune and allergic diseases: an update. Clin. Exp. Immunol. 160, 1–9. doi:10.1111/j.1365-2249.2010.04139.x
Osunmakinde, C. O., Selvarajan, R., Ogola, H. J. O., Sibanda, T., and Msagati, T. (2020). “Microbiological air quality in different indoor and outdoor settings in africa and beyond: challenges and prospects,” in Current microbiological research in africa. Editors A. Abia, and G. Lanza (Cham: Springer). doi:10.1007/978-3-030-35296-7_5
Pasquarella, C., Pitzurra, O., and Savino, A. (2000). The index of microbial air contamination. J. Hosp. Infect. 46, 241–256. doi:10.1053/jhin.2000.0820
Penn State University (2024). Building codes and standards – architectural engineering. Available at: https://guides.libraries.psu.edu/c.php?g=388626&p=3484426 (Accessed August 26, 2024).
Philippine Atmospheric, Geophysical and Astronomical Services Administration (2024). Climate of the Philippines. Available at: https://www.pagasa.dost.gov.ph/information/climate-philippines (Accessed October 13, 2024).
Philippine Daily Inquirer (2021). From P10,000 to P6,000 a month: how PH poor are sinking deeper. Available at: https://newsinfo.inquirer.net/1482706/from-p10000-to-p6000-a-month-how-ph-poor-are-sinking-deeper (Accessed December 08, 2024).
Philippine Daily Inquirer (2023a). Rethinking the government’s socialized housing program. Available at: https://opinion.inquirer.net/167730/rethinking-the-governments-socialized-housing-program (Accessed August 26, 2024).
Philippine Daily Inquirer. (2023b). Socialized housing must be affordable. Available at: https://opinion.inquirer.net/167503/socialized-housing-must-be-affordable (Accessed August 26, 2024).
Philippine Statistics Authority (2022). Household population, number of households, and average household size of the Philippines (2020 census of population and housing). Available at: https://psa.gov.ph/content/household-population-number-households-and-average-household-size-philippines-2020-census (Accessed August 26, 2024).
Philippine Statistics Authority (2024). Average annual family income in 2023 is estimated at PhP 353.23 thousand. Available at: https://psa.gov.ph/content/average-annual-family-income-2023-estimated-php-35323-thousand (Accessed December 08, 2024).
Ponsonby, A. L., van der Mei, I., Dwyer, T., Blizzard, L., Taylor, B., Kemp, A., et al. (2005). Exposure to infant siblings during early life and risk of multiple sclerosis. JAMA 293 (4), 463–469. doi:10.1001/jama.293.4.463
Qiu, Y., Zhou, Y., Chang, Y., Liang, X., Zhang, H., Lin, X., et al. (2022). The effects of ventilation, humidity, and temperature on bacterial growth and bacterial genera distribution. Int. J. Environ. Res. Public Health 19, 15345. doi:10.3390/ijerph192215345
Rice, E. W., and Bridgewater, L. (2012) “Standard methods for the examination of water and wastewater,”, 10. Washington, DC: American public health association.
Rohim, R. A. A., Ahmad, W. M. A. W., Ismail, N. H., Ghazali, F. M. M., and Alam, M. K. (2020). Modeling the growth of bacteria Streptococcus sobrinus using exponential regression. Pesqui. Bras. em Odontopediatria Clínica Integr. 20, e5380. doi:10.1590/pboci.2020.108
Stephens, B. (2016). What have we learned about the microbiomes of indoor environments? mSystems 1 (4), e000833-16. doi:10.1128/msystems.00083-16
Strachan, D. P. (1989). Hay fever, hygiene, and household size. Br. Med. J. 299, 1259–1260. doi:10.1136/bmj.299.6710.1259
Thomas, S., Izard, J., Walsh, E., Batich, K., Chongsathidkiet, P., Clarke, G., et al. (2017). The host microbiome regulates and maintains human health: a primer and perspective for non-microbiologists. Cancer Res. 77, 1783–1812. doi:10.1158/0008-5472.CAN-16-2929
Thos, C., Scott, H. J., and Anderson, A. M. (1887). The carbonic acid, organic matter, and micro-organisms air, more especially of dwellings and schools. Philosophical Trans. R. Soc. Biol. Sci. 178, 61–111. doi:10.1098/rstb.1887.0004
United Nations Department of Economic and Social Affairs. (2014). World economic situation and prospects 2015. 137–144. doi:10.18356/acdcc19b-en
United States Agency International Development (2012). List of developing countries. Available at: https://www.usaid.gov/sites/default/files/2022-05/310maa.pdf (Accessed December 08, 2024).
Vandegrift, R., Bateman, A. C., Siemens, K. N., Nguyen, M., Wilson, H. E., Green, J. L., et al. (2017). Cleanliness in context: reconciling hygiene with a modern microbial perspective. Microbiome 5, 76. doi:10.1186/s40168-017-0294-2
Viani, I., Colucci, M. E., Pergreffi, M., Rossi, D., Veronesi, L., Bizzarro, A., et al. (2020). Passive air sampling: the use of the index of microbial air contamination. Acta Biomed. 91, 92–105. doi:10.23750/abm.v91i3-S.9434
Vonci, N., De Marco, M. F., Grasso, A., Spataro, G., Cevenini, G., and Messina, G. (2019). Association between air changes and airborne microbial contamination in operating rooms. J. Infect. Public Health 12 (6), 827–830. doi:10.1016/j.jiph.2019.05.010
World Health Organization (2016). Tackling environmental health challenges in the Philippines. Available at: https://www.who.int/philippines/news/feature-stories/detail/tackling-environmental-health-challenges-in-the-philippines (Accessed August 26, 2024).
Yong, L. X., and Calautit, J. K. (2023). A comprehensive review on the integration of antimicrobial technologies onto various surfaces of the built environment. Sustain. Switz. 15, 3394. doi:10.3390/su15043394
Keywords: architecture, engineering, built environment, bioinformed design, microbiomes, microbiology, ventilation, human activity
Citation: Villoria MBD, Argayosa VB, Rosalinas AD, Valerio DNR, La Madrid CL and Ticzon MXN (2025) Integrating building code to microbial count studies in urban built spaces with ventilation and human presence: a model. Front. Built Environ. 10:1517638. doi: 10.3389/fbuil.2024.1517638
Received: 26 October 2024; Accepted: 20 December 2024;
Published: 21 January 2025.
Edited by:
Valentina Zaffaroni Caorsi, University of Milan Bicocca, ItalyReviewed by:
Roberto Alonso González-Lezcano, CEU San Pablo University, SpainAndrea Potenza, University of Milano-Bicocca, Italy
Copyright © 2025 Villoria, Argayosa, Rosalinas, Valerio, La Madrid and Ticzon. This is an open-access article distributed under the terms of the Creative Commons Attribution License (CC BY). The use, distribution or reproduction in other forums is permitted, provided the original author(s) and the copyright owner(s) are credited and that the original publication in this journal is cited, in accordance with accepted academic practice. No use, distribution or reproduction is permitted which does not comply with these terms.
*Correspondence: Ma. Beatrice D. Villoria, dmlsbG9yaWFtYWJlYXRyaWNlQGdtYWlsLmNvbQ==; Vina B. Argayosa, dmJhcmdheW9zYUB1cC5lZHUucGg=; Daniel Nichol R. Valerio, ZGFuaWVsLnZhbGVyaW9AZGxzdS5lZHUucGg=; Angelo D. Rosalinas, YW5nZWxvLnJvc2FsaW5hc0BnbWFpbC5jb20=
 Ma. Beatrice D. Villoria
 Vina B. Argayosa
 Angelo D. Rosalinas
 Daniel Nichol R. Valerio4*